Embed Size (px)
Citation preview

Oxford Economic Narrative 2017
1
Contents
1. Introduction and Context: Page 2 1.1 Purpose 1.2 aims and objectives 1.3 Global & national context 1.4 Potential Brexit Implications. 2. High Level Summary: Page 4
3. Oxford’s economy: Page 6 3.1 Introduction to Oxford’s Economy 3.2 Employment in Oxford 3.3 Business in Oxford 3.4 Key Employers and Sectors 3.5 Oxford’s economic performance 4. Oxford’s Workforce: Page 23 4.1 labour supply 4.2 Earnings by residents & workers 4.3 qualifications 4.4 Unemployment 4.5 Educational attainment 4.6 Travel to work profile 5. Living in Oxford: Page 31 5.1 Housing stock 5.2 Housing tenure mix, 5.3 House prices and affordability 5.4 Housing land supply 5.5 Deprivation 5.5 Crime 5.6 Environment 6. Employment land and commercial property: Page 35 6.1 Employment land assessment 6.2 Property market assessment 6.3 Incubation, innovation, start-up and grow on space reviews - TBA 7. Oxford’s Economic Future: Page 38
7.1 Population and Economic growth Forecasts 7.2 Investment in Regeneration and Infrastructure 7.3 Innovation Eco-system and Smart Oxford 7.4 Policy context Appendix 1: Oxford’s Major Employers: Page 50

Oxford Economic Narrative 2017
2
1. Introduction
1.1 Purpose
The Oxford Strategic Partnership's (OSP) Economic Growth Steering Group has updated and re-
purposed the Oxford Economic Narrative.
The aim of this document is provide a complete narrative on the role, performance and direction of
Oxford’s economy. The Oxford Economic Narrative provides an evidence base to inform and
update the Oxford Economic Growth Strategy and inform the policy direction for employment and
economy related policies from the emerging Oxford Local Plan 2036.
Updated regularly, it should also be seen as a starting point for partners and colleagues seeking any
economic data and commentary required to inform inward investment proposals, business cases,
research and presentations undertaken by OSP partners.
1.2 Aims and objectives of the Oxford Economic Narrative
o to provide a narrative on the role, performance and direction of Oxford’s economy. A set of
comparator locations will be utilised to benchmark Oxford over time.
o to articulate Oxford’s role and impact within the Oxfordshire Knowledge Spine, and national
economy, including future opportunities for growth
o as a ‘live’ document it will be updated as an when new data and information is published,
with a full review annually
o to provide a readily available source of evidence to inform a range of strategies and policies
including the Oxford Economic Growth Strategy.
1.3 Global and national context
The UK, as with other developed economies is well into a period of recovery from the 2008 ‘Great
Recession’. Whilst this recovery was initially slow, the UK growth rate has increased in recent years
and was 2.2% per annum in 20161, faster than most comparable developed economies. The UK
employment rate has also risen to 74.6%, the highest rate since 19712. Yet the economy has not re-
balanced towards production and export as far as policy makers have hoped and retains a reliance
on consumer spending. Productivity as measured in output per hour, or per worker is also below
France, Germany and the US3 and this is seen as a major area for improvement. It has also become
more apparent that slow wage growth, regional inequality, pay inequality and fears over job
security have created a negative experience of economic growth among much of the population, a
sense that growth in GDP overall not benefitting society as it might. This was occurring in the lead
up to recession but has persisted since.
1 Office of National Statistics 2017
2 Office of National Statistics 2017
3 OECD dataset: Level of GDP per capita and Productivity 2017

Oxford Economic Narrative 2017
3
There are several reasons to believe that economic cycle may now be entering a new phase of
weaker growth and uncertainty, precipitated political events in the UK and overseas. A recent
report by the World Trade Bank4 showed that global trade growth continued to slow for the fifth
consecutive year, with 2016 the weakest trade performance since the recent global crisis. It
highlighted ‘political uncertainty’ as a key factor in slowing down trade growth. In the UK the
outcome of the EU referendum is a clear area of uncertainty that could impact on future growth
potential. According to the OECD the Brexit referendum vote has reduced growth prospects and
increased volatility, as reflected most obviously by significant currency depreciation. Monetary
policy played a role in mitigating the immediate impact of the shock by stabilising financial markets.
Consumer confidence has also remained surprisingly strong despite expectations to the contrary.
Yet, the UK economy is facing more uncertainty than any period since the recession. Business
investment and foreign investment are likely to be affected long-term. Bank of England target rate
inflation of 2% has been breached and this is starting to affect households and businesses,
weakening private consumption and business appetite for investment. If growth slows as many
forecasters predict the unemployment rate is projected to rise, after falling for almost a decade5.
There are signs that both recent economic and social trends have significantly altered the
Government’s policy stance to the economy with a focus on;
- Slower deficit reduction and some increase in public investment
- A more interventionist approach to the economy through a place based Industrial Strategy6
- A focus on increasing productivity
- New efforts to reduce regional growth disparities that have widened in most cases
- A focus on ‘inclusive growth’ more closely aligning economic and social policy
- Linked to above, there is a recognition that technology and globalisation has in part driven
inequalities and played a role in hollowing out labour markets, as low and high skilled jobs
become more prevalent
- A need to manage the continued effects of an aging population.
1.4 Potential Brexit Implications for Oxford
BREXIT brings new and specific risks to a range of employers, and the city’s key sectors, whilst also
presenting some limited opportunities. Depending on the outcome of negotiations with the EU, the
consequences could be damaging to growth and productivity, science and technology, and public
services. This is something the OSP Economic Growth Steering Group partners are monitoring
closely as the post Brexit landscape and its impacts become clearer. Key impacts being monitored
include
4 Trade Developments in 2016 Policy Uncertainty Weighs on World Trade (World Trade Bank: Feb 2017)
5 http://www.oecd.org/eco/outlook/economic-forecast-summary-united-kingdom-oecd-economic-outlook-
november-2016.pdf 6 Building our Industrial Strategy Green Paper, January 2017.

Oxford Economic Narrative 2017
4
Local labour market impacts. 13.1% of Oxford residents who are in employment hold a non
UK European passport7. In a tight labour market, there are concerns over our ability to
attract the required labour and expertise in future
Trade and export conditions for business - 62% of Oxford’s total overseas exports are
vehicle manufacturing related so there is a need to secure growth and investment in the
sector post Brexit8.
Access to funding and collaboration for science and technology, in 2014-15, 12% of the
University of Oxford’s research funding came from Europe, providing an income of £67m.
Ability to attract EU and international workers, students and researchers. 17% of University
of Oxford staff and 15% of its students come from the EU9. The NHS has a similar reliance on
EU workers for nursing, midwifery and specialist clinicians.
Impact on the domestic and international visitor economy related to exchange rates,
international labour availability, and the UK’s perceived openness.
Sector based impacts relating to trading rules and regulatory issues impacting on supply
chains and market access (education, research, health, bio-tech, vehicle manufacturing).
In this uncertain environment, partners are also working to ensure the new Industrial Strategy
contains a focus on Oxford’s technology strengths and vital sectors such as vehicle manufacturing in
future, and that ensuring adequate labour supply continues to be a focus to enable growth.
2. High Level Summary
2.1 Projected Growth in Oxford
Oxford’s population will increase significantly to 180,000 by 2031, the demand for housing will
rise to a requirement of 24,000-32,000 by 2031 and that the number of jobs will increase by
24,000. Longer-term population forecasts for the city suggest this will rise to 181,211 in 2035
and then 191,931 in 2040.
2.2 Oxford’s Economy:
Compared to similar cities, Oxford has the highest proportion of people employed within the
public services sector with education and health being the most significant sectors. These
sectors together with the financial sector amount to two-thirds of the workforce operating
within the ‘knowledge intensive activities.’
Oxford has one of the highest concentrations of jobs per worker compared to similar cities, the
county and the region.
Employment within the knowledge intensive activities is high (67%) with the city ranked second
of all UK cities. Yet, this is influenced significantly by the public sector, specifically the
Universities and NHS. Innovation in HE research and health is also driving private sector
7 ONS, Economic Activity by passport held, November 2016
8 Centre for Cities, Cities Outlook, January 2017
9 University of Oxford 2016

Oxford Economic Narrative 2017
5
investment and growth, notably through an accelerated rate of technology spin-outs and
investment attracted to our public sector science assets. Oxford is at the centre of one of the
top technology clusters in the world
Oxford has a diverse and resilient economy, despite its high proportion of health and education
workers. ICT, construction, professional, scientific and technical services also have above
average location quotients (ratio of workers to national average). If you strip education and
health to national averages, creative industries, retail and hospitality also feature prominently.
Oxford’s economy has a low percentage of manufacturing companies and employees but
slightly more workers than Reading and Cambridge as comparators, notably due to BMW Mini.
Swindon has the highest percentage of manufacturing, followed by Norwich and Milton Keynes.
Oxford has almost twice as many medium and large sized firms as in the County and the South-
East but a lower proportion of micro businesses (1-9 employers).
Oxford’s unique sector composition and business base is partly defined by its major employers.
The 100 largest employers in the Oxford urban area account for approximately 66,600 jobs,
equivalent to 60.1% of total employment.
2.3 Oxford’s Economic Performance
Oxford total GVA is £6.8Bn annually and generates £1.15bn in income tax, £226m more than 10
years earlier. Oxford is the seventh highest of all English cities and is at a very similar overall
level to Swindon and higher than Cambridge and Norwich. This shows the importance of Oxford
as the ‘engine for growth’ for the local economy.
Notwithstanding the relatively low proportion of private sector jobs in Oxford the city has
however shown the highest percentage of job growth within the private sector from 2009-2015
(outside London).
Oxford is the service centre for the wider economy, it has the fastest growing, best educated
workforce, and it is the main centre of research and spin-outs in the County.
2.4 Workforce and Skills:
Oxford has a high job density highlighting the demand for labour and Oxford’s position as a vital
regional employment hub with a high level of in-commuting.
Whilst Oxford has ‘out of work benefit’ claimant levels similar to the South-East this does mask
the areas of deprivation within the city which include some of the most deprived
neighbourhoods in the country.
The average weekly earnings for Oxford’s workforce are slightly higher than that for the South
East. Average earnings within the city have increased in recent years, last year aside, are at a
similar level as Cambridge and above Milton Keynes.
Oxford has a high proportion of the population that is qualified to a high level comparable to
Cambridge (placed 2 and 1 respectively). Yet, this does contrast with the areas of the city where
people have no qualifications and the below average performance of Oxford’s state schools.

Oxford Economic Narrative 2017
6
Over ten years between 2001 and 2011 there has been a large increase in the number of
inbound commuters travelling from outside the district to work in Oxford by car for most of the
journey. Within the city commutes made mainly by bicycle, on foot or by bus have all
increased. More people commuting from Oxford to other destinations are travelling by train or
bus than in 2001.
Oxford has the highest proportion of people commuting to work by public transport followed by
Reading. Cambridge, Milton Keynes and Swindon all have a significantly lower proportion of
people using the bus, train or metro; whilst Norwich has the lowest of all the comparable cities.
Oxford has a high proportion of the resident population in professional and technical jobs.
Generally, there is dominance in Oxford of the service sector as compared to the industrial
occupations, although the employment figures do not explain the importance of key industrial
uses such as BMW, which have a strong local, regional supply chain impact, and contributes
62% to of the city’s exports10.
3. Oxford’s economy
3.1. Introduction to Oxford’s economy
Oxford’s economy is a national asset and unique in its composition. Because of this, it was largely
sheltered from contraction during the past recession and is recognised as one of the fastest
growing local economies in the UK. Oxford has a diverse sector mix, and as a focal point for higher
education, research and science, is at the centre of one of the top five technology clusters in the
world. As a globally known brand, Oxford has major assets which include two leading universities,
and cutting edge research in areas including bio-tech, data science, quantum technology and
robotics. The city is home to diverse international enterprises including BMW Mini, Oxford
University Press, Sharp, Natural Motion, Unipart and Centrica among numerous others. Oxford’s
economy is broad-based and structurally resilient and provides one third of the county’s jobs.
Oxford contributes £6.8bn to the national economy annually and generates £1.15bn in income tax,
£226m more than 10 years earlier11. Our private sector job growth of 17.8% over the last five years
is the fastest outside London, 6th fastest growth overall at 5.9%12. Oxford’s GVA per worker is the
7th highest of all UK cities and unemployment is at less than 1%. Yet, this does not mean we can be
complacent given the range of uncertainties faced nationally and globally.
Oxford faces many growth related challenges, not least ensuring growth in supply of labour,
housing and infrastructure continues to keep pace with demand over the long-term whilst retaining
its unique heritage and high quality environment.
10
Centre for Cities, City Outlook, 2017 11
Centre for Cities, 2016 12
Centre for Cities, Fast Growth Cities Report, March 2016

Oxford Economic Narrative 2017
7
3.2 Employment in Oxford
Key message: Despite some of the fastest private sector growth in the UK recent years;
employment in Oxford is still dominated by the public sector, with education and health being the
most significant contributors. These sectors together with the financial and business services sector
amount to two-thirds of the workers classified ‘knowledge intensive’, the second highest in the UK.
In 2015, total employment in Oxford was 121,90013 of which 68% were full-time positions and 32%
part-time reflecting very similar proportions for the south-east and England as a whole.
Employment in Oxford is dominated by the public sector and in particular the education and health
56,000 (47%), which is significantly higher than Oxfordshire as a whole (30%) and the South-East
(23%) and nationally (22%). The proportion of jobs in the financial and other business services
sector (14.5%) does appear low by comparison to other areas benchmarked; when it is added to
those in the public sector it does amount to some 62% almost two-thirds of total workforce in
Oxford, reflecting the importance of the ‘knowledge sector.’ Oxford ranks as 2nd on this measure, as
compared to the 54 other cities in England, for the percentage (67%) of people working in
‘knowledge intensive activities’.
Figure 1 below also highlights the significant overall job growth that has taken place in Oxford,
particularly over the last five years. From 2009-14 this growth was the 6th fastest of all UK cities.
There was notably a small increase in the last year however, something that will be monitored.
Figure 1, Job growth in Oxford, ONS Job Density (total jobs), 2000-2016
13
ONS business register and employment survey 2015

Oxford Economic Narrative 2017
8
Oxford has a high proportion of the resident population in managerial / professional jobs (figure XX
below). The Annual Population Survey shows that some 64.1% of the resident population in Oxford
is employed in professional and technical occupations, which is higher than Oxfordshire (53.9%),
and significantly higher than the South East (49.5%) and England (45%).
Whereas, the figures for the number of the resident population employed in industrial occupations,
including skilled trades, machine operatives and elementary occupations are 18% in Oxford. By
comparison the figures are higher for Oxfordshire (22.6%), the south-east (23.6%) and England
(27.5%). To a degree this shows the dominance in Oxford of the service sector as compared to the
industrial occupations, although these figures do not appear to reflect the importance of key
industrial uses such as BMW.
Figure 2: Occupational structure of Oxford’s residents (Oct 2015 Sept 2016), ONS (2015) Annual Population
Survey 2015 3 areas where sample size too small for reliable estimate.
Figures 3 and 4 highlight both the percentage and number of employees by sector. The higher
proportion of construction jobs 6,100 (5.0%) reflects the established firms and amount of new
development taking place within the city. Although the proportion of manufacturing jobs - 3.8%
(4,100) is relatively low by comparison to other areas this is largely accounted for by the presence
of BMW (Plant Oxford), which produces the Mini. One of the strengths in the Oxford economy is its
world-class excellence in research, education and health but this wider diversity brings added
resilience to the local economy, further complemented for example by the retail and tourist
sectors. The redevelopment at the Westgate Shopping Centre will alone create 3,400 new jobs
whilst Oxford is an international tourist destination.

Oxford Economic Narrative 2017
9
Figure 3 Oxford Sectors of Employment, ONS BRES, 2015 (released 2016)
Figure 4, Comparing Oxford’s sector mix regionally and nationally; ONS BRES 2015 (released 2016)
Key message: Oxford’s economy has a low percentage of manufacturing employees in common
with other fast growing cities, reading and Cambridge (figure 5).

Oxford Economic Narrative 2017
10
Figure 5, Centre for Cities Data Tool, taken from BRES data, 2016
Key message: In 2014/5 Oxford has the highest proportion of people employed within the public
sector with 49%. Cambridge has significantly less at 41%. Norwich, Reading and Milton Keynes and
Swindon have a much lower proportion with 26%, 23%, 22% and 18% respectively (figure 6).
Figure 6: Centre for Cities Data Tool, taken from BRES data, 2016
0
2
4
6
8
10
12
14
2010 2011 2012 2013 2014
Pe
rce
nta
ge
Year
City comparison percentage of manufacturing
Cambridge
Milton Keynes
Norwich
Oxford
Reading
Swindon
0
5
10
15
20
25
30
2010 2011 2012 2013 2014
Pe
rce
nta
ge
Year
Percentage of Private KIBS
Cambridge
Milton Keynes
Norwich
Oxford
Reading
Swindon

Oxford Economic Narrative 2017
11
Oxford has surprisingly the lowest percentage of private knowledge intensive businesses services at
only 9%, less than Cambridge (12%), and Norwich and Swindon who both have 14%. Reading has
the highest with 22% followed closely by Milton Keynes (20%). This highlights that much of the
knowledge based employment is in the public sector, notably education and health.
3.3 Businesses in Oxford
Oxford is home to 5,265 active enterprises14, a similar number to the cities of Cambridge and
Norwich. The size of businesses already operating within an area provides a useful assessment of
the structure of the local economy and also suggests something about the type and size of premises
that these businesses occupy. In Oxford there are some 4,750 VAT registered business15 of which
the largest proportion micro businesses employ nine or less employees (85%), which is slightly
lower than Oxfordshire (89%) and the South-East (90%). See Figure 7.
The proportion of small businesses (11.7%) is slightly higher than Oxfordshire and the South-East.
The proportion of medium sized businesses (3.1%) and larger businesses (0.9%) are however almost
double the proportion in both Oxfordshire and the South-East, which highlights the importance of
Oxford as a location and a centre of employment. Its relatively low business density contrasts to its
high job density.
In considering the numbers of VAT paying enterprises per 10,000 people of working age (figure 8), it
can be seen clearly that Oxford has a lower overall density of businesses than these areas. Looking
at percentages of business by refined employee band numbers compared against the same areas
(figure 9), it is interesting to note that Oxford also has above average numbers of companies in size
band 5-9, 10-19, and 20 or more employees than the Oxfordshire and England averages, but
significantly less 0-4 employee enterprises. In short, Oxford relies on above greater proportions of
relatively well established SMEs and larger employers, and less on the smallest firms. Section 3.4 on
Key Employers and Sectors adds some further insight on the reasons for this.
Key message: Oxford has almost twice the proportion of medium and large sized firms compared with
Oxfordshire and the South-East.
14
ONS Business Demography 2015, published 23rd
November 2016 15
ONS (2016); UK Business Activity, Size and Location 2016

Oxford Economic Narrative 2017
12
Figure 7, Source: ONS UK Business Activity, Size and Location 2016.
Figure 8: Percentage change in number of businesses (VAT based local units) per 10,000 working age population Source: Office for National Statistics

Oxford Economic Narrative 2017
13
Figure 9: Businesses (VAT based local units) by employment size band Source: Office for National Statistics
Figure 10 shows the change in stock of businesses per 10,000 people by city from 2010-15. Backing
county and England comparisons, Oxford’s low stock of businesses is evident. The stock in Milton
Keynes and Reading is around 50% higher.
Figure 10, Centre for Cities Data Tool, data from BRES 2010-2016.

Oxford Economic Narrative 2017
14
3.4 Key employers and sectors
Key Message: The largest 40 employers across Oxford are estimated to provide over 60,000 jobs in
the city, around half the employee jobs within the city of Oxford. This demonstrates the significant
influence of larger employers and contribution to the health of the local economy.
Taking this point further, it means that around 70,000 additional jobs are provided by just over
5,000 active enterprises in the Oxford area.
The list of employers is detailed in Appendix 1 for information.
Oxford’s Sector Mix
Figure 11 highlights the location quotients of sectors in Oxford, anything above 1, has above
national average employee numbers in the sector locally. The dominance of education at over 3
times the national average is striking as is ICT and health employment. Construction and
professional, scientific and technical services also feature at national average or above. Tourism
and hospitality related sectors also feature well as do creative related sectors.
Figure 11 Location Quotients by SIC Sector, Oxford City Council using, BRES, ONS 2016
Sub-sectors data available - yet to be analysed
Higher Education: In 2014, around 43,600 students (graduate and postgraduate) attended the city’s two
Universities. Higher education in Oxford accounts for approximately 21,800 jobs, or 19.6% of total
employment. The University of Oxford is world renowned and ranked first in the Times Higher Education
latest global league table. Oxford Brookes University is regularly ranked as the best new university in the
country, and has earned recognition for the quality of a number of its teaching areas, including: architecture,
publishing real estate and hotel management, automotive engineering and computer science. With the

Oxford Economic Narrative 2017
15
unique importance of higher education made clear in Oxford, the impact on the University of Oxford is
considered in more detail the next question on major companies/employers.
Bio-tech: Oxford is a major centre for teaching hospitals and home to a cluster of acute and specialist
medical organisations which together employ around 14,000 people, or 13% of the total workforce,
supporting 2,700 jobs. These assets align closely with healthcare research undertaken at the universities.
The health sector is a catalyst for the region’s biotechnology sector. Research by Bidwells and Letscellit in
2015 identified 233 bio-tech companies, considerably more than the 163 identified by Oxford Bio-technology
network in 2011. Since December 2014 ten firms have identified over £1Bn in investment. Oxford has
numerous strengths in subsectors including drug discovery and development, diagnostics, medical
technology and imaging. There are an estimated 7,500 jobs in biotechnology sub-sectors in Oxfordshire. Key
companies locally include Oxford Nanopore, Oxford Biomedica, Immunocore, Genzyme, and Sharpe Europe.
Vehicle manufacturing: Oxford sits within of a £9bn automotive cluster, dubbed ‘Motorsport Valley’ and
covering Oxfordshire and the Midlands16. BMW Mini is a major industrial employer and Plant Oxford
accounts for nearly half of citywide industrial space. According to BMW, 80% of Minis are exported, playing
an important role in the UK’s balance of trade.
Since production of new MINI started in 2001, nearly 3 million cars have been made at Plant Oxford. The
plant's heritage spans 100 years of automotive manufacturing history, and the Cowley site has become a
landmark in the city. BMW, have invested over £1.5 billion in the car plant in Oxford over the past ten years.
BMW Mini is a major part of the UK vehicle manufacturing success story that has seen a turnaround in the
fortunes of UK Vehicles production and exporting. Three plants across the UK have a part to play in MINI
production - Plant Swindon where body panels and some assemblies are made, Plant Hams Hall which
produces petrol engines and Plant Oxford, the heart of MINI, where all the parts are brought together and
where the finished car rolls off the production line. There are 4,500 associates currently employed at Plant
Oxford. Plant Swindon and Hams Hall together employ around 1,600 people. Between 2012 and 2015 BMW
Group invested a further £750 million in its Oxford, Swindon and Hams Hall plants taking investment in UK
production to £1.75 billion since 2000. There are approximately 4,000 different parts supplied to Plant
Oxford for the production of the MINI.
Three Formula 1 teams are also based within the county. This cutting edge expertise is supported by 4,000
high performance engineering companies in the wider area, providing a range of specialist offerings that
enable those engaged in motorsport to compete effectively on the world stage.
The University of Oxford and Oxford Brookes University provide around 2,000 1st and Higher Degree
qualifiers in science and technology based subjects. Oxford Brookes University delivers a range of degrees in
automotive and motorsport technologies in a £9 million purpose-built Engineering Centre.
Digital and creative (including publishing): There are an estimated 21,000 people employed in digital related
sectors in Oxfordshire17. The larger companies in this sector include Sharp Laboratories of Europe, Oxford
Instruments, Sophos and Nominet. There are around 3,000 creative and digital sector businesses in
Oxfordshire generating some £1.4bn annually. Notable sub-sectors include cyber security, big data/high
16
http://www.the-mia.com/The-Industry/The-Industry 17
Digital Oxford 2015

Oxford Economic Narrative 2017
16
performance computing, digital publishing and the digital gaming industry. Of Oxford’s top 100 employers
alone, there are 5 publishers and 3 media and or communications businesses.
Amongst the leading gaming companies in Oxford are Natural Motion and Rebellion. Natural Motion was
founded as a spin-out from the University of Oxford receiving support from Isis Innovation. The company has
recently been acquired by social network gaming company Zynga for $527m and now employs 300 people,
of which 150 are based in Oxford. Rebellion is one of Europe’s largest independent game developers.
Oxford is the largest centre of publishing in the UK outside of London. The city houses more than 100
publishing businesses providing over 3,500 jobs. There are a number of other significant firms working in
both academic and mainstream publishing in a variety of sectors. Oxford University Press (employs 6,000
employees worldwide of which 1,800 are based in Oxford), the university’s official printer, is a global leader
in academic and research publishing. Other significant firms include Pearson Education, Wiley, Blackwell
Macmillan, Elsevier, Osprey Hart, Lion Hudson and the regional headquarters for Newsquest.
Reflecting the importance of this sector, Oxford Brookes University has developed a focus on publishing,
housing the Oxford International Centre for Publishing Studies and has research expertise in digital gaming
and testing of computer systems.
Tourism Sector:
Oxford is famed for its university heritage, and has numerous other attractions (many of which are linked to
the university), including the Ashmolean Museum, Pitt Rivers Museum, University Museum of Natural
History, University Botanic Gardens, Sheldonian Theatre, and Holywell Music Rooms. Oxford is the seventh
most visited city in the UK by international visitors and tourism gateway to the rest of Oxfordshire.
It is estimated that Oxford welcomed 6.6million domestic and overseas visitors in 2015, who contributed
£800m of value to the local economy (indirect and induced multipliers). Tourism spending supported 11.3%
of the workforce, with over 13,800 tourism related jobs (10,200 FTE), an increase in job numbers from the
previous year18.
The growth in visitors is expected to take a step change in the coming year as the £500m Westgate Centre,
opens in October 2017 offering 100 new retailers, creating 3,400 jobs. It is expected to broaden Oxford’s
appeal to visitors.
Oxford is also gateway to a wider county offering including attractions such as Henley‐on‐Thames – home to
the Henley Festival, the UNESCO World Heritage listed Blenheim Palace, and Bicester Village. Experience
Oxfordshire – the visitor promotion and destination management organisation for the city and county
provides additional insight and services for the Visitor Economy Sector
Professional and business Services sector: In a city with such a diverse business base, it can be overlooked
that Oxford has significant potential as a professional and business service headquarters location; located
centrally to the UK market, close to national road connections, and benefitting from significant investment in
rail locally. Oxford Business Park includes a number of business service companies. Centrica (British Gas
Business) in Oxford is one practical example.
18
Economic Impact of Tourism Oxford 2015 – Destination Research

Oxford Economic Narrative 2017
17
The following activities employ over 10,200 people in the city
Consultancy
financial
insurance
real estate
legal
advertising
administrative and information services.
Moreover, these firms contribute more widely to the success of the local economy by providing competitive
and locally available skills and services to other businesses sectors. The major professional firms, such as
legal and accountancy, are positioned to provide a lower cost base than London practices as well as compete
for local business. Oxford is also home to large companies in specialist sectors including market research
firms SPA Future Thinking and A.C. Nielsen. Companies such as Oxford Economic and Oxford Policy
Management and OPP indicate the knowledge base in the area.
3.5 Oxford’s Economic Performance
Job density (2015)
Key message: Oxford has a high job density, increasing in recent years, which highlights the city’s growing
role as an important employment hub and its sustainable location for job and housing growth.
Figures 12 and 13 below show job density, which is a measure of the level of jobs per resident of working
age (aged 16-64). For example a job density of 1.0 would mean that there is one job for every resident aged
16-64. Oxford has a very high density19 level of 1.17 with more than one job for every resident of working
age, which shows the high concentration of jobs within the city as compared to Oxfordshire (0.96) as a
whole; and well above both the regional (0.86) and national level (0.83). This demonstrates the job creation
potential of the city which clearly shows the importance of Oxford as a centre for employment, and its role
in serving the wider area.
19
ONS jobs density 2015

Oxford Economic Narrative 2017
18
Figure 12 – Job Density against comparable cities, ONS 2016
Figure 13: Job density comparison, ONS Job Density 2015 (released 2016)

Oxford Economic Narrative 2017
19
Entrepreneurship and University Spin-outs
Key Message: Oxford has a lower number of start-ups per 10,000 population than comparator
cities (figure 14). This would partly explain the lower number of businesses with 0-4 employees.
Looking at the business closure measure per 10,000 across the same cities, Oxford has the lowest
number of closures. The year 1 survival rate for new businesses is Year 1 business start-up survival
in Oxford is 92.4%, roughly in in line with UK average.
Figure 14: City Centre data tool, data on start-ups from ONS Business Demography, 2016
Figure 15: City Centre data tool, data on closures from ONS Business Demography, 2016

Oxford Economic Narrative 2017
20
The Business Churn rate highlights the difference between business start-ups and business closures
as a percentage of the total number of businesses in the city (figure 16). Here it can be seen that
Oxford is level with Cambridge with a churn rate of 4.28. Generally, it can be seen that the number
of deaths correlates to the number of start-ups. There is more churn in Milton Keynes for example,
with both high start-ups and deaths rates.
Figure 16: City Centre data tool, data on churn from ONS Business Demography, 2016
Spin-outs
Where Oxford stands out from its competitors is the acceleration in creation of ‘high growth
potential’ spin-outs from academic researchers and student entrepreneurship. In 2016, Oxford
University Innovations was responsible for creating 24 companies with a combined £52.6m in early-
stage funding last year – setting a company generation record not just for the university or the UK,
but also Europe. Newly formed Oxford Science Innovations (OSI) provided £30m of the total
investment amount, underlining the university venturing fund’s importance to Oxford’s ecosystem.
Indeed, the money marks a quadrupling of investments for spinouts, up from £9.5m in 2015, when
OSI supplied £4.45m. They have a capital fund of £580m. Of those 24 new companies, 21 were
spinouts, a significant increase over 2015 when OUI generated 10 spinouts. The commercialisation
office, meanwhile, also boosted the number of licences sold to 115 and patents filed to 118. These
cover a range of fields from aeronautics to big data and virtual reality to regenerative medicine and
wireless energy transfer. OUI is expected to produce an even more diverse set in future by tapping
into departments including humanities and social sciences.
Productivity and Output
Key message: Oxford total GVA is £6.8Bn, the seventh highest per worker of all English cities. It is at
a very similar overall level to Swindon and higher than Cambridge and Norwich.

Oxford Economic Narrative 2017
21
Comparing against other high performing cities, Oxford has relatively high GVA per worker of
£60,161 7th of 62 UK all UK cities)20, albeit not reaching the levels of the most productive cities such
as Milton Keynes and Reading, 4th and 2nd in the UK respectively (note figure 17).
Figure 18 highlights the data for patent applications recorded in 2015. As one measure of
propensity to innovate within a local area, this does suggest Oxford is lagging behind its rival
Cambridge, whilst still being above the other comparable cities. Yet, the data only records
applications, not acceptance, or level of commercialisation.
Another source puts Oxfordshire at the top of a list of most innovative areas. The research showed
for example that 27% of respondents had engaged in product or service innovation in Oxfordshire
from 2010-2012, more than all other areas. Gloucestershire was second with 26%, Cambridge on
24% and London on 17%. Notably Oxfordshire was top on 4 of 5 innovation measures, also
including collaboration, process innovation, and R&D21.
Figure 17 GVA per worker Source: Centre for Cities Data Tool, ONS 2016
20
Centre for Cities, 2017. 21
Benchmarking Local Innovation, the Innovation Geography of the UK, ERC, 2015.

Oxford Economic Narrative 2017
22
Figure 18, Patent Applications by city 2015, Source: Centre for Cities Data Tool
Key message: What stands out in a city with such a high proportion of public sector workers is the
rapid increase in private sector employment over the last 6 years. In the last 6 years, Oxford’s
growth of 19.3% (figure 19) is the highest of any place outside London. This is a positive structural
trend and outstrips the comparator cities. It should be noted that private job growth in Oxford was
more negligible in the last year (an increase of 300 jobs) so any signs of this trend plateauing or
reversing should be monitored in future.
Figure 19, private sector job growth by city, BRES data and Centre for Cities Data Tool, 2010-2015

Oxford Economic Narrative 2017
23
Published Reports on Oxford’s Economic Performance
A number of reports are released that aim to monitor the economic performance of places. Some of the
highlights of this type of work as relates to Oxford are provided below:
PWC Good Growth League – Oxford has ranked first for two years running. This survey ranks the importance of growth measures to survey respondents to provide a weighting against actual data
Fast Growth Cities - The Fast Growth Cities group comprises of Cambridge, Oxford, Milton Keynes, Swindon and Norwich, some of the UK’s most successful cities. These cities perform strongly on a range of economic indicators, including productivity and share of knowledge-based jobs
Ten years of Tax – Oxford had the 4th highest tax increase from 2004-5 to 2014-15 of around 23%, only 15 of the 62 cities are producing more tax than their pre-recession peak.
Irwin Mitchell UK Power House, 2016 – Oxford placed in the top 3 for GVA Growth
Enterprise Research Centre – Oxfordshire top of all LEPs and other UK regions based on a survey of 5 innovation measures
Lambert Smith Hampton Vitality Index – Oxford was ranked 5th in the index based on based on the analysis of 20 datasets, with each location ranked within six separate categories: most productive, fastest growing, most entrepreneurial, best educated, greenest and rising affluence. Oxford’s relative position has declined in this index from 3rd a year earlier.
Oxford fares well in these surveys in terms of growth, although those such as LSH and Centre for Cities on
growth do caution that Oxford’s relative position could decline without significant investment in key supply
factors such as commercial property, housing, infrastructure and skills to enable continued growth at levels
achieved previously.
4. Oxford’s Workforce
4.1 Labour supply
In Oxford the number of residents economically active is 96,10022, which expressed as a proportion
of the total number of residents of working age is 81.7%, which is slightly lower than Oxfordshire
(83.2%) the South-East (80.6%) and England (77.8%). The proportion of people self-employed is less
than Oxfordshire and does largely reflect the number of medium and large firms based in Oxford
(see figure 20).
22
ONS Annual Population Survey 2015 - 2016

Oxford Economic Narrative 2017
24
Figure 20, Employment comparisons, ONS Annual Population Survey 2015 (Sep 15 to Oct 16)
4.2 Earnings by residents and workers
Key message: The average weekly earnings for Oxford’s workforce are similar to that of the South
East and higher than the national level.
In 2016, the average (median) gross weekly earnings for residents23 in Oxford was £589, which is
some £16 lower than Oxfordshire as whole and £7 higher than the levels for the South-East but £48
higher than those for England as a whole.
The contribution of Oxford’s workforce to the national economy is highlighted in The Oxford Profile
201624 8th for annual full-time earnings (£30,400).
23
ONS Annual survey of hours and earnings – residents analysis 2016 24
Oxford Profile 2016: Summary of key facts about Oxford (Oxford City Council)

Oxford Economic Narrative 2017
25
Figure 21, ASHE, 2012-2016, adapted from Centre for Cities Data Tool
Key message: The average weekly workplace earnings in the graph above assess Oxford against
comparable cities. Oxford’s earnings have increased in recent years and are now at the same level
as Cambridge and similar to Milton Keynes. It is higher than Swindon and significantly higher than
Norwich. Reading has however consistently had the highest earnings of all comparable cities.
4.3 Qualifications
Key message: Oxford has a high proportion of the population that is qualified to a high level
comparable to Cambridge. But this does mask the areas of the city where people have low or no
qualifications and the poor performance of the Oxford’s state schools.
The Annual Population Survey 2015 shows that 63% of the working age population are qualified to
at least NVQ4 level (HND, degree and higher degree qualifications or equivalent) and above, which
is higher than Oxfordshire (52%) and significantly higher than the South East (40%) and England
(37%). This shows that the local labour force in Oxford is highly qualified reflecting the importance
within the city of ‘knowledge-intensive businesses’. But conversely these broad figures do mask the
challenges faced within the city particularly in the ‘pockets’ of deprivation which include significant
numbers of people with no qualifications. In addition the attainment in state schools within the city
is below the national average with GCSE attainment ranking Oxford 30th out of 54 cities according
to the Oxford Profile 2016.25
25
Oxford Profile 2016: Summary of key facts about Oxford (Oxford City Council)
400
450
500
550
600
650
2012 2013 2014 2015
Po
un
ds
Year
Average weekly workplace earnings
Cambridge
Milton Keynes
Norwich
Oxford
Reading
Swindon
Oxford Economic Narrative 2017
26
Figure 22: ONS Annual population survey 2015 (Jan – Dec 2015) one sample size too small for reliable estimate
O 2nd, as compared to the 54 other cities in England, for the percentage (43%) of people within the city with
degree-level qualifications. In overall terms Oxford has only 4% of the resident population in unemployment,
being ranked 52nd. 22% of the population possesses no or low qualifications and is ranked 54th.
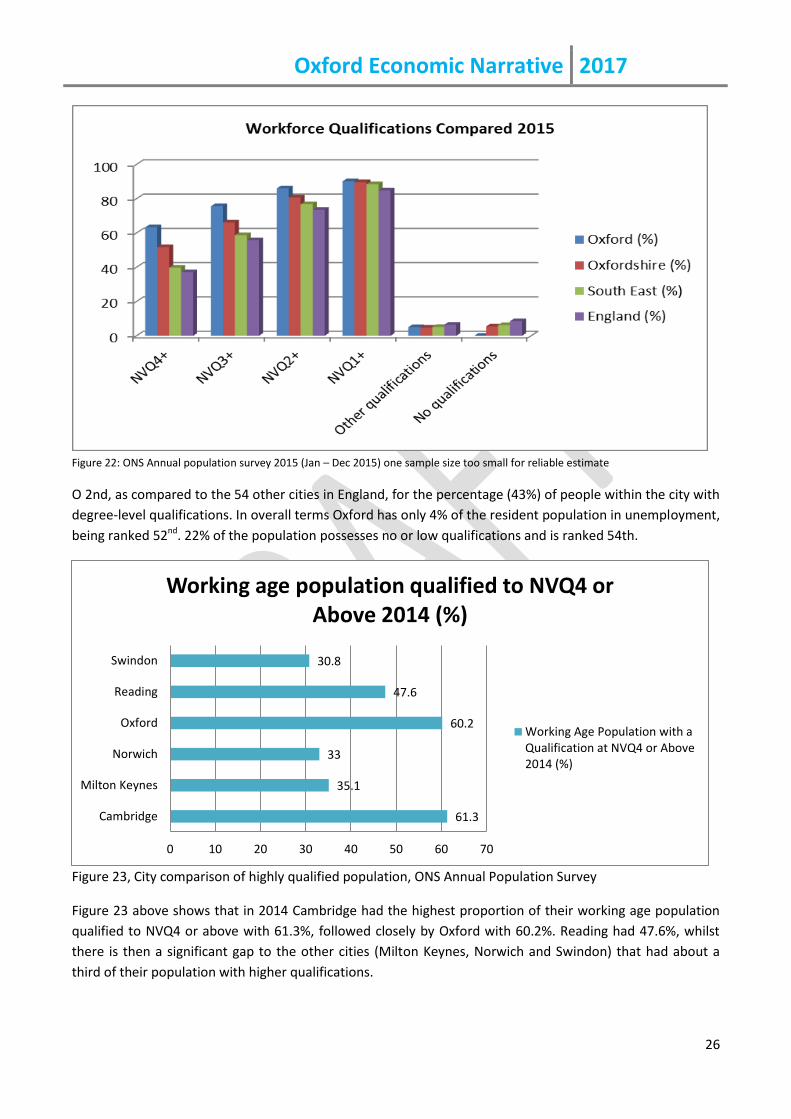
Figure 23, City comparison of highly qualified population, ONS Annual Population Survey
Figure 23 above shows that in 2014 Cambridge had the highest proportion of their working age population
qualified to NVQ4 or above with 61.3%, followed closely by Oxford with 60.2%. Reading had 47.6%, whilst
there is then a significant gap to the other cities (Milton Keynes, Norwich and Swindon) that had about a
third of their population with higher qualifications.
61.3
35.1
33
60.2
47.6
30.8
0 10 20 30 40 50 60 70
Cambridge
Milton Keynes
Norwich
Oxford
Reading
Swindon
Working age population qualified to NVQ4 or Above 2014 (%)
Working Age Population with aQualification at NVQ4 or Above2014 (%)

Oxford Economic Narrative 2017
27
4.4 Unemployment
Key message: The claimant count, figure 24 below assesses Oxford against comparable cities. This
shows Oxford, like other places to have decreased to record lows, second lowest of comparable
cities. The numbers of people making a claim for unemployment benefits in Oxford is 98526, which
represents 0.9% of the resident population of working age, which is slightly higher than Oxfordshire
(0.6%) and comparable with the South-East (1.1%). The national level is however double at 1.8%.
Figure 24 City comparison of claimant count over time, ONS, Centre for Cities Data Tool
Key message: Oxford has a lower level of ‘Main Employment Support Allowance’ claimants than the South-
East and significantly lower than the national figure. The figure is higher in certain neighbourhoods.
The numbers of people of working age population within the city claiming ‘main out of work
benefits, such as JSA and ESA, is however greater at 7,76027 people; which in Oxford is 6.8%,
compared to South East (8.5%) and England (11.3%).These figures for the city as a whole do not
reflect the spatial differences within Oxford which has ‘pockets’ of deprivation where 10 out of 83
neighbourhoods being amongst the 20% most deprived in England.
NEED to INSERT UPDATED NEIGHBOURHOOD DATA
4.5 Educational attainment
Key message: Oxford has notably lower state school educational attainment levels than Cambridge and
Reading. Figure 25 below shows that of the comparable cities, Milton Keynes has the lowest percentage of
pupils achieving 5 GCSEs but followed closely by Swindon, Oxford and Norwich. Cambridge has the highest
proportion of pupils achieving this standard with Reading very closely behind.
26
ONS Claimant Count (January 2017) 27
ONS Main Benefit Claimants (Aug 2016)
0.5
1
1.5
2
2.5
3
3.5
Jan
-13
Ap
r-1
3
Jul-
13
Oct
-13
Jan
-14
Ap
r-1
4
Jul-
14
Oct
-14
Jan
-15
Ap
r-1
5
Jul-
15
Oct
-15
Jan
-16
Ap
r-1
6
Jul-
16
Oct
-16
Pe
rce
nta
ge o
f w
ork
forc
e
Date
Claimant count rate
Cambridge
Milton Keynes
Norwich
Oxford
Reading
Swindon

Oxford Economic Narrative 2017
28
Figure 25, City Comparison of education attainment, Dept. for Education, 2015
4.6 Travel to work commuting patterns
Key message: Over ten years between 2001 and 2011 there has been an increase in the number of
inbound commuters travelling from outside the district to work in Oxford by car for most of the
journey. Within the city commutes made mainly by bicycle, on foot or by bus have all increased.
More people commuting from Oxford to other destinations are travelling by train or bus than in
2001.
Oxfordshire County Council’s Research and Intelligence Team, the District Data Analysis Service and
Oxford City Council carried out some detailed analysis of commuting patterns by mode of travel in
2011 comparing the latest information from 2011 with the previous Census in 2001. The tables
below show the travel patterns of behaviour and modes of transport used both in Oxford by
comparison to the surrounding districts and within Oxfordshire as a whole. The travel assessment
for Oxford is then analysed in further detail according to three scenarios, inbound, within Oxford
and outbound.
2001 Oxford Cherwell S Oxon Vale WH West Ox Oxfordshire
In commuters 40,051 19,953 21,636 21,793 10,363 47,043
In-district commuters 38,538 35,531 22,808 26,879 24,031 214,540
Work from home 5,068 6,779 7,883 6,241 5,796 31,767
No fixed place 2,115 3,017 3,345 2,604 2,511 13,592
Live & work in area 45,721 45,327 34,036 35,724 32,338 259,899
Out commuters 14,470 24,952 32,712 24,170 18,112 47,663
64.8
49.2
54.07
53.5
63.57
53.1
0 10 20 30 40 50 60 70
Cambridge
Milton Keynes
Norwich
Oxford
Reading
Swindon
Pupils Achieving 5A*-C GCSEs inc. Maths & Eng. 2014 (%)
Pupils Achieving 5A*-C GCSEs inc.Maths & Eng. 2014 (%)

Oxford Economic Narrative 2017
29
Net commuters 25,581 -4,999 -11,076 -2,377 -7,749 -620
Employed residents 60,191 70,279 66,748 58,984 50,450 307,562
People working in area 85,772 65,280 55,672 57,517 42,701 306,942
% of employed residents who work
in areas
76% 65% 51% 60% 64% 85%
% of people who work in area and
live there
53% 69% 61% 62% 76% 85%
2011 Oxford Cherwell S Oxon Vale
WH
West Ox Oxfordshire
In commuters 45,852 23,206 23,654 24,754 11,833 57,447
In-district commuters 42,406 34,879 22,358 22,228 24,437 221,160
Work from home 7,431 8,727 10,709 7,970 7,901 42,738
No fixed place 4,395 5,459 5,635 4,794 4,579 24,862
Live & work in area 54,232 49,065 38,702 37,992 36,917 288,760
Out commuters 16,013 26,184 32,012 25,654 20,159 48,170
Net commuters 29,839 -2,978 -8,358 -900 -8,326 9,277
Employed residents 70,245 75,249 70,714 63,646 57,076 336,930
People working in area 100,084 72,271 62,356 62,746 48,750 346,207
% of employed residents who
work in areas
77% 65% 55% 60% 65% 86%
% of people who work in area and
live there
54% 68% 62% 61% 76% 83%
Figure 26: Travel patterns (origins and destinations) 2001 and 2011, ONS Census and Oxfordshire County Council
Inbound: There has been an increase in the number of inbound commuters travelling from outside
the district to work in Oxford by car for most of the journey.
o Between 2001 and 2011 the number of commuters driving to work in Oxford from outside
the district has increased from 27,700 to 30,600 (+10%)
o Two-thirds of commuters travelling to Oxford arrive by car
Within Oxford: Commutes made mainly by bicycle, on foot or by bus within the city have all
increased, whilst car commuting has stayed at a similar level to 2001
o Between 2001 and 2011 the number of people commuting by bicycle or on foot has
increased by almost a third (+32%), bus use for commuting within Oxford increased by 11%
o So in 2011, 68% of journeys were made by sustainable means, up from 62% in 2001

Oxford Economic Narrative 2017
30
Outbound: More people commuting from Oxford to other destinations are travelling by train or bus
o Around half of outbound train commuters are travelling to work in London
o The number of commuters travelling out of Oxford by car remain almost unchanged since
2001 (9,800 journeys) in 2011, 62.5% of all outbound commuters.
Figure 27: Travel to work by Oxford residents in employment 2001-2011, Source: 2001 Census and 2011 Census
Key message: Oxford residents increased use of sustainable transport, with greater use of the
bicycle or on foot and public transport. The table above shows how Oxford residents in
employment travelled to work in 2001 as compared to 2011. There has been an increase in the
proportion of people working from home (figure 27).
Figure 28: City comparison of commuting by public transport, Census 2011, Centre for Cities Data Monitor
Key message: The graph above shows that Oxford has the highest proportion of people commuting
to work by public transport followed by Reading.
11.26
9.83
7.81
18.56
15.27
9.69
0 5 10 15 20
Cambridge
Milton Keynes
Norwich
Oxford
Reading
Swindon
Commuting by Bus, Train or Metro 2011 (%)
Commuting by Bus, Train or Metro2011 (%)

Oxford Economic Narrative 2017
31
5. Living in Oxford
5.1 Housing stock
In 2016 there are estimated to be 60,240 dwellings in Oxford28. Figure 29 below shows housing
stock increase in Oxford between 2010 and 2014, as compared to other similar cities. Oxford’s
increase is amongst the lowest of the cities we have benchmarked, with Cambridge showing the
greatest increase particularly between mid- 2013 and 2014 rising by over 2.5%. Oxford does
however have considerable challenges in meeting housing growth, not least the scarcity of land, the
tightly drawn administrative boundary, surrounding green belt, extensive areas of flood plain,
together with the legacy of an historic built and natural landscape environment. The Strategic
Housing Market Assessment (SHMA) provides the most up to date evidence base to inform future
housing growth, which then links in with individual Local Plan housing targets. Oxford is actively
seeking to meet its present housing requirement but has a significant ‘unmet housing need’. The
City Council is therefore progressing now effective joint working with neighbouring districts within
Oxfordshire to ensure that each authority helps to meet its unmet need through agreed targets.
A number of major projects are now in the pipeline that should see a much needed increase in
housing stock over the next 10 years. See section XX for details of this development pipeline.
Figure 29: City Comparison of annual Housing Stock growth 2010-2015, DCLG and Centre for Cities Data Tool
Oxford and Cambridge stand out, outside of London, as the places with the most significant
affordability issues, given the combination of high demand, desirability of place, and strong
economies (figure 30 below). However, it is clear that, despite a major injection of stock in
28
Estimate of number of dwellings in Oxford, based on Council Tax figures: Oxford City Council

Oxford Economic Narrative 2017
32
Cambridge, affordability has still worsened. From this, two conclusions can be made. The first is
that the level of supply increase is not sufficient enough to overtake demand to the point where
price increases stabilise. The second is that the number of homes is only part of the solution and
intermediate offerings such as key worker housing are required, to ensure places such as Oxford
can sustain the services they need to function, where pay is often not high, research, healthcare
and education for example. This is why Oxford City Council has established its own housing
company to meet the demands of key cohorts of service workers that fulfil a vital need.
Figure 30, City Comparison of Housing Affordability 2009-2015, Centre for Cities data Tool
5.2 Housing tenure mix
The graph below (Figure 31) provides a summary of the breakdown of dwellings types in Oxford as
compared to Oxfordshire and at the national level. This shows that Oxford as a predominantly
urban area, has a higher proportion of purpose built flats, slightly more terraced properties and a
similar proportion of semi-detached dwellings compared to the County and nationally. The
proportion of detached dwellings in Oxford however is generally only about a third of the stock in
Oxfordshire and in the UK.

Oxford Economic Narrative 2017
33
Figure 31: Breakdown of Dwellings by type Source: Census 2011
The dwelling tenure for Oxford as compared to Oxfordshire and at the national level is shown in the graph
below. This shows that Oxford has less owner occupied dwellings than the County and nationally but
significantly more local authority and housing association rented properties than Oxfordshire.
Figure 32: Housing tenure breakdowns, Census 2011
5.3 Housing prices and affordability
Figure 33 below shows that the average house price in Oxford for all dwellings types had risen to £511,238,
as of May 2016 which is significantly more than for Oxfordshire and nationally. The higher price of other
properties in Oxford including terraced, semi-detached and flats is also reflected above, however the
greatest difference is in detached dwellings which in Oxford is double the price of Oxfordshire and almost
the times that nationally. Notwithstanding the greater increase in housing stock in Cambridge
recently as compared to Oxford, this difference is not as yet reflected in the overall levels of
affordability within the two cities which are amongst the highest in the country and equivalent to
16 times average salaries (figure 30 above).

Oxford Economic Narrative 2017
34
Figure 33: Average property prices by dwelling type, Source: Land Registry Jun 15-May16
5.4. Housing land supply
The Oxford Local Plan 2036 has prepared background evidence to assess the need versus the supply
of land for housing and employment. The need for housing in Oxford was set out in the Oxfordshire
SHMA (2014). National guidance now encourages local authorities to consider both housing and
employment land together in a combined assessment, known as the Housing and Economic land
Availability Assessment (HELAA). This assessment is supported by the Employment Land
Assessment (ELA), which considers the local economy and labour market together with forecast job
growth to determine whether sites should be developed for housing and or employment uses.
Almost 500 sites were assessed for their potential for economic or housing uses in the period 2016
to 2036, which are all listed in the HELAA. The key findings from the HELAA identifies that there is
potential capacity in Oxford to accommodate around 7,511 additional homes. This means that
there is a significant shortfall of sites to meet the identified housing need in Oxford. The City
Council is therefore working with the adjoining Oxfordshire authorities and the Oxfordshire Growth
Board to address Oxford’s ‘unmet’ housing need. In September 2016 the joint working reached a
significant milestone with the local authorities (with the exception of South Oxfordshire) agreeing
to each District to accommodate a portion of Oxford’s ‘unmet’ housing needs. The current agreed
working assumption is that there will be around 15,000 homes that need to be delivered outside of
the city.

Oxford Economic Narrative 2017
35
5.5. Deprivation
According to the 2015 Index of Multiple Deprivation, 10 of Oxford's 83 neighbourhood areas ('Super
Output Areas') are among the 20% most deprived areas in England. These areas, which are in the
Leys, Rose Hill and Barton areas of the city, experience multiple levels of deprivation – low skills,
low incomes and relatively high levels of crime.
The 2008/09 recession caused a rise in unemployment which was particularly acute amongst low
income groups and deprived areas. Men and women living in relatively deprived areas have a
shorter life expectancy than those living in the least deprived areas. After adjusting for housing
costs, 25% of children in Oxford live below the poverty line.
In August 2016 Oxford had 7,760 (6.8%) working age residents claiming benefits. Main out-of-work benefits include the groups: job seekers, ESA and incapacity benefits, lone parents and others on income related benefits. This is below the South East and GB Averages of 8.5% and 11.3%.
5.6 Crime
According to the English Indices of Deprivation 2015, Oxford ranks 90 out of 326 districts on the Crime
Domain. Oxford is now less relatively deprived in reported crimes compared to the previous Indices of
Deprivation in 2010. Six out of 83 neighbourhoods in Oxford, however, are amongst the 10% most deprived
are. In the year ending September 2016, the crime rate in Oxford was about the same as the
average crime rate across similar areas. As shown in the table below the level of crime in Oxford is
very similar to comparable cities such as Cambridge, Brighton and Reading.
City Crime rate
Cheltenham 66.18
Exeter 68.55
Reading 86.38
Cambridge 87.69
Brighton and Hove 87.73
Oxford 89.68
Southampton 113.50
Bristol 115.11
Figure 34: Comparison of city crime rates, ONS
5.7 Environment
Carbon emissions overall in Oxford have reduced by 27% between 2005 and 2014. According to the latest carbon emissions data released by the Department for Energy and Climate Change (DECC), overall emissions in Oxford have fallen from all sources — commercial, domestic, and transport — since 2005. Whereas domestic and industrial and commercial emissions in Oxford reduced faster than the England average, transportation emissions did not reduce as rapidly. The slower reduction in transportation emissions highlights the need for an improved low carbon transport system, as that is the sector that has seen the least improvement over the last ten years.

Oxford Economic Narrative 2017
36
6. Employment land supply and commercial property
6.1 Employment land assessment (ELA)
Key message: The HELAA, published in 2016, identified capacity for additional economic uses,
which comprises approximately 300,000 sqm of B1 (offices); around 92,000 sqm of B2/B8
(Industrial); and 200,000 sqm (leisure and community uses).
The Employment Land Assessment (ELA) assessed 118 employment sites and areas for their
performance, quality and intrinsic characteristics. Oxford currently has 1,030,728 sqm of office (B1)
floorspace and 151 ha of industrial land (B2, B8). This includes all occupied land as well as vacant
sites and buildings and sites with planning permission. Most of the vacant land has proposals for
development, including planning permission, and is expected to be built out in the short-term.
The best performing location for office uses (B1) were the City and District centres together with
Headington (Hospitals) and the South-East (Oxford Business Park and Science Park); whilst out-of-
centre locations near the ring road were performing well for road transport access. The industrial
uses scored well for strategic access, near to the ring road, together with servicing and parking
facilities. Finally, the report highlights that there is an undersupply of employment premises and
land to meet the forecast demand in Oxford to 2036, something that will be addressed through
Local Plan and cooperation with neighbouring authorities.
6.2 Property market review
The ELA considered the supply and demand for office and industrial space in Oxford, but as part of
the wider Oxfordshire Property Market Area (PMA). This report uses information from responses to
a questionnaire and property market reports from local agents, together with the findings of the
Oxford Business Survey 2015. Firstly it is evident from the assessment of the ‘drivers for growth’
that the city has been performing well according to a range of economic indicators over recent
years and the expectation is that this will continue.
In Oxford’s case the forecasts suggest that population will increase significantly to 180,000 by 2031,
the demand for housing rise to a requirement of 24,000-32,000 by 2031 and that the number of
jobs will increase by 24,000. There is a recognition both within the Strategic Economic Plan (SEP)
and supporting evidence in the Oxfordshire Engine for Growth (OEG) that all the key growth areas
within the Property Market Area (PMA) including Bicester and Science Vale have a role to play as
part of the ‘Knowledge Spine.’ However it does appear evident from the OEG report that whilst
Bicester and Science Vale have major plans for growth, that greater emphasis in the future should
be placed on ensuring that ‘Oxford has to grow to fulfil its role within the high-tech economy.’
The second issue is how this employment development can take place within the context of some
key challenges ahead such as limited land supply, tightly drawn administrative boundaries, and a
Green Belt both around the city and reaching as ‘fingers’ within the urban area of Oxford.

Oxford Economic Narrative 2017
37
It was shown that over the years the property market has largely responded to the constraints in
Oxford with very little new office development coming forward within the City centre and more
provision for medium and larger sized offices being built at the Business Park and Science Park in
out-of-centre locations. It does now appear however that the scale of employment growth that is
forecast is significant and whilst some of this growth will be accommodated in the form of the
recycling and intensification of existing land supply it will be important to create a ‘pipeline’ for
additional supply of office space if the city is to play its role as a fast-growing city and generate
more economic growth.’ This is recognised by local agents who confirm that ‘demand for quality
offices in the 2,500 to 4,000 sqft bracket in Central Oxford continues to rise underpinned by steady
rental growth.’ Whilst this may present challenges in the short-term, within the medium to long-
term some major new sites within the City centre, such as Oxpens, the Station site and Island site
will present opportunities for new office space. The Science Park Old Road, Churchill site and the
Northern Gateway will provide other opportunities in out-of-centre locations specifically for growth
in key sectors associated with science and research and development. Within the Property Market
Area (PMA) evidence from the agents suggest that there is now a ‘severe shortage of office
buildings of 20,000 sqft and larger in Oxfordshire.’
In the case of industrial space demand appears to be steady but any growth constrained by the
limited opportunities available. It is important however for space of a good standard to continue to
be provided by the market to ensure that a diverse range of businesses can operate within the city
to support the local economy and the supply chain for key sectors. To a degree the property market
has already responded through the regeneration and redevelopment of existing sites, such as
Horspath Industrial Estate, Ashville Way, the new Trade Centre in Sandy Lane and the
redevelopment of the former Post Office Sorting Depot. Other established industrial locations such
as Osney Mead and the Oxford Business Centre (Oxpens) are however likely to be regenerated but
as part of the growth of key sectors, such as research and development and teaching associated
with the University of Oxford.
Whilst the supply side of this assessment does need to be seen in the context of the wider Property
Market Area (PMA) equally it is important for the city to have some industrial uses. For example
one of the older established industrial estates Osney Mead is currently at the early stages of Master
Planning work to create an ‘Innovation Quarter.’ This positive approach to regeneration principally
for research and development together with associated teaching for the University of Oxford is
welcomed in principle, since it provides much needed employment space and helps to build on one
of the city’s key growth sectors. This will however inevitably over time result in the displacement of
existing business / service uses which are important in providing services and facilities as part of the
support infrastructure that allow for the proper functioning of the local economy. Whilst some
businesses may choose to relocate outside the city within the wider PMA other businesses who
have longer associations with Oxford and an established local market / client base may well ideally
wish to remain within the city, so some alternative employment sites do need to be provided to
respond to demand and offer them this opportunity.

Oxford Economic Narrative 2017
38
6.3 Innovation spaces and serviced start-up and grow-on space audits
7. Oxford’s economic future
7.1 Population and economic growth forecasts
Key message: Oxford’s population will increase significantly to 180,000 by 2031, the demand for
housing rise to a requirement of 24,000-32,000 by 2031 and that the number of jobs will increase
by 24,000. Longer-term population forecasts for the city suggest this will rise to 181,211 in 2035
and then 191,931 in 2040. Figure 35 below shows the extent of recent growth.
Figure 35: City comparison of recent population change: ONS Mid-year estimates and Centre for Cities Data Tool
Economic forecasting report to inform the Oxfordshire Strategic Economic Plan (SEP) and Strategic Housing Market Assessment (SHMA) (Feb 2014)
This study provides evidence of population growth and economic forecasting to inform the
Oxfordshire Strategic Economic Plan (SEP) and Strategic Housing Market Assessment (SHMA) (SQW
and Cambridge Econometrics) (Feb 2014). The timeline for these projections is to 2031. The
forecasting was based on the Cambridge Econometrics Local Economic Forecasting Model (LEFM).
This comprised baseline projections (trend-based jobs assessment) these look at the last 15 years
and assumed will continue; Alternative population-based projections which set out a baseline
population projections; and planned economic growth, these reflect policy influences on economic
growth (City Deal, EZ, and planned infrastructure investment).

Oxford Economic Narrative 2017
39
The report provided an analysis of job growth by district, based on the Planned Economic Growth
forecasts, compared with land allocated for development by district (taking into account that not all
jobs locate on B Class land). The report states that “it appears that there is sufficient land allocated
in all districts, except South Oxon” and that according to the employment baseline projections
“Oxford is still projected to see one of the largest absolute increases in jobs (5,000) among the
Oxfordshire districts over 2021-31 “(Fig.2.4).
Growth is driven in all districts by ‘accommodation & food services’ and ‘financial & business
services sectors.’ But in Oxford growth is likely to come from the Government services (education
and health), distribution (retail) and accommodation and food. The key sectors identified as likely
to stimulate growth above trend in Oxford include, University of Oxford (research) 2,000 additional
jobs and Brookes University; Bioscience 1,500 jobs, Health sector (2,500 jobs); engineering sector
1,000 jobs; and retail 1,000 jobs. Whilst there will be competition from surrounding areas such as
Reading and London the consultants considered that the strength of the Oxfordshire economy is
such that it can withstand this pressure. “The potential commercial exploitation of R & D
undertaken in the County by both public and private sectors, and the growth potential of firms in
some key sectors, all suggest that competition from surrounding areas will not adversely affect
employment growth”. They do however refer to the impact of constraints such as infrastructure
and the labour market.
In the case of Oxford the report states that “there will be significant growth of employment in
education (university related), bioscience and healthcare and retail”. There is also likely to be an
increase in corporate R & D linked to the Universities, the most likely being biomedical, engineering
and computing, but with a slight decline in publishing. The estimate is that this will generate growth
of 8,100 jobs above trend all of which would be accommodated within existing employment-
generating sites (though most not on B Class land).
Planned Economic Growth Forecasts and Capacity of allocated sites
Planned Economic Growth Forecasts (PEGF) compares the Planned Economic Growth forecasts by
District (Oxford 24,300 jobs) with capacity on sites that are allocated or proposed to be allocated
for development within the period of the relevant local plans. This table also shows the PEGF
forecasts adjusted to include only those likely to locate on B class land, to make the figures
comparable with the capacity of allocated sites. This involves assumptions about the proportion of
jobs in each main sector locating on B class land. In Oxford’s case the jobs likely to be on Class B
land 11,000 jobs, which can be accommodated on the capacity of the allocated sites, which would
be 18,500.
The forecasts relate employment sites and job capacities to individual sites within the Districts. For
Oxford this includes a range of sites these include those within the City Deal and key employment
sites. For example these include the Bio-escalator; Old Road Campus; Radcliffe Observatory
Quarter; Northern Gateway; District centres: and those allocated in the Sites and Housing Plan.

Oxford Economic Narrative 2017
40
In conclusion, therefore taking all the sites in Oxford together the total gross site area amounts to
208 ha, of this it is estimated that the net amount of land that would be used for employment
would be 68 ha (land), which would be developed to provide 363,920 sq. m (floorspace gross),
294,736 sq. m (floorspace net) creating some potential 18,487 (jobs). Other sites such as Osney
Mead, the Science area, Radcliffe Observatory Quarter and the redevelopment of the Westgate
Shopping Centre could potentially add some further floorspace and jobs in the future.
Latest Population Growth Forecasts
Interim population forecasts (November 2016) have been prepared by Oxford County Council’s
Research and Intelligence Unit and released for internal use in January 2017. The release is based
on the current expectations about what level of growth is likely within each district, including
apportionment of Oxford City’s undeliverable housing growth requirements. The ‘interim’ status is
due to concerns about the validity of the ONS population data for Oxford City.
Forecast estimates are available for each year to 2040. The population of Oxford in 2015 was
estimated to be 162,094, which is expected to rise to 168,924 by 2020. In 2025 the population of
the city is then forecast to increase to 175,099 and by 2030 will reach 181,605. Over the next 10
years the population is expected to increase to 181,211 in 2035 and then by 2040 will rise to
191,931.
Milton Keynes, Oxford and Cambridge have shown the fastest growth in population in recent years,
highlighting the reason for such dramatic projections. As has been demonstrated previously, Oxford
is within a distinct phase of rapid population growth.
7.2 Investment in Regeneration and Infrastructure
A recent assessment of major projects and investment either currently being undertaken or committed in
the future shows the scale of planned development in Oxford. Taking into account employment, housing and
other key capital projects, the estimated development value in the city will amount to £4bn, through the
development of some 5 million sq ft of commercial floorspace, which will create around 22.500 new jobs
together with 7,330 new dwellings. Sites such as Barton Park, Oxpens, Northern Gateway, Oxford Station,
and Osney Mead Innovation Quarter are key elements of this overall programme, supplemented by a range
of urban extensions.
Superfast broadband has the highest coverage in Cambridge (84%), followed closely by Oxford
(81%). Reading (76.5%), Milton Keynes (72.8%) and Swindon (70.4%) have a similar coverage. The
city with the lowest coverage of the comparable cities is Norwich within only 68%).
Further investment in mobile Broadband and next generation 5G will be important in future for
Oxford to realise its Smart City ambitions (see below)
An ambitious Oxford Transport Strategy has been agreed whilst representations to the National
Infrastructure Commission have highlighted the key infrastructure requirements to support

Oxford Economic Narrative 2017
41
projected growth of homes and employment in and around Oxford. The highlights of this
requirement are below;
Fast and full delivery of East-West Rail and linked network enhancements.
Delivery of the Oxford Station Development Masterplan and opening of the Cowley branch
line. Relief of the A34 and associated roads, including junctions to A420, A40, A44.
Enabling faster delivery of a range of ambitious urban extensions to enable a step change in
housing delivery.
Mass Rapid Transit, Park and Ride and cycle network investments as essential elements of
strategic infrastructure.
Adequate attention to accompanying utilities (telecoms, water, power).
Accompanying investment in a range of community infrastructure (skills, schools, health,
public space, Oxford Flood Alleviation Scheme).
Continued collaboration and planning across the key organisations across the corridor,
without the creation of additional regional structures.
A focus on ‘smart’ future proofed infrastructure corridor-wide and in cities.
7.3 Oxford Innovation Eco-system and Smart Oxford
Oxford is world-renowned for its academic excellence, innovative business culture and for the
quality of its built and natural environment. The city and county is one of the best-performing and
most innovative areas in England and has unique assets to support growth in the national
economy29,30. The Oxfordshire Innovation Engine Report (2013) commissioned by the OxLEP and
the University of Oxford recognised the important role that the city plays in innovation and as the
engine for growth within the local economy. The consultants SQW have highlighted that ‘Oxford is
the service centre for the wider economy, it has the fastest growing, best educated workforce and
it is the main centre of research and spin-outs in the County.’
Oxfordshire supports an internationally recognised cluster of ‘big science’ and research facilities,
over 1,500 high tech businesses, and a highly skilled workforce. Underpinning Oxfordshire’s strong
economy and labour market is the area’s very particular strengths in higher education and
research. This is seen in the county’s ability to lead on at least six, and capacity in all, of the ‘eight
great technologies’ identified by Government: big data, space, robotics, synthetic biology,
regenerative medicine, advanced materials, agricultural technologies, and energy storage. The
assets and characteristics of the Oxfordshire high tech economy have been extensively described,
notably in The Oxfordshire Innovation Engine report of 2013, and offer huge opportunities for
business growth
29
Oxfordshire Innovation Strategy Consultation Draft, 2016 30
Enterprise Research Centre

Oxford Economic Narrative 2017
42
Understanding the Ecosystem
Prioritising and selecting what we do based on a deeper understanding of our strengths
A great deal of work has already been done to better understand elements of the special innovation ecosystem that drives Oxfordshire’s economy. These include the Oxford Innovation Engine Report, Invest in Oxfordshire Sector Analyses, and the NESTA network analysis. The aim is to develop an even deeper understanding in order to make sensible evidence-based interventions. A more comprehensive view across the range of innovation activities in Oxfordshire will allow us to provide better support interventions for those areas that are underdeveloped, while also identifying synergies and opportunities for interactions and convergence across disciplines. Oxfordshire is remarkable for the sheer range of scientific disciplines and business sectors in which there is real strength and depth. Innovation frequently occurs as a result of bridging between different sectors, often as a result of serendipitous interactions. The very richness of the ecosystem underpins an opportunity for innovation that very few places can replicate, while also emphasising the complexity and importance of better understanding our own strengths. Oxfordshire’s Second wave Science and Innovation Audit will highlight our local and regional strengths in areas such as: “Digital Health”, “Space-led Data Applications”, “Autonomous Vehicles” and “Technologies underpinning quantum computing”. There are a wide range of other science and innovation areas that a larger scale audit programme would allow examination of. It should be emphasised that the four areas outlined for the Science and Innovation Audit Programme are not “priorities”, but rather four areas of strength among many possibilities that were chosen for this particular audit submission. These four areas -- while distinct -- have significant overlap and points of intersection both locally and nationally, and share a common need to develop connectivity into complementary communities beyond the region and their specific technology sectors.
Oxford’s bid to be the European Capital of Innovation Award 2016 was unsuccessful despite reaching the final, but the process of putting the bid together was of great value. All parties involved in pursuing and promoting innovation in Oxfordshire provided input to the bid, and for the first time the breadth of Oxfordshire’s innovation eco-system was observed. The bid itself has provided complementary material to OxLEP’s new Innovation Strategy and a basis for future activity.
Oxfordshire’s innovation landscape is ever-changing; as our strengths and capabilities evolve over time, there is an ongoing need to understand the ecosystem and its effectiveness. Going forward, city and county partners will look for opportunities to collaborate with other groups interested in gathering data both within and outside of Oxfordshire, to learn from to other ecosystems.
Smart Oxford
The Smart Cities concept has been adopted by multiple cities worldwide. Smart City initiatives aim
to improve the management of urban environments through the use of information technology,
and the collection, processing, and integration of data across services (for example, transport,
healthcare, and energy services). Smart Cities are about making places more ‘liveable’, and enabling

Oxford Economic Narrative 2017
43
every citizen to engage with all the services on offer, public as well as private, in a way best suited
to his or her needs.
The characteristics of our natural and built environment combined with the strength of our
research and innovation base make Oxford and Oxfordshire and ideal location and testbed for
Smart City initiatives. Oxford is a relatively small city, enclosed by rivers and a greenbelt, but within
this compact landscape can be found many of the same challenges of a larger city such as
environmental, transportation, social and housing problem. But we also have the capacity and
capability to develop, test and deploy the technologies that can help address them. In the context
of Smart Cities, these challenges become opportunities to use the city as a testbed for new
innovations to improve the quality of life for Oxford and the region.
Significant progress has already been
made through initiatives such as the Smart
Oxford project, a partnership which brings
together representatives from the City and
County Councils, Oxford Brookes
University, University of Oxford, the LEP,
Nominet, Lucy Group and other sectors.
The brand ‘SMART Oxford’ recognises
Oxford as a centre for developing products
and services that use Big Data, Internet of
Things, and Robotics. Specific strength lies
in autonomous vehicles, digital health and
mobile energy. A number of projects have
been launched across a range of topics
including transport (e.g. Oxbotica),
environment (e.g. Oxford Flood Network),
energy, broadband and digital.
By capitalising on our research base and
engaging innovators and the community,
we have the potential to become a leading
example for Smart City worldwide.
Furthermore, through Smart City projects,
we have the potential to realise significant
benefits for our local authorities, businesses, and citizens.
A recent survey found that 96% of people in the UK are unaware of a single smart city initiative being run where they live. With this in mind the Smart Oxford Competition will be launched in March 2017 to find and commission a smart city project that will engage with the wider community and promote Smart

Oxford Economic Narrative 2017
44
Oxford and smart city solutions and bring community engagement and support into our aspirations for Oxford as a Smart City.
7.4 Policy context
National Industrial Strategy
The Government have recently published a Green Paper on Building our Industrial Strategy (Jan 2017), which is currently out for public consultation. The aim being to build a modern industrial strategy to build on economic strengths to enable all parts of the country to succeed, helping to deliver a high-skilled, competitive economy that benefits people throughout the UK. This will be delivered through 10 pillars designed to support business and promote economic growth. The principle objectives of this ‘modern industrial strategy’, as set out in the Green Paper, are that it needs to:
build on our strengths and extend excellence into the future;
close the gap between the UK’s most productive companies, industries, places and people and the rest; and
make the UK one of the most competitive places in the world to start or grow a business.
National Planning Policy Framework (NPPF)
The NPPF condenses all planning policy statements into a single all-encompassing planning
framework with the intention of making the planning system less complex and more accessible. The
National Planning Policy Framework was published and came into effect on 27th March 2012.
The NPPF describes the Government’s vision for building a strong, competitive economy and sets a
requirement for the planning system to support economic growth. It encourages local authorities to
‘set out a clear economic vision and strategy’, ‘identify sites for local and inward investment’ and
‘support existing business sectors’ and ‘plan positively for key clusters’ and ‘identify areas for
regeneration, infrastructure provision and environmental improvement.’
Strategic Economic Plan (SEP)
Oxfordshire’s Strategic Economic Plan (SEP) has been developed by the Local Enterprise Partnership
(OxLEP) in partnership with the business community, academic institutions and the Local
Authorities and was submitted to Government on the 31st March 2014, prior to a published
refreshed SEP in January 2017. This sets out the long term vision and ambitions for economic
growth in the county. The scale, ambition and deliverability of the SEP will form the basis of Growth
Deal negotiations with Government and determine Oxfordshire’s allocation from the Local Growth
Fund (LGF). The overall vision for the Oxfordshire Strategic Economic Plan is that by 2030
“Oxfordshire will be recognised as a vibrant, sustainable, inclusive world leading economy, driven
by innovation, enterprise and research excellence.”

Oxford Economic Narrative 2017
45
In addition to the thematic focus the Strategic Economic Plan focuses on priority localities of in the
Oxfordshire Knowledge Spine, which include Bicester, Oxford and Science Vale. These
complementary priority areas together form the focus for economic development in the area. In
relation to Oxford there is recognition that there needs to be continued investment in developing
the critical infrastructure necessary to realise the full potential of its world-class education,
research and innovation that underpins growth.
The Oxfordshire Local Enterprise Partnership (OxLEP) has been recognised by the UK government as
one of the most effective and highly performing LEPS in the country, and the Enterprise Research
Centre described Oxfordshire as the ‘most innovative’ region in the UK, it is in the top 10% of
partnerships nationally, and has already leveraged millions of pounds worth of investment in
innovation in Oxford.
A refresh of the SEP was undertaken by the consultants SQW on behalf of OxLEP, which included
extensive consultation with stakeholders and residents. As a result of the consultation and further
research undertaken new strategies were developed relating to skills, innovation, culture and
heritage and natural resources and the environment. The study reflected the changes to
Oxfordshire’s economic well-being but a commitment to sustainable growth. An ‘economic route
map’ was developed and agreed which supported the economic performance of the OxLEP area
through the management of economic growth to ensure it is sustainable and inclusive.
The Oxfordshire Innovation Engine Report (2013, updated 2016)
This report was commissioned by the Oxford and Oxfordshire Local Enterprise Partnership together
with the University of Oxford. The report seeks to identify ways to realise the growth potential of
“Oxfordshire’s high tech cluster of businesses, research establishments and support providers”. It
acknowledges the step forward taken through the City Deal and the strategy in developing the
vision for the ‘knowledge economy spine’ but, in the view of the consultants (SQW), “it does not
place sufficient emphasis on the crucial economic role of Oxford.” (para. 7.22). The report
recognises that ‘Oxford is the service centre for the wider economy, it has the fastest growing, best
educated workforce, and it is the main centre of research and spin-outs in the County’.
The consultants make out a clear case for the growth of Oxford (para. 7.23) which states that
“Oxford has to grow to fulfil its role within the high tech economy.” It recognises that further
development of housing, accommodation for University and corporate research, and supporting
activities, beyond existing plans, to the north and south of the existing urban area. SQW consider
the ‘greatest potential for sustainable growth is to the north of the city around Begbroke, the new
Northern Gateway (Peartree) and the planned new rail station at Water Eaton.’
An update to the Oxfordshire Innovation Report was recently published in May 2016. The purpose
of the update was to consider recent changes, in particular whether the constraints that were
identified in the Innovation Engine Report were being addressed and the areas of growth potential

Oxford Economic Narrative 2017
46
realised. The overall conclusion from this review is ‘that real progress has been made over the last
few years. This has included:
o strong economic growth in Oxfordshire and an extraordinary scale of new investment in
high-tech firms;
o more productive relationships between research and business communities;
o much improved access to risk capital and more specialist business space for high tech
firms; and
o greater collaboration between local public sector organisations and stronger engagement
with the Government to support and positively manage growth.
Whilst the consultants recognise that there are still significant issues to address, notably the cost
and supply of housing, road congestion, the need for a stronger business voice and better, more
consistent articulation of the ‘Oxfordshire growth story’ across private and public sectors. However
the ‘direction of travel is strongly positive.’
Oxford Local Plan
The Local Plan at present comprises the Core Strategy (adopted 14 March 2011), which is the over-
arching document that sets out the vision, spatial strategy and core policies to 2026. It also includes
the Sites and Housing Plan (adopted Feb 2013), which allocates sites for development for housing,
employment and other uses together with updated housing policies. In addition there are three
adopted Area Action Plans, which include the West End AAP (June 2008), Barton AAP and the
Northern Gateway AAP (June 2015). There are some ‘saved policies’ from the Local Plan 2016,
which are still in operation.
The adopted Oxford Local Plan 2016 together with the recently adopted Core Strategy has
supported sustainable employment growth, building on Oxford’s key economic strengths. A suite of
policies, known as the ‘cascade approach’, used a set of criteria to protect a range of key
employment sites for either their existing use or for redevelopment and modernisation. The non-
protected employment sites were encouraged to be modernised for alternative employment uses;
but subject to satisfying certain criteria could be released for other uses such as residential
development.
This policy approach to the economy and the importance of ensuring an adequate provision of
employment land has been taken forward in the Core Strategy which promotes ‘managed
economic growth’. Policy CS27 therefore seeks to secure the long-term future of its key sectors,
whilst taking account of land supply constraints, and the need to improve the balance between jobs
and housing supply. In the context of Oxford this means growth that is appropriately located in
Oxford to take advantage of the city’s strengths, such as spin-out companies from the universities
and hospitals and medical / scientific research, rather than growth that could be located in any UK
city. Policy CS27 clearly states that ‘managed economic growth will be delivered through the

Oxford Economic Narrative 2017
47
allocation of land at the Northern Gateway and the West End, and the protection and
modernisation of key employment sites.’
Key protected employment sites
Policy CS28 aims to safeguard Oxford’s employment land supply. Whilst it relates to all employment
sites the policy does relate to both key protected sites and non-protected sites. The key protected
employment sites are located through-out the city and comprise strategically important larger sites
together with a range of small and medium sized sites. The aim is to provide a sustainable
distribution of business premises and employment land, to maintain a range of potential job
opportunities throughout the city. Retaining key employment sites serves to reduce commuting to
work, as well as improving access to local jobs for different sectors of the community. The provision
of a range of different sized sites is considered to be vital to meet the needs of small and medium
sized businesses.
The Oxford Employment Land Study (March 2006) provided the background evidence base for the
use of employment land set out in policies CS27 and CS28 in the Core Strategy. The smaller sites
often contain businesses that meet local needs and are less likely to be found on the City’s large
employment sites. They may offer lower-skilled jobs and skilled manual work, which are important
to particular sectors of the population. Retention of these sites therefore meets social as well as
economic needs.
The consultants in their review of these sites recognise in Para. 6.12 that:
‘there is not an indefinite number of employment sites in the City and the more which have no
strong protection and face development pressures for other uses, the less likely it appears that a
reasonable portfolio of different types of sites can be maintained in the future.’
The study also recognises the essential role these key protected sites play as part of the City’s
employment land supply. The consultants state: ‘the inherent value of a site as an employment
location is important rather than just its current condition or occupants’ (Para.6.13).
This balanced approach to safeguard key employment sites but allow the release of non-protected
sites was fully tested and supported by the independent Inspectors at the two Local Plan Inquiries.
In fact the employment policies in the Core Strategy were tested by two Inspectors during a lengthy
examination where the balance between housing and employment was the key strategic issue. The
Inspectors found that the strategy was sound and struck the right balance between competing uses
These policies have been successfully delivered through a balanced approach to the use of
employment land; which has been responsive to both employment and housing needs. Given the
shortage of land in Oxford this has required the protection of a range of key employment sites, such
as the Business Park and the Science Park; which aims to safeguard existing businesses but allow for
their modernisation and expansion.

Oxford Economic Narrative 2017
48
In the context of both the Core Strategy policies (CS27 and CS29) together with the Economic
Growth Strategy it is considered that the range of key protected employment sites should be either
protected for their existing use or modernised as part of the City’s employment land supply for an
alternative Class B use. These sites are considered to make an important contribution to Oxford’s
economy and if lost to other uses, such as residential, would seriously threaten the city’s future
economic growth.
Local Plan 2016-2036
The City Council has now started to produce a new Local Plan for Oxford. The Local Plan is
important because it will shape how Oxford develops. It will set out how the city will look and feel;
it will guide new developments to the right locations while protecting and improving the
environment and people's quality of life; it will deliver the new homes, businesses, jobs, shops and
infrastructure needed to support the growth of Oxford over the next 20 years; and it will be used in
determining planning applications and to guide investment decisions across the city. The City
Council want to make sure that Oxford continues to be a successful and attractive city; the kind of
place people enjoy living in, working in and visiting.
The timetable for public consultation begins on 27th June 2016. This will start to develop a vision
for the city in 2036, to gather ideas on a range of scenarios for future development and to check
that we have identified the right issues. Then in June / July 2017 there will be a public consultation
on the Preferred Options, followed on June / July 2018 by the Draft Submission of the Local Plan.
Submission is expected to be in December 2018.
The new Local Plan 2016 will supersede all plans and policies except the adopted Area Action Plans.
Oxford’s Economic Growth Strategy (OSP Jan 2013)
The City Council and its partners have sought to take a proactive approach to Oxford’s economy by
working in partnership with key stakeholders and business. The Oxford Strategic Partnership (OSP)
commissioned consultants (Shared Intelligence) to develop an Oxford Economic Growth Strategy
(OEGS). The consultants produced two key documents, which included a paper setting out the
narrative for the city together with a second document that focused on the strategy itself. This
analysed the City’s strengths and weaknesses and through active engagement with all interested
parties developed a clear vision for the future, which at its heart seeks to avoid ‘complacency’ but
build on Oxford’s strengths to ensure the city continues to make its important contribution to the
national economy.
The OEGS defines its role “Oxford is a national asset and essential to the future of the UK and the
regional economy as a whole.” The productivity and competitiveness of the city is clearly expressed
in its contribution to the national economy, Oxford ‘contributes £6.8bn to the UK economy, which
is the fifth highest GVA per capita of all UK cities, significantly higher than the national average.

Oxford Economic Narrative 2017
49
Oxford is the ‘engine of Oxfordshire’s economy’ with the ‘highest levels of business growth.’
Amongst the recommendations are the following three that are important to the delivery of
Oxford’s economic success;
o expand the knowledge economy and promote new start-ups;
o support the growth of existing employers; and
o ensure a sufficient supply of employment land.
The Economic Growth Strategy was approved by the Oxford Strategic Partnership (OSP) in January
2013 and an Action Plan setting out how and when the key recommendations and actions emerging
from the strategy are currently being implemented with progress regularly reported to a sub-group
of the OSP, the Economic Growth Steering Group. Some of these actions will also form part of the
new Corporate Plan for the City. The OEGS also links through to the work of the Oxfordshire Local
Enterprise Partnership.

Oxford Economic Narrative 2017
50
Appendix 1 – Oxford’s largest employers
Organisation Sector and activity No. Employees
University of Oxford (including
colleges) Higher education 16,200
Oxfordshire County Council local authority for Oxfordshire providing transport, education and social services. 15,900
Oxford University Hospitals NHS
Foundation Trust Oxford's main provider of healthcare, research, teaching and training. 10,730
Oxford Health NHS Foundation
Trust Health and social care 6,250
BMW (UK) Manufacturing Ltd. Manufacturers of the Mini 4,000
Oxford Brookes University Higher education institution 2,580
Oxford University Press Publishing 1,800
Oxford City Council Local Authority for Oxford city 1,150
Unipart Group of Companies Logistics, automotive parts and accessories companies 970
Oxfam International aid and development charity 900
Activate Learning Further education provider 850
Centrica (British Gas Business) Energy provider selling to businesses 800
Amey Infrastructure support service provider 700
Oxford Bus Company Public transport provider 600
Nielsen Market research, information and data 600
Blackwell UK Retailer - academic and specilaist book seller 500
Wiley Publisher 430
Stagecoach Public transport provider 400
Four Pillars (De Vere / Principal) Hoteliers 360
Dragon School Trust Private school 300
TripAdvisor Reviews and data 300
Grafton Merchanting Builders merchants 270
Oxfordshire Clinical
Commissioning Group NHS - health services buyer 250
Helen and Douglas House Chairty - hospice and children and young adults 225
Symm general and specialist building, joinery, cabinetry, and decoration 210
BD
Medical technology company that manufactures medical supplies, devices, laboratory
equipment and diagnostic tools 200
Oxford Archaeology independent archaeology and heritage practice 200
Natural Motion Gaming company and software development 200
Mogford Hospitality 200
UYS Ltd Manufacturer of Automotive Components 180
Mogford Hospitality 200
Nominet Website domain registration and IoT R&D 160
Rebellion Gaming company 150
Opus Energy Business energy supplier 150
Oxford Policy Management International development consultancy 140
OPP Ltd
OPP is part of the Myers‐Briggs Company and one of Europe’s largest business
psychology providers 140
Sharp Laboratories Electronics technology and R&D 125
Boswells Retailer 120
Knights Law firm 100
Blake Morgan Law firm 100
Genzyme Healthcare and Life Sciences company 70