Embed Size (px)
Citation preview

ORIGINAL PAPER
Oxidation of electrodeposited cobalt electrodesin an alkaline electrolyte
M. Grdeń & J. Jagiełło
Received: 9 June 2012 /Revised: 9 August 2012 /Accepted: 28 August 2012 /Published online: 18 September 2012# The Author(s) 2012. This article is published with open access at Springerlink.com
Abstract The oxidation of electrodeposited Co electrodeshas been studied in 0.1 M KOHaq at potentials more negativethan −880 mV vs. Hg|HgO by means of electrochemicalquartz crystal microbalance (EQCM) and rotating ring diskelectrode coupled with cyclic voltammetry (CV) and chro-noamperometry (CA). Dissolution of cobalt was found to beinsignificant and does not constitute a step in the overallprocess of formation of the oxidised layer. The irreversibilityof the oxidation process depends on the electrode potentialand oxidation time. The composition of the oxidised layerdepends on the oxidation potential: Co(OH)2 is formed atmore negative potentials, while at more positive potentialsCoO is the prevailing product. The results obtained by meansof three techniques (CV, CA and EQCM) reveal that at poten-tials not higher than −880 mV, the oxidation of Co follows adirect logarithmic law. The mechanism of the process isdiscussed.
Keywords Cobalt . Electrochemical quartz crystalmicrobalance (EQCM) . Metal oxidation
Introduction
Recent experiments conducted on noble metal electrodes[1–3] show that the process of surface electrooxidation canbe divided into two basic steps: (1) the early stages offormation of the oxidised layer up to ca. one monolayerand (2) further thickening of the oxidised layer. Each ofthese stages proceeds according to a different mechanism. It
was found that the early stages of electrochemical formationof a surface oxide/hydroxide of noble [1–6] and some of non-noble metals [7] can be described by the direct logarithmiclaw. This law predicts a linear relationship between theamount of the oxidised layer formed, in thickness or chargeunits, and the logarithm from the oxidation time. The origin ofthe direct logarithmic law was discussed in the literature andrespective mathematical models have been derived [4, 6, 8].These models, however, have not been applied widely andwere used for the analysis of only a few electrochemicalsystems. Full understanding of the problem requires extensionof kinetic studies to non-noble electrodes. Interestingly, thedirect logarithmic law is applicable also for non-electrochemical oxidation of metals [9–11], e.g. cobalt [12].
The process of oxidation of noble metals is usually re-versible [1–5], and their solubility in various aqueous mediais very often insignificant [13, 14]. For these metals, theamount of the oxidised layer formed can be easily deter-mined from the measurements of charge of its reduction.The situation becomes more complex for non-noble metalsdue to the irreversibility of the oxidation process, i.e. for-mation of hardly reducible layers, and often significantcontribution from dissolution of the electrode material. Lackof reliable methods of real surface area determination formany of non-noble metals further complicates the studies.
Cobalt has been selected as a subject of studies on theapplicability of direct logarithmic law for oxidation of non-noble electrodes. The surface of Co can be easily oxidisedwhen in contact with moisture or air [12, 15]. Despite itsnumerous applications [16–19], the mechanism of the earlystages of Co oxidation in aqueous alkaline solutions has notbeen studied extensively. Most works focus instead on thecomposition of Co oxidation products. For potentials morenegative than −500 mV vs. Hg|HgO, the proposed productsinclude CoO [20–24], hydrated CoO [25] or various formsof Co(OH)2 [20–24, 26–32].
M. Grdeń (*) : J. JagiełłoFaculty of Chemistry, University of Warsaw,Pasteura 1,02-093 Warsaw, Polande-mail: [email protected]
J Solid State Electrochem (2013) 17:145–156DOI 10.1007/s10008-012-1857-6

An analysis of polarisation curves for Co oxidation in1 M NaOH reveals that the process follows nucleation andgrowth mechanism with transfer of the first electron as therate-determining step [31]. In [33], Co oxidation at poten-tials more negative than −330 mV vs. Ag|AgCl was studiedin 0.1 and 1 M NaOH by means of rotating ring diskelectrode (RRDE), scanning electrochemical microscopyand atomic force microscopy. Although some dissolutionof the electrode was detected, it was concluded that Cooxidation is predominated by a solid state reaction. It wasalso pointed out that the oxidised layer is formed in a 3Dscheme rather than in a layer-by-layer manner. On the otherhand, formation of 2D structures during early stages ofoxidation of Co single crystals in 0.1 M NaOH was reportedin [29] on the basis of STM measurements. A solid statepathway of formation of Co(II) layer was also proposed in[22] for 0.2–8 M KOH with dissolution predominantly ofCo(OH)2 rather than metallic cobalt.
Cobalt dissolution is observed in alkaline solutions atpotentials as negative as −850 mV vs. Hg|HgO [20, 22,23, 33–37] and depends on pH [20]. It is not clear, however,whether the dissolution is a step in the overall process of Co(II) layer formation or a side reaction only [22, 25, 33].Further complications in studies of Co oxidation are relatedto the irreversibility of the process caused by an extendedCo dissolution or by the formation of a hardly reducibleoxidised layer [23, 34–36]. Such irreversibility complicatesthe application of Co oxidation charges in determination ofthe real surface area [38], as was already discussed in [34].
In this paper, we report the results of studies on earlystages of oxidation of electrodeposited cobalt electrode toCo(II) compounds in 0.1 M KOHaq. The necessity of appli-cation of methods allowing the evaluation of Co solubility(RRDE), reversibility of oxidation process and simultaneousdetermination of mass changes (electrochemical quartz crys-tal microbalance, EQCM) leads to selection of electrode-posited Co layers as subject of the studies rather thanmassive cobalt. The mechanism of the process was evaluat-ed on the basis of chronoamperometric, cyclic voltammetryand EQCM results. We focused on potential range wherethin oxidised layers with thickness below the monolayer areformed. The composition of the oxidised layer was deter-mined on the basis of EQCM and X-ray photoelectronspectroscopy results.
Experimental
Co electrodes were prepared by constant potential electro-deposition (−805 mV) from a bath containing 0.6 MCoSO4·7H2O (POCh, p.a.), 0.3 M KCl (Chempur, p.a.) and0.26 M H3BO3 (POCh, p.a.) [34], with a Co wire (JohnsonMatthey, 99.999%) and Ag|AgCl serving as a counter and as a
reference electrode, respectively. Various substrates were usedfor electrodeposition: Au wire or foil (99.9 %,Mint of Poland,in CVand X-ray photoelectron spectroscopy (XPS) measure-ments), gold-covered quartz crystals (EQCM measurements)and Pt disk (RRDE experiments). Electrodeposition efficien-cy, as estimated from EQCM experiments, was ca. 73 % andthe thickness of the deposit was in the range of 1,500 atomiclayers. A scanning electron microscope (LEO 435 VP) andEDX (Röntec EDR286) analysis showed that the obtaineddeposits tightly covered the substrate and no elements otherthan Co were detected; the latter was also confirmed by XPSanalysis and will be discussed later.
The obtained Co deposits were examined in a standardthree-electrode setup in 0.1 M KOH aqueous KOH (POCh,p.a.) solutions. Hg|HgO|0.1 M and Pt gauze wire or Au foilserved as reference and counter electrodes, respectively. Allpotentials in the text are referred to Hg|HgO. All electrolytesolutions were prepared with Millipore water (18.2 MΩ cm).The electrolyte was deoxygenated by bubbling N2
(99.999 %, Air Products) through the solution.The electrochemical quartz crystal microbalance setup
was composed of an EQCM crystal holder and controller(Model 230, Institute of Physical Chemistry, Warsaw,Poland), an EP20A potentiostat (Elpan), an EG20 (Elpan)linear sweep generator (Elpan), a Hewlett-PackardHP53131A universal counter and an Ambex LC-011-1612ADC/DAC converter [34]. Gold-covered AT-cut 5 MHzquartz crystals (ITR, Poland) were used. EQCM was cali-brated by means of Ag electrodeposition and stripping in1.5 mM AgNO3+0.1 M HClO4.
The rotating ring disk electrode experiment was performedwith an AFMT28T (Pine Instruments) Pt–Pt ring–disk elec-trode with collecting efficiency of 37 %, according to themanufacturer’s data, and controlled by an AFMSRX modu-lated speed rotator (Pine Instruments) and a CHI 700C(CHInstruments) bipotentiostat. The electrochemical behav-iour of Co layers with the thickness in the range of thousandsof atomic layers was found to be generally the same for Pt andAu substrates used for electrodeposition [34].
Ultra-high vacuum XPS measurements were performedin the Institute of Physical Chemistry of Polish Academy ofSciences with an ESCALAB-210 (VG Scientific) apparatususing an Al X-ray gun. After completing the electrochemi-cal experiments, the electrode was dried with N2 stream,placed in a tightly closed glass vial filled with N2 andtransported to the XPS measurements facility.
The electrochemical impedance spectroscopy (EIS)measurements were applied to determine the double layercapacitance used for estimation of the real surface area ofthe electrodes. The experiments were carried out with aCHI660D potentiostat. AC signal in the frequency range21,000–1 Hz with 5-mVamplitude was applied. The spectraacquisitions were preceded by 40 s of polarisation at
146 J Solid State Electrochem (2013) 17:145–156

potentials of the measurements. The spectra were fitted withEquivcrt software [39].
Results and discussion
Real surface area determination
The double layer capacitance measurements, by means ofEIS, were applied to determine the real surface area of theCo electrodes studied. Co(II) compounds, CoO and Co(OH)2, possess semiconducting properties [40] and the in-terfacial capacitance measured at potentials of surface oxi-dation contains contributions from the double layercapacitance and from the capacitance of these compounds.A separate determination of the double layer capacitanceand the capacitance of thin, semiconducting oxides/hydrox-ides is then required if the capacitance measurements are tobe applied to estimate the real surface area. This, however,can be complicated. Further complications are related to thefact that CoO and Co(OH)2 might differ in respect to semi-conducting properties. As a result, the contribution from thecapacitance of the oxidised layer might change with itscomposition. In such a case, tracking of the oxidation kinet-ics by the interfacial capacitance measurements is compli-cated. Hence, the capacitance was measured only in thepotential range of hydrogen evolution (HER) where the Cosurface is reduced (−1,300≥E≥−1,400 mV) without contri-bution from the capacitance of Co oxides/hydroxides.Examples of admittance spectra are shown in Fig. 1.
The spectra were fitted to the equivalent circuit presentedin the top right inset in Fig. 1 [41, 42]. The double layercapacitance is expressed as a constant phase element (CPE)[43, 44] Eq. 1:
ZCPE ¼ Q�1 iwð Þ�a ð1Þ
where Q is the preexponential factor (3.82 10−5–4.42 10−5
sαΩ−1cm2, apparently E independent), ω is angular frequen-cy, i is the imaginary unit and α is an exponential parametervarying from 0 to 1 (the latter for pure capacitance). Theobtained values of α were in the range of 0.91–0.92. Theother components of the circuits include ohmic resistance,Rohm, and the charge transfer resistance of HER, R1. ZCPEwas recalculated into the capacitance according to Eq. 2[44]:
Cdl ¼ Q Rohm�1 þ R1
�1� �ða�1Þ� �1 a=
ð2Þ
Because Rohm<< R1, the Cdl values in Eq. 2 are deter-mined by Rohm.
The results of the fitting procedure are presented in Fig. 1as solid lines, with the top left inset showing the calculated
values of Cdl as a function of potential. For −1,300≥E≥−1,400 mV, the values of Cdl are practically potential inde-pendent. For this E range, we arbitrarily assume the specificdouble layer capacitance of 20 μFcm−2, a typical value foraqueous electrolytes in the absence of significant specificadsorption [45]. The surface roughness factor obtained forthe electrodes studied in this work was in the range of 19–33. The amount of the oxidised layer formed can be calcu-lated on the basis of Co oxidation or Co(II) reductioncharge. We assume that for solid cobalt with hcp structureand lattice constant of 0.251 nm [46], the charge required forcomplete oxidation of the topmost layer of Co atoms to Co(II) equals 587 μCcm−2. In the further parts of the text,thickness is expressed in monolayers, which indicates thenumber of topmost layers of Co atoms completely oxidised,i.e. multiplicity of the charge of 587 μCcm−2. In the case ofCo(II) layer, the term monolayer means the amount of theoxidised layer containing the amount of Co(II) formed dur-ing complete oxidation of one full atomic layer of Co. Whenformation of a “chessboard-like” structure of the oxide/hydroxide is considered [2–4], such a Co(II) monolayercontains at least two atomic layers composed with mixedCo2+ and O2− or OH−, depending on the structure.
Cyclic voltammetry, EQCM and RRDE measurements
Figure 2 presents the cyclic voltammetry (bottom) andgravimetric (top) curves for an electrodeposited Co electrode
Fig. 1 Examples of impedance spectra recorded for an electrodepos-ited Co electrode in 0.1 M KOH at two potentials indicated on the plotsand presented in admittance coordinates. Points experimental data,lines fit to the equivalent circuit presented in the right top inset (seedetails in the text). Points for 4,638.7 Hz (plus sign), 852.5 Hz (aster-isk) and 97.7 Hz (multiplication symbol) are indicated. Left top insetcalculated Cdl values as a function of potential
J Solid State Electrochem (2013) 17:145–156 147

in 0.1 M KOHaq recorded from −1,200 mV to various anodicpotential limits, Ea, below −851 mV. Co oxidation currentsstart at potentials more negative than hydrogen evolutiononset (located at ca. −932 mV) and rise with the potentialincrease. These currents are accompanied by an increase in themass of the electrode, also observed at potentials more nega-tive than HER onset. The cathodic branch of CV curvesexhibits a peak, C1, at ca. − 1,040 mV, which is accompaniedby a mass decrease due to reduction of Co(II) compounds.Peak C1 partially overlaps HER currents. For Ea≥−890 mV,the mass loss due to surface reduction extends below theapparent end of C1 peak and the mass loss is also observedduring the initial stages of the subsequent anodic cycle (up toca. −1,040 mV). This indicates that Co(II) layer reductionextends beyond the C1 peak towards the region of HER.
In [34], it was shown that continuous potential cyclingof a Co electrode with anodic potential limit of −700 mVresults in the formation of a hardly reducible layer of Co(II) compounds. In Fig. 2, the irreversibility of the oxida-tion process is mirrored by an evolution of CV and EQCMcurves. Oxidation currents recorded for Ea0−890 mV andafter previous scans to Ea0−851 mV are smaller than thecurrents recorded before Ea was increased to −851 mV(Ea0−954 and −907 mV in Fig. 2). For Ea≤−907 mV, thegravimetric curve is closed, indicating the insignificance ofirreversible oxidation and dissolution. When Ea increasesbeyond −907 mV, the gravimetric curve becomes open dueto the accumulation of a hardly reducible oxidised layer[34]. Further increase in Ea results in continuous evolutionof both gravimetric and cyclic voltammetry curves, until aclosed gravimetric loop is obtained, similarly to the resultsobtained in 1 M KOH [34] (results not shown).
Figure 3 shows the ring currents recorded in RRDEexperiments in 0.1 M and 3 M KOH at 2,500 r.p.m. fortwo ring potentials (Er): −1,150 mV, where Co2+ species arereduced, and 0 mV, where Co2+ are oxidised to Co3+. Thepotentials were not corrected for liquid junction potentialbetween 0.1 M (reference electrode) and 3 M (workingelectrolyte) KOH. Considering the estimated mobility ofK+ ions [47], such a potential difference should not exceed30 mV [48], which is not a significant figure as compared tothe potential span of applied Er values.
When the disk potential (Ed) is scanned at potentialsmore positive than −950 mV, we observe an increase incurrents recorded in 3 M KOH, cathodic currents for Er0−1,150 mV and anodic ones for Er00 mV, due to the reduc-tion and oxidation of Co(II) soluble species, respectively(Fig. 3). These effects are absent in 0.1 M KOH, indicatingthe insignificance of Co dissolution in the latter medium.Other features observed on ring currents are attributed toprocesses of hydrogen evolution and oxidation. Hence, adecrease in cathodic current observed for both concentra-tions when Ed is scanned in the positive direction from −1,250 to −1,100 mV can be explained as a result of theinfluence of disk reactions on hydrogen evolution on Ptring. The decrease in the anodic ring current observed in0.1 M KOH for Er00 mV and for Ed changes from −1,250to −1,100 mV and which is absent in 3 M KOH is related tothe oxidation of H2 generated during cathodic polarisation.Because the solubility of H2 decreases with the increase inKOH concentration [49], this effect is less important for ahigher concentration of KOH. Based on RRDE results, wecan conclude that the solubility of electrodeposited Co elec-trode polarised up to −800 mV in 0.1 M KOH is negligibleand that the dissolution process cannot be considered as astep in the formation of the oxidised layer.
Fig. 2 Cyclic voltammetry (bottom) and gravimetric (top) curves for aCo electrode in 0.1 M KOH for various anodic potential limits indi-cated by vertical lines: a −1,005 mV, b −954 mV, c −907 mV, d −890 mV, e −810 mV. The order of changes of anodic potential limit wasas follows: −1,005, −954, −907, −810 and −890 mV; 25 mVs−1, roomtemperature; C1 reduction peak (discussed in the text). The zero massfor gravimetric curves is arbitrarily set at −1,200 mV for all curves
Fig. 3 Ring currents vs. disk potential for RRDE with the ring polar-ised at −1,250 and 0 mV at 0.1 and 3 M KOH, 2,500 r.p.m. Diskpotential scanned with 50 mVs−1 from −1,250 to −800 mV. The arrowsindicate the direction of changes in disk potential
148 J Solid State Electrochem (2013) 17:145–156
Constant potential oxidation
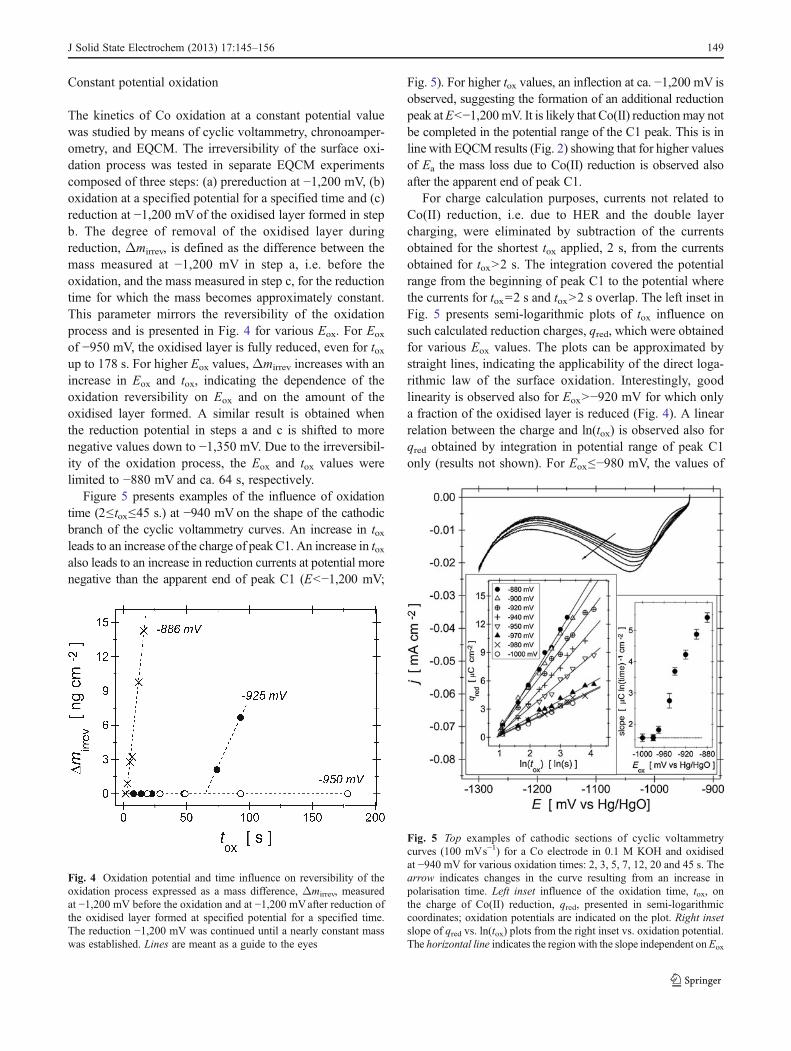
The kinetics of Co oxidation at a constant potential valuewas studied by means of cyclic voltammetry, chronoamper-ometry, and EQCM. The irreversibility of the surface oxi-dation process was tested in separate EQCM experimentscomposed of three steps: (a) prereduction at −1,200 mV, (b)oxidation at a specified potential for a specified time and (c)reduction at −1,200 mVof the oxidised layer formed in stepb. The degree of removal of the oxidised layer duringreduction, Δmirrev, is defined as the difference between themass measured at −1,200 mV in step a, i.e. before theoxidation, and the mass measured in step c, for the reductiontime for which the mass becomes approximately constant.This parameter mirrors the reversibility of the oxidationprocess and is presented in Fig. 4 for various Eox. For Eox
of −950 mV, the oxidised layer is fully reduced, even for toxup to 178 s. For higher Eox values,Δmirrev increases with anincrease in Eox and tox, indicating the dependence of theoxidation reversibility on Eox and on the amount of theoxidised layer formed. A similar result is obtained whenthe reduction potential in steps a and c is shifted to morenegative values down to −1,350 mV. Due to the irreversibil-ity of the oxidation process, the Eox and tox values werelimited to −880 mV and ca. 64 s, respectively.
Figure 5 presents examples of the influence of oxidationtime (2≤tox≤45 s.) at −940 mV on the shape of the cathodicbranch of the cyclic voltammetry curves. An increase in toxleads to an increase of the charge of peak C1. An increase in toxalso leads to an increase in reduction currents at potential morenegative than the apparent end of peak C1 (E<−1,200 mV;
Fig. 5). For higher tox values, an inflection at ca. −1,200 mV isobserved, suggesting the formation of an additional reductionpeak atE<−1,200mV. It is likely that Co(II) reductionmay notbe completed in the potential range of the C1 peak. This is inline with EQCM results (Fig. 2) showing that for higher valuesof Ea the mass loss due to Co(II) reduction is observed alsoafter the apparent end of peak C1.
For charge calculation purposes, currents not related toCo(II) reduction, i.e. due to HER and the double layercharging, were eliminated by subtraction of the currentsobtained for the shortest tox applied, 2 s, from the currentsobtained for tox>2 s. The integration covered the potentialrange from the beginning of peak C1 to the potential wherethe currents for tox02 s and tox>2 s overlap. The left inset inFig. 5 presents semi-logarithmic plots of tox influence onsuch calculated reduction charges, qred, which were obtainedfor various Eox values. The plots can be approximated bystraight lines, indicating the applicability of the direct loga-rithmic law of the surface oxidation. Interestingly, goodlinearity is observed also for Eox>−920 mV for which onlya fraction of the oxidised layer is reduced (Fig. 4). A linearrelation between the charge and ln(tox) is observed also forqred obtained by integration in potential range of peak C1only (results not shown). For Eox≤−980 mV, the values of
Fig. 4 Oxidation potential and time influence on reversibility of theoxidation process expressed as a mass difference, Δmirrev, measuredat −1,200 mV before the oxidation and at −1,200 mVafter reduction ofthe oxidised layer formed at specified potential for a specified time.The reduction −1,200 mV was continued until a nearly constant masswas established. Lines are meant as a guide to the eyes
Fig. 5 Top examples of cathodic sections of cyclic voltammetrycurves (100 mVs−1) for a Co electrode in 0.1 M KOH and oxidisedat −940 mV for various oxidation times: 2, 3, 5, 7, 12, 20 and 45 s. Thearrow indicates changes in the curve resulting from an increase inpolarisation time. Left inset influence of the oxidation time, tox, onthe charge of Co(II) reduction, qred, presented in semi-logarithmiccoordinates; oxidation potentials are indicated on the plot. Right insetslope of qred vs. ln(tox) plots from the right inset vs. oxidation potential.The horizontal line indicates the region with the slope independent onEox
J Solid State Electrochem (2013) 17:145–156 149

the slope of these lines are independent on Eox, while forhigher oxidation potentials the slope increases with Eox
(right inset in Fig. 5). It should be pointed out that forEox>−920 mV, the measured values of the slopes are mostlikely reduced due to the incomplete reduction of the oxi-dised layer (Fig. 4), but their increase with Eox indicates anincrease in the oxidation rate with increasing potential alsofor this Eox range.
Figure 6 presents mass change, Δm, vs. oxidation charge,qox, profiles for constant potential oxidation for Eox changingfrom −1,000 to −890 mV. Before applying Eox, the electrodewas reduced at −1,250 mV. Qualitatively and quantitativelysimilar results are obtained also for prereduction at −1,350 mV.qox was obtained by integration of chronoamperometric curves.For potentials in the HER region (Eox<−926 mV), the chargedue to Co oxidation used for construction of the plots was takenonly for a short period of tox when the oxidation current is muchhigher than the steady state currents due to HER. Hence, forEox<−926 mV, the plots cover only a very narrow range of qoxvalues. We note that when extrapolated steady state HERcurrents are subtracted from Co oxidation currents the obtainedvalues of the slopes of mass vs. charge plots change by nomorethan ca. 7 % as compared to that presented in Fig. 6. One notesthat for Eox<−916 mV the plots can be approximated by singlestraight lines over the whole tox period. Such a constant mass-to-charge ratio indicates that the composition of the oxidationproducts does not change with the progress in the process. ForEox≥−916 mV and qox>0.05 mC cm−2, a departure fromlinearity is observed and an additional one linear section isestablished. This effect takes place in the Eox range where anincrease in the irreversibility of the oxidation process, i.e.Δmirrev≠0, is observed (see Fig. 4).
The slopes of Δm vs. qox plots can be recalculated intomass per mole ratios,Ma. The latter value represents the masschange per number of the electrons exchanged in the processand is shown in the inset in Fig. 6a as a function of Eox. ForEox≥−916 mV, the inset displaysMa values only for the initiallinear section of Δm vs. qox plots for low values of tox.Comparative experiments performed in 0.1 M NaOHaq showno influence of cation identity: Ma obtained for NaOH werewithin±6 % of the values for 0.1 M KOH. The maximumvalue ofMa of ca. 12.5 gmol−1 is obtained for Eox0−988 mV.For the lowest Eox applied (−1,000 mV), the Ma value is ca.11.3 gmol−1. An increase in potential above −988 mV leads toa decrease in Ma, which eventually reaches the value in therange of 6.5–5.5 gmol−1 for Eox>−922 mV.
The presented Ma values point to changes in compositionof the Co oxidation products: the oxidised layer formed atEox<−970 mV contains significant amounts of Co(OH)2(theoretical Ma017 gmol−1), while at more positive poten-tials the presence of CoO is detected (theoretical Ma08 gmol−1). These conclusions are in line with XPS resultswhich are discussed further in the text. The obtained order
of formation of Co(II) compounds corresponds well to theorder of standard potentials, E0, of Co(OH)2 and CoO [22,50, 51], with E0 of the latter being more positive than for Co(OH)2. The fact that the obtained Ma values are smaller thanthe ones theoretically predicted is attributed to participationof adsorbed H2O/OH
− in the oxidation process. For Eox<−970 mV, the lowering of Ma values due to a contribution
Fig. 6 Mass change, Δm, vs. oxidation charge, qox, profiles recordedduring oxidation of a Co electrode in 0.1 M KOH at various Eox: a from−937 to −890 mV, b from −1,000 to −948 mV. For clarity, the curves forvarious values of Eox are arbitrarily shifted in the mass scale. Applicationof the oxidation potential was preceded by a reduction of the electrode at−1,250 mV. Inset in a, influence of the oxidation potential on molar massof Co oxidation products,Ma, obtained from the slopes ofΔm vs. qox plots
150 J Solid State Electrochem (2013) 17:145–156

from the formation of some amounts of CoO should also beconsidered. A comparison of Figs. 4 and 6 indicates theexistence of a relation between the oxidised layer compositionand the reversibility of the oxidation: Δmirrev≠0 is observedfor Eox range where Ma falls below 8 gmol−1 (Fig. 4).
Intermediate values of Ma observed in the inset in Fig. 6afor −975≤Eox≤−930 mV point to generation of a layer com-posed of both CoO and Co(OH)2. The formation of a layeredstructure composed of the oxide and hydroxide was proposedfor Co oxidation in alkaline electrolytes on the basis of ellip-sometric measurements [52]. This was observed, however, forthe multilayered oxidised layers with thickness in the range ofa few nanometers. The thickness of the oxidised layers studiedin this work can be estimated on the basis of the oxidationcharges. For Eox0−890 mV and tox064 s, we obtain thesurface coverage of ca. 45 %. This value suggests that for−975≤Eox≤−930 mV, the CoO and Co(OH)2 should formseparate 2D areas rather than a multilayered 3D structure.
The second linear section of Δm vs. qox plots observedfor Eox −916 mVand for longer tox values has a slope of ca.15 gmol−1. We attribute this value to the formation ofhydrated CoO rather than Co(OH)2, the effect being con-firmed by XPS results which are presented in the later partof the text, showing the formation of significant amounts ofCoO in this Eox range. As it will be shown later, Co(II) layercompositions determined from EQCM measurements corre-spond to XPS results (Fig. 9), indicating that EQCM re-sponse can be interpreted in terms of pure mass changes.
When the molar mass of the oxidation products does notchange during the process, the Δm vs. tox profiles are indica-tors of the kinetics of the reaction with similar mathematicsapplied as in the case of charge vs. time relation. Figure 7shows Δm vs. ln(tox) plots for Co oxidation at −1,000≤Eox≤−890 mVand for tox of up to 8.6–64 s. The respective qox vs.ln(tox) plots are presented in Fig. 8; for Eox<−916 mV, thecharge used for construction of the plots is the one recordedfor the initial tox period when the oxidation current is muchhigher than the steady state HER currents. Both figures wereconstructed on the basis of the data presented in Fig. 6.
The inset in Fig. 8a shows a magnification of initialsections of chronoamperometric curves recorded withRRDE at two oxidation potentials and for two rotation rates.The shape of these transients is typical for all Eox valuesapplied and also for stationary constant potential oxidation.One would note the absence of a nucleation peak [53, 54],indicating that the nucleation and growth models, both 2Dand 3D with bulk and surface diffusion, are not applicable.Rotation rate-independent current transients indicate that therate of the oxidation process is not determined by transportin the electrolyte.
Figures 7 and 8 show that:1. For Eox<−948 mV, the Δm vs. ln(tox) plots reveal a
good linearity for the entire tox range (Fig. 7). For higher Eox
values, only the initial section of the plots is linear; forlonger tox values, a departure from linearity is observed:downwards for Eox0−937 and −948 mV and, more pro-nounced, upwards for Eox≥−926 mV.
2. For Eox<−916 mV, the qox vs. ln(tox) plots are linearwith a single slope over the whole tox range presented(Fig. 8). It should be noted that the oxidation currentsrecorded in this Eox range can be influenced by contributionfrom parallel currents due to HER. However, the goodlinearity of qox vs. ln(tox) plots correspond well to the linearshapes of Δm vs. ln(tox) (Fig. 7) and qred vs. ln(tox) (Fig. 5)plots observed in the same range of Eox. This indicates thatthe plots presented in Fig. 8 can be treated as reliableindicators of Co oxidation mechanism even at potentials ofHER. For Eox≥−916 mV, two linear sections are observed inFig. 8. The length of the first linear section (low tox values)decreases with an increase in Eox. The second linear section,observed for Eox≥−916 mV, has a higher slope, starts at
Fig. 7 Semi-logarithmic plots of mass change, Δm, vs. oxidation timefor oxidation of a Co electrode in 0.1 M KOH for various oxidationpotentials indicated on the plot (data from Fig. 6). For clarity, the curvesfor various values of Eox are arbitrarily shifted in the vertical scale. Theinset shows slopes of Δm vs. ln(tox) plots as a function Eox. The hori-zontal line in the inset indicates the region where the slope is independentonEox. The error bars for the inset are comparable to the size of the points
J Solid State Electrochem (2013) 17:145–156 151

longer oxidation times and extends to ln(tox) of ca. 3.2,where further changes in the shape of the plots are seen.
3. The slopes of linear sections of both Δm vs. ln(tox) andqox vs. ln(tox) plots are presented in insets in Figs. 7 and 8b,respectively. ForΔm vs. ln(tox) plots, the slopes were dividedby Ma/F, where F is the Faraday constant. Such obtainedvalues are independent on the composition of the oxidationproducts and are direct indicators of the kinetics of the processfor tox range for which Ma is constant (Fig. 6). One notes thatfor Eox≤−980 mV, the slopes are independent on Eox (insets inFigs. 7 and 8b, respectively). For Eox>−980 mV, the slopes ofboth plots increase with an increase in Eox. A similar shape ofslope vs. Eox relation was obtained also from cyclic voltam-metry measurements (Fig. 5).
4. The values of the slopes obtained from CV (Fig. 5) aresmaller compared to CA (Fig. 8b): from 1.5 to 1.9 times forEox below −920 mVand up to 5.8 times for −880 mV. Thesedifferences mirror the complications with separation of over-lapping currents of HER and Co(II) reduction in CV experi-ments. Further on, the irreversibility of Co(II) formation forEox>−920 mV leads to an incomplete reduction of Co(II)layer during single, negative CV scan and increases the differ-ences between values of the slopes obtained for CVand CA.
5. Changes in the shape/slope of Δm vs. ln(tox) and qoxvs. ln(tox) plots (Figs. 7 and 8) can be linked to the evolutionof Δm vs. qox curves (Fig. 6). Δm vs. qox plots exhibitdepartures from linearity for Eox≥−926 mV and this corre-sponds to (a) a departure from linearity of Δm vs. ln(tox)plots (Eox≥−926 mV in Fig. 7) and (b) the appearance of thesecond linear section in qox vs. ln(tox) curves (Eox≥−916 mV in Fig. 8a).
X-ray photoelectron spectroscopy
Very thin oxidised layers with estimated thickness not greaterthan 50 % of the monolayer are hard to measure using ex situtechniques. Complications are related to the disputable stabil-ity of such thin layers when examined under ex situ conditionsand to the accuracy of separation of a small Co(II) photopeakfrom a prevailing Co(0) signal. In order to obtain more reliableresults of ex situ measurements, the XPS technique wasapplied for the analysis of the oxidised layers with thicknessgreater than those presented in Figs. 6, 8 and 9.
Figure 9 presents the XPS spectra recorded for Co sam-ples oxidised for 300 s at two potentials (−980 (Fig. 9b)and −890 mV (Fig. 9c)) and for a Co deposit subjected toetching with Ar+ gun (Fig. 9a). A detailed discussion of thestructure of Co(II) spectra can be found elsewhere [55–58];here we focus mainly on the binding energies of main, non-deconvoluted Co 2p3/2 peak and its satellites located athigher energies. For Ar-sputtered Co(0) (Fig. 9a), we ob-serve the main 2p3/2 peak at 778.2 eV and a 2p1/2 peak at793.2 eV, in agreement with the literature [55, 59]. The
Fig. 8 Semi-logarithmic plots of oxidation charge, qox, vs. oxidation timerecorded during constant potential oxidation in 0.1 M KOH at various Eox(data from Fig. 6): a from −948 to −890 mV, b from −1,000 to −975 mV.The arrows in a indicate the two slopes of the linear section of the plotsdiscussed in the text. Inset in a, initial sections of chronoamperometriccurves for oxidation of a Co electrode in RRDE experiments for twooxidation potentials: −1,000 mV (2,500 r.p.m.) and −950 mV (disk cur-rents, 2,500 and 0 r.p.m.). Inset in b, slopes of qox vs. ln(tox) plots as afunction Eox. The horizontal line in the inset indicates the region where theslope is independent on Eox. The open circles represent the slopes of thesecond linear sections observed forEox>−920mVand discussed in the text.The error bars for the inset are comparable to the size of the points
152 J Solid State Electrochem (2013) 17:145–156

satellite of 2p3/2 peak is usually poorly developed (ca. 781 eV[55]) and cannot be distinguished from spectrum a withoutdeconvolution. Figure 9a indicates that the obtained electro-deposits are composed of the metallic Co. The spectrum for−980 mV (Fig. 9b) shows a decrease in Co(0) peaks uponoxidation time and reveals new developing peaks: broad 2p3/2 peak at ca. 780.9 eV and 2p1/2 at 796.5 eV. The spectrumrecorded for the sample oxidised at −890 mV shows Co(II)peaks at energies lower than for −980 mV: a main 2p3/2 peakat 780.2 eV with a satellite at 785.7 eV and a 2p1/2peak at796.2 eV with a satellite at 803 eV.
Literature data [55, 58, 59] indicate that for CoO the 2p3/2 and 2p1/2 peaks are located at binding energies lower thanfor Co(OH)2. The spectra shown in Fig. 9 indicate theexistence of Co(OH)2 at −980 mV and CoO at −890 mV,in agreement with EQCM data (Fig. 6). The fact that theXPS results are in line with EQCM data indicates that thefrequency response of the microbalance is determined bypure mass changes. We note that for Eox0−890 mV (Fig. 9(c)), the ratio between areas of 2p1/2 peak and its satellite isca. 2, indicating the absence of Co(III) forms for which thesatellite should be much smaller as compared to the main2p1/2 peak or even not observed [55, 60].
Discussion of the oxidation model
Three independent techniques, CV, CA and EQCM, revealthat early stages of Co oxidation in an alkaline electrolyte,
i.e. up to ca. 50 % of the single monolayer, follow a directlogarithmic law (Figs. 5, 7 and 8). These three techniquesalso reveal that for Eox>−980 mV, the slope of semi-logarithmic plots increases with Eox, while for lower oxida-tion potential values the slope is Eox independent (insets inFigs. 5, 7 and 8b).
For electrochemical oxidation, the direct logarithmic lawof oxide/hydroxide growth was discussed in [4, 6, 8] and therespective models have been derived. In [4], it was assumedthat oxidation leads to the formation of a chessboard-likestructure with uniformly mixed metal and oxygen/OH− ions.The rate-determining step (r.d.s.) in this model is a rotationof metal–oxygen dipoles in the electric field established atthe interface (“place exchange” model). The main equationused in this model has the following form (one electrontransfer [1, 4]) Eq. 3:
q ¼ a ln toxð Þ þ b ð3Þ
with Eq. 3a:
a ¼ dMLArRTF"02N2
Abμ2
ð3aÞ
where β is the symmetry factor (assumed to be 0.5), μ is thedipole moment of rotating species, dML is the thickness of themonolayer of rotating species and the other parameters havetheir usual meaning. The intercept b is a function of Ar, μ, βand ε0 and depends also on a rate constant, k, potential dropacross the layer of the dipoles, ΔE, and on the surface poten-tial due to the presence of water molecules in the double layer,Δφ. The exact mathematical form of the intercept is presentedin [1, 4], and in this paper we do not discuss this parameter indetail since it contains too many unknown parameters (k,ΔE,Δφ). The dependence of the intercept b on potential is com-plex [1, 4], while the slope of Eq. 3 is potential independent.This model was applied mainly for the formation of oxidisedlayers with thickness not greater than that of the monolayer[1–3], which corresponds to the range of thickness of Co(II)layers studied in this work.
The model considered in [6] assumes the oxidation pro-cess following nucleation and growth pathway. The follow-ing equation was derived [6] Eq. 4:
q ¼ a0η log toxð Þ � a0η6
logðqÞ þ b0 ð4Þ
with Eq. 4a:
a0 ¼ 3ze0ΠvfkBTσ2
ð4aÞ
where v is the volume of the molecule, z is the number of theelectrons exchanged, e0 is the elementary charge, η is the
Fig. 9 XPS spectra recorded for Co electrodes studied (a) after clean-ing by Ar+ sputtering and after oxidation (b) at −980 mV for 300 s and(c) at −890 mV for 300 s. The vertical lines show the locations of 2p3/2peaks for Co(0) (778.2 eV), Co(II) in CoO (780.2 eV) and Co(II) in Co(OH)2 (780.9 eV)
J Solid State Electrochem (2013) 17:145–156 153
overpotential, σ is the surface free energy, f is a factor usedfor conversion between charge and thickness units and theother terms have their usual meaning. Similarly to Eq. 3, theintercept b′ in Eq. 4 is a function of a′ and depends also on ηand on the electrochemical rate constant [6]. When a′η is notgreater than unity, the term containing log(q) can beneglected in Eq. 4 and the slope of the semi-logarithmicrelation between the charge and log(tox) is a linear functionof the potential.
The point defect model [8, 61, 62] also predicts a linearrelation between the amount of the oxidised layer formedand ln(tox) with the slope inversely dependent on the electricfield, i.e. applied potential. This model, however, is pre-dicted for the thickness above one monolayer [8], beyondthe thickness range studied in the present work.
The existence of a potential-independent slope of semi-logarithmic plots, in agreement with the “place exchange”model Eq. 3, is observed in Figs. 5, 7 and 8b for Eox≤−980 mV. This Eox range corresponds well to potentialswhere Co(OH)2 is the prevailing product of the oxidationprocess (Fig. 6a). Application of the “direct logarithmiclaw” model for the formation of Co(OH)2 requires someassumptions about the details of the process. First, we as-sume that both electrons to be exchanged during Co atomoxidation are transferred in separate steps [63–65]. The firststep in the oxidation process would then be the formation ofCo(OH) structures at the electrode surface. Further on, it islikely that the rotating species is Co(OH) rather than Co(OH)2 since the former should possess a relatively highdipole moment. Hence, the order of the steps in the processof Co oxidation at Eox≤−980 mV is expected to be the sameas for Ni oxidation as discussed in [7]: (1) fast transfer of thefirst electron to form Co(OH), (2) slow rotation of Co(OH)dipole (rate-determining step) and (3) fast transfer of thesecond electron and formation of Co(II) hydroxidemolecule.
At Eox>−980 mV, where the presence of CoO is detected(Figs. 6 and 9), the values of the slopes in Figs. 5, 7 and 8bare higher than for Co(OH)2 region and, in contrast to Eq. 3,the slopes strongly depend on Eox. As was discussed earlier(Fig. 6a), for −975≤Eox≤−930 mV, the electrode surfacecontains oxidised areas composed of CoO and Co(OH)2. Weassume that the formation of CoO and Co(OH)2 proceedsindependently, both according to the direct logarithmic law.Increasing the contribution from CoO would result in con-tinuous changes of the slopes with Eox. However, due to acontribution from OH bond, the Co(OH) dipole momentshould be smaller than for CoO and slope a in Eq. 3a inthe potential region of CoO formation should be smallerthan for Co(OH)2, opposite to what is seen Figs. 5, 7 and 8b.Further on, the slope of the first linear section from Fig. 8aincreases also at potentials where the oxidised layer compo-sition is unchanged (constant Ma in Fig. 6a). Thus, it is
likely that the rate of oxidation not only depends on thecomposition but is also strongly influenced by the oxidationpotential itself. The nucleation model (Eqs. 4 and 4a) alsoseems to be not applicable. The current–time profilesrecorded for Co oxidation (inset in Fig. 8a) do not exhibita nucleation peak, usually observed for nucleation andgrowth mechanism. Although a model of 2D layer growthcontrolled by instantaneous nucleation and according toAvrami theorem predicts a current decay without the peak[66], a linear relationship between the charge and ln(tox) isnot obtained [66]. Further on, Eq. 4 predicts a linear relationbetween the slope of q vs. ln(tox) plots and potential, whileFigs. 5, 7 and 8b indicate that the relation can be roughlyapproximated by a straight line only for CA.
A potential influence on the slope of the direct logarith-mic law describing metal oxidation (Eqs. 3 and 3a) wasobserved for oxidation of Au [4] and Pt [5] in acidic sol-utions and for polycrystalline Ni in 0.5 M KOH [7]. In thecase of Au, the effect was explained as a result of anionadsorption, while for the nickel it was attributed to variousoxidation rates of different crystallographic planes exposedto the electrolyte. In all of these cases, however, the poten-tial influence on the slopes was smaller than those presentedin Figs. 5, 7 and 8b (ca. 270 % for 200 mV range for Au [4],ca. 100 % for 200 mV range for Pt [5] and below 10 % for200 mV range for Ni (room temperature [7])) as comparedto 300–900 % for 100 mV range measured in this work forCV and CA, respectively. Such huge changes cannot beattributed to the influence of crystallographic orientationon the oxidation process, especially when one considers thatthe potential influence on the slope of the direct logarithmiclaw was observed also for Pt single crystals [5]. Intuitively,the extent of the potential impact of the discussed slopescannot be attributed to the contribution from E-dependention adsorption. When adsorption of cations is excluded(discussion of Fig. 6), the only ion which can adsorb onthe electrode surface is OH−. These ions do not block thesurface for surface oxidation and most likely participatedirectly in the surface oxidation process. They may affectthe surface oxidation process by changing the electric fieldat the interface, but the extent of this effect seems to berather smaller than the Eox influence on the slopes of theplots in Figs. 5, 7 and 8b.
The discussed potential influence on the slopes of semi-logarithmic plots cannot be also attributed to the irrevers-ibility of the oxidation process: the effect of the slopeincrease is observed already for Eox and tox range wherethe oxidation process can be considered as reversible(Fig. 4).
The preceding discussion shows that oxidation of Co in0.1 M KOH at Eox>−980 mV cannot be successfully de-scribed by already known oxidation models [4, 6]; a newmodel of surface oxidation process should be considered.
154 J Solid State Electrochem (2013) 17:145–156

The presented results allow us to draw some conclusionswhich may be helpful in the development of a new surfaceoxidation model. The most striking difference between pro-cesses taking place above and below −975 mV is related tothe form of oxygen containing species present in the oxi-dised layer. For Eox<−975 mV, this is mainly OH−, whilefor Eox>−975 mV the oxidised layer contains significantamounts of O2−. While OH− ions are present in the electro-lyte or can be easily formed during H2O dissociation, O2−
must be generated in a separate reaction of H2O/OH− de-
composition and such a step must be included in the overalloxidation mechanism for Eox>−980 mV. Further on, thedirect logarithmic law requires the driving force of theprocess to decrease with the progress in the process (or,alternatively, energy barrier must increase with the prog-ress). Next, a smooth transition between mechanisms takingplace below and above −980 mV is expected when Eox
increases. Finally, it is likely that the r.d.s. is not the electrontransfer, which is assumed to be very fast, but other process,e.g. H2O decomposition to form O2− or phase oxideformation.
Based on the cited suppositions, we can briefly discussthe possible steps contributing to Co oxidation process atEox>−980 mV. When Eox increases, the rate of transfer ofboth electrons also increases, and for high-enough values ofEox the transfer of the second electron may proceed beforethe slow “place exchange” step [4]. This leads to the forma-tion of Co2+ species stabilised at the surface by interactionwith OH− or H2O. In the subsequent steps, OH−/H2O de-compose to generate O2−, and a phase oxide is formed. Thelatter steps are expected to be the r.d.s. (fast transfers of bothelectrons are treated as in a pseudo-equilibrium state).Charged species take part in H2O decomposition to O2−,and the rate of this step may depend on Eox. The electricfield at the interface changes with oxidation progress due tothe formation of oxide, and this may increase the energybarrier when tox increases, leading to the shape of timeprofiles shown in Figs. 5, 7 and 8. The said scenario resem-bles an EEC mechanism but with the rate of the chemicalstep (C) affected by the electric field at the interface.
Conclusions
The oxidation of electrodeposited cobalt electrodes has beenstudied in 0.1 M KOHaq solution in the potential range−1,000 to −880 mV vs. Hg|HgO where Co(II) compoundsare formed. Four electrochemical techniques were applied tostudy the mechanism of the process: cyclic voltammetry,chronoamperometry, electrochemical quartz crystal micro-balance and rotating ring disk electrode. We found that:
– The solubility of electrodeposited Co in 0.1 M KOH atpotentials more negative than −800 mV vs. Hg|HgO is
negligible and does not constitute a step in the processof formation of the oxidised layer.
– The reversibility of the oxidation process decreaseswhen the oxidation potential and the amount of theoxidised layer formed increase.
– EQCM and X-ray photoelectron spectroscopy experi-ments reveal the formation of significant amounts of Co(OH)2 at oxidation potentials below −975 mV vs. Hg|HgO, while at potentials positive to this value CoOexistence is detected.
– Three techniques (CV, CA and EQCM) reveal thatbelow −880 mV vs. Hg|HgO, the oxidation of Coelectrode follows a direct logarithmic law.
– An analysis of direct logarithmic law shows that at poten-tials not higher than −980 mV vs. Hg|HgO, the “electricfield-assisted place exchange” model can correctly de-scribe the oxidation process. At more positive potentials,this model does not correctly describe the influence ofoxidation potential on the process in question. Furtherelucidation of the mechanism linked to the direct loga-rithmic law of growth of oxidised layers is required.
Acknowledgments This work was financially supported by the Min-istry of Science and Higher Education (grant no. NN204 125037).
Open Access This article is distributed under the terms of the Crea-tive Commons Attribution License which permits any use, distribution,and reproduction in any medium, provided the original author(s) andthe source are credited.
References
1. Alsabet M, Grdeń M, Jerkiewicz G (2006) J Electroanal Chem589:120–127
2. Dall'Antonia LH, Tremiliosi-Filho G, Jerkiewicz G (2001) J Elec-troanal Chem 502:72-81
3. Tremiliosi-Filho G, Dall’Antonia LH, Jerkiewicz G (2005) J Elec-troanal Chem 578:1–8
4. Conway BE, Barnett B, Angerstein-Kozlowska H, Tilak BV(1990) J Chem Phys 93:8361–8373
5. Conway BE, Jerkiewicz G (1992) J Electroanal Chem 339:123–1466. Gilroy D (1976) J Electroanal Chem 71:257–2777. AlsabetM, GrdeńM, Jerkiewicz G (2011) Electrocatalysis 2:317–3308. Chao CY, Lin LF, Macdonald DD (1981) J Electrochem Soc
128:1187–11949. Fromhold AT, Cook EL (1967) Phys Rev 163:650–664
10. Lawless KR (1974) Rep Prog Phys 37:231–31611. Smeltzer WW, Young DJ (1975) Prog Solid State Chem 10:17–5412. Tompkins HG, Augis JA (1981) Oxid Met 16:355–36913. Łukaszewski M, Czerwiński A (2006) J Electroanal Chem 589:38–4514. Łukaszewski M, Siwek H, Czerwiński A (2010) J Solid State
Electrochem 14:1279–129215. Moyes RB, Roberts MW (1977) J Catal 49:216–22416. Wohlfahrt-Mehrens M, Schenk J, Wilde PM, Abdelmula E,
Axmann P, Garche J (2002) J Power Sources 105:182–18817. Kleperis J, Wójcik G, Czerwiński A, Skowroński J, Kopczyk M,
Bełtowska-BrzezińskaM (2001) J Solid State Electrochem 5:229–249
J Solid State Electrochem (2013) 17:145–156 155
18. Wang S (2006) JOM-J Min Met Mat Soc 58:47–5019. Davis JR (2000)Nickel, cobalt, and their alloys. ASM,Materials Park20. Ismail KM, Badawy WA (2000) J Appl Electrochem 30:1303–131121. Larramona G, Gutiérrez C (1990) J Electroanal Chem 293:237–25222. Behl WK, Toni JE (1971) J Electroanal Chem 31:63–7523. Burke LD, Lyons ME, Murphy OJ (1982) J Electroanal Chem
132:247–26124. Jayaraman TR, Venkatesan VK, Udupa HVK (1975) Electrochim
Acta 20:209–21325. Sato N, Ohtsuka T (1978) J Electrochem Soc 125:1735–174026. Novoselsky IM,MenglishevaNR (1984) ElectrochimActa 29:21–2727. Foelske A, Strehblow HH (2002) Surf Interface Anal 34:125–12928. Göhr H, Krüger H (1966) Electrochim Acta 11:835–84729. Foelske A, Kunze J, Strehblow HH (2004) Surf Sci 554:10–2430. Santamaria M, Adragna E, Di Quarto F (2005) Electrochem Solid-
State Lett 8:B12–B1531. Cowling RD, Riddiford AC (1969) Electrochim Acta 14:981–98932. Jung H, Alfantazi A (2010) Corrosion 66:035002–0350021233. Erts D, Ahlberg E, Asbjörnsson J, Olin H, Prikulis J (1998) Appl
Phys A—Mat Sci Process 66:S477–S48034. Grdeń M, Klimek K, Rogulski Z (2009) Electrochem Commun
11:499–50335. Gomez Meier H, Vilche JR, Arvia AJ (1982) J Electroanal Chem
134:251–27236. Aledresse A, Alfantazi A (2004) J Mater Sci 39:1523–152637. Abd El Rehim SS, El Basosi AA, Osman MM (1993) J Electroanal
Chem 348:99–10638. Correia AN, Machado SAS, Avaca LA (1999) Electrochem Com-
mun 1:600–60439. Boukamp BA (1986) Solid State lonics 20:31–4440. Pontinha M, Faty S, Walls MG, Ferreira MGS, Da Cunha Belo M
(2006) Corr Sci 48:2971–298641. Elumalai P, Vasan HN, Munichandraiah N, Shivashankar SA
(2002) J Appl Electrochem 32:1005–1010
42. Jukic A, Piljac J, Metikoš-Hukovic M (2001) J Mol Cat A - Chem166:293–302
43. Sluyters-Rehbach M (1994) Pure Appl Chem 66:1831–189144. Brug GJ, Van Den Eeden ALG, Sluyters-Rehbach M, Sluyters JH
(1984) J Electroanal Chem 176:275–29545. Trasatti S, Petrii OA (1991) Pure Appl Chem 63:711–73446. Nishizawa T, Ishida K (1983) Bull Alloy Phase Diagr 4:387–39047. Koneshan S, Rasaiah JC, Lynden-Bell RM, Lee SH (1998) J Phys
Chem B 102:4193–420448. Norkus E, Vaškelis A (1996) Electroanalysis 8:171–17249. Ruetschi P, Amlie RF (1966) J Phys Chem 70:718–72350. Pourbaix M (1966) Atlas of electrochemical equilibria in aqueous
solutions. Pergamon, Oxford51. Bard AJ (ed) (1975) Encyclopedia of electrochemistry of the
elements, vol III. CRC, Boca Raton52. Ohtsuka T, Sato N (1983) J Electroanal Chem 147:167–17953. Thirsk HR, Harrison JA (1972) A guide to the study of electrode
kinetics. Academic, London54. Scharifker B, Hills G (1983) Electrochim Acta 28:879–88955. Biesinger MC, Payne BP, Grosvenor AP, Lau LWM, Gerson AR,
Smart RSC (2011) Appl Surf Sci 257:2717–273056. Gupta RP, Sen SK (1975) Phys Rev B 12:15–1957. Yang J, Liu H, Martens WN, Frost RL (2010) J Phys Chem C
114:111–11958. Kim KS (1975) Phys Rev B 11:2177–218559. Mclntyre NS, Cook MG (1975) Anal Chem 47:2208–221360. Casella IG, Guascito MR (1999) J Electroanal Chem 476:54–6361. Pyun SI, Hong MH (1992) Electrochim Acta 37:327–33262. MacDonald DD (2011) Electrochim Acta 56:1761–177263. Evans DH (2008) Chem Rev 108:2113–214464. Gileadi E (2002) J Electroanal Chem 532:181–18965. Devanathan MAV (1972) Electrochim Acta 17:1683–169766. Armstrong RD, Harrison JA (1969) J Electrochem Soc 116:328–
331
156 J Solid State Electrochem (2013) 17:145–156