Embed Size (px)
Citation preview

Oxy-Fuel Combustion: Laboratory and Pilot Scale Experiments
E. J. Miklaszewski, Y. Zheng, L. Qiao and S. F. Son Department of Mechanical Engineering
Purdue University West Lafayette, IN 47907
Plus some initial calculations (Qiao)!

Presentation Outline
2
Oxy-fuel motivation Laboratory Experiments Initial Numerical Simulations Pilot Scale Experiments Continuing Work

Oxy-fuel Motivation Clean Coal Options:
Oxygen combustion (Oxyfuel) Concentrated CO2 in products
Amine (or others) scrubbing for new or existing plants Extracts the CO2 from the flue gas using a
regenerable sorbent-catalyst such as momoethanolamine (or MEA)
More expensive by some estimates Integrated Gasification Combined Cycle (IGCC)
Also concentrates CO2 Attractive approach, but challenges include
complexity of operation

From R Gupta
Could be used in retrofit coal plants
Oxy-fuel Motivation
Oxyfuel Pure oxygen as oxidizer (often
diluted with flue gas) Reduces or eliminates NOx (no
Nitrogen in oxidizer flow)
• Increases CO2 concentration – Easier to recover

Oxy-coal is gaining momentum internationally
Oxy-combustion boilers have been studied in laboratory scale and small pilot units of up to 3 MW Two larger pilot units at 30 MW are operating
Babcock & Wilcox (B&W), and Swedish power company Vattenfall.
An Australian-Japanese project team is pursuing a 30 MW repowering project at the CS Energy’s Callide A station in Queensland, Australia
“stands to benefit from developments in oxygen separation such as membrane-based air separation technology, which could replace energy-intensive cryogenic process air separation technology”
More work needed in this area!
5
“Advanced Coal Power Systems with CO2 Capture: EPRI’s CoalFleet for Tomorrow Vision”,A Summary of Technology Status and Research, Development, and Demonstra:ons, 1016877, Interim Report, Electric Power Research Ins:tute, September 2008

Some key areas
Radiative Heat Transfer • More dominant heat transfer mode in boiler furnace • Non-gray body behavior (spectral dependence)
Temperature Measurements in Oxy-Fuel Boilers • Pilot scale • Above 3,000 K in Jupiter burner • Challenging to measure

Laboratory Experiments - Objectives and Apparatus
7
Oxy-Coal Dust Cloud Combustion Experiment Configuration
Objectives Document • Flame Speed • Spectral Radiation • Data for Models
Vary • Coal type • Particle size • Oxygen content • Diluent

Laboratory Experiments - Objectives and Apparatus
8
0
1
2
3
4
5
6
7
8
9
1 10 100 1000
Volu
me
(%)
Particle Diameter (µm)
Further Classify Coal using Sieves: • >106 µm • 106 µm - 75 µm • 75 µm - 53 µm • 53 µm - 25 µm • < 25 µm
Coal Analysis
Coal Type Indonesian Coal Illinois Basin #6 Coal Classification Bituminous (low sulfur, low ash) Bituminous
Ultimate Analysis (%) Carbon 73.70% 68.30% Hydrogen 5.20% 5.00% Oxygen 18.80% 13.80% Nitrogen 1% 1.30% Sulfur 0.10% 3.50% Ash 1.30% 8.10%
Typical Proximate Analysis (%) Moisture 16.12% 10.10% Ash 1.06% 7.30% Volatile 42.59% 35.90% Fixed Carbon 40.23% 46.70%

Laboratory Experiments – Results (Flame Speed)
9
How Flame Speed was Obtained
Both cases: Cloud density - 0.539 kg/m3
40% O2 and 60% CO2 Indonesian Coal
• Less Sensitive to Human Error in choosing effective diameter
y = 0.8179x - 9.8697 R² = 0.99599
y = 1.1597x - 6.9594 R² = 0.98979
0
10
20
30
40
50
60
0 10 20 30 40 50 60
Effe
ctiv
eD
iam
eter
(mm
)
Time After Ignition (ms)
Chart Title Paricle Dia 25-53 micron
Laboratory Experiments – Results (Flame Speed)
10
Effect of Oxygen On Flame Speed
All cases: Cloud density - 0.539 kg/m3
Particle Dia. – 25-53 µm Carbon Dioxide Diluent
60% O2 40% O2
0
0.5
1
1.5
2
2.5
30 35 40 45 50 55 60 65
Flam
e Sp
eed
(m/s
)
O2 (% by Volume)
Indonesian Coal
Illinois Coal #6
Laboratory Experiments – Results (Flame Speed)
11
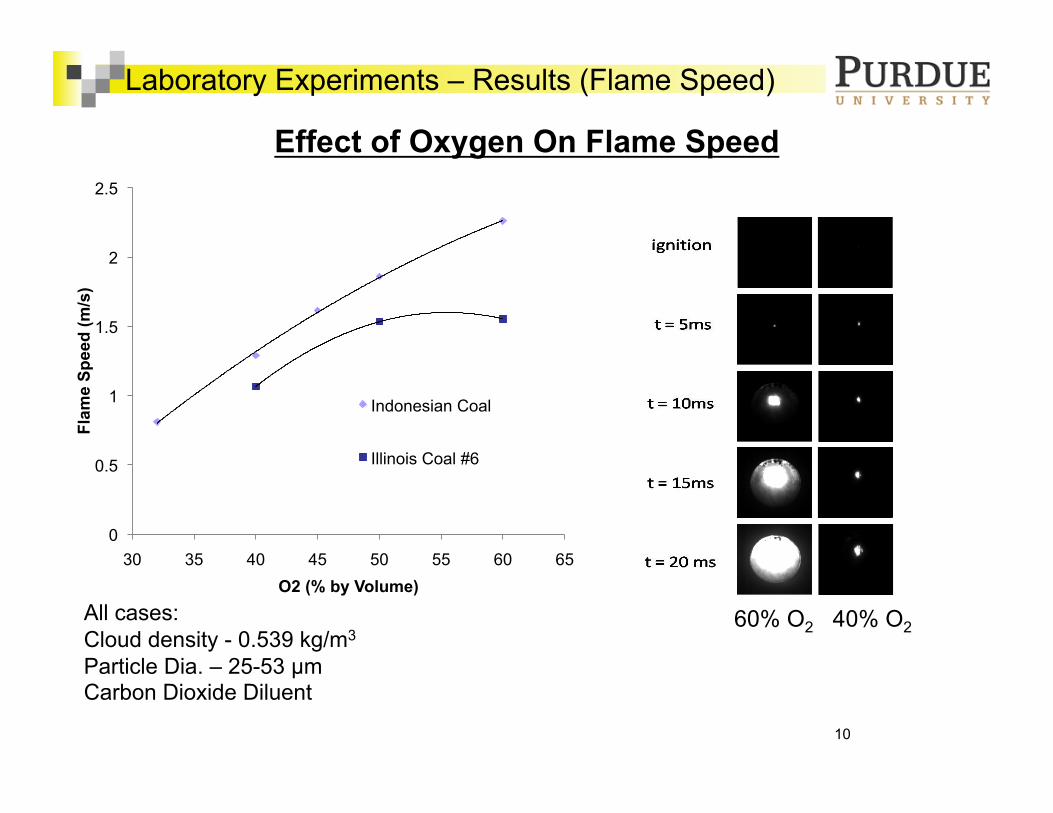
Effect of Particle Diameter On Flame Speed
All cases: Cloud density - 0.539 kg/m3
40% O2 and 60% CO2
Dia. <25 µm Dia. 53-75 µm Decrease in flame speed with smallest particle size can be attributed to: • Material Sticking to windows (leaner mixture) • Agglomerations (can be seen in videos)
0
0.2
0.4
0.6
0.8
1
1.2
1.4
0 10 20 30 40 50 60 70
Flam
e Sp
eed
(m/s
)
Average Particle Diameter (microns)
Indonesian Illinois Basin #6

Laboratory Experiments – Results (Flame Speed)
12
Effect of Diluent On Flame Speed
All cases: Particle Dia – 25-53 microns Indonesian Coal Cloud density - 0.539 kg/m3
0
0.5
1
1.5
2
2.5
3
3.5
4
4.5
20 25 30 35 40 45 50 55 60 65
Flam
e Sp
eed
(m/s
)
O2 (% by Volume)
Carbon Dioxide Nitrogen
Due to property differences between CO2 and N2.

Laboratory Experiments – Results (Spectral)
13
Fast Infrared Array Spectrometer (FIAS)
• Portable �• Staggered PbSe linear array sensor cooled by TEC • 160 wavelengths from 1.4 to 4.8 um • Scan frequency: 6,250 Hz • Acquisition frequency: 1,320 Hz

Laboratory Experiments – Results (Spectral)
14
Test Specs: 40% CO2, 60% O2 Particle Dia – 25-53 microns Cloud density - 0.539 kg/m3
ignition
t = 40ms
t = 20ms
t = 30ms
t = 10ms
t = 160ms (Maximum Radiation)
0.00
5,000.00
10,000.00
15,000.00
20,000.00
25,000.00
30,000.00
1.00 1.50 2.00 2.50 3.00 3.50 4.00
Inte
nsity
(W
/m2-
sr-µ
m)
Wavelength (µm)
Ignition
t=10ms
t=20ms
t=30ms
t=40ms
t=160ms (Max Specal Radiation)

Laboratory Experiments – Results (Spectral)
15
Trends • Same General Shape • Carbon Dioxide
• Combating factors of increase in temperature vs. increased radiative potential • Nitrogen
• Increase in Intensity for increase O2 , decrease in Diameter • Peak at 2.7 microns for Water and CO2
0.0E+00
5.0E+03
1.0E+04
1.5E+04
2.0E+04
2.5E+04
3.0E+04
3.5E+04
1.00 1.50 2.00 2.50 3.00 3.50 4.00
Inte
nsity
(W
/m2-
sr-µ
m)
Wavelength (µm)
30% O2 25-53 microns
40% O2 25-53 microns
40% O2 50-75 microns
Maximum Peaks for N2 Diluent

Laboratory Experiments – Results (Spectral)
Test Specs: Fire Ball Diameter ~ 48mm CO2 Diluent Particle Dia – 25-53 microns Cloud density - 0.539 kg/m3
50% O2
40% O2
60% O2
0.00E+00
2.00E+03
4.00E+03
6.00E+03
8.00E+03
1.00E+04
1.20E+04
1.40E+04
0.0 1.0 2.0 3.0 4.0 5.0
Inte
nsity
(W
/m2-
sr-µ
m)
Wavelength (microns)
40% Oxygen
50% Oxygen
60% Oxygen
Similar features in pilot scale measurements

Laboratory Results – Experimental (Spectral)
17
0.0E+00
5.0E+03
1.0E+04
1.5E+04
2.0E+04
2.5E+04
3.0E+04
1.00 1.50 2.00 2.50 3.00 3.50 4.00
Inte
nsity
(W
/m2-
sr-µ
m
)
Wavelength (µm)
Indonesian Low Ash
Illinois Coal #6
Test Specs: 40% O2, 60% CO2 Particle Dia – 25-53 microns Cloud density - 0.539 kg/m3

Simulations (Qiao) We investigated the transient
combustion characteristics of a spherically symmetric cloud containing coal particles, as shown in Fig. 1.
The cloud has a radius of R0. Coal particles, with diameter dp and number density nP, are uniformly distributed in the cloud.
The cloud is numerically ignited using a hot spot.
• The Three-Level Fully Implicit (TLFI) scheme of second-order accuracy was applied to transient terms of the gas phase equations.
• The convective and diffusive terms are discretized using QUICK scheme and second order central difference, respectively.
• The time dependent equations of particle phase were solved using a standard ODE solver for stiff system, DVODE.

Assumptions
The transient combustion is modeled by conservation equations for mass, species and energy with detailed consideration of devolatilization, homogeneous gas phase reaction, heterogeneous char surface reaction, and radiative heat transfer.
Assumptions: (1) Gas phase and particles are uniformly mixed in space; (2) The particles remain quiescent; (3) Coal particles are spherical of various sizes; (4) Each particle has uniform temperature because of its
small size.

Temperature profile
Note: 1. The above figure shows the transient gas-phase temperature
as a function of radius. 2. The initial coal particle temperature is assumed to be room
temperature. 3. This is for O2/CO2=30/70 case.

Flame Structure
Note: 1. The above figure shows the species concentration profiles at 6 ms. 2. This is for O2/CO2=30/70 case.

Experimental vs Theoretical Flame Speed
22
All cases: Cloud density - 0.539 kg/m3
Particle Dia. – 25-53 µm Carbon Dioxide Diluent Indonesian Coal
0
0.5
1
1.5
2
2.5
3
20 25 30 35 40 45 50 55 60 65 70
Flam
e Sp
eed
(m/s
)
O2 (% by Volume)
Experimental Indonesian
Theoretical Indonesian

Pilot Scale Experiments
23
From Jupiter Oxygen in Hammond Indiana
Some funding from Jupiter Oxygen

Pilot Scale Experiments - Objectives
Measure spectral radiation intensities of a pilot-scale oxy-fuel boiler at various locations (by Jupiter engineers)
Analyze measured radiation data
Estimate temperate profile at one cross-section of the boiler furnace using inverse radiation interpretation
24

Pilot Scale Experiments - Objectives
The Pilot Scale Boiler • Doosan Backcock 23.4 MW boiler • Four Maxson 2.93 MW • Total heating rate during tests: < 8.79 MW
Test Matrix • HT oxy-natural gas without CO2 recycling • HT oxy-natural gas with CO2 recycling (blanket)* • LT oxy-natural gas with CO2 recycling (synthetic air) • Air firing natural gas • HT oxy-coal without CO2 recycling
25
* http://www.jupiteroxygen.com

Wall
Flame Front
FIAS
Burner Assembly
Spectral Measurement Configuration
Pilot Scale Experiments – Pilot Scale Apparatus
26

The temperature profile was described as the following:
• Assumed Temperature Profile and best fit to boundary conditions and spectral data
• First time this technique applied to coal and pilot scale experiments
Pilot Scale Experiments – Inverse Flame Temperature Technique
27

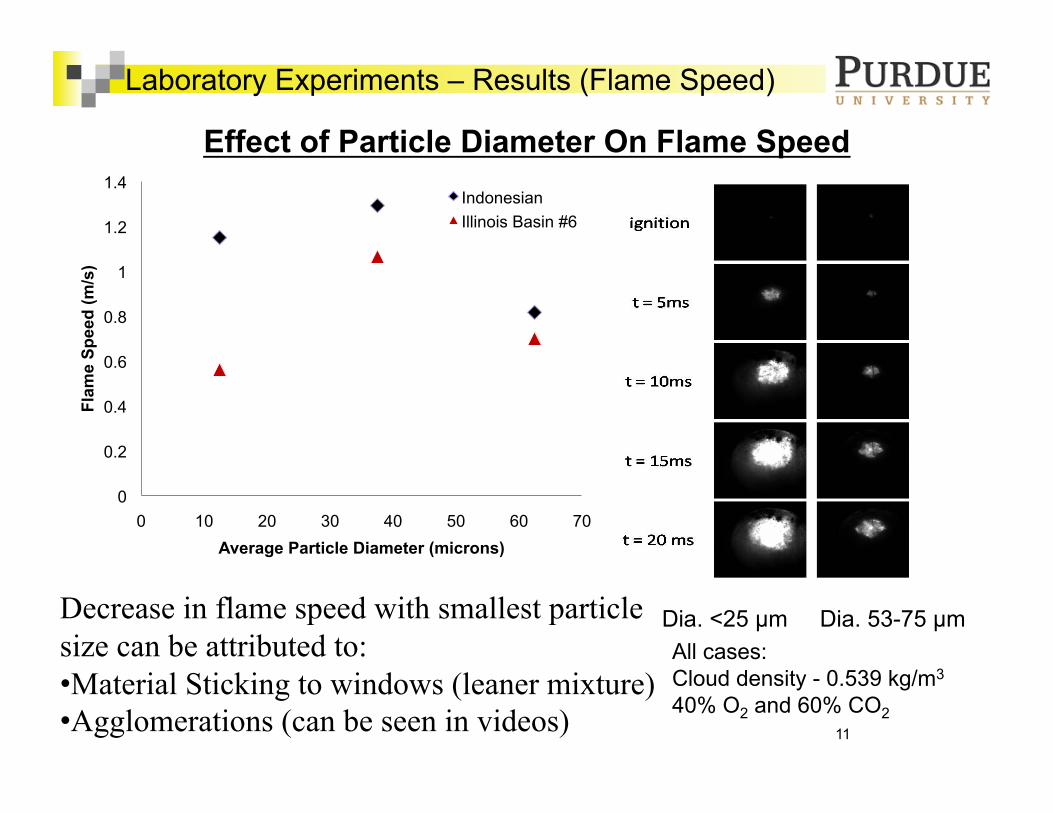
Pilot Scale Experiments – Results
Spectral Emissions of HT oxy-fuel w/o CO2 recirculation
Spectral Emissions of HT oxy-fuel w/ CO2 recirculation
Air-Fire Spectral Emissions
LT oxy-fuel Spectral Emissions (Synthetic Air with FGR)
28
Pilot Scale Experiments – Results
29
Jupiter Oxy-Coal Spectral Results More analysis needed NETL is using this data with modeling efforts there

Pilot Scale Experiments – Results
Comparison of estimated temperature profiles
Peak temperatures of HT oxy-fuel flames are MUCH higher
Temperatures of LT oxy-fuel air-firing flames are comparable
Gas temperature near the wall of the HT oxy-fuel without FGR configuration is the highest
30

Continuing Work
Modify inverse temperature estimate code for dust clouds Also, can take simulation results and calculate
radiant emission More comparisons with calculations
About an hour for each simulation More spectral radiation analysis Repeat some nitrogen tests Do some tests with visible spectrometer Prepare final report
31

Future work?
Would continue oxy-coal experiments with significant modeling effort (Qiao)
32

Future work?
Diffusion HT burner
33

Future work?
Benchscale 150 kW burner
34
Also submitted white paper to DOE ARPA-E call

We’d like to thank Prof. Timothee Pourpoint for use of his Matlab Code for analyzing the high-speed images.
We thank Jupiter Oxygen engineers for gathering the data and providing pilot scale apparatus. In particular, we thank Brian Patrick and Steve Nied.
We thank the Center for Coal Technology Research for funding under contract number 7-PSC-CTR-002. In particular, we thank Marty Irwin and Brian Bowen for their support of this work.
Acknowledgements
35