Embed Size (px)
Citation preview
Oxygen Deficient Conditions and Nitrate Reduction in the Eastern Tropical North PacificOceanAuthor(s): Joel D. Cline and Francis A. RichardsSource: Limnology and Oceanography, Vol. 17, No. 6 (Nov., 1972), pp. 885-900Published by: American Society of Limnology and OceanographyStable URL: http://www.jstor.org/stable/2834614 .
Accessed: 23/06/2014 15:34
Your use of the JSTOR archive indicates your acceptance of the Terms & Conditions of Use, available at .http://www.jstor.org/page/info/about/policies/terms.jsp
.JSTOR is a not-for-profit service that helps scholars, researchers, and students discover, use, and build upon a wide range ofcontent in a trusted digital archive. We use information technology and tools to increase productivity and facilitate new formsof scholarship. For more information about JSTOR, please contact [email protected].
.
American Society of Limnology and Oceanography is collaborating with JSTOR to digitize, preserve andextend access to Limnology and Oceanography.
http://www.jstor.org
This content downloaded from 62.122.73.30 on Mon, 23 Jun 2014 15:34:48 PMAll use subject to JSTOR Terms and Conditions
OXYGEN DEFICIENT CONDITIONS AND NITRATE REDUCTION IN THE EASTERN TROPICAL
NORTH PACIFIC OCEAN1
Joel D. Cline2 and Francis A. Richards Department of Oceanography, University of Washington, Seattle 98195
ABSTRACT
Oxygen concentrations in the oxygen-minimum zone of the eastern tropical North Pacific Ocean are at least an order of magnitude lower than previously reported. Concentrations of less than 1l,ug-atom/liter are common throughout the region from below the pycnocline to depths of several hundred meters.
In these nearly anoxic waters, nitrate appears to be reduced to nitrite and free nitrogen. Nitrate deficits, derived from material balance calculations, suggest that up to 13-14 Ag-atoms/liter of nitrate-nitrogen have been so reduced. This is 40-50% of the nitrate normally present in this depth interval. Secondary nitrite concentrations rarely exceed 1.5 Ag-atoms/liter and are generally associated with oxygen concentrations of less than 2 ,ug-atoms/liter. Ammonia concentrations appear to be slightly lower in the region of denitrification, probably because of bacterial assimilation.
If the nitrate reduction rate observed in Darwin Bay in the Galapagos Islands were to apply as a rate of denitrification in the entire oxygen-minimum zone in the eastern tropical North Pacific, the annual loss of 920 X 1012 g of combined nitrogen could be expected. However, considerations of environmental differences suggest that a figure somewhat less than a quarter of this amount is more probable.
INTRODUCTION
In the past 10 years, considerable atten- tion has been focused on the extensive oxygen-minimum3 region of the eastern tropical Pacific Ocean. Of particular in- terest has been the occurrence of the secondary nitrite maximum below the thermocline and within the upper part of the oxygen-minimum zone. This maximum appears to be associated with oxygen concentrations of less than 0.1 ml/liter
1 This work was supported by National Sci- ence Foundation Grant GA10084 and by Office of Naval Research Contracts NONR-477(37) and N-00014-67-A-0103-0014 with the University of Washington. Contribution No. 670 from the Department of Oceanography, University of Washington.
2 Present address: Institute of Geophysics and Planetary Physics, University of California at Los Angeles 90024.
3 In this paper, "oxygen-minimum" zone, layer, or region will be used generally to refer to the volume or depth interval in which oxygen concen- trations determined by the Winkler titration are less than 0.15 ml/liter, or in which the concentra- tions determined by the colorimetric method of Broenkow and Cline (1969) are less than 0.05 ml/liter.
and suggests anaerobic nitrate reduction (Brandhorst 1959). In contrast, the pri- mary nitrite maximum, usually above or within the thermocline, is not associated with low oxygen concentrations and is believed to result either from ammonia oxidation (Harvey 1955; Wada and Hat- tori 1971, 1972) or excretion by phyto- plankton (Vaccaro and Ryther 1960).
Evidence of denitrification in these nearly anoxic waters was provided by Thomas (1966), who demonstrated that significantly more nitrate had been re- duced than could be accounted for as nitrite. He suggested that nitrate had been reduced beyond nitrite, probably to free nitrogen or nitrous oxide (denitrification).
Observations by Fiadeiro and Strick- land (1968) off the coast of Peru indicated that the secondary nitrite maximum there is associated with low oxygen concentra- tions (02 < 0.2 ml/liter) and a deficiency in nitrate ion. They suggested that depar- tures from the expected nitrate concentra- tions may arise from a slow regeneration rate within the oxygen-minimum region, but they were unable to show this conclu-
LIMNOLOGY AND OCEANOGRAPHY 885 NOVEMBER 1972, V. 17(6)
This content downloaded from 62.122.73.30 on Mon, 23 Jun 2014 15:34:48 PMAll use subject to JSTOR Terms and Conditions
886 JOEL D. CLINE AND FRANCIS A. RICHARDS
1150 1100 1050 100? 950 900 850 80?
25 2501
200 oTT02629 200
78 27*
0~~~~~~~~~~~~~~
15? I50 0? 0?9?90 5 0
10c o 0 3233 343539 3(3gJ42 TT76 10
5~~~~~~~~~~~~~~5 23
50 [9~~~~~~~~~~2
19~~~~~~~~~~~~4 50~~~~~~~~~~~~~~~~~~~
115 110 050 1Q00 95~ ~~0 9 24 8518
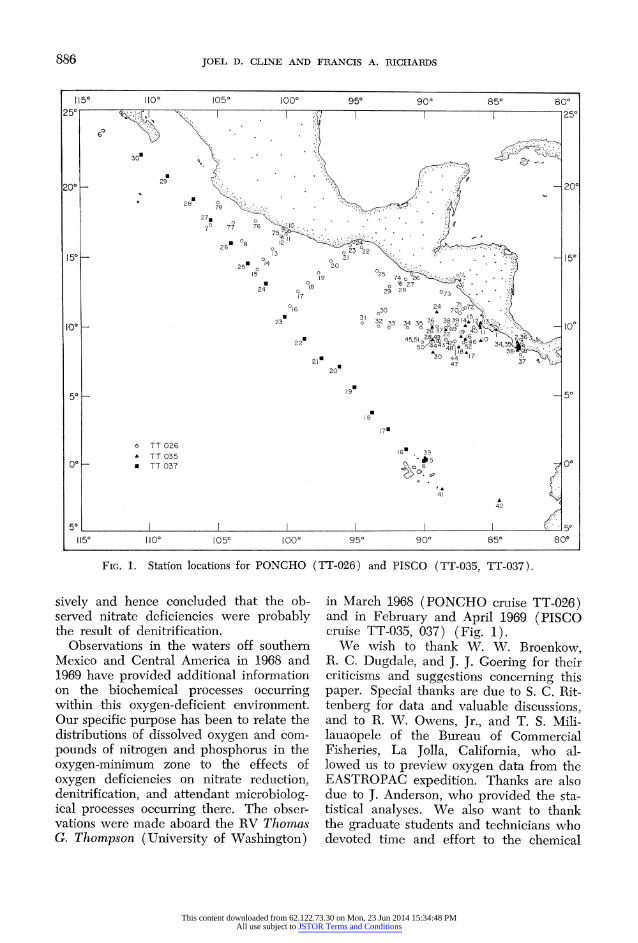
Fic.1. tatin lcatins or PNCH (TT026 and PIC (TT035,TT07)
sively and hence concluded that the ob- served nitrate deficiencies were probably the result of denitrification.
Observations in the waters off southern Mexico and Central America in 1968 and 1969 have provided additional information on the biochemical processes occurring within this oxygen-deficient environment. Our specific purpose has been to relate the distributions of dissolved oxygen and com- pounds of nitrogen and phosphorus in the oxygen-minimum zone to the effects of oxygen deficiencies on nitrate reduction, denitrification, and attendant microbiolog- ical processes occurring there. The obser- vations were made aboard the RV Thomas G. Thompson (University of Washington)
in March 1968 (PONCHO cruise TT-026) and in February and April 1969 (PISCO cruise TT-035, 037) (Fig. 1).
We wish to thank W. W. Broenkow, R. C. Dugdale, and J. J. Goering for their criticisms and suggestions concerning this paper. Special thanks are due to S. C. Rit- tenberg for data and valuable discussions, and to R. W. Owens, Jr., and T. S. Mili- lauaopele of the Bureau of Commercial Fisheries, La Jolla, California, who al- lowed us to preview oxygen data from the EASTROPAC expedition. Thanks are also due to J. Anderson, who provided the sta- tistical analyses. We also want to thank the graduate students and technicians who devoted time and effort to the chemical
This content downloaded from 62.122.73.30 on Mon, 23 Jun 2014 15:34:48 PMAll use subject to JSTOR Terms and Conditions
NITRATE REDUCTION, EASTERN TROPICAL PACIFIC 887
analyses. However, the results and con- clusions are our sole responsibility.
METHODS AND PROCEDURES
Chemical and physical observations in- cluded salinity, temperature, dissolved ox- ygen (Winkler and colorimetric), inorganic phosphate, nitrate, nitrite, nitrous oxide, ammonia, silicate, pH, alkalinity, total car- bon dioxide, dissolved hydrogen sulfide, sulfite, thiosulfate, and soluble and par- ticulate iron. During the PISCO cruise, nitrate, nitrite, ammonia, phosphate, and silicate determinations were carried out on a Technicon AutoAnalyzer according to the recommendations of Hager et al. (1968).
Salinity was determined from conduc- tivity measurements.
Temperature was observed using deep- sea reversing thermometers.
Dissolved oxygen was determined two ways: by the Winkler titration using re- agents recommended by Carpenter (1966) and by a colorimetric procedure designed for low oxygen concentrations (Broenkow and Cline 1969).
Inorganic phosphate was determined by the ascorbic acid-potassium antimonyl tar- trate method of Murphy and Riley (1962).
Nitrate ion was estimated by the cad- mium-copper reduction method of Wood et al. (1967) adapted for use on the Auto- Analyzer.
Nitrite was determined by the method of Bendschneider and Robinson (1952).
Nitrous oxide was tested for chromato- graphically using a Barber Colman series 5000 gas chromatograph, equipped with a model 5120 electron capture detector and model 5041-1 electrometer. The detector was operated in the helium ionization mode, with 1-mm electrode spacing and a potential field of 2,000 V/cm. The output signal was recorded on a series 8000, 1-mV recorder.
The standard procedure was to remove the dissolved gases from a 5-ml aqueous sample in a gas stripper, similar to the type described by Swinnerton et al. (1962),
and separate the N20 from the air gases on a 2- x 0.5-cm column of silica gel, 60/80 mesh (Appl. Sci.). Carbon dioxide was absorbed on Ascarite (A. H. Thomas Co.) and water vapor on Drierite (Ham- mond Drierite Co.). The calibration gas (51 ppm N20 in He) and sweep gas (ul- trapure He) were prepared by Air Prod- ucts and Chemicals.
The detection limit of N20 is 0.5 Ztmole /liter, using a 5-ml aqueous sample, equiv- alent to a signal amplitude of twice the nominal noise level.
Ammonia was determined by the method of Richards and Kletsch (1964).
Reactive silicate was determined by the method of Mullin and Riley (1955), modified by using Na2SiF6 as a primary standard.
Dissolved hydrogen sulfide was esti- mated by a colorimetric methylene-blue method (Cline 1969).
Sulfite and thiosulfate concentrations were determined colorimetrically, using the procedures of West and Gaeke (1956) and Urban (1961).
Water samples were collected in 5.6-liter all-plastic Niskin bottles and 6-liter high- impact polyvinyl chloride samplers, modi- fied from a design by Carruthers et al. (1950).
All nutrient samples were stored at 2C until analyzed, usually within 4 hr of sam- pling. Oxygen and other gasometric analy- ses were carried out immediately.
OBSERVATIONS
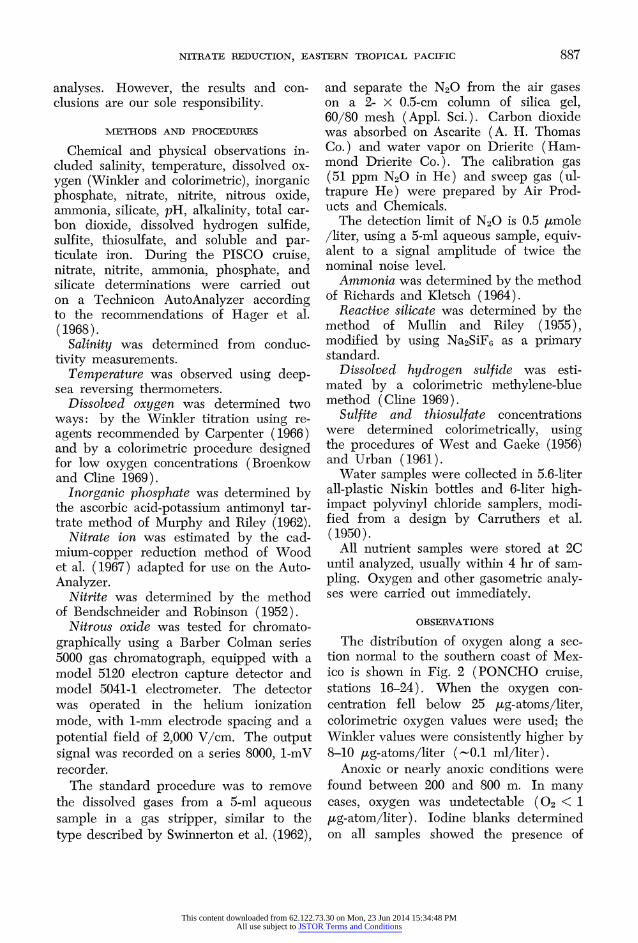
The distribution of oxygen along a sec- tion normal to the southern coast of Mex- ico is shown in Fig. 2 (PONC'HO cruise, stations 16-24). When the oxygen con- centration fell below 25 jug-atoms/liter, colorimetric oxygen values were used; the Winkler values were consistently higher by 8-10 jug-atoms/liter (-0.1 ml/liter).
Anoxic or nearly anoxic conditions were found between 200 and 800 m. In many cases, oxygen was undetectable (02 < 1 jug-atom/liter). Iodine blanks determined on all samples showed the presence of
This content downloaded from 62.122.73.30 on Mon, 23 Jun 2014 15:34:48 PMAll use subject to JSTOR Terms and Conditions
888 JOEL D. CLINE AND FRANCIS A. RICHARDS
STATIONS 016 017 018 019 020 021022023 024
I ~ ~~~~ ~ 2- 0
200 ? 200 200 2 20 2 . ,
15
_10\ 5 0. . 2 lss
5. 400
E 3 4 2-.
FIG. 0. Lug- atoms giter
600 27
2
800 10 "
1000, ___ 400 300 200 100 0
DISTANCE OFFSHORE, nautical miles
FIG. 2. Oxygen concentrations (ALg-atoms/liter) along a section normal to the southern coast of Mexico (PONCHO, stations 16-24, TT-026). Ox- ygen concentrations less than ca. 25 ALg-atoms/liter were measured by the colorimetric procedure of Broenkow and Cline (1969).
compounds that reduced iodine. The max- imum observed concentration of these sub- stances was approximately 2 pt-equivalents /liter as iodine. Interference by nitrite was eliminated by the addition of sodium azide to the KOH-KI reagents.
Two distinct features of the oxygen-min- imum zone are the apparent deficits in nitrate and the unusually high concentra- tions of nitrite. It is generally accepted that an apparent loss of nitrate in these nearly anoxic waters arises from respira- tory nitrate reduction in which nitrate ion serves as the terminal electron acceptor in the oxidation of organic material (Richards 1965). Nitrite ion presumably is an inter- mediate product in the overall process leading to free nitrogen (denitrification).
NITRATE DEFICITS (ANOMALIES)
Investigations in the eastern tropical Pacific Ocean have shown that reduction
beyond nitrite, presumably to free nitro- gen, has occurred. This raises questions concerning the amount of nitrate reduction and the rates of these processes.
As an initial step in examining these questions, we estimated the amount of nitrate reduction from the following equation:
AN = (NO3)exp- (NO3) obs- (NO2)obs (1)
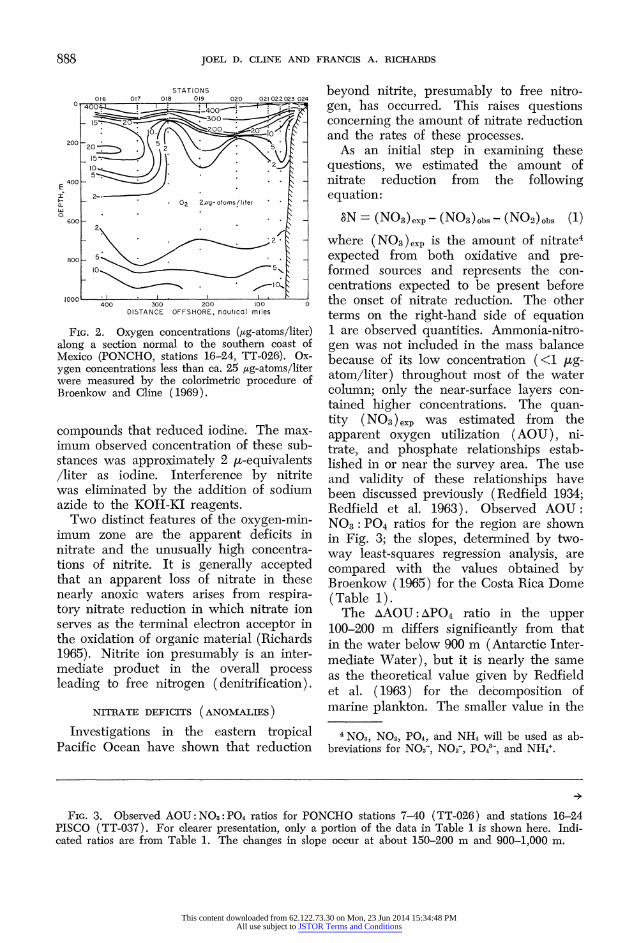
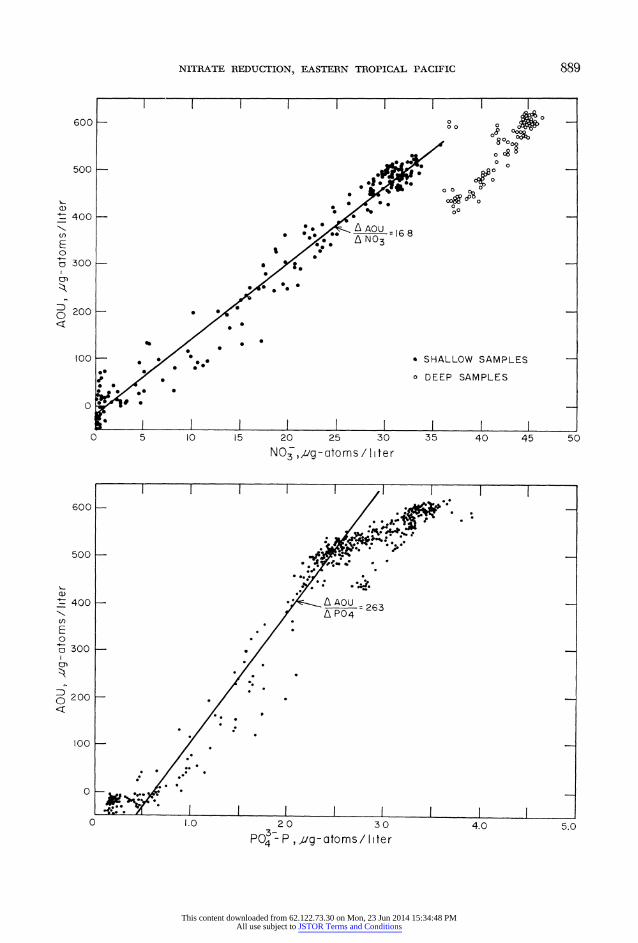
where (NO3 ) exp is the amount of nitrate4 expected from both oxidative and pre- formed sources and represents the con- centrations expected to be present before the onset of nitrate reduction. The other terms on the right-hand side of equation 1 are observed quantities. Ammonia-nitro- gen was not included in the mass balance because of its low concentration (<1 ,g- atom/liter) throughout most of the water column; only the near-surface layers con- tained higher concentrations. The quan- tity ( NO3) exp was estimated from the apparent oxygen utilization (AOU), ni- trate, and phosphate relationships estab- lished in or near the survey area. The use and validity of these relationships have been discussed previously (Redfield 1934; Redfield et al. 1963). Observed AOU: NO3: P04 ratios for the region are shown in Fig. 3; the slopes, determined by two- way least-squares regression analysis, are compared with the values obtained by Broenkow (1965) for the Costa Rica Dome (Table 1).
The AAOU: AP04 ratio in the upper 100-200 m differs significantly from that in the water below 900 m (Antarctic Inter- mediate Water), but it is nearly the same as the theoretical value given by Redfield et al. (1963) for the decomposition of marine plankton. The smaller value in the
4 N03, NO2, P04, and NH4 will be used as ab- breviations for NO3-, NO2-, PO4-, and NH4+.
FIG. 3. Observed AOU: NO3: P04 ratios for PONCHO stations 7-40 (TT-026) and stations 16-24 PISCO (TT-037). For clearer presentation, only a portion of the data in Table 1 is shown here. Indi- cated ratios are from Table 1. The changes in slope occur at about 150-200 m and 900-1,000 m.
This content downloaded from 62.122.73.30 on Mon, 23 Jun 2014 15:34:48 PMAll use subject to JSTOR Terms and Conditions
NITRATE REDUCTION, EASTERN TROPICAL PACIFIC 889
600 0 o B
0 . 0 J
L. 0 0~~~~~~~~~~0 0 500 X? _D 0 *0 0 =
. AAOU 100 _ . A*..SHALLOWSAMPLESN03168 E
o300 * g
:D200* 0
0~~~~~~~~~~
100 a SHALLOW SAMPLES
. DEEP SAMPLES
*0
0 5 10 15 20 25 30 35 40 45 50
NO3 ,,ug-atoms / h ter
I I I I I ,1 1 1 600 -
500
0200 r 400 0
10 0. 2
O 1.0 3-2 0 3 0 4.0 5.C
This content downloaded from 62.122.73.30 on Mon, 23 Jun 2014 15:34:48 PMAll use subject to JSTOR Terms and Conditions
890 JOEL D. CLINE AND FRANCIS A. RICHARDS
deep water suggests that phosphate has been released early in the decomposition of marine plankton. A low ratio could also arise from a decrease in preformed phos- phate below the Antarctic Intermediate Water, but this seems unlikely.
A similar change in the AAOU: ANO3 ratio is observed in the same depth inter- vals, but it appears that less nitrate relative to phosphate has been liberated in the deep water (ANO3: AP04 = 10) .
In the water between the salinity maxi- mum of the Equatorial Pacific and the Antartcic Intermediate Water, the AAOU: ANO3: AP04 ratios are substantially altered by mixing of these two water types (Table 1). Consequently, any estimate of the ni- trate loss in this depth interval calculated from a nitrogen mass balance will depend on both the in situ oxidative ratios and the degree of mixing that has occurred.
The first term on the right of equation 1 for the nitrate anomaly is:
(NO3)exp = (NO3)0Ox + (NO3) p, (2) where (NO3)ox and (NO3) p are the oxi- dative and preformed nitrate concentra- tions present before the onset of nitrate reduction. The oxidative nitrate is as- sumed to be related to the apparent oxy- gen utilization (AOU) by the following equation:
(NO3)ox = [ANO3/AAOU]z(AOU). (3)
The subscript z implies that the oxidative ratio: [AN03/AAOU], may be depth de- pendent. Preformed nitrate is assumed to be some function of preformed phosphate.
1.4 I l I
ao SALINITY MINIMUM 1.2 *7
STA 16 0 cn 0 ~~~~~17o
E 1.0 - 18* _ o 0\ 19 A
\ o 20v
e08: X ~~~~~21 0 0.8
0 OA\
0.6
SALINITY MAXIMUM o0
0.4l l ' _ 34.6 34.8 35.0
SALINITY /o
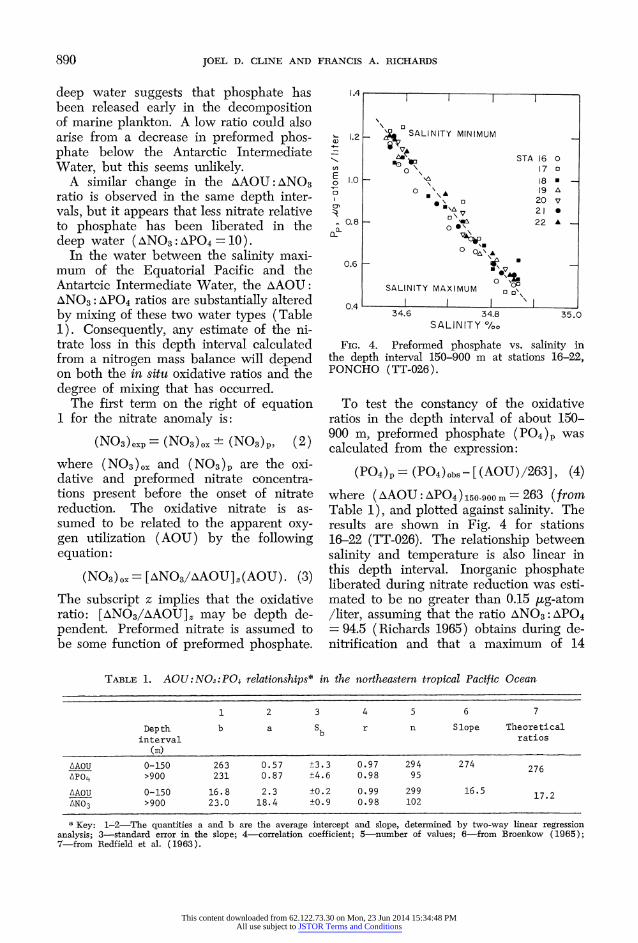
FiG. 4. Preformed phosphate vs. salinity in the depth interval 150-900 m at stations 16-22, PONCHO (TT-026).
To test the constancy of the oxidative ratios in the depth interval of about 150- 900 m, preformed phosphate (PO4)p was calculated from the expression:
(P04)p =(P04)ObS-[(AOU)/263], (4) where (AAOU: APO4) 150-900 m = 263 (from Table 1), and plotted against salinity. The results are shown in Fig. 4 for stations 16-22 (TT-026). The relationship between salinity and temperature is also linear in this depth interval. Inorganic phosphate liberated during nitrate reduction was esti- mated to be no greater than 0.15 yug-atom /liter, assuming that the ratio ANO3: APO4 = 94.5 (Richards 1965) obtains during de- nitrification and that a maximum of 14
TABLE 1. AOU:NO8:PO4 relationships* in the northeastern tropical Pacific Ocean
1 2 3 4 5 6 7
Depth b a Sb r n Slope Theoretical interval ratios
(m)
AAOU 0-150 263 0.57 ?3.3 0.97 294 274 276 APO4 >900 231 0.87 ?4.6 0.98 95
AAOU 0-150 16.8 2.3 ?0.2 0.99 299 16.5 17.2 ANO3 >900 23.0 18.4 ?0.9 0.98 102
* Key: 1-2-The quantities a and b are the average intercept and slope, determined by two-way linear regression analysis; 3-standard error in the slope; 4-correlation coefficient; 5-number of values; 6-from Broenkow (1965); 7-from Redfield et al. (1963).
This content downloaded from 62.122.73.30 on Mon, 23 Jun 2014 15:34:48 PMAll use subject to JSTOR Terms and Conditions
NITRATE REDUCTION, EASTERN TROPICAL PACIFIC 891
STATI ON S 016 017 018 019 020 021022023 024
C ' I ,1 I1 ,
2000
0
400 5 2
E /0 m
PONCH (TT ~-02) Nirt anml / n
600 05
5
800
0
400 300 200 100 0 DISTANCE OFFSHORE, nautical miles
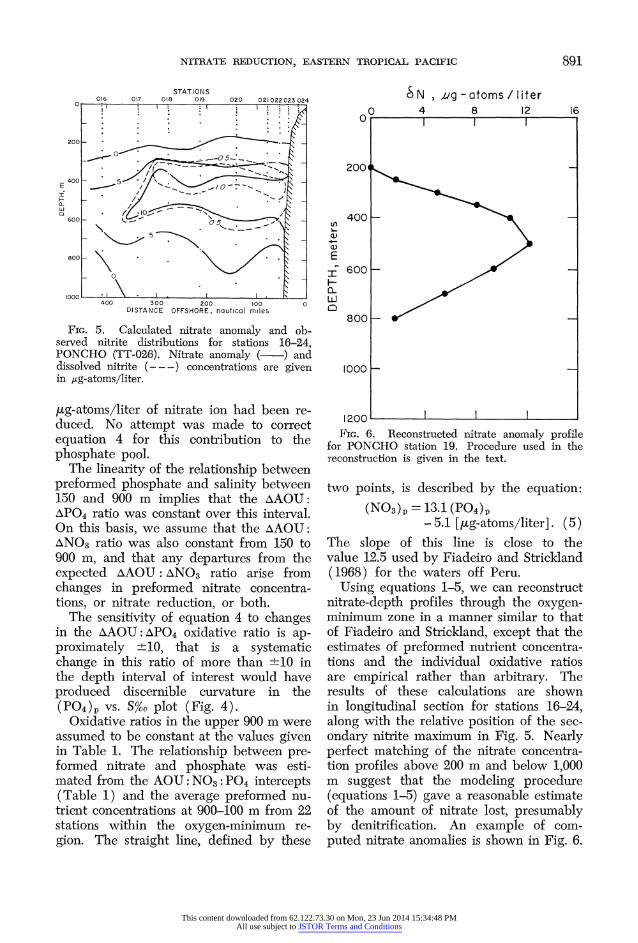
FxG. 5. Calculated nitrate anomaly and ob- served nitrite distributions for stations 16-24, PONCHO (TT-026). Nitrate anomaly (-~) and dissolved nitrite (---) concentrations are given in /ug-atoms/liter.
yug-atoms/liter of nitrate ion had been re- duced. No attempt was made to correct equation 4 for this contribution to the phosphate pQol.
The linearity of the relationship between preformed phosphate and salinity between 150 and 900 m implies that the AAOU: APO4 ratio was constant over this interval. On this basis, we assume that the AAOU: ANO3 ratio was also constant from 150 to 900 m, and that any departures from the expected AAOU: ANO3 ratio arise from changes in preforned nitrate concentra- tions, or nitrate reduction, or both.
The sensitivity of equation 4 to changes in the AAOU:APO4 oxidative ratio is ap- proximately +10, that is a systematic change in this ratio of more than ?10 in the depth interval of interest would have produced discernible curvature in the (PO4)p vs. S%oO plot (Fig. 4).
Oxidative ratios in the upper 900 m were assumed to be constant at the values given in Table 1. The relationship between pre- formed nitrate and phosphate was esti- mated from the AOU: NO3: P04 intercepts (Table 1) and the average preforned nu- trient concentrations at 900-100 m from 22 stations within the oxygen-minimum re- gion. The straight line, defined by these
SN , g- atoms/ I iter 0 4 8 12 16
0 I I
2004
400 -
a)
E 5 600 -
LiI
800 -
1000 _
1200 I FIG. 6. Reconstructed nitrate anomaly profile
for PONCHO station 19. Procedure used in the reconstruction is given in the text.
two points, is described by the equation: (NO3)p = 13.1 (P04)p
- 5.1 [yug-atoms/liter]. (5) The slope of this line is close to the value 12.5 used by Fiadeiro and Strickland (1968) for the waters off Peru.
Using equations 1-5, we can reconstruct nitrate-depth profiles through the oxygen- minimum zone in a manner similar to that of Fiadeiro and Strickland, except that the estimates of preformed nutrient concentra- tions and the individual oxidative ratios are empirical rather than arbitrary. The results of these calculations are shown in longitudinal section for stations 16-24, along with the relative position of the sec- ondary nitrite maximum in Fig. 5. Nearly perfect matching of the nitrate concentra- tion profiles above 200 m and below 1,000 m suggest that the modeling procedure (equations 1-5) gave a reasonable estimate of the amount of nitrate lost, presumably by denitrification. An example of com- puted nitrate anomalies is shown in Fig. 6.
This content downloaded from 62.122.73.30 on Mon, 23 Jun 2014 15:34:48 PMAll use subject to JSTOR Terms and Conditions
892 JOEL D. CLINE AND FRANCIS A. RICHARDS
2.0
1.6
9zj0.8 ; ;*
0~~~~~~
0. .
0
0 1.0 2.0 3.0 4.0 5.0 6.0 7.0 8.0 9.0
02, Xg-oatoms/ liter
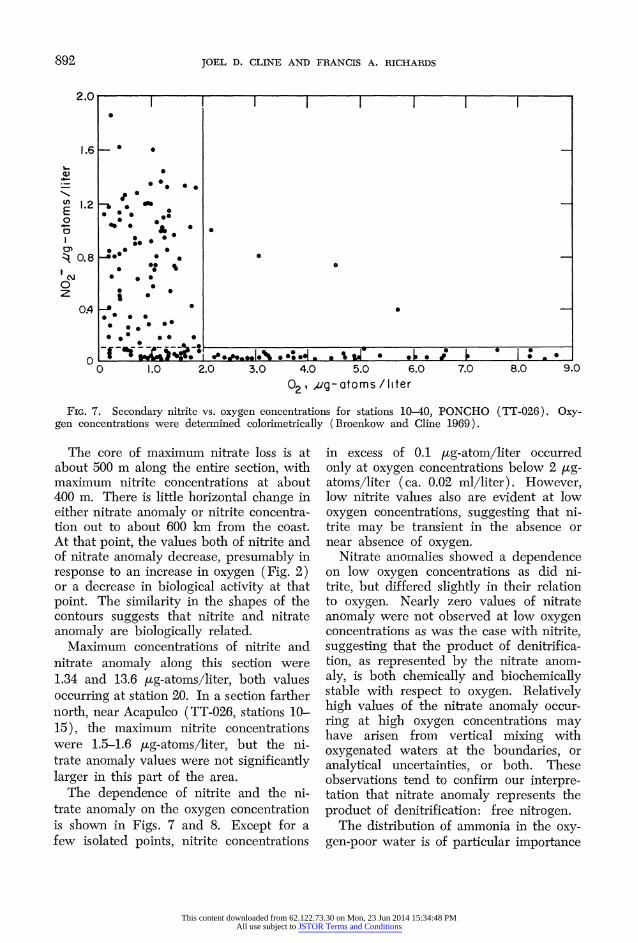
FIG. 7. Secondary nitrite vs. oxygen concentrations for stations 10-40, PONCHO (TT-026). Oxy- gen concentrations were determined colorimetrically (Broenkow and Cline 1969).
The core of maximum nitrate loss is at about 500 m along the entire section, with maximum nitrite concentrations at about 400 m. There is little horizontal change in either nitrate anomaly or nitrite concentra- tion out to about 600 km from the coast. At that point, the values both of nitrite and of nitrate anomaly decrease, presumably in response to an increase in oxygen (Fig. 2) or a decrease in biological activity at that point. The similarity in the shapes of the contours suggests that nitrite and nitrate anomaly are biologically related.
Maximum concentrations of nitrite and nitrate anomaly along this section were 1.34 and 13.6 )ug-atoms/liter, both values occurring at station 20. In a section farther north, near Acapulco (TT-026, stations 10- 15), the maximum nitrite concentrations were 1.5-1.6 )ug-atoms/liter, but the ni- trate anomaly values were not significantly larger in this part of the area.
The dependence of nitrite and the ni- trate anomaly on the oxygen concentration is shown in Figs. 7 and 8. Except for a few isolated points, nitrite concentrations
in excess of 0.1 [ig-atom/liter occurred only at oxygen concentrations below 2 yug- atoms/liter (ca. 0.02 ml/liter). However, low nitrite values also are evident at low oxygen concentrations, suggesting that ni- trite may be transient in the absence or near absence of oxygen.
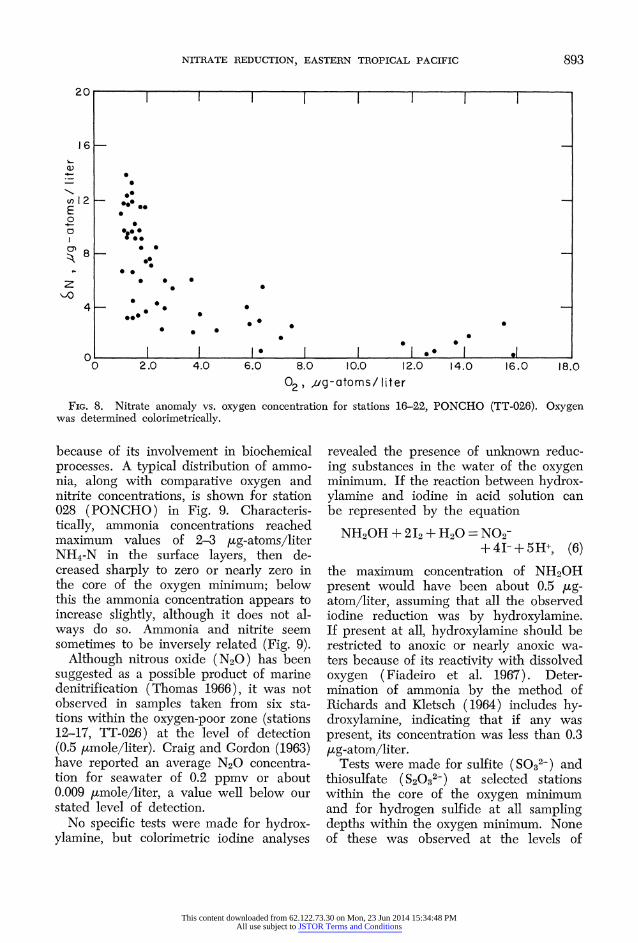
Nitrate anomalies showed a dependence on low oxygen concentrations as did ni- trite, but differed slightly in their relation to oxygen. Nearly zero values of nitrate anomaly were not observed at low oxygen concentrations as was the case with nitrite, suggesting that the product of denitrifica- tion, as represented by the nitrate anom- aly, is both chemically and biochemically stable with respect to oxygen. Relatively high values of the nitrate anomaly occur- ring at high oxygen concentrations may have arisen from vertical mixing with oxygenated waters at the boundaries, or analytical uncertainties, or both. These observations tend to confirm our interpre- tation that nitrate anomaly represents the product of denitrification: free nitrogen.
The distribution of ammonia in the oxy- gen-poor water is of particular importance
This content downloaded from 62.122.73.30 on Mon, 23 Jun 2014 15:34:48 PMAll use subject to JSTOR Terms and Conditions
NITRATE REDUCTION, EASTERN TROPICAL PACIFIC 893
20
16
0)
4-. 0
,- 0 u12 000..
E 0
0
4.0
00
A 80 2.0 - 0
FbIG * . Nirt aolyv. oxgncnetainfrsains1I2 OCO(T06.Oye
ws4 .0 a
000 * *0 0
0 . I. 1 I I.* I * 0 2.0 4.0 6.0 8.0 0o.0 12.0 14.0 16.0 18.0 02, ,ug-atoms/ liter
FIG. 8. Nitrate anomaly vs. oxygen concentration for stations 16-22, PONCHO (TT-026). Oxygen was determined colorimetrically.
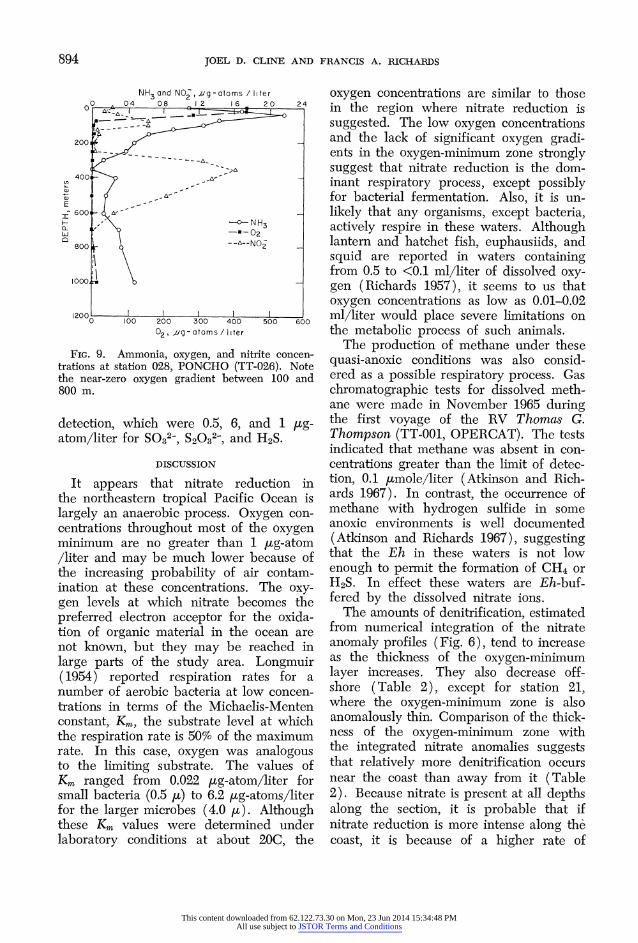
because of its involvement in biochemical processes. A typical distribution of ammo- nia, along with comparative oxygen and nitrite concentrations, is shown for station 028 (PONCHO) in Fig. 9. Characteris- tically, ammonia concentrations reached maximum values of 2-3 [ig-atoms/liter NH4-N in the surface layers, then de- creased sharply to zero or nearly zero in the core of the oxygen minimum; below this the ammonia concentration appears to increase slightly, although it does not al- ways do so. Ammonia and nitrite seem sometimes to be inversely related (Fig. 9).
Although nitrous oxide (N20) has been suggested as a possible product of marine denitrification (Thomas 1966), it was not observed in samples taken from six sta- tions within the oxygen-poor zone (stations 12-17, TT-026) at the level of detection (0.5 jtmole/liter). Craig and Gordon (1963) have reported an average N20 concentra- tion for seawater of 0.2 ppmv or about 0.009 itmole/liter, a value well below our stated level of detection.
No specific tests were made for hydrox- ylamine, but colorimetric iodine analyses
revealed the presence of unknown reduc- ing substances in the water of the oxygen minimum. If the reaction between hydrox- ylamine and iodine in acid solution can be represented by the equation
NH20H +2I2+1H20= NO2- + 4I- + 5H+, (6)
the maximum concentration of NH20H present would have been about 0.5 ug- atom/liter, assuming that all the observed iodine reduction was by hydroxylamine. If present at all, hydroxylamine should be restricted to anoxic or nearly anoxic wa- ters because of its reactivity with dissolved oxygen (Fiadeiro et al. 1967). Deter- mination of ammonia by the method of Richards and Kletsch (1964) includes hy- droxylamine, indicating that if any was present, its concentration was less than 0.3 [Lg-atom/liter.
Tests were made for sulfite (SO32-) and thiosulfate (S2032-) at selected stations within the core of the oxygen minimum and for hydrogen sulfide at all sampling depths within the oxygen minimum. None of these was observed at the levels of
This content downloaded from 62.122.73.30 on Mon, 23 Jun 2014 15:34:48 PMAll use subject to JSTOR Terms and Conditions
894 JOEL D. CLINE AND FRANCIS A. RICHARDS
NH3 and NO, vg -atoms /liter 0 04 08 1 2 16 20 24
200 ___ , g -_ AA
400
6E i / ,- <
?^ 600 H dk,-~ _
800 2
I1000, _V
200 0 l00 200 300 400 500 600 02, L9 - atoms /I iter
FIG. 9. Ammonia, oxygen, and nitrite concen- trations at station 028, PONCHO (TT-026). Note the near-zero oxygen gradient between 100 and 800 m.
detection, which were 0.5, 6, and 1 /tg- atom/liter for SO32-, S2032-, and H2S.
DISCUSSION
It appears that nitrate reduction in the northeastern tropical Pacific Ocean is largely an anaerobic process. Oxygen con- centrations throughout most of the oxygen minimum are no greater than 1 Jug-atom /liter and may be much lower because of the increasing probability of air contam- ination at these concentrations. The oxy- gen levels at which nitrate becomes the preferred electron acceptor for the oxida- tion of organic material in the ocean are not known, but they may be reached in large parts of the study area. Longmuir (1954) reported respiration rates for a number of aerobic bacteria at low concen- trations in terms of the Michaelis-Menten constant, K., the substrate level at which the respiration rate is 50% of the maximum rate. In this case, oxygen was analogous to the limiting substrate. The values of Km ranged from 0.022 yug-atom/liter for small bacteria (0.5 u) to 6.2 [ig-atoms/liter for the larger microbes (4.0 FL). Although these Km values were determined under laboratory conditions at about 20C, the
oxygen concentrations are similar to those in the region where nitrate reduction is suggested. The low oxygen concentrations and the lack of significant oxygen gradi- ents in the oxygen-minimum zone strongly suggest that nitrate reduction is the dom- inant respiratory process, except possibly for bacterial fermentation. Also, it is un- likely that any organisms, except bacteria, actively respire in these waters. Although lantern and hatchet fish, euphausiids, and squid are reported in waters containing from 0.5 to <0.1 ml/liter of dissolved oxy- gen (Richards 1957), it seems to us that oxygen concentrations as low as 0.01-0.02 ml/liter would place severe limitations on the metabolic process of such animals.
The production of methane under these quasi-anoxic conditions was also consid- ered as a possible respiratory process. Gas chromatographic tests for dissolved meth- ane were made in November 1965 during the first voyage of the RV Thomas G. Thompson (TT-001, OPERCAT). The tests indicated that methane was absent in con- centrations greater than the limit of detec- tion, 0.1 )umole/liter (Atkinson and Rich- ards 1967). In contrast, the occurrence of methane with hydrogen sulfide in some anoxic environments is well documented (Atkinson and Richards 1967), suggesting that the Eh in these waters is not low enough to permit the formation of CH4 or H2S. In effect these waters are Eh-buf- fered by the dissolved nitrate ions.
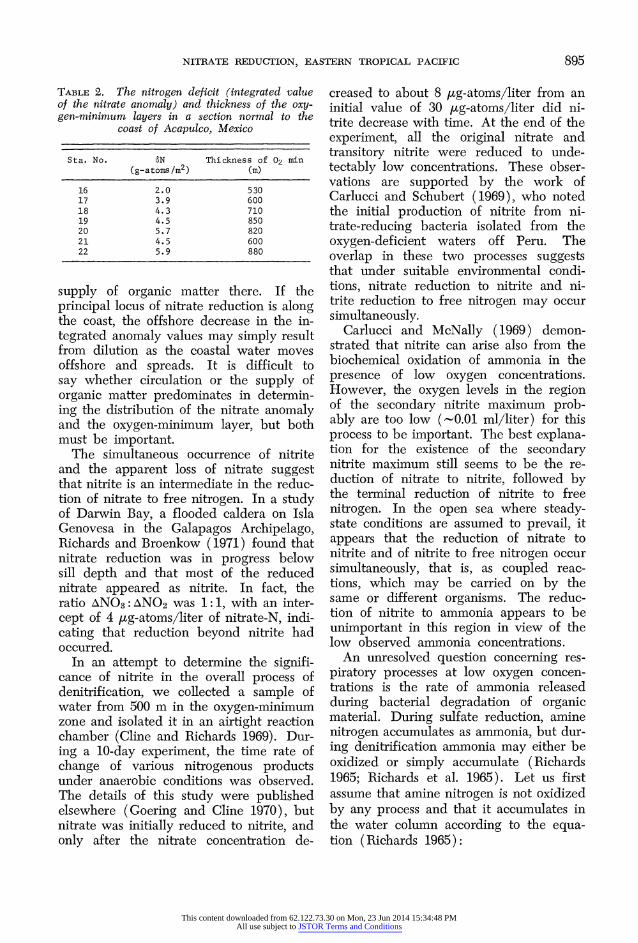
The amounts of denitrification, estimated from numerical integration of the nitrate anomaly profiles (Fig. 6), tend to increase as the thickness of the oxygen-minimum layer increases. They also decrease off- shore (Table 2), except for station 21, where the oxygen-minimum zone is also anomalously thin. Comparison of the thick- ness of the oxygen-minimum zone with the integrated nitrate anomalies suggests that relatively more denitrification occurs near the coast than away from it (Table 2). Because nitrate is present at all depths along the section, it is probable that if nitrate reduction is more intense along the coast, it is because of a higher rate of
This content downloaded from 62.122.73.30 on Mon, 23 Jun 2014 15:34:48 PMAll use subject to JSTOR Terms and Conditions
NITRATE REDUCTION, EASTERN TROPICAL PACIFIC 895
TABLE 2. The nitrogen deficit (integrated value of the nitrate anomaly) and thickness of the oxy- gen-minimum layers in a section normal to the
coast of Acapulco, Mexico
Sta. No. 6N Thickness of 02 min (g-atoms/m2) (m)
16 2.0 530 17 3.9 600 18 4.3 710 19 4.5 850 20 5.7 820 21 4.5 600 22 5.9 880
supply of organic matter there. If the principal locus of nitrate reduction is along the coast, the offshore decrease in the in- tegrated anomaly values may simply result from dilution as the coastal water moves offshore and spreads. It is difficult to say whether circulation or the supply of organic matter predominates in determin- ing the distribution of the nitrate anomaly and the oxygen-minimum layer, but both must be important.
The simultaneous occurrence of nitrite and the apparent loss of nitrate suggest that nitrite is an intermediate in the reduc- tion of nitrate to free nitrogen. In a study of Darwin Bay, a flooded caldera on Isla Genovesa in the Galapagos Archipelago, Richards and Broenkow (1971) found that nitrate reduction was in progress below sill depth and that most of the reduced nitrate appeared as nitrite. In fact, the ratio ANO3: ANO2 was 1:1, with an inter- cept of 4 pg-atoms/liter of nitrate-N, indi- cating that reduction beyond nitrite had occurred.
In an attempt to determine the signifi- cance of nitrite in the overall process of denitrification, we collected a sample of water from 500 m in the oxygen-minimum zone and isolated it in an airtight reaction chamber (Cline and Richards 1969). Dur- ing a 10-day experiment, the time rate of change of various nitrogenous products under anaerobic conditions was observed. The details of this study were published elsewhere (Goering and Cline 1970), but nitrate was initially reduced to nitrite, and only after the nitrate concentration de-
creased to about 8 [ig-atoms/liter from an initial value of 30 yug-atoms/liter did ni- trite decrease with time. At the end of the experiment, all the original nitrate and transitory nitrite were reduced to unde- tectably low concentrations. These obser- vations are supported by the work of Carlucci and Schubert (1969), who noted the initial production of nitrite from ni- trate-reducing bacteria isolated from the oxygen-deficient waters off Peru. The overlap in these two processes suggests that under suitable environmental condi- tions, nitrate reduction to nitrite and ni- trite reduction to free nitrogen may occur simultaneously.
Carlucci and McNally (1969) demon- strated that nitrite can arise also from the biochemical oxidation of ammonia in the presence of low oxygen concentrations. However, the oxygen levels in the region of the secondary nitrite maximum prob- ably are too low (-0.01 ml/liter) for this process to be important. The best explana- tion for the existence of the secondary nitrite maximum still seems to be the re- duction of nitrate to nitrite, followed by the terminal reduction of nitrite to free nitrogen. In the open sea where steady- state conditions are assumed to prevail, it appears that the reduction of nitrate to nitrite and of nitrite to free nitrogen occur simultaneously, that is, as coupled reac- tions, which may be carried on by the same or different organisms. The reduc- tion of nitrite to ammonia appears to be unimportant in this region in view of the low observed ammonia concentrations.
An unresolved question concerning res- piratory processes at low oxygen concen- trations is the rate of ammonia released during bacterial degradation of organic material. During sulfate reduction, amine nitrogen accumulates as ammonia, but dur- ing denitrification ammonia may either be oxidized or simply accumulate (Richards 1965; Richards et al. 1965). Let us first assume that amine nitrogen is not oxidized by any process and that it accumulates in the water column according to the equa- tion (Richards 1965):
This content downloaded from 62.122.73.30 on Mon, 23 Jun 2014 15:34:48 PMAll use subject to JSTOR Terms and Conditions
896 JOEL D. CLINE AND FRANCIS A. RICHARDS
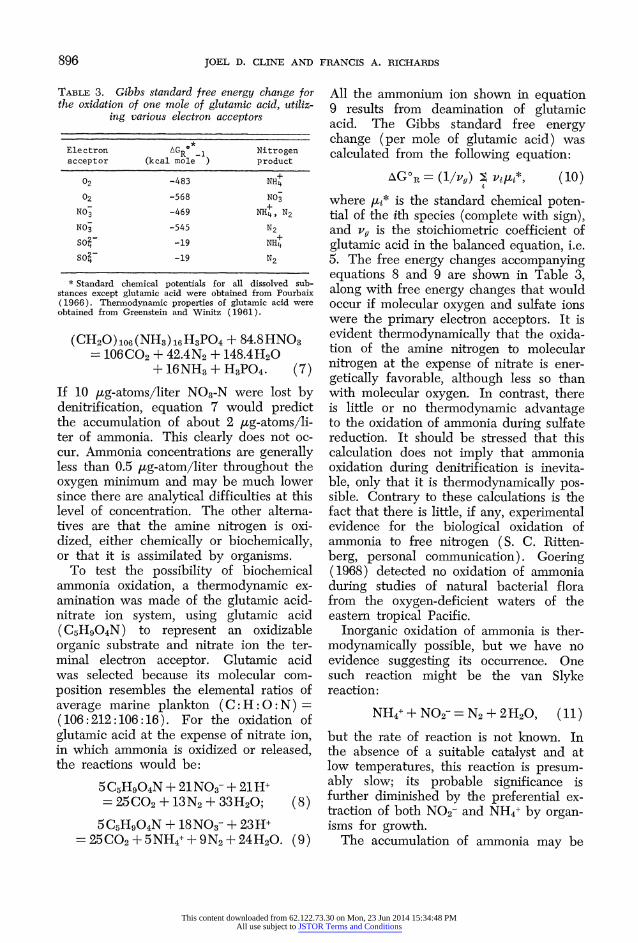
TABLE 3. Gibbs standard free energy change for the oxidation of one mole of glutamic acid, utiliz-
ing various electron acceptors
*~~~~~~~~~~~~~~~~~~~~~~~~ Electron AG 1 Nitrogen acceptor (kcal mole ) product
02 -483 NH4
02 -568 N03 NO3 -469 NH4, N2
NO3 -545 N2
4O -19 NH4
SO?4 -19 N2
* Standard chemical potentials for all dissolved sub- stances except glutamic acid were obtained from Pourbaix (1966). Thermodynamic properties of glutamic acid were obtained from Greenstein and Winitz (1961).
(CH20)106 (NH3)16 H3PO4 + 84.8 HN03 = 106C02 + 42.4N2 + 148.4H20
+ 16NH3 + H3P04. (7)
If 10 pg-atoms/liter N03-N were lost by denitrification, equation 7 would predict the accumulation of about 2 ,ug-atoms/li- ter of ammonia. This clearly does not oc- cur. Ammonia concentrations are generally less than 0.5 ,tg-atom/liter throughout the oxygen minimum and may be much lower since there are analytical difficulties at this level of concentration. The other alterna- tives are that the amine nitrogen is oxi- dized, either chemically or biochemically, or that it is assimilated by organisms.
To test the possibility of biochemical ammonia oxidation, a thermodynamic ex- amination was made of the glutamic acid- nitrate ion system, using glutamic acid (C5H904N) to represent an oxidizable organic substrate and nitrate ion the ter- minal electron acceptor. Glutamic acid was selected because its molecular com- position resembles the elemental ratios of average marine plankton (C: H :0: N) = (106:212:106:16). For the oxidation of glutamic acid at the expense of nitrate ion, in which ammonia is oxidized or released, the reactions would be:
5 C5H904N + 21 N03- + 21 H+ = 25C02 + 13N2 + 33 H20; (8)
5C5H904N + 18N03- + 23H+ -25CO2+5NH4++9N2+24H20. (9)
All the ammonium ion shown in equation 9 results from deamination of glutamic acid. The Gibbs standard free energy change (per mole of glutamic acid) was calculated from the following equation:
AGOR= (1/vg) E vjFL*, (10)
where /* is the standard chemical poten- tial of the ith species (complete with sign), and vg is the stoichiometric coefficient of glutamic acid in the balanced equation, i.e. 5. The free energy changes accompanying equations 8 and 9 are shown in Table 3, along with free energy changes that would occur if molecular oxygen and sulfate ions were the primary electron acceptors. It is evident thermodynamically that the oxida- tion of the amine nitrogen to molecular nitrogen at the expense of nitrate is ener- getically favorable, although less so than with molecular oxygen. In contrast, there is little or no thermodynamic advantage to the oxidation of ammonia during sulfate reduction. It should be stressed that this calculation does not imply that ammonia oxidation during denitrification is inevita- ble, only that it is thermodynamically pos- sible. Contrary to these calculations is the fact that there is little, if any, experimental evidence for the biological oxidation of ammonia to free nitrogen (S. C. Ritten- berg, personal communication). Goering (1968) detected no oxidation of ammonia during studies of natural bacterial flora from the oxygen-deficient waters of the eastern tropical Pacific.
Inorganic oxidation of ammonia is ther- modynamically possible, but we have no evidence suggesting its occurrenoe. One such reaction might be the van Slyke reaction:
NH4++ NO2-= N2+2H20, (11)
but the rate of reaction is not known. In the absence of a suitable catalyst and at low temperatures, this reaction is presum- ably slow; its probable significance is further diminished by the preferential ex- traction of both N02- and NH4+ by organ- isms for growth.
The accumulation of ammonia may be
This content downloaded from 62.122.73.30 on Mon, 23 Jun 2014 15:34:48 PMAll use subject to JSTOR Terms and Conditions
NITRATE REDUCTION, EASTERN TROPICAL PACIFIC 897
prevented by bacterial assimilation. Be- cause neither the bacterial populations nor their growth rates are known, the maxi- mum amount of ammonia lost through assimilation might be estimated from the energy yield of nitrate reduction. Hadji- petrou and Stouthamer (1965), working with Aerobacter aerogenes, found that 3 moles of ATP were produced for each mole of nitrate reduced. The yield of ATP was about the same for several different carbon sources. They also reported that reduction of nitrate beyond nitrite yielded no more ATP, i.e. the only ATP-producing reaction was:
2e- + 2H+ + NO3- = NO2- + H20. (12)
Growth yield measurements for the same organism show that an average of 10.8 g of cell material (dry weight) is produced for each mole of ATP (Forrest 1969). This average was based on glucose, fructose, mannitol, and generated gluconate as car- bon sources. We will also assume that about 10% of the cell dry weight is nitro- gen (Luria 1960).
The reduction of 10 jtg-atoms/liter of nitrate would produce 320 pg/liter of dry weight cell material, equivalent to 32 utg /liter of nitrogen, or about 2.3 jug-atoms /liter of ammonia. This value is strikingly close to our estimate of the amount of ammonia that should have been released according to equation 7. We suggest that the near absence of ammonia from the oxygen-minimum zone can be attributed principally to assimilatory processes.
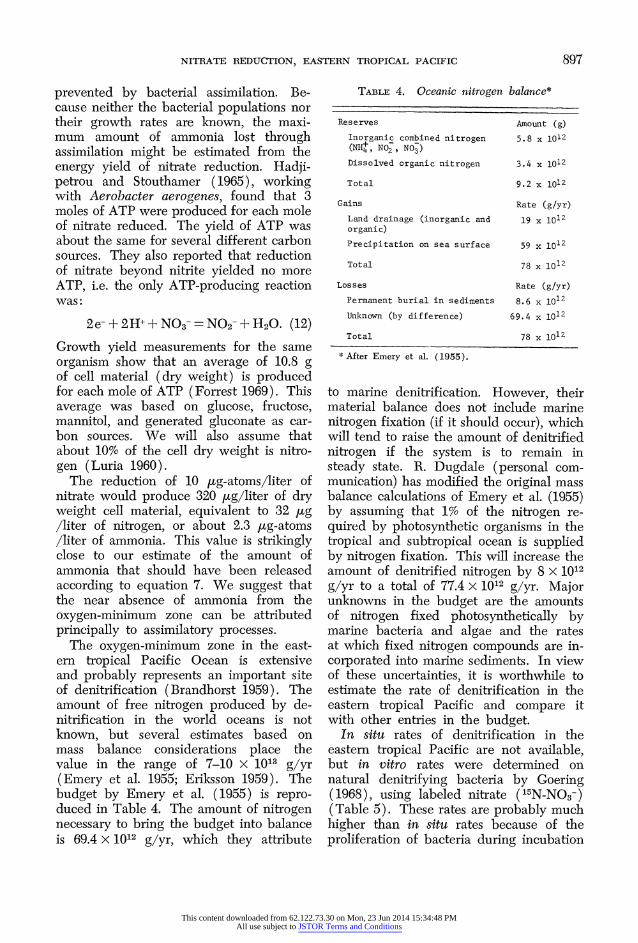
The oxygen-minimum zone in the east- ern tropical Pacific Ocean is extensive and probably represents an important site of denitrification (Brandhorst 1959). The amount of free nitrogen produced by de- nitrification in the world oceans is not known, but several estimates based on mass balance considerations place the value in the range of 7-10 x 1013 g/yr (Emery et al. 1955; Eriksson 1959). The budget by Emery et al. (1955) is repro- duced in Table 4. The amount of nitrogen necessary to bring the budget into balance is 69.4 X 10¹² g/yr, which they attribute
TABLE 4. Oceanic nitrogen balance*
Reserves Amount (g) Inorganic combined nitrogen 5.8 x 10¹² (NH+, NO2, NO3)
Dissolved organic nitrogen 3.4 x 10¹²
Total 9.2 x 10¹²
Gains Rate (g/yr) Land drainage (inorganic and 19 x 1012 organic) Precipitation on sea surface 59 x 1012
Total 78 x 1012
Losses Rate (g/yr) Permanent burial in sediments 8.6 x 10¹² Unknown (by difference) 69.4 x 10¹²
Total 78 x 1012
* After Emery et al. (1955).
to marine denitrification. However, their material balance does not include marine nitrogen fixation (if it should occur), which will tend to raise the amount of denitrified nitrogen if the system is to remain in steady state. R. Dugdale (personal com- munication) has modified the original mass balance calculations of Emery et al. (1955) by assuming that 1% of the nitrogen re- quired by photosynthetic organisms in the tropical and subtropical ocean is supplied by nitrogen fixation. This will increase the amount of denitrified nitrogen by 8 x 10¹² g/yr to a total of 77.4 x 10¹² g/yr. Major unknowns in the budget are the amounts of nitrogen fixed photosynthetically by marine bacteria and algae and the rates at which fixed nitrogen compounds are in- corporated into marine sediments. In view of these uncertainties, it is worthwhile to estimate the rate of denitrification in the eastern tropical Pacific and compare it with other entries in the budget.
In situ rates of denitrification in the eastern tropical Pacific are not available, but in vitro rates were determined on natural denitrifying bacteria by Goering (1968), using labeled nitrate (15N-NO3-) (Table 5). These rates are probably much higher than in situ rates because of the proliferation of bacteria during incubation
This content downloaded from 62.122.73.30 on Mon, 23 Jun 2014 15:34:48 PMAll use subject to JSTOR Terms and Conditions
898 JOEL D. CLINE AND FRANCIS A. RICHARDS
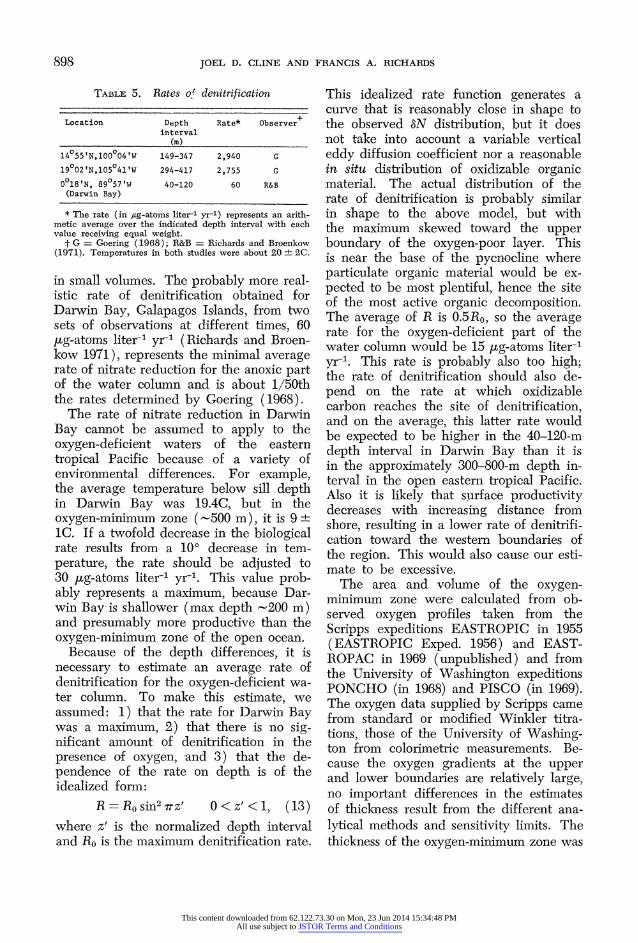
TABLE 5. Rates of denitrification
Location Depth Rate* Observer+ interval
(m)
14055'N,100004'W 149-347 2,940 G
19002'N,105041'W 294-417 2,755 G
0018'N, 89 057'W 40-120 60 R&B (Darwin Bay)
* The rate (in Ag-atoms liter-1 yr-') represents an arith- metic average over the indicated depth interval with each value receiving equal weight.
t G = Goering (1968); R&B = Richards and Broenkow (1971). Temperatures in both studies were about 20 ? 2C.
in small volumes. The probably more real- istic rate of denitrification obtained for Darwin Bay, Galapagos Islands, from two sets of observations at different times, 60 pg-atoms liter-' yr1 (Richards and Broen- kow 1971), represents the minimal average rate of nitrate reduction for the anoxic part of the water column and is about 1/50th the rates determined by Goering (1968).
The rate of nitrate reduction in Darwin Bay cannot be assumed to apply to the oxygen-deficient waters of the eastern tropical Pacific because of a variety of environmental differences. For example, the average temperature below sill depth in Darwin Bay was 19.4C, but in the oxygen-minimum zone ('500 m), it is 9 ? IC. If a twofold decrease in the biological rate results from a 100 decrease in tem- perature, the rate should be adjusted to 30 pg-atoms liter-1 yr-1. This value prob- ably represents a maximum, because Dar- win Bay-is shallower (max depth '200 m) and presumably more productive than the oxygen-minimum zone of the open ocean.
Because of the depth differences, it is necessary to estimate an average rate of denitrification for the oxygen-deficient wa- ter column. To make this estimate, we assumed: 1) that the rate for Darwin Bay was a maximum, 2) that there is no sig- nificant amount of denitrification in the presence of oxygen, 'and 3) that the de- pendence of the rate on depth is of the idealized form:
R=Rosin2iVz' O<z'<1, (13) where z' is the normalized depth interval and Ro is the maximum denitrification rate.
This idealized rate function generates a curve that is reasonably close in shape to the observed AN distribution, but it does not take into account a variable vertical eddy diffusion coefficient nor a reasonable in situ distribution of oxidizable organic material. The actual distribution of the rate of denitrification is probably similar in shape to the above model, but with the maximum skewed toward the upper boundary of the oxygen-poor layer. This is near the base of the pycnocline where particulate organic material would be ex- pected to be most plentiful, hence the site of the most active organic decomposition. The average of R is 0.5 Ro, so the average rate for the oxygen-deficient part of the water column would be 15 pg-atoms liter-1 yr-1. This rate is probably also too high; the rate of denitrification should also de- pend on the rate at which oxidizable carbon reaches the site of denitrification, and on the average, this latter rate would be expected to be higher in the 40-120-m depth interval in Darwin Bay than it is in the approximately 300-800-m depth in- terval in the open eastern tropical Pacific. Also it is likely that surface productivity decreases with increasing distance from shore, resulting in a lower rate of denitrifi- cation toward the western boundaries of the region. This would also cause our esti- mate to be excessive.
The area and volume of the oxygen- minimum zone were calculated from ob- served oxygen profiles taken from the Scripps expeditions EASTROPIC in 1955 (EASTROPIC Exped. 1956) and EAST- ROPAC in 1969 (unpublished) and from the University of Washington expeditions PONCHO (in 1968) and PISCO (in 1969). The oxygen data supplied by Scripps came from standard or modified Winkler titra- tions, those of the University of Washing- ton from colorimetric measurements. Be- cause the oxygen gradients at the upper and lower boundaries are relatively large, no important differences in the estimates of thickness result from the different ana- lytical methods and sensitivity limits. The thickness of the oxygen-minimum zone was
This content downloaded from 62.122.73.30 on Mon, 23 Jun 2014 15:34:48 PMAll use subject to JSTOR Terms and Conditions
NITRATE REDUCTION, EASTERN TROPICAL PACIFIC 899
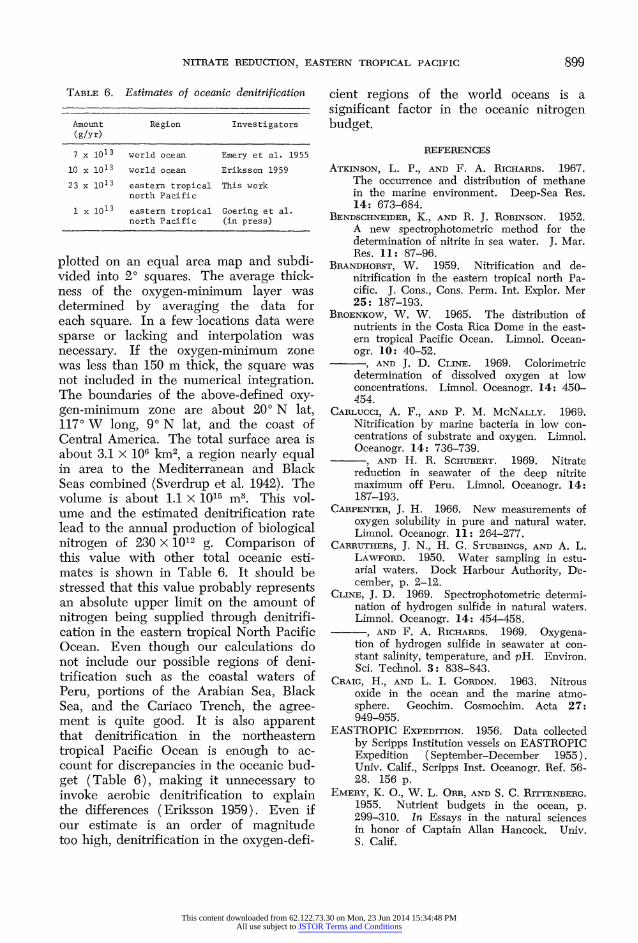
TABLE 6. Estimates of oceanic denitrification
Amount Region Investigators (g/yr)
7 x 10¹³ world ocean Emery et al. 1955
10 x 1013 world ocean Eriksson 1959
23 x 1013 eastern tropical This work north Pacific
1 x 1o13 eastern tropical Goering et al. north Pacific (in press)
plotted on an equal area map and subdi- vided into 20 squares. The average thick- ness of the oxygen-minimum layer was determined by averaging the data for each square. In a few-locations data were sparse or lacking and interpolation was necessary. If the oxygen-minimum zone was less than 150 m thick, the square was not included in the numerical integration. The boundaries of the above-defined oxy- gen-minimum zone are about 200 N lat, 1170 W long, 90 N lat, and the coast of Central America. The total surface area is about 3.1 x 10⁶ kMi2, a region nearly equal in area to the Mediterranean and Black Seas combined (Sverdrup et al. 1942). The volume is about 1.1 x 10¹⁵ m3. This vol- ume and the estimated denitrification rate lead to the annual production of biological nitrogen of 230 x 1012 g. Comparison of this value with other total oceanic esti- mates is shown in Table 6. It should be stressed that this value probably represents an absolute upper limit on the amount of nitrogen being supplied through denitrifi- cation in the eastern tropical North Pacific Ocean. Even though our calculations do not include our possible regions of deni- trification such as the coastal waters of Peru, portions of the Arabian Sea, Black Sea, and the Cariaco Trench, the agree- ment is quite good. It is also apparent that denitrification in the northeastern tropical Pacific Ocean is enough to ac- count for discrepancies in the oceanic bud- get (Table 6), making it unnecessary to invoke aerobic denitrification to explain the differences (Eriksson 1959). Even if our estimate is an order of magnitude too high, denitrification in the oxygen-defi-
cient regions of the world oceans is a significant factor in the oceanic nitrogen budget.
REFERENCES
ATKINSON, L. P., AND F. A. RICHARDS. 1967. The occurrence and distribution of methane in the marine environment. Deep-Sea Res. 14: 673-684.
BENDSCHNEIDER, K., AND R. J. ROBINSON. 1952. A new spectrophotometric method for the determination of nitrite in sea water. J. Mar. Res. 11: 87-96.
BRANDHORST, W. 1959. Nitrification and de- nitrification in the eastern tropical north Pa- cific. J. Cons., Cons. Perm. Int. Explor. Mer 25: 187-193.
BROENKOW, W. W. 1965. The distribution of nutrients in the Costa Rica Dome in the east- ern tropical Pacific Ocean. Limnol. Ocean- ogr. 10: 40-52.
, AND J. D. CLINE. 1969. Colorimetric determination of dissolved oxygen at low concentrations. Limnol. Oceanogr. 14: 450- 454.
CARLUCCI, A. F., AND P. M. McNALLY. 1969. Nitrification by marine bacteria in low con- centrations of substrate and oxygen. Limnol. Oceanogr. 14: 736-739.
- AND H. R. SCHUBERT. 1969. Nitrate reduction in seawater of the deep nitrite maximum off Peru. Limnol. Oceanogr. 14: 187-193.
CARPENTER, J. H. 1966. New measurements of oxygen solubility in pure and natural water. Limnol. Oceanogr. 11: 264-277.
CARRUTHERS, J. N., H. G. STUBBINGS, AND A. L. LAWFORD. 1950. Water sampling in estu- arial waters. Dock Harbour Authority, De- cember, p. 2-12.
CLINE, J. D. 1969. Spectrophotometric determi- nation of hydrogen sulfide in natural waters. Limnol. Oceanogr. 14: 454-458.
, AND F. A. RICHARDS. 1969. Oxygena- tion of hydrogen sulfide in seawater at con- stant salinity, temperature, and pH. Environ. Sci. Technol. 3: 838-843.
CRAIG, H., AND L. I. GORDON. 1963. Nitrous oxide in the ocean and the marine atmo- sphere. Geochim. Cosmochim. Acta 27: 949-955.
EASTROPIC EXPEDITION. 1956. Data collected by Scripps Institution vessels on EASTROPIC Expedition (September-December 1955). Univ. Calif., Scripps Inst. Oceanogr. Ref. 56- 28. 156 p.
EMERY, K. O., W. L. ORR, AND S. C. RITTENBERG. 1955. Nutrient budgets in the ocean, p. 299-310. In Essays in the natural sciences in honor of Captain Allan Hancock. Univ. S. Calif.
This content downloaded from 62.122.73.30 on Mon, 23 Jun 2014 15:34:48 PMAll use subject to JSTOR Terms and Conditions
900 JOEL D. CLINE AND FRANCIS A. RICHARDS
ERIKSSON, E. 1959. The circulation of some atmospheric constituents in the sea, p. 147- 157. In B. Bolin [ed.], The atmosphere and the sea in motion (Rossby Mem. Vol.). Rockefeller Inst. 509 p.
FIADEIRO, M., L. SOLORZANO, AND J. D. H. STRICKLAND. 1967. Hydroxylamine in sea- water. Limnol. Oceanogr. 12: 555-556.
- AND J. D. H. STRICKLAND. 1968. Ni- trate reduction and the occurrence of a deep nitrite maximum in the ocean off the west coast of South America. J. Mar. Res. 26: 187-201.
FORREST, W. W. 1969. Energetic aspects of mi- crobial growth, p. 65-86. In P. M. Meadow and S. J. Pirt [eds.], Microbial growth. Cambridge.
GOERING, J. J. 1968. Denitrification in the oxy- gen minimum layer of the eastern tropical Pacific Ocean. Deep-Sea Res. 15: 157-164.
, AND J. D. CLINE. 1970. A note on de- nitrification in seawater. Limnol. Oceanogr. 15: 306-308.
, F. A. RICHARDS, L. A. CODISPOTI, AND R. C. DUGDALE. IN PRESS. Nitrogen fixation and denitrification in the ocean: biogeo- chemical budgets. In Int. Symp. Hydrogeo- chem. Biogeochem. Tokyo, 1970.
GREENSTEIN, J. P., AND M. WINITZ. 1961. Chem- istry of the amino acids, v. 1. Wiley. 760 p.
HAGER, S. W., L. I. GORDON, AND P. K. PARK. 1968. A practical manual for use of the Technicon AutoAnalyzer in seawater nutrient analysis. Rep. B.C.F. Contract 14-17-0001- 1759, Oregon State Univ. Ref. 68-33.
HADJIPETROU, L. P., AND A. H. STOUTHAMER. 1965. Energy production during nitrate res- piration by Aerobacter aerogenes. J. Gen. Microbiol. 35: 29-34.
HARVEY, H. W. 1955. Chemistry and fertility of sea water. Cambridge Univ. 224 p.
LONGMUIR, I. S. 1954. Respiration rate of bac- teria as a function of oxygen concentration. Biochem. J. 57: 81-87.
LURIA, S. E. 1960. The bacterial protoplasm: Composition and organization, p. 1-34. In I. C. Gunsalus and R. Y. Stanier [eds.], The bacteria, v. 1. Academic. 513 p.
MULLIN, J. B., AND J. P. RILEY. 1955. The colorimetric determination of silicate with special reference to sea and natural waters. Anal. Chim. Acta 12: 162-176.
MURPHY, J., AND J. P. RILEY. 1962. A modified single solution method for the determination of phosphate in natural waters. Anal. Chim. Acta 27: 31-36.
POURBAIX, M. 1966. Atlas of electrochemical equilibria in aqueous solutions. Pergamon. 644 p.
REDFIELD, A. C. 1934. On the proportions of organic derivatives in seawater and their rela-
tion to the composition of plankton, p. 176- 192. In James Johnstone Mem. Vol. Univ. Liverpool.
, B. H. KETCHUM, AND F. A. RICHARDS. 1963. The influence of organisms on the composition of sea water, p. 65-77. In M. N. Hill [ed.], The sea, v. 2. Interscience.
RICHARDS, F. A. 1957. Oxygen in the oceans, p. 185-238. In J. W. Hedgpeth [ed.], Trea- tise on marine ecology and paleoecology, v. 1. Geol. Soc. Amer. Mem. 67.
. 1965. Anoxic basins and fjords, p. 611- 645. In J. P. Riley and G. Skirrow [eds.], Chemical oceanography, v. 1. Academic.
,AND W. W. BROENKOW. 1971. Chem- ical changes, including nitrate reduction, in Darwin Bay, Galapagos Archipelago, over a 2-month period, 1969. Limnol. Oceanogr. 16: 758-765.
- J. D. CLINE, W. W. BROENKOW, AND L. P. ATKINSON. 1965. Some consequences of the decomposition of organic matter in Lake Nitinat, an anoxic fjord. Limnol. Oceanogr. 10(Suppl.): R185-R201.
, AND R. A. KLETSCH. 1964. A spectro- photometric determination of ammonia and labile amino compounds in fresh and seawa- ter by oxidation to nitrate, p. 65-81. In Y. Miyake and T. Koyama [eds.], Recent re- searches in the fields of hydrosphere, atmo- sphere and nuclear geochemistry. Maruzen.
SVERDRUP, H. U., M. W. JOHNSON, AND R. H. FLEMING. 1942. The oceans. Prentice-Hall. 1087 p.
SWINNERTON, J. W., V. J. LINNENBOM, AND C. H. CHEEK. 1962. Determination of dissolved gases in aqueous solutions by gas chromatog- raphy. Anal. Chem. 34: 483-485.
THOMAS, W. H. 1966. On denitrification in the northeastern tropical Pacific Ocean. Deep- Sea Res. 13: 1109-1114.
URBAN, P. J. 1961. Colorimetry of sulfur anions, part 1 and 2. Z. Anal. Chem. 179: 415-426.
VACCARO, R. F., AND J. H. RYTHER. 1960. Ma- rine phytoplankton and the distribution of nitrite in the sea. J. Cons., Cons. Perm. Int. Explor. Mer 25: 260-271.
WADA, E., AND A. HATTORI. 1971. Nitrite me- tabolism in the euphotic layer of the cen- tral North Pacific Ocean. Limnol. Oceanogr. 16: 766-772.
, AND . 1972. Nitrite distribution and nitrate reduction in deep-sea studies. Deep-Sea Res. 19: 123-132.
WEST, P. W., AND G. C. GAEKE. 1956. Fixation of sulfur dioxide as disulfitomercurate (II) and subsequent colorimetric estimation. Anal. Chem. 28: 1816-1819.
WOOD, E. D., F. A. J. ARMSTRONG, AND F. A. RICHARDS. 1967. Determination of nitrate in sea water by cadmium-copper reduction to nitrite. J. Mar. Biol. Ass. U.K. 47: 23-31.
This content downloaded from 62.122.73.30 on Mon, 23 Jun 2014 15:34:48 PMAll use subject to JSTOR Terms and Conditions