Embed Size (px)
Citation preview
A
e(ws©
K
1
tiditFbsrtCc
CCi
MT
0d
Journal of Chromatography A, 1159 (2007) 142–148
P-BOSS: A new filtering method for treasure hunting in metabolomics
Mineo Morohashi a, Kaori Shimizu b,c, Yoshiaki Ohashi a,c, Junji Abe a,Hirotada Mori c,d, Masaru Tomita a,b,c, Tomoyoshi Soga a,b,c,∗
a Human Metabolome Technologies, Inc., Yamagata 997-0052, Japanb Department of Environmental Information, Keio University, Kanagawa 252-8520, Japan
c Institute for Advanced Biosciences, Keio University, Yamagata 997-0017, Japand Graduate School of Biological Sciences, Nara Institute of Science and Technology, Nara 630-0101, Japan
Available online 19 March 2007
bstract
Metabolomics is expected to boost data driven research. In biomarker discovery, powerful filtering methods to remove noise and outliers aressential for screening significant candidates from the huge volume of omic data. Here we propose a post-measurement peak filtering method
named P-BOSS) for CE electrospray ionization–time-of-flight MS (CE–TOFMS) data. Combining outlier detection method functions in parallel,e applied P-BOSS to the data using Escherichia coli knockout mutants of the tryptophan and purine biosynthesis pathways. As the result, P-BOSShowed remarkably superior performance, reducing 65% of all peaks, while leaving significant peaks.2007 Elsevier B.V. All rights reserved.
tTe(o[astc
ytist
eywords: Metabolome; CE–TOFMS; CE–MS; AIC; Biomarker
. Introduction
Metabolomics is a relatively new discipline for high-hroughput metabolic profiling [1]. One of the major challengesn metabolomics is to quantitatively characterize metabolomeata simultaneously for system-level understanding of biolog-cal systems. Recently, a wide variety of metabolome analysisechnologies have emerged, including GC–MS [2,3], NMR [4],T IR spectroscopy [5], and CE–MS [6–9]. CE–MS has recentlyeen demonstrated as a powerful tool for the analysis of chargedpecies. Its major advantages are that it exhibits extremely highesolution and almost any charged species can be infused intohe mass spectrometer. In previous reports, we have shown thatE–MS techniques are quite useful for the global analysis ofharged metabolites [7,8].
Most intracellular metabolites have a charge, and thus
E–MS is particularly useful for revealing those metabolites.onsequently, CE–MS enables us to obtain a large amount ofnformation on metabolites, which can be helpful for profiling
∗ Corresponding author at: Human Metabolome Technologies, Inc., 246-2izukami Kakuganji, Tsuruoka, Yamagata 997-0052, Japan.
el.: +81 235 25 1447; fax: +81 235 25 1450.E-mail address: [email protected] (T. Soga).
CrnSso
br
021-9673/$ – see front matter © 2007 Elsevier B.V. All rights reserved.oi:10.1016/j.chroma.2007.03.054
he dynamics of metabolic pathways or for biomarker discovery.he data obtained by CE–MS have large numbers of peaks inach sample – typically >2000 peaks with CE time-of-flight MSCE–TOFMS) – as well as other omic data. Therefore, how tobtain useful and significant peaks remains a major challenge10–12]. Screening large numbers of peaks in advance shouldllow us to focus on succeeding data analyses. Though manytatistical methods have been proposed [13–16], they are likelyo be sensitive to data containing noise, resulting in significantompounds being overlooked.
Thousands of peaks can be detected by CE–MS and data anal-ses are processed either manually or automatically. Regardinghe peaks in metabolome analyses, the peaks can scarcely bedentified due to lack of metabolite standard data. They haveignificantly different characteristics from those of transcrip-omes or genomes. Moreover, due to the data characteristics ofE–MS, the peak shapes of many compounds are aberrant or are
elatively small, and thus they can hardly be distinguished fromoise peaks, which easily leads to false-positive peaks. Recently,tyczynski et al. proposed a method to extract peaks that are con-erved across samples without the need for a reference library
r manual curation [17].In the present study, we propose a powerful filtering methody which potentially false-positive peaks are removed, andeproducible peaks are retained. Our filtering method con-
omato
saIpaWde
tdfia
2
2e
Jadw5mmWwswxwd
2
lTGGQ
2
(ci+Fwt5t
2
as−5s1ww
2
wpceuApoaTS(rs
3
3
acpCltsemteosaoato
M. Morohashi et al. / J. Chr
ists of two filters functioning in parallel. One of the filtersutomatically determines the threshold values of parameters.t tends to remove non-reproducible peaks, potentially noiseeaks, while leaving reproducible peaks. The other filter ispplied to reproducible peaks to detect and remove outliers.e performed preprocessing after extracting peaks from each
ata, thereby reducing the data size and calculation costnormously.
To verify our method, experiments were conducted usingryptophan and purine biosynthesis-relevant knockout mutantata from Escherichia coli. Using the obtained data, we con-rmed that our method has powerful filtering functions whichre widely applicable to peak screening.
. Materials and methods
.1. Bacterial strains, growth conditions, and metabolitextraction
The E. coli strains JWK1253 (�trpB), JWK2461 (�purC),WK0512 (�purE), JWK3970 (�purH), JWK2541 (�purL),nd JWK2484 (�purM) were used [18]. The strains areerivatives of BW25113 [19]. Cells grown on LB platesere inoculated in a M9 minimal medium supplemented withmg/ml of l-tryptophan (adenine and guanine for purine-relatedutants) and incubated at 37 ◦C with shaking. Growth wasonitored by measuring optical density at 600 nm (OD600).hen cell density reached OD600 = approximately 0.8, cellsere collected by brief centrifugation and resuspended in the
ame volume of M9 medium without l-tryptophan. The cellsere collected at T0, T15, T30, and T60 (Tx indicates the timein minutes after amino acid shift-down). The metabolitesere extracted immediately at each time point as previouslyescribed [6].
.2. Instrumentation
All CE–TOFMS experiments were performed using an Agi-ent CE Capillary Electrophoresis System G1600A (Agilentechnologies, CA, USA), and an Agilent TOFMS System1969A. For system control and data acquisition, we used the2201AA Agilent ChemStation software for CE and the AnalystS for Agilent TOFMS software.
.3. CE–TOFMS conditions for cationic metabolites
Separations were carried out on a fused silica capillary50 �m i.d. × 100 cm total length) using 1 M formic acid forationic metabolites. Sample was injected with a pressurenjection of 50 mbar for 3 s. The applied voltage was set at30 kV. Sheath liquid was prepared as 50% MeOH/water.or TOFMS, ions were examined successively to cover the
hole range of m/z values from 50 through 1000. Fragmen-or voltage was set to 75 V. Skimmer voltage was set to0 V. Oct RFV was set to 125 V. Capillary voltage was seto 4000 V.
dtrs
gr. A 1159 (2007) 142–148 143
.4. CE–TOFMS conditions for anionic metabolites
Separations were carried out on SMILE(+) using 50 mMmmonium acetate (pH 8.5). Sample was injected with a pres-ure injection of 50 mbar for 30 s. The applied voltage was set at30 kV. Sheath liquid was prepared as 5 mM ammonium acetate
0% MeOH/water. For TOFMS, ions were examined succes-ively to cover the whole range of m/z values from 50 through000. Fragmentor voltage was set to 100 V. Skimmer voltageas set to 50 V. Oct RFV was set to 200 V. Capillary voltageas set to 3500 V.
.5. Data processing
Peak extraction was carried out using our proprietary soft-are (unpublished). It comprises two processes; that is, (1)eak picking, and (2) peak alignment. As for the first pro-ess, all peaks, potentially corresponding to compounds, arextracted (such functions are generally available as prod-cts such as Mass Hunter from Agilent Technologies, orMDIS for GC–MS based data [20]). After performing peakicking process, migration time was normalized using thatf internal standards. The second process was then appliedccording to similar m/z values and migration time values.he tolerance was set to 100 ppm and 0.5 min, respectively.tatistical analyses were performed using MATLAB R2006bMathworks, MA, USA). All other data processing was car-ied out using Excel 2003 (Microsoft, WA, USA), and Perlcript.
. Results and discussion
.1. Strategy and tactics for extracting significant peaks
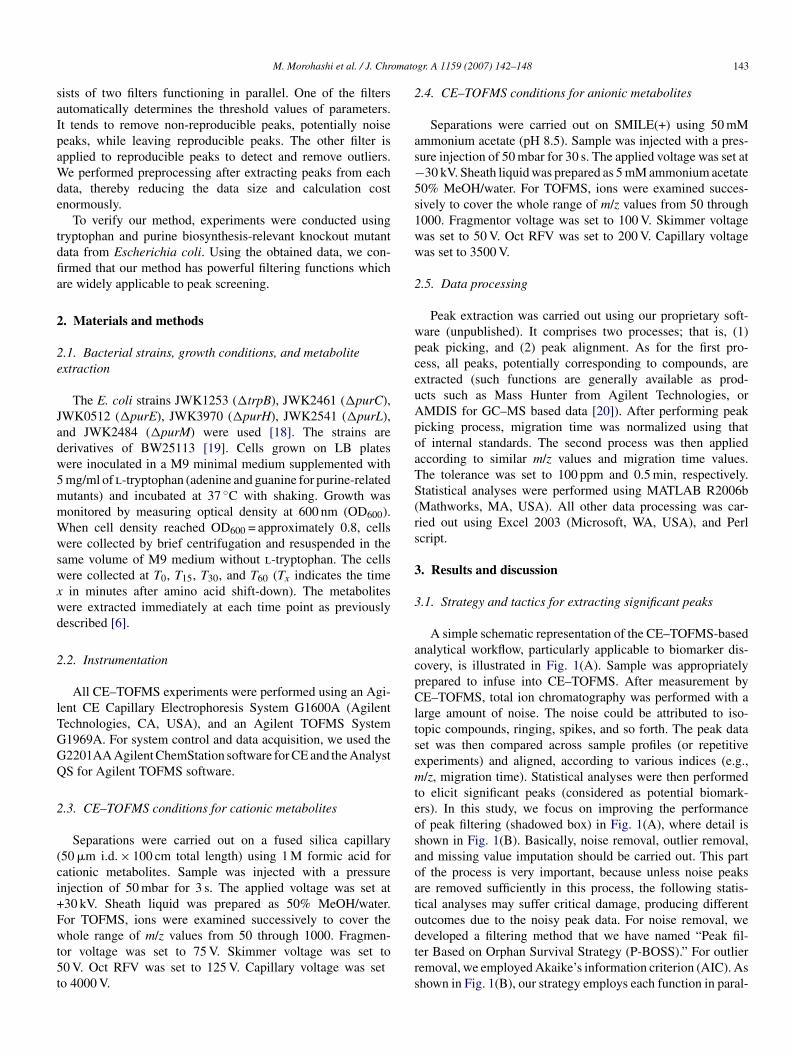
A simple schematic representation of the CE–TOFMS-basednalytical workflow, particularly applicable to biomarker dis-overy, is illustrated in Fig. 1(A). Sample was appropriatelyrepared to infuse into CE–TOFMS. After measurement byE–TOFMS, total ion chromatography was performed with a
arge amount of noise. The noise could be attributed to iso-opic compounds, ringing, spikes, and so forth. The peak dataet was then compared across sample profiles (or repetitivexperiments) and aligned, according to various indices (e.g.,/z, migration time). Statistical analyses were then performed
o elicit significant peaks (considered as potential biomark-rs). In this study, we focus on improving the performancef peak filtering (shadowed box) in Fig. 1(A), where detail ishown in Fig. 1(B). Basically, noise removal, outlier removal,nd missing value imputation should be carried out. This partf the process is very important, because unless noise peaksre removed sufficiently in this process, the following statis-ical analyses may suffer critical damage, producing differentutcomes due to the noisy peak data. For noise removal, we
eveloped a filtering method that we have named “Peak fil-er Based on Orphan Survival Strategy (P-BOSS).” For outlieremoval, we employed Akaike’s information criterion (AIC). Ashown in Fig. 1(B), our strategy employs each function in paral-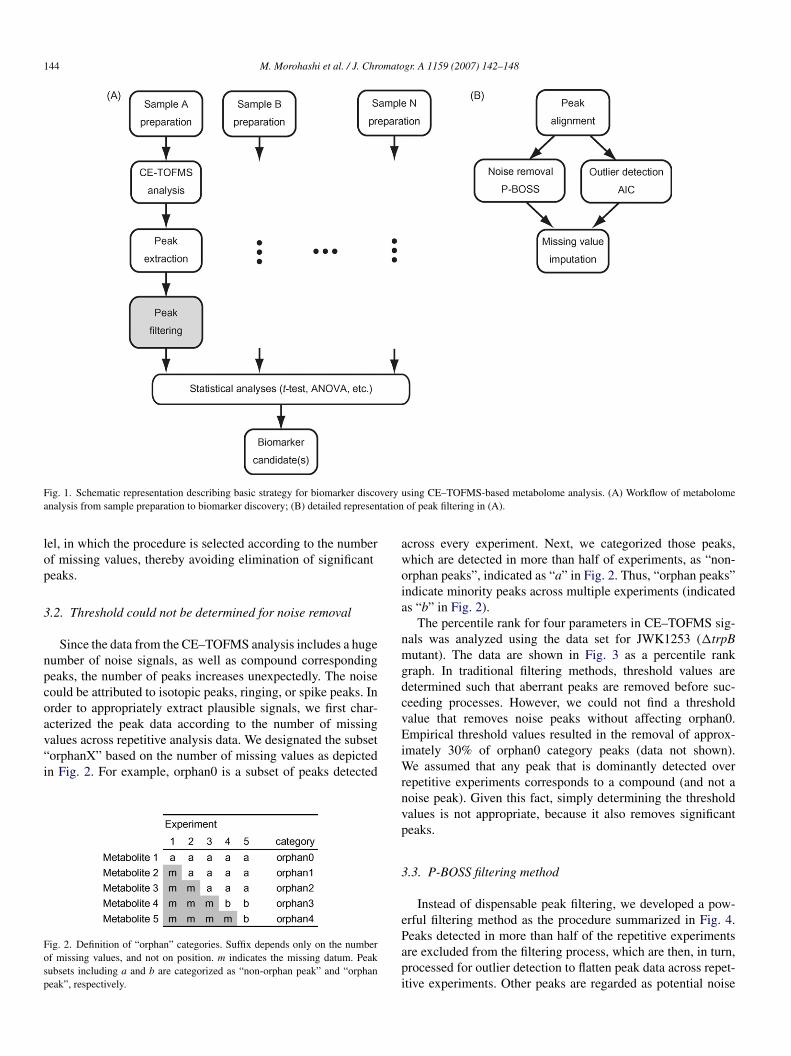
144 M. Morohashi et al. / J. Chromatogr. A 1159 (2007) 142–148
F very ua tation
lop
3
npcoav“i
Fosp
awoia
nmgdcv
ig. 1. Schematic representation describing basic strategy for biomarker disconalysis from sample preparation to biomarker discovery; (B) detailed represen
el, in which the procedure is selected according to the numberf missing values, thereby avoiding elimination of significanteaks.
.2. Threshold could not be determined for noise removal
Since the data from the CE–TOFMS analysis includes a hugeumber of noise signals, as well as compound correspondingeaks, the number of peaks increases unexpectedly. The noiseould be attributed to isotopic peaks, ringing, or spike peaks. Inrder to appropriately extract plausible signals, we first char-
cterized the peak data according to the number of missingalues across repetitive analysis data. We designated the subsetorphanX” based on the number of missing values as depictedn Fig. 2. For example, orphan0 is a subset of peaks detectedig. 2. Definition of “orphan” categories. Suffix depends only on the numberf missing values, and not on position. m indicates the missing datum. Peakubsets including a and b are categorized as “non-orphan peak” and “orphaneak”, respectively.
EiWrnvp
3
ePapi
sing CE–TOFMS-based metabolome analysis. (A) Workflow of metabolomeof peak filtering in (A).
cross every experiment. Next, we categorized those peaks,hich are detected in more than half of experiments, as “non-rphan peaks”, indicated as “a” in Fig. 2. Thus, “orphan peaks”ndicate minority peaks across multiple experiments (indicateds “b” in Fig. 2).
The percentile rank for four parameters in CE–TOFMS sig-als was analyzed using the data set for JWK1253 (�trpButant). The data are shown in Fig. 3 as a percentile rank
raph. In traditional filtering methods, threshold values areetermined such that aberrant peaks are removed before suc-eeding processes. However, we could not find a thresholdalue that removes noise peaks without affecting orphan0.mpirical threshold values resulted in the removal of approx-
mately 30% of orphan0 category peaks (data not shown).e assumed that any peak that is dominantly detected over
epetitive experiments corresponds to a compound (and not aoise peak). Given this fact, simply determining the thresholdalues is not appropriate, because it also removes significanteaks.
.3. P-BOSS filtering method
Instead of dispensable peak filtering, we developed a pow-rful filtering method as the procedure summarized in Fig. 4.
eaks detected in more than half of the repetitive experimentsre excluded from the filtering process, which are then, in turn,rocessed for outlier detection to flatten peak data across repet-tive experiments. Other peaks are regarded as potential noise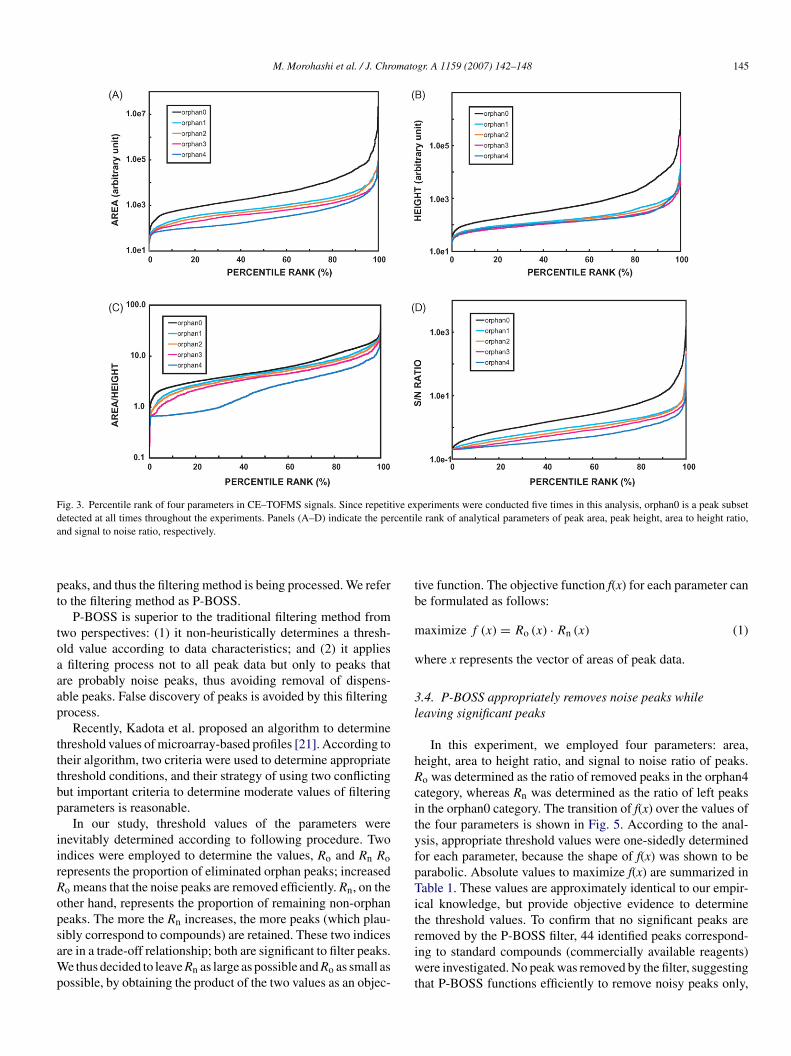
M. Morohashi et al. / J. Chromatogr. A 1159 (2007) 142–148 145
Fig. 3. Percentile rank of four parameters in CE–TOFMS signals. Since repetitive experiments were conducted five times in this analysis, orphan0 is a peak subsetd centila
pt
toaaap
tttbp
iirRopsaWp
tb
m
w
3l
hRcityfpTit
etected at all times throughout the experiments. Panels (A–D) indicate the pernd signal to noise ratio, respectively.
eaks, and thus the filtering method is being processed. We refero the filtering method as P-BOSS.
P-BOSS is superior to the traditional filtering method fromwo perspectives: (1) it non-heuristically determines a thresh-ld value according to data characteristics; and (2) it appliesfiltering process not to all peak data but only to peaks that
re probably noise peaks, thus avoiding removal of dispens-ble peaks. False discovery of peaks is avoided by this filteringrocess.
Recently, Kadota et al. proposed an algorithm to determinehreshold values of microarray-based profiles [21]. According toheir algorithm, two criteria were used to determine appropriatehreshold conditions, and their strategy of using two conflictingut important criteria to determine moderate values of filteringarameters is reasonable.
In our study, threshold values of the parameters werenevitably determined according to following procedure. Twondices were employed to determine the values, Ro and Rn Roepresents the proportion of eliminated orphan peaks; increasedo means that the noise peaks are removed efficiently. Rn, on thether hand, represents the proportion of remaining non-orphaneaks. The more the Rn increases, the more peaks (which plau-
ibly correspond to compounds) are retained. These two indicesre in a trade-off relationship; both are significant to filter peaks.e thus decided to leave Rn as large as possible and Ro as small asossible, by obtaining the product of the two values as an objec-
riwt
e rank of analytical parameters of peak area, peak height, area to height ratio,
ive function. The objective function f(x) for each parameter cane formulated as follows:
aximize f (x) = Ro (x) · Rn (x) (1)
here x represents the vector of areas of peak data.
.4. P-BOSS appropriately removes noise peaks whileeaving significant peaks
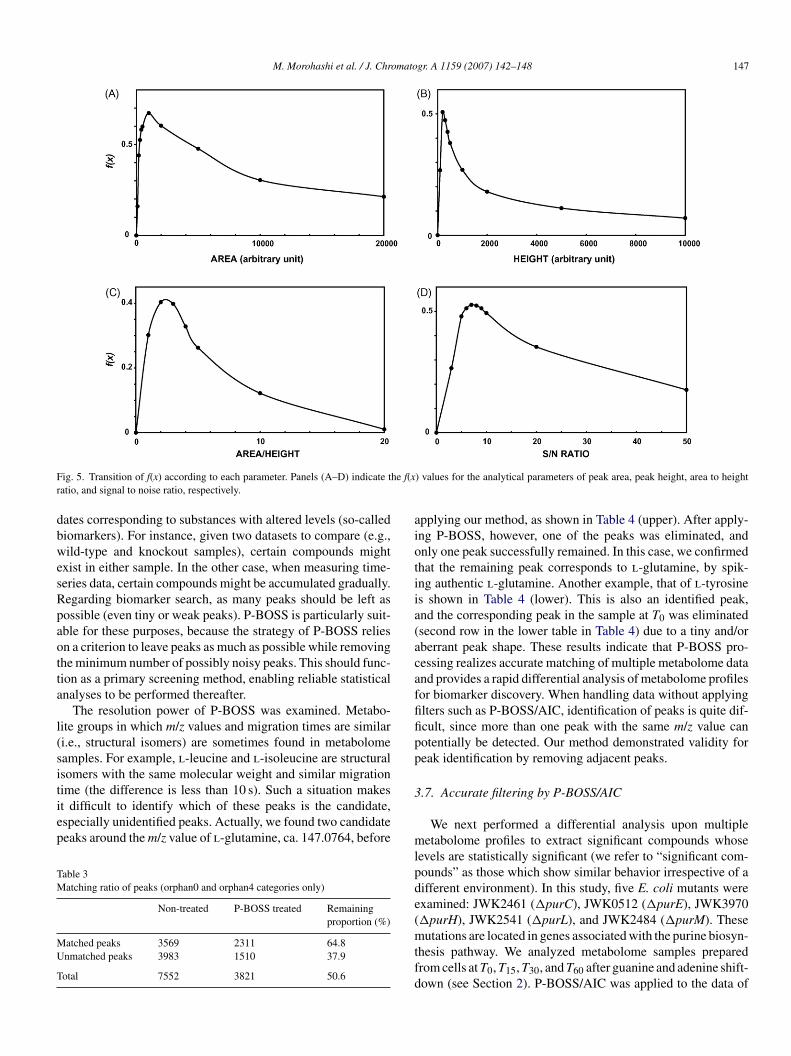
In this experiment, we employed four parameters: area,eight, area to height ratio, and signal to noise ratio of peaks.o was determined as the ratio of removed peaks in the orphan4ategory, whereas Rn was determined as the ratio of left peaksn the orphan0 category. The transition of f(x) over the values ofhe four parameters is shown in Fig. 5. According to the anal-sis, appropriate threshold values were one-sidedly determinedor each parameter, because the shape of f(x) was shown to bearabolic. Absolute values to maximize f(x) are summarized inable 1. These values are approximately identical to our empir-
cal knowledge, but provide objective evidence to determinehe threshold values. To confirm that no significant peaks are
emoved by the P-BOSS filter, 44 identified peaks correspond-ng to standard compounds (commercially available reagents)ere investigated. No peak was removed by the filter, suggestinghat P-BOSS functions efficiently to remove noisy peaks only,
146 M. Morohashi et al. / J. Chromatogr. A 1159 (2007) 142–148
wwcevlam
Table 1Threshold values determined according to the max value of f(x)
Parameter Threshold f(x)
Areaa 1000 0.67Heighta 200 0.51AS
3P
eTb(loueatitpaTot(at
3
im(tvmtmbpeaks remained 1.7-fold more than that of unmatched peaks,suggesting that the peaks detected in either sample, correspond-ing to unmatched peaks, are aberrant/noise peaks. The remainingorphan peaks after P-BOSS/AIC treatment are potential candi-
Table 2Results between before and after applying P-BOSS
Fig. 4. Schematic representation of filtering process with P-BOSS/AIC.
ithout removing significant (compound) peaks. Even if peaksere non-orphan (no missing values), they varied in area (mean
oefficient of variation was 32%). This implies that outliers arexactly contained in the experimental data, which cause a large
ariance of scattering data. Tiny and/or deformed peaks are mostikely to yield a variance. Eliminating the variance should yielddifference of biomarkers in the chaotic raw data obtained byetabolome analysis.NP
rea/height 2 0.40/N ratio 7 0.53
a Arbitrary unit.
.5. Introduction of Akaike’s information criterion to-BOSS
In order to smooth the values (i.e., detecting outliers), wemployed a method based on Akaike’s information criterion.he main advantage of the method is objectiveness of decision,ecause the procedure is independent of a level of significancei.e., p-values). In addition, the method can detect multiple out-iers without setting the number of outliers; that is, the number ofutliers varies depending upon the data set. AIC was used to eval-ate mouse DNA microarray expression profiles, and proved itsfficiency [22]. We applied the method to the data above in par-llel with the noise filter. The data set was first categorized intowo groups (i.e., orphan peaks and non-orphan peaks), accord-ng to the number of missing values. P-BOSS was applied tohe orphan peaks, while AIC was applied to the non-orphaneaks. For calculating f(x), orphan4 was used to determine Ro,nd orphan0 to determine Rn. The results are shown in Table 2.he data showed that upon applying P-BOSS/AIC, the numberf peaks in the raw data (JWK1253 at T0, n = 5) was reducedo 54% (due to P-BOSS), and the coefficient of variation to 1/4due to AIC). These results reveal that the combination of AICnd P-BOSS successfully eliminates the noise peaks and leaveshe significant peaks in variable repetitive data.
.6. Differential analysis using P-BOSS/AIC
Next, we compared two associated metabolome data tonvestigate the ability of the P-BOSS/AIC combination. The
etabolome data used here are provided from E. coli JWK1253�trpB) at T0 and T15 (n = 5 each). The data were processedhrough P-BOSS/AIC as mentioned above, and representativealues for all peaks were extracted. The values were thenatched according to m/z (determined by MS) and migra-
ion time (determined by CE). Table 3 shows the number ofatched/unmatched peaks in orphan0 and orphan4 categories
etween the samples at T0 and T15. The portion of matched
Number of peaks RSD (%)
on-treated 5356 32-BOSS treated 2918 8
M. Morohashi et al. / J. Chromatogr. A 1159 (2007) 142–148 147
F he f(xr
dbwesRpaotta
l(sitiep
TM
MU
T
aiotiia(acaffifipp
ig. 5. Transition of f(x) according to each parameter. Panels (A–D) indicate tatio, and signal to noise ratio, respectively.
ates corresponding to substances with altered levels (so-callediomarkers). For instance, given two datasets to compare (e.g.,ild-type and knockout samples), certain compounds might
xist in either sample. In the other case, when measuring time-eries data, certain compounds might be accumulated gradually.egarding biomarker search, as many peaks should be left asossible (even tiny or weak peaks). P-BOSS is particularly suit-ble for these purposes, because the strategy of P-BOSS reliesn a criterion to leave peaks as much as possible while removinghe minimum number of possibly noisy peaks. This should func-ion as a primary screening method, enabling reliable statisticalnalyses to be performed thereafter.
The resolution power of P-BOSS was examined. Metabo-ite groups in which m/z values and migration times are similari.e., structural isomers) are sometimes found in metabolomeamples. For example, l-leucine and l-isoleucine are structuralsomers with the same molecular weight and similar migration
ime (the difference is less than 10 s). Such a situation makest difficult to identify which of these peaks is the candidate,specially unidentified peaks. Actually, we found two candidateeaks around the m/z value of l-glutamine, ca. 147.0764, beforeable 3atching ratio of peaks (orphan0 and orphan4 categories only)
Non-treated P-BOSS treated Remainingproportion (%)
atched peaks 3569 2311 64.8nmatched peaks 3983 1510 37.9
otal 7552 3821 50.6
3
mlpde(mtfd
) values for the analytical parameters of peak area, peak height, area to height
pplying our method, as shown in Table 4 (upper). After apply-ng P-BOSS, however, one of the peaks was eliminated, andnly one peak successfully remained. In this case, we confirmedhat the remaining peak corresponds to l-glutamine, by spik-ng authentic l-glutamine. Another example, that of l-tyrosines shown in Table 4 (lower). This is also an identified peak,nd the corresponding peak in the sample at T0 was eliminatedsecond row in the lower table in Table 4) due to a tiny and/orberrant peak shape. These results indicate that P-BOSS pro-essing realizes accurate matching of multiple metabolome datand provides a rapid differential analysis of metabolome profilesor biomarker discovery. When handling data without applyinglters such as P-BOSS/AIC, identification of peaks is quite dif-cult, since more than one peak with the same m/z value canotentially be detected. Our method demonstrated validity foreak identification by removing adjacent peaks.
.7. Accurate filtering by P-BOSS/AIC
We next performed a differential analysis upon multipleetabolome profiles to extract significant compounds whose
evels are statistically significant (we refer to “significant com-ounds” as those which show similar behavior irrespective of aifferent environment). In this study, five E. coli mutants werexamined: JWK2461 (�purC), JWK0512 (�purE), JWK3970�purH), JWK2541 (�purL), and JWK2484 (�purM). These
utations are located in genes associated with the purine biosyn-hesis pathway. We analyzed metabolome samples preparedrom cells at T0, T15, T30, and T60 after guanine and adenine shift-own (see Section 2). P-BOSS/AIC was applied to the data of
148 M. Morohashi et al. / J. Chromatogr. A 1159 (2007) 142–148
Table 4Removal of ambiguous peaks adjacent to objective peaks
A
eaa(obtsfif6cmptpff
4
psBct
A
fKmM
R
[[[[
[
[
[[
[
[
bbreviation: MT; migration time, ND; not detected.
ach mutant. To evaluate the performance of P-BOSS/AIC, welso examined the original profiles (neither P-BOSS or AIC waspplied). For metabolome data on each mutant, P-BOSS/AICor none for original profiles) was applied, and then the numberf extracted candidates was examined by differential analysisy matching each peak. To find a significant difference amonghe profiles, ANOVA (analysis of variance) was performed toee which peak shows a significant difference among the pro-les. The significance level was set within 5%. As the result, weound striking difference between the profiles. P-BOSS reduced5% of peaks (20651 to 7305 peaks), while leaving all significantompounds (934 peaks). Further, P-BOSS resulted in adding 5%ore significant peaks (48 peaks), due to removing ambiguous
eaks adjacent to significant ones. This result clearly indicateshat P-BOSS has outstanding advantages in screening significanteaks. While there need to develop additional filtering methodor further screening the peaks, P-BOSS can be a powerful filteror initial screening.
. Concluding remarks
We have proposed here a powerful filtering method for thereprocessing of metabolome data measured by a CE–TOFMSystem. Employing an appropriate filtering method, such as P-OSS/AIC, should thus enable us to narrow down potentialompound-associated peaks. Our strategy is widely applicableo omics-based biomarker discovery.
cknowledgements
We are grateful to Tomoya Baba and Kenji Nakahigashi
or kind assistance in bacterial sample preparation. We thankotaro Oka for fruitful discussions. We also thank Seira Naka-ura, Gin Maeta for technical support, and members of Humanetabolome Technologies for their helpful discussions.[[
[
eferences
[1] O. Fiehn, Plant Mol. Biol. 48 (2002) 155.[2] O. Fiehn, J. Kopka, P. Dormann, T. Altmann, R.N. Trethewey, L. Willmitzer,
Nat. Biotechnol. 18 (2000) 1157.[3] O. Fiehn, J. Kopka, R.N. Trethewey, L. Willmitzer, Anal. Chem. 72 (2000)
3573.[4] N.V. Reo, Drug Chem. Toxicol. 25 (2002) 375.[5] G.G. Harrigan, R.H. LaPlante, G.N. Cosma, G. Cockerell, R. Goodacre,
J.F. Maddox, J.P. Luyendyk, P.E. Ganey, R.A. Roth, Toxicol. Lett. 146(2004) 197.
[6] T. Soga, Y. Ohashi, Y. Ueno, H. Naraoka, M. Tomita, T. Nishioka, J.Proteome Res. 2 (2003) 488.
[7] T. Soga, Y. Ueno, H. Naraoka, K. Matsuda, M. Tomita, T. Nishioka, Anal.Chem. 74 (2002) 6224.
[8] T. Soga, Y. Ueno, H. Naraoka, Y. Ohashi, M. Tomita, T. Nishioka, Anal.Chem. 74 (2002) 2233.
[9] T. Soga, R. Baran, M. Suematsu, Y. Ueno, S. Ikeda, T. Sakurakawa, Y.Kakazu, T. Ishikawa, M. Robert, T. Nishioka, M. Tomita, J. Biol. Chem.281 (2006) 16768.
10] D.I. Broadhurst, D.B. Kell, Metabolomics 2 (2006) 171.11] R.M. Jarvis, R. Goodacre, Bioinformatics 21 (2005) 860.12] D.B. Kell, Curr. Opin. Microbiol. 7 (2004) 296.13] M.Y. Hirai, M. Yano, D.B. Goodenowe, S. Kanaya, T. Kimura, M.
Awazuhara, M. Arita, T. Fujiwara, K. Saito, Proc. Natl. Acad. Sci. U.S.A.101 (2004) 10205.
14] L.M. Raamsdonk, B. Teusink, D. Broadhurst, N. Zhang, A. Hayes, M.C.Walsh, J.A. Berden, K.M. Brindle, D.B. Kell, J.J. Rowland, H.V. Wester-hoff, K. van Dam, S.G. Oliver, Nat. Biotechnol. 19 (2001) 45.
15] J. Taylor, R.D. King, T. Altmann, O. Fiehn, Bioinformatics 18 (Suppl. 2)(2002) S241.
16] W. Weckwerth, K. Morgenthal, Drug Discov. Today 10 (2005) 1551.17] M.P. Styczynski, J.F. Moxley, L.V. Tong, J.L. Walther, K.L. Jensen, G.N.
Stephanopoulos, Anal. Chem. 79 (2007) 966.18] T. Baba, T. Ara, M. Hasegawa, Y. Takai, Y. Okumura, M. Baba, K.A.
Datsenko, M. Tomita, B.L. Wanner, H. Mori, Mol. Syst. Biol. (2006).19] K.A. Datsenko, B.L. Wanner, Proc. Natl. Acad. Sci. U.S.A. 97 (2000) 6640.
20] S.E. Stein, J. Am. Soc. Mass Spectrom. 10 (1999) 770.21] K. Kadota, R. Miki, H. Bono, K. Shimizu, Y. Okazaki, Y. Hayashizaki,Physiol. Genomics 4 (2001) 183.22] K. Kadota, S. Nishimura, H. Bono, S. Nakamura, Y. Hayashizaki, Y.
Okazaki, K. Takahashi, Physiol. Genomics 12 (2003) 251.


![Metabolomics Basics[1]](https://img.pdfslide.net/doc/110x75/553de2815503466f378b4864/metabolomics-basics1.jpg)