Embed Size (px)
Citation preview

Page 1 of 19
PATNI COMPUTERS: MARCH 2009 (SUB) PRIMED FOR VALUE INVESTORS?
Prologue
Mallikarjun Gaddam, an India based investment advisor, led a small hyderabad based Investment Fund. The India growth story had of late, attracted a lot of international institutions to look for opportunities here. Scouring through the economic news over the past few months, Mallikarjun had been observing the precipitous fall in the share prices of Patni Computer Systems. The decline that began during the first quarter of the 2007 financial year had depressed the shares by nearly 80 %1 nearing March 2009. As of March 2009, the shares were trading at INR2 120, nearly 43% off their 52 week highs.
The market’s reaction to the subprime crisis of late 2008 in the U.S. and the subsequent financial turmoil seemed to have provided a unique opportunity to own a company that was trading at a severe discount to its intrinsic value. To Mallikarjun, it seemed like the right time to get busy in finding a great bargain and adding to his portfolio. Still, he wanted to tread cautiously. Was it safer to wait and watch or would he end up missing the bus? He didn’t want to make the error of ‘catching a falling knife’. Intelligent investing called for some research and analysis. “It's far better to buy a wonderful company at a fair price than a fair company at a wonderful price.”
-‐Warren Buffet
Company Background Patni Computer Systems Ltd., a provider of Information Technology (IT) Services and Business Solutions, was among the pioneering companies like Tata Consultancy Services (TCS) and Infosys Technologies (Infosys) that started the IT services movement in India. In fact, this 30 year old company was one of the first Indian IT companies to offer outsourcing of IT services.
This case is prepared by Mallikarjun Gaddam from the Indian School of Business
Back in 1972, the founder duo of Narendra Patni and his wife Poonam Patni, took the first steps towards setting up a successful IT offshore business model. The company that started operations with just 20 people in Pune had grown to employ over 15,000 people by 2009 and had 23 international offices across the Americas, Europe and the Asia-‐Pacific region. During Patni's
1 www.nseindia.com 2 INR=1 Indian rupee

Page 2 of 19
formative years, future stalwarts like Narayana Murthy, Nandan Nilekani and S. Gopalkrishan, who later famously went on to start Infosys Technologies, had been employees of the company. Patni delivered a range of IT services through globally integrated onsite and offshore delivery locations, the latter primarily in India. The Company offered its services to customers through industry (vertical) -‐ focused practices, including insurance, manufacturing, retail, distribution, financial services, communications, media and utilities, and through technology-‐focused practices3. Its service lines included application development, application maintenance and support, packaged software implementation, infrastructure management services, product engineering services, business process outsourcing and quality assurance services. Patni was engaged in offering end-‐to-‐end IT solutions and was mainly dependent on traditional services like Application Development Management (ADM) and package software implementation for a major portion of its revenues. The early 1990s saw the company focusing predominantly on its hardware market and therefore not taking advantage of growth opportunities in the software business. Faced with sluggish growth, Narendra Patni roped in consulting group McKinsey for recommendations on how to scale up the business. McKinsey recommended a massive restructuring of the Patni organization into strategic business units based on market segments, with technological expertise supported by horizontal groups, enabling Patni to emerge as a formidable player in the Indian IT space. The company's revenues had grown from USD 17 million in 1996 to USD 656 million by 2009. Strategic Alliances and Acquisitions As part of its expansion and growth strategy, Patni relied on targeted acquisitions. It made selective acquisitions that added to its existing capabilities and also helped plug any gaps in industry or technical expertise. It also increased their presence in terms of service lines offered, as well as their geographic coverage. In November 2004, the company enhanced its expertise in the telecommunications industry by acquiring Cymbal Corporation, a U.S. based IT Services Company. In July 2006, Patni formed a strategic alliance with Savvion4, the industry's leading business process management (BPM) company. Patni leveraged its domain expertise and knowledge of industry best practices to collaborate with, control, and improve the business processes of its clients with Savvion Business Manager. In order to further sharpen its competitive edge, Patni entered into the Product Engineering Space (PDS) by acquiring Zaiq Technologies in June 2006. However, the company could not fully reap rewards from this acquisition and the revenue share of PDS remained almost unchanged.
3 Patni Computers, Financial release , Fact Sheet 2008 4 General Atlantic: Global Growth Investors

Page 3 of 19
During the third quarter of 2007, Patni acquired Europe based telecommunications company Logan-‐Orviss International (LOI) and U.S. based life sciences company Taratec Development Corporation. The launch of consulting services within its manufacturing business unit helped the company in providing a broader range of services while the LOI5 acquisition strengthened Patni's capabilities in communications and media practices. The acquisition of Taratec enabled Patni to own and develop life science consultancy capabilities in the areas of regulatory compliance, analytics, drug safety and Pharma co-‐vigilance. Management and Control The Patni brothers, Narendra Patni, Gajendra Patni and Ashok Kumar Patni had been engaged in a stake war. Gajendra Patni and his son Amit Patni were also engaged in power sector projects, and held a substantive stake in Patni along with the rest of the family. To sell their stake to any Private Equity (PE) investors, the other two brothers would have to go through Narendra Patni due to an agreement which conferred on him veto rights until 2013. Therefore, no significant investor could enter without the concurrence of Narendra Patni during the tenure of this agreement. Industry Overview The IT industry had been playing a crucial role in fuelling Indian economic growth, especially over the past two decades. This was evident from the fact that the IT and the IT enabled services (ITes) Sector had generated total revenue of USD 64 billion6 in FY 2008 contributing over 5.5% to the overall GDP of India. The India IT sector could be viewed in two parts, the domestic market and the global exports market. Contributing 64 percent to overall aggregate revenues, exports had remained the mainstay of the Indian IT-‐BPO growth story. Software and services exports, accounting for over 98 per cent of total industry exports, had crossed USD 40.4 billion and had directly employed over 2 million professionals in FY2008 – a commendable achievement in over just two decades. While the U.S. and the United Kingdom (U.K.) remained the largest export markets (accounting for about 61 per cent and 18 per cent respectively of industry exports in FY2007), the Indian IT industry's footprint had been steadily expanding. If one considered the top five Indian players that accounted for 46% of IT industry’s revenues, the revenue contribution from their U.S. clients was approximately 58% during FY 2007. The U.S. sub-‐prime crisis and its impact on Indian IT The unprecedented financial meltdown which led to the subsequent recession across the globe in the year 2008 had created an environment of macroeconomic volatility and high uncertainty.
5 Regent : Investment Banking Service provider 6 Indialawoffices.com/informationtechnology

Page 4 of 19
Following the collapse of the boom in the housing sector, the effects of the subprime crisis in the U.S. reverberated through the economies of many countries. During the high demand for housing loans in the U.S., while the real estate sector was booming, people with questionable credit histories were provided loans at higher-‐than-‐normal interest rates (sub-‐prime rates). A decline in economic activity in the U.S. resulted in lower disposable incomes and hence a decline in demand. Simultaneously there was a rise in housing supply due to foreclosures arising from lax credit standards and increased interest rates. This triggered the immediate subprime crisis. The global financial crisis of 2008, following from the U.S. sub-‐prime crisis, had led to a slowdown in major global economies. As a result, organizations around the world were forced to implement cuts in practically all areas of business spending including technology investments. The Indian IT and Business Process Outsourcing (BPO) industry was not immune to these unprecedented global developments. India, being one of the world’s fastest-‐growing tech markets thriving mainly on exports, was especially vulnerable to the tremors of the global economic crisis. Significant slowdown in IT investments The recessionary wave sweeping the world had a direct bearing on the Indian IT-‐BPO industry, since it was an integral part of the global IT value chain. Cost-‐pressures across most geographies and industries had resulted in intense ‘pricing and volume pressures’, and longer sales cycles. Added to this was the financial meltdown on Wall Street, and the concomitant margin pressure due to the weakening dollar against major global currencies and ever-‐increasing employee costs. The trend of a dip in IT investments was evident from the significant decline in IT contracts (in value terms) in 2008, the highest drop in the past 10 years. All these factors had a substantial impact on the Indian IT sector (see Exhibit 1). Expected recovery in global IT spends
The slowdown in major global economies was expected to hamper IT investments in 2009. IT spending worldwide was expected to drop by 3% year on year in 20097 (see Exhibit 2). Within IT, the impact of the economic slowdown was expected to be the highest in the segments of hardware and IT services, followed by the software segment (see Exhibit 3). With a turnaround expected in all the major economies in Calendar Year (CY) 10, investment in IT would only pick up by CY10 (see Exhibit 4). Outlook for India-‐based IT vendors
As a result of the downward revision in growth estimates provided by the World Bank and the OECD for developed economies (for 2009 and 2010), there would be a further cut in clients’ IT
7 Forrester Research report –“Outlook For Global And US IT Purchases In 2009”

Page 5 of 19
budgets. This would in turn put pressure on the growth expectations of Indian IT companies in FY10. From an average annual growth of around +30% in the past (excluding FY09), the Indian IT industry’s overall growth was expected to taper-‐off to around 15% over the next five years.8 It was expected that the Indian IT industry, which saw a 34% CAGR in IT exports over FY00-‐08 (driven by cost benefits from off-‐shoring), would register low single-‐digit growth in volumes in FY10 due to cuts in global IT budgets. Moreover, Indian IT companies would face margin pressure, as clients were likely to push for cuts in billing rates. One way to compensate for the cuts would be lower wages or offer no wage increases, leading to a reduction in the variable component of employee costs, which accounted for an average 15-‐20% of the total employee compensation. FII Shareholding An indirect impact of the global financial crisis had been lower FII capital inflow into both Indian equities as well as debt instruments. The Indian Capital market had been left reeling under the impact of a liquidity crunch in early 2008 as Foreign Institutional Investors (FIIs) withdrew more than USD 2.4 billion during that period. It was striking to note that Patni had one of the highest holding by FIIs (22 percent9) in December 2007. Exhibit 5 depicts the FII holdings of its comparables. There came a situation when the Reserve Bank of India (RBI), in March 2007, had banned any further buying of FIIs in Patni as the FII limit for the scrip already reached a threshold. However, by March 2009, FII shareholding in Patni was down to 12 percent10. Strong Client base with healthy Customer Relationships Similar to other Indian IT firms, Patni too faced a steep decline in its stock market price during the financial meltdown. A noticeable aspect, however, was that during this period, none of Patni’s clients either shut down or filed for bankruptcy11. A significant proportion of the revenues came from clients in manufacturing, insurance, financial services and telecommunications industries. While its Indian peers had clients predominantly in the financial domain, (e.g., Wipro had Lehman Brothers as its leading client, TCS and Cognizant had CitiGroup as a client)12, Patni had concentrated on the manufacturing and product engineering domain with GE as its leading client for several decades. Not having big clients in the financial domain had been considered a disadvantage a few years back. In hindsight, this now appeared to be favourable for Patni. The company maintained excellent relationships with its customers. It continued to cultivate its client base and had several big clients that were closely related to the company -‐ viz. General
8 Asit C. Mehta Investment Intermediates Ltd. (Source: IDC Research report) 9 National Stock Exchange (nseindia.com) 10 Patni had 135.815 million shares outstanding as on 31/12/08 (Source: Patni Computers, Financial releases, Fact Sheet 2008, and CapitaLine) 11 PPFAS Research report 12 Deloitte : Global economic slowdown and its impact on the Indian IT industry

Page 6 of 19
Electric (which was also a principal shareholder), State Farm Insurance, ABN AMRO, Hitachi, MetLife and St. Jude Medical. Its customer base had increased significantly from 239 clients in 2006 to 320 clients at the end of Q1:FY09. Approximately 94 clients generated over $1 million each in revenues for the company.
Patni was also highly successful in retaining its clients. Patni offered two types of contracts to
its clients: ‘time and materials’ and ‘fixed-‐price’. Time and materials contracts generated revenues by the amount of time and materials that were utilized on a project, with a set profit margin included in the contract. On the other hand, fixed-‐price contracts were more stringent on costs as, irrespective of the costs, the same billing amount was charged as revenues every month. Fixed-‐price contracts tended to be riskier as the company could stand to lose money if the costs exceeded revenues from the contract. However, these contracts were more attractive to customers. From Patni’s standpoint, although riskier, such contracts ensured a fixed revenue flow during the life of the contract. In order to minimize the negative impact of declining volumes, the company focused on converting more contracts to the fixed-‐price type. With this continuous shift towards more fixed-‐price contracts, the percentage of revenues that was based on such contracts increased significantly to 37.5% in Q1:FY09, compared to 34.4% in Q1:FY08. This improved the revenue visibility during the life of the contract. As the main business of the company was traditional service line offerings which are long-‐term outsourced contracts in nature, nearly 94% of the company's business was routine and annuity based. Even during rough times, business from existing customers looked positive:13
Revenues by clients 2006 2007 2008 Top Client 13.50% 12.50% 11.00% Top 5 Clients 38.00% 34.20% 34.60% Repeat Business 91.00% 90.00% 94.00%
Expansion in Europe Patni derived a major portion of its revenue from the U.S., followed by Europe, the Middle East and Africa (EMEA) and Asia Pacific (APAC). Given the company’s low penetration into conservative markets such as Europe, it depended more heavily on the U.S. market when compared to the other Indian tier-‐I IT companies14. As can be seen from Exhibit 6, which provides a geographical breakdown of Patni's revenues, the company had relatively higher geographical concentration in comparison to its peers. Unlike the U.S. market, Europe was conservative in off-‐shoring. Moreover, Indian companies faced significant linguistic and cultural challenges in this market. To overcome this, top-‐tier IT 13 Fact Sheet 14 PPFAS Research Report

Page 7 of 19
companies had expanded their near-‐shore presence to serve continental Europe-‐based clients. Patni had also appointed four senior executives in continental Europe to alleviate its geographical risk and expand operations into other markets. However, it would require considerable time to penetrate the conservative European market, and realize benefits from these initiatives. Exchange rate woes
The company had recorded foreign exchange related losses of USD 18.4 million in 200815 . Any additional fluctuation of the Indian rupee against the dollar could also hurt the company’s future results, as over 98% of the company's revenues were derived from outside of India. As the company priced most of its contracts in the local currency of its clients while its costs were incurred in Indian Rupees, a large swing in exchange rates could lead to decreasing revenues with expenses remaining constant. This could adversely affect the company's bottom line. High Attrition Rate and Lower utilization Patni had one of the highest employee attrition rates in the industry (see Exhibit 7). This had a direct impact on profitability, as higher attrition affected the utilization level of employees while increasing employee training costs. Furthermore, competition was becoming intense in India as multinational companies were entering the country and setting up their own development centers to rationalize costs and increase profits. This could cause a shortage of workers or salary appreciation or both, which in turn could have a negative effect on Patni’s efforts in improving its attrition and utilization rates. Deployment of surplus cash balance Patni had a cash and cash equivalent balance of around INR15 billion as of end of 1Q CY09— which was around half the size of its balance sheet. As can be seen from Exhibit 8, although it had funded its capex via internal accruals, it had raised equity in CY04 (from an IPO) and CY05 (through issue of American Depository Receipts [ADRs]). Patni’s huge cash balance had been dragging down its return ratios which were turning out to be the lowest among Indian IT players (see Exhibit 9). Based on an analysis of Patni’s cash flow statement , it seemed that it had neither efficiently deployed the surplus cash in its own business (by acquisition of new capabilities, except a few small ones) nor increased dividend payments to shareholders.
As the decision on deployment of the surplus cash balance lay with Mr. Narendra Patni (the promoter with veto power), minority shareholders did not yet stand to gain from the huge cash balance. Only in case of an acquisition of their stake at a price that valued the cash at equivalent of
15 Letter to shareholders_2008 : Patni.net

Page 8 of 19
its value to the controlling party, or in case of an increase in the dividend payout ratio, would minority shareholders get some value for this cash.
Patni was considering utilizing its high cash balance to acquire distressed assets16 to boost its top-‐line and bottom-‐line growth. In the current environment, its strong cash balance provided an opportunity to acquire distressed assets which could be drivers of future growth. It could boost the company’s return ratios as the yields on acquisitions might be better than those on in-‐house investments. Patni was eyeing acquisitions worth USD 200-‐300 million in the European market. With a successful acquisition, the company would be able to increase its employee base significantly in Europe (one of the key factors helping to penetrate the European markets) and offer a gamut of IT services to the acquired company’s clients. An EPS-‐accretive (increase in a company's earnings per share on a pro forma basis following the transaction) acquisition, which offered significant synergy benefits to Patni, might boost its intrinsic value. Revenues After facing 15% decline in revenue (in USD) over two consecutive quarters, the management had provided a guidance of almost flat revenue of USD 158-‐159 million in 2Q CY09. It believed that a pick-‐up in volumes would offset the negative impact of a decline in billing rates on revenue.
The financial services revenues contributed 12.9 percent in FY 2008-‐09. Major revenues of
Patni came from verticals like Manufacturing and Product Engineering which were 24.8 and 16 percent respectively. Even though the exposure to the BFSI segment was significant, the impact of the crisis in terms of percentage of revenues was mild. Financial services revenue declined from 15.9 percent in 2006 to 12.9 percent in 2008, while during the same period the other segment of BFSI -‐-‐ Insurance -‐-‐ grew from 23.3 percent to 25 percent. Slower Diversification and Over-‐dependence on Traditional Service Lines Patni had been offering end-‐to-‐end IT solutions over the years but its business model had been diversifying at a pace slower in comparison to the industry. Though the revenue contribution of the company’s ADM services business was one of the highest in the industry (see Exhibit 10), its higher dependence on traditional services (ADM) had been a drag on its top-‐line growth. As a result, over the last four years, Patni had been performing poorly in other service lines in comparison to tier-‐1 companies and the IT industry as a whole (see Exhibit 11). The ADM business was a mature market and had been significantly penetrated and thus other service lines had outpaced its growth over the last couple of years.
16 Patni Computers Company Report by Asit C Mehta : Investmentz.com

Page 9 of 19
Patni’s continued dependence on ADM services could be attributed to its failure in capitalizing on its early lead in high-‐growth emerging service lines such as infrastructure management. Even though infrastructure management services (IMS) had witnessed high growth in the last couple of years, Patni had only been able to record relatively slower growth compared to the industry and the top players. Conflicts of interest and feuding amongst the top management cum promoters’ family over the control of the company was considered to be a main contributor. Having been classified as a “strong performer” in Forrester’s 2005 report on global IT infrastructure outsourcing providers, Patni failed to even figure in the 2008 report due to the lower scale of its operations in this segment.
Lower Margins
Indian players depended on ADM because of their cost advantage over local companies in the US and Europe and the high off-‐shorable component (around 80%). Moreover, ADM, being a plain vanilla service, required relatively less domain knowledge and hence could be easily entered into when compared with other service lines. Therefore, there was stiff competition and hence lower margins in this line. Patni’s higher dependence on traditional services and its higher employee attrition had affected its margins. It was expected that margins would be weighed down by the pressure on billing rates. Its operating margin had dropped 423 basis points (bps) over CY06-‐CY08, led by wage inflation pressure and higher training and recruitment cost owing to relatively higher attrition. It was expected that its operating margin would continue to be under pressure and decline 164bps over CY08-‐10, led by depressed billing rates despite the rationalization of costs. Patni aimed to manage the foreign exchange risk in its earnings by hedging, which could not be relied upon in every quarter as it was not the primary business objective of the company.
Consolidated Financial Statements Exhibits 12 and 13 summarizes the consolidated Income Statement &Balance Sheet Statements of Patni Computers respectively as of December 31 2008. Other Income Exhibit 15 shows the components of other income. As Patni held a large part of its assets in financial investments, it derived interest and dividend income on a recurring basis. Comparable Companies Financial Metrics: Exhibit 16 depicts key information on comparable firms with regard to share price performance, equity, debt, cash, revenue and operating income. Cost Of Capital

Page 10 of 19
According to the Capital Asset Pricing Model (CAPM), the cost of equity equals the risk free rate + βequity * market risk premium. We assume a market risk premium of 9.5% and use the 7.98% 10 year Indian Government Bond Yield averaged from 1998 until 2008 as the risk free rate. Tax rate and Inflation rate (averaged for last 10 years) is assumed as 35 percent and 5.9 percent respectively. The way forward To Mallikarjun, it looked like the company was essentially a one trick pony – though management had sought to diversify its business through acquisitions and geographic expansion, the high concentration of revenue from pure traditional services and its geographical dependence on the U.S. market should provide caution to investors. Prima facie it appeared that at currently depressed market prices, Patni provided a significant investment opportunity. Mallikarjun knew that he would have to employ several valuation techniques to try and get a handle on the intrinsic value of Patni. Of course, he realized that a careful risk analysis was necessary in addition to estimates of intrinsic value before he could make a decision on investing in Patni shares. Full of anticipation, Mallikarjun embarked on his analysis...

Page 11 of 19
Exhibit 1: Half Yearly comparisons of contracts awarded to the Indian IT sector
Exhibit 2: Impact on worldwide IT purchases

Page 12 of 19
Exhibit 3: Impact on IT purchases globally – by segment
Exhibit 4: Projected growth in major economies

Page 13 of 19
Exhibit 5: FII Holding in Indian IT majors
Exhibit 6: Patni's revenue broken down by geographical segment

Page 14 of 19
Exhibit 7: Comparison of attrition rate of Indian IT majors vis-‐a-‐vis Indian IT industry average
Exhibit 8: Deployment of Patni’s cash (2004-‐08)

Page 15 of 19
Exhibit 9: Return on net worth: Indian IT Majors
Exhibit 10: Contribution of revenue from the Annual Development and Maintenance (ADM) service line across Indian IT Majors.

Page 16 of 19
Exhibit 11: Patni's revenue break-‐up by service lines
Exhibit 12: Patni Computers Income Statement: December 31, 2002 – December 31 2008
Income Statement (INR million)
Year Dec
08(12) Dec
07(12) Dec
06(12) Dec
05(12) Dec
04(12) Dec
03(12) Dec
02(12) INCOME
Operating Income 31172.7 26885.5 26080.3 19869.3 14765.2 11648.5 6256.2 Excise Duty 0.0 0.0 0.0 0.0 0.0 0.0 0.0 Net Operating Income 31172.7 26885.5 26080.3 19869.3 14765.2 11648.5 6256.2 Other Income 1303.4 1690.0 595.7 390.0 208.3 142.1 68.5 Stock Adjustments 0.0 0.0 0.0 0.0 0.0 0.0 0.0 Total Income 32476.1 28575.5 26676.0 20259.3 14973.5 11790.6 6324.7 EXPENDITURE
Cost of Traded Software Packages 0.0 0.0 0.0 0.0 0.0 0.0 0.0 Operating Expenses 323.0 249.5 2167.9 1421.4 717.5 601.6 129.4 Employee Cost 18328.7 15389.6 14447.2 11197.7 8422.6 6811.9 3030.2 Power/Electricity Charges 316.3 289.7 220.8 169.3 105.8 82.5 67.4 Selling and Administration Exp. 6261.3 5239.0 3258.3 2928.5 1896.4 1448.2 705.7 Miscellaneous Expenses 1242.0 431.1 534.0 1329.8 319.6 135.0 91.4 Less : Pre-‐operative Expenses Capitalised 0.0 0.0 0.0 0.0 0.0 0.0 0.0 Total Expenditure 26471.3 21598.9 20628.2 17046.7 11461.9 9079.2 4024.1 Operating Profit 6004.8 6976.6 6047.8 3212.6 3511.6 2711.4 2300.6 Interest 79.0 147.2 189.6 81.2 1.7 1.7 19.3 Gross Profit 5925.8 6829.4 5858.2 3131.4 3509.9 2709.7 2281.3 Depreciation 1141.4 984.7 842.7 678.1 516.2 430.0 305.3 Profit Before Tax 4784.4 5844.7 5015.5 2453.3 2993.7 2279.7 1976.0 Tax 379.5 1028.1 2467.7 819.8 390.3 429.0 339.8 Deferred Tax -‐24.6 -‐63.9 59.9 -‐385.6 26.4 7.8 0.0 Net Profit 4380.3 4752.7 2607.7 1247.9 2629.8 1858.5 1636.2
Source: Patni Computers, Financial releases, Fact Sheet 2008, and CapitaLine

Page 17 of 19
Exhibit 13: Patni Computers Balance Sheet: December 31, 2002 – December 31 2008
(Rs in million) Year Dec 08 Dec 07 Dec 06 Dec 05 Dec 04 Dec 03 Dec 02 SOURCES OF FUNDS : Share Capital 256.2 278.0 276.6 275.6 250.0 222.8 148.6 Reserves Total 28144.8 27,081.7 23,044.9 20,971.7 13,961.9 8,762.0 6,952.2 Equity Share Warrants 0.0 0.0 0.0 0.0 0.0 0.0 0.0 Equity Application Money 0.0 1.8 0.0 0.0 0.0 0.0 0.0 Total Shareholders Funds 28,399.4 27,361.5 23,321.5 21,247.3 14,211.9 8,984.8 7,100.8 Minority Interest 0.0 0.0 0.0 0.0 0.0 0.0 0.0 Secured Loans 17.5 23.8 30.6 31.8 28.6 24.6 19.7 Unsecured Loans 0.0 0.0 0.0 0.0 0.0 0.0 0.0 Total Debt 17.5 23.8 30.6 31.8 28.6 24.6 19.7 Total Liabilities 28,416.9 27,385.3 23,352.1 21,279.1 14,240.5 9,009.4 7,120.5 APPLICATION OF FUNDS :Goodwill 4,907.0 4,270.0 0.0 0.0 0.0 0.0 0.0 Gross Block 11,652.0 14,518.7 10,342.6 8,256.7 6,689.1 4,640.7 3,794.3 Less: Accumulated Depreciation 5,168.4 4,099.9 3,186.7 2,372.4 1,810.5 1,357.1 883.0 Net Block 6,483.6 10,418.8 7,155.9 5,884.3 4,878.6 3,283.6 2,911.3 Lease Adjustment 0.0 0.0 0.0 0.0 0.0 0.0 0.0 Capital Work in Progress 2,501.9 2,177.0 2,113.9 1,210.2 246.6 43.6 29.1 Investments 11,771.3 11,516.8 10,697.8 6,331.3 3,714.8 2,240.1 1,664.0 Current Assets, Loans & Advances 0.0 0.0 0.0 0.0 0.0 0.0 0.0 Inventories 0.0 0.0 0.0 0.0 0.0 0.0 0.0 Sundry Debtors 5,450.9 5,316.5 5,122.8 3,230.1 3,135.3 2,588.5 2,216.8 Cash and Bank 2,931.8 1,285.9 2,060.6 6,707.3 3,364.2 2,184.2 1,573.8 Loans and Advances 2,910.4 3,195.6 3,665.9 3,061.2 1,383.4 1,368.1 638.6 Total Current Assets 11,293.1 9,798.0 10,849.3 12,998.6 7,882.9 6,140.8 4,429.2 Less : Current Liabilities and Provisions 0.0 0.0 0.0 0.0 0.0 0.0 0.0 Current Liabilities 6,327.8 4,295.0 3,721.7 3,091.8 1,593.1 1,189.3 885.3 Provisions 3,027.5 2,801.6 4,257.9 2,633.0 1,073.7 1,682.9 1,027.8 Total Current Liabilities 9,355.3 7,096.6 7,979.6 5,724.8 2,666.8 2,872.2 1,913.1 Net Current Assets 1,941.1 2,701.4 2,869.7 7,273.8 5,216.1 3,268.6 2,516.1 Miscellaneous Expenses not written off 0.0 0.0 0.0 0.0 0.0 0.0 0.0 Deferred Tax Assets 945.0 591.9 662.8 756.6 417.3 261.7 0.0 Deferred Tax Liabilities 133.0 20.6 148.0 177.1 232.9 88.2 0.0 Net Deferred Tax 812.0 571.3 514.8 579.5 184.4 173.5 0.0 Total Assets 28,416.9 27,385.3 23,352.1 21,279.1 14,240.5 9,009.4 7,120.5 Source: Patni Computers, Financial releases, Fact Sheet 2008, and CapitaLine
Page 18 of 19
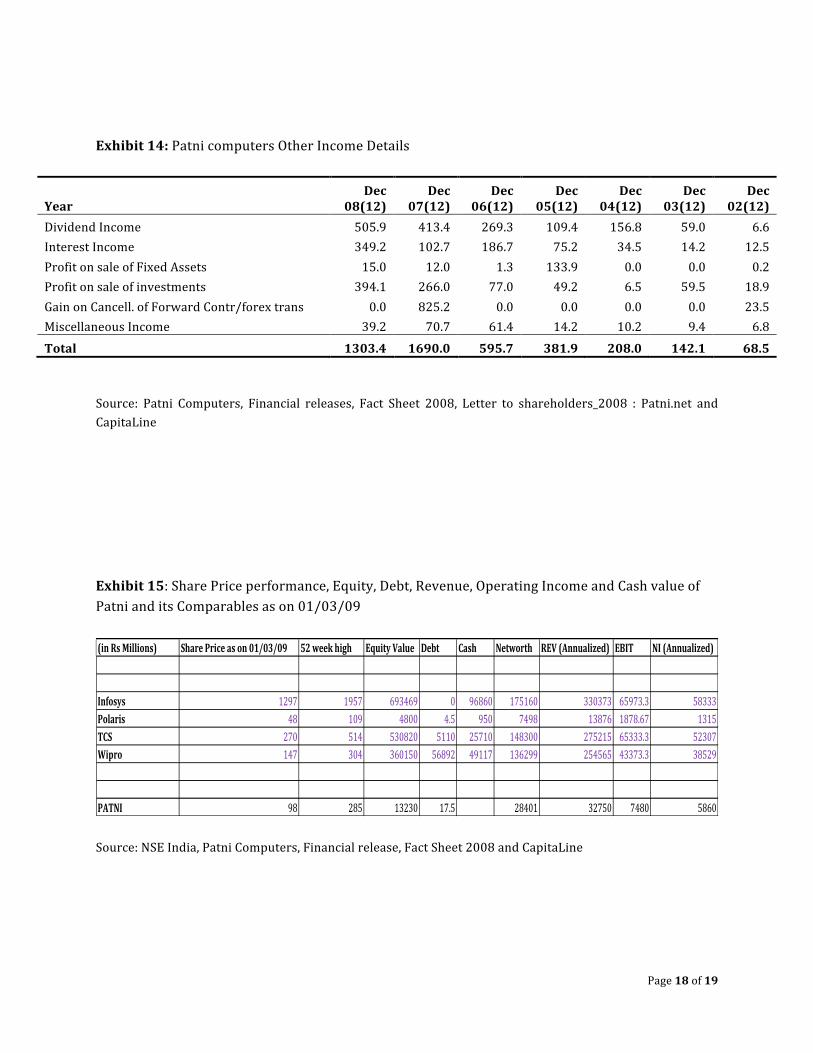
Exhibit 14: Patni computers Other Income Details
Year Dec
08(12) Dec
07(12) Dec
06(12) Dec
05(12) Dec
04(12) Dec
03(12) Dec
02(12) Dividend Income 505.9 413.4 269.3 109.4 156.8 59.0 6.6 Interest Income 349.2 102.7 186.7 75.2 34.5 14.2 12.5 Profit on sale of Fixed Assets 15.0 12.0 1.3 133.9 0.0 0.0 0.2 Profit on sale of investments 394.1 266.0 77.0 49.2 6.5 59.5 18.9 Gain on Cancell. of Forward Contr/forex trans 0.0 825.2 0.0 0.0 0.0 0.0 23.5 Miscellaneous Income 39.2 70.7 61.4 14.2 10.2 9.4 6.8 Total 1303.4 1690.0 595.7 381.9 208.0 142.1 68.5
Source: Patni Computers, Financial releases, Fact Sheet 2008, Letter to shareholders_2008 : Patni.net and CapitaLine Exhibit 15: Share Price performance, Equity, Debt, Revenue, Operating Income and Cash value of Patni and its Comparables as on 01/03/09 (in Rs Millions) Share Price as on 01/03/09 52 week high Equity Value Debt Cash Networth REV (Annualized) EBIT NI (Annualized)
Infosys 1297 1957 693469 0 96860 175160 330373 65973.3 58333Polaris 48 109 4800 4.5 950 7498 13876 1878.67 1315TCS 270 514 530820 5110 25710 148300 275215 65333.3 52307Wipro 147 304 360150 56892 49117 136299 254565 43373.3 38529
PATNI 98 285 13230 17.5 28401 32750 7480 5860 Source: NSE India, Patni Computers, Financial release, Fact Sheet 2008 and CapitaLine

Page 19 of 19