Embed Size (px)
Citation preview

Click to edit Master subtitle style
Click to edit Master title style
World Population Prospects and 1950 -2020 estimates for age -specific fertility patterns:
past experience and future plans(P. Gerland and G. Gonnella, Population Division)
United Nations Expert Group Meeting on the evaluation of adolescent fertility data and estimates
Session II: Monday 26 October 2020
Click to edit Master subtitle style
Click to edit Master title stylePast experience with WPP5-year age group fertility data
and time trends

Click to edit Master subtitle style
Click to edit Master title style
Population Division
• Scope: 235 countries/areas + > 30 geographical and socio-economic/political aggregates
• Time: 5-year periods from 1950 to 2020 (and projection until 2100)• Dimensions: population by 5-year age groups and by sex, fertility by age,
mortality and migration by age and sex -> 67 indicators (25 by sex, 18 by sex and age) by 5-year periods -> annually interpolated subset as by-product
• Prediction intervals associated with probabilistic projection, as well as 9 projection scenarios based 5 fertility variants, 2 mortality variant, 2 migration variants
• Revision: every 2-years extensive review / update of past estimates and projections.
• Online data: https://population.un.org/wpp/
UN World Population Prospects (WPP)
3

Click to edit Master subtitle style
Click to edit Master title style
Population Division
1. Comprehensive and standardized demographic dataset for all countries/areas with internally set of estimates and projections of population size and the three components of population change: fertility, mortality and net international migration
2. Serve as basis for various projection scenarios at the global, regional and national level – including derived projections by other international organizations (labor, education, social security benefits, agriculture, health, urbanization, energy, transport, infrastructure, environment, climate change, etc.)
Aims of the WPP estimates
4

Click to edit Master subtitle style
Click to edit Master title style
Population Division
o De-facto vs. de-jure (usual resident) populationo Vital events/rates by year of occurrenceo Population balance (demographic accounting)o Cohort componento 5x5 framework -> upgrade to 1x1 for 2021 revisiono Empirical data sources & estimation methodso Estimate vs. projectiono See World Population Prospects 2019: Methodology of the United
Nations Population Estimates and Projections for further details
Key concepts for WPP
5

Click to edit Master subtitle style
Click to edit Master title style
Population Division
• For each of the 235 countries or areas:o Base population by sex and 5-year age group in 1950o For 5-year periods from 1950-2020, time series of:
• TFR and age-specific fertility rates for women aged 15-49 years by 5-year age group
• sex ratio at birth (males/females)• sex and age-specific mortality rates (life tables) for ages 0-
1, 1-4, 5-9, 10-14, …., 90-95, 95-100, 100+• net international migration by sex and 5-year age group
Data requirements for WPP
6

Click to edit Master subtitle style
Click to edit Master title style
Population Division
Cohort component
7
t-5 t t+5 t+100
5
10
15
t- tBirths
Pop(0-4)
Pop(5-9)
Deaths(+ I – E)
Deaths(+ I – E)
Census 1 Census 2Births
Deaths(+ I – E)
Youngest age groups depend (a) mostly on the intercensal fertility and the number of women in reproductive age groups (15-49) in census 1 (surviving and present in the country during intercensal period), and (b) to a lesser extent on infant/child mortality and migration between censuses 1 and 2, and (c) potential errors in census 2.

Click to edit Master subtitle style
Click to edit Master title style
Population Division
• National statistical sources (tabulations and/or microdata) either taken as-is or adjusted after in-depth evaluation:o 1,690 censuses (236 since 2010) and post-enumerations surveyso 2,700 surveys (540 since 2010)o vital registration systems from 163 countries or areaso official statistics reported to the Demographic Yearbook of the United
Nationso population registers other administrative sources on international
migration statistics, education statistics, immunizations, electoral rolls, etc.
Data sources (used for WPP 2019)
8

Click to edit Master subtitle style
Click to edit Master title style
Population Division
• Refugee statistics from the Office of the UN High Commissioner for Refugees
• Estimated time series of adult HIV prevalence and coverage of antiretroviral treatment from UNAIDS
• Estimated time series of infant and under-five mortality from the UN Inter-Agency Group for Child Mortality Estimation
• Estimates of international migration flows and stocks of foreign-born persons from the UN
• Various other series of international estimates produced by international and regional organizations and academic research institutions
Data sources (continued)
9

Click to edit Master subtitle style
Click to edit Master title style
Population Division
• To fill-in gaps in missing data: most information often available only for some countries and/or dates, or not sufficiently disaggregated by age
• To reconcile differences between (a) data sources and/or estimation method(s) for a specific date and (b) within sources over time
• To ensure international comparability using similar definitions/concepts, methodology and assumptions across countries
With so many data available, why estimates are necessary…
10

Click to edit Master subtitle style
Click to edit Master title style
Population Division
• Compile and compute direct and indirect fertility estimates from as many empirical data sources as possible for each country since 1950
• Review and assess the various series• Generate an initial robust time trend for TFR (15-49) and ASFR5• Use this initial set of estimates within the full cohort-component
population reconstruction by age and sex since 1950• Compare and assess the reconstructed population cohorts with those
enumerated across the various censuses• Revise and adjust the set of WPP estimates to reconcile the various
demographic components (e.g., TFR) that satisfy the demographic balancing relationships over time, age and cohorts
WPP workflow process with TFR & ASFR5
11

Click to edit Master subtitle style
Click to edit Master title style
Population Division
WPP estimation process for each country/area
12
Estimate fertility, mortality, (migration) for period (t0-1)
Run cohort-componentprojection for period (t0-1)
Compare projection result with census populationby age and sex in (t1)
Proceed to next period (t1-2)
No match
Match
Adjust censuspopulationif necessary
Census populationby age and sex (t0)
Start
Census populationby age and sex (t1)
Estimate net-migrationfor period (t0-1)
1
2
3
Censuses, surveysvital registers
Re-estimate fertility, mortality,(migration) for period (t0-1)
4

Click to edit Master subtitle style
Click to edit Master title style
Population Division
• For many countries, data available vary greatly in quantity, frequency, quality, reliability and consistency.
• Not all data points are as informative and can be trusted equally…• Estimates can vary based on the type of data sources (census,
surveys, vital registration), the type of survey itself (national survey vs. international survey programs), the estimation methods(direct or indirect estimates) and by various biases affecting reporting of retrospective birth histories or lifetime fertility.
Estimation of robust time series for demographic rates
13

Click to edit Master subtitle style
Click to edit Master title style
Population Division
Sources of data and estimation methods
14
Source Method Time period TFR ASFR
Official figures Estimates Annual
Vital statistics from civil registration
Computed rates fromDYB-NSO
Annual
Surveys Birth histories (and extrapolations)
Prior 15-35 years
Censuses/Surveys Recent births Prior 12-24 months
Censuses/Surveys Recent births and average parity methods
Prior 12-24 months
Censuses/Surveys Children ever born methods
15-45 years before
Censuses/Surveys/admin. stats
Population methods Prior 15 years 1,2 1
Model-based Other methods3 Prior 5-15 years
(1) Own-children method, (2) Reverse survival method, Education stats(3) Intercensal estimates, regression methods, stable population

Click to edit Master subtitle style
Click to edit Master title style
Population Division
TFR: Benin
15

Click to edit Master subtitle style
Click to edit Master title style
Population Division
ASFR 15-19: Benin
16

Click to edit Master subtitle style
Click to edit Master title style
Population Division
ASFR 10-14 selected empirical series
17
Bangladesh Benin Bulgaria
Colombia Dominican Republic Indonesia

Click to edit Master subtitle style
Click to edit Master title style
Population Division
ASFR 10-14 selected empirical series
18
Kenya Lesotho
Peru
Liberia
Mali Morocco

Click to edit Master subtitle style
Click to edit Master title styleFuture plans for WPP 2021(Annual time trends and)
single-age fertility patterns
Click to edit Master subtitle style
Click to edit Master title style
Population Division
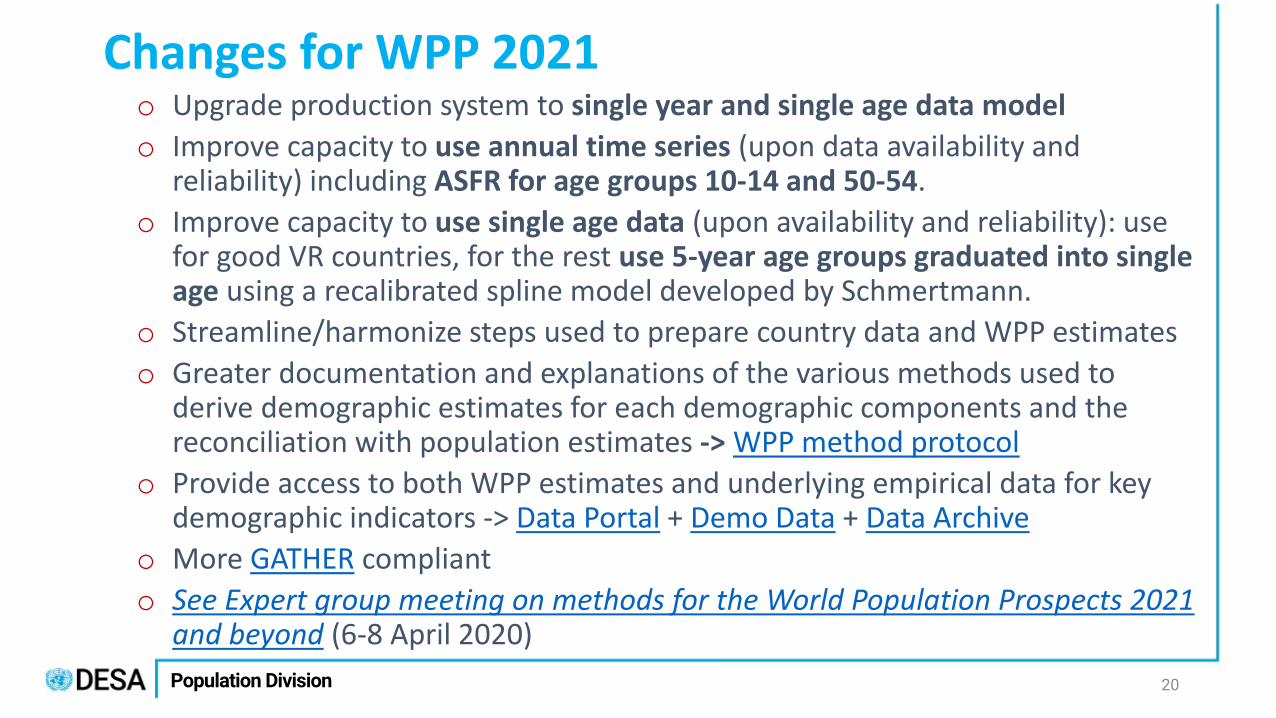
o Upgrade production system to single year and single age data modelo Improve capacity to use annual time series (upon data availability and
reliability) including ASFR for age groups 10-14 and 50-54.o Improve capacity to use single age data (upon availability and reliability): use
for good VR countries, for the rest use 5-year age groups graduated into single age using a recalibrated spline model developed by Schmertmann.
o Streamline/harmonize steps used to prepare country data and WPP estimateso Greater documentation and explanations of the various methods used to
derive demographic estimates for each demographic components and the reconciliation with population estimates -> WPP method protocol
o Provide access to both WPP estimates and underlying empirical data for key demographic indicators -> Data Portal + Demo Data + Data Archive
o More GATHER complianto See Expert group meeting on methods for the World Population Prospects 2021
and beyond (6-8 April 2020)
Changes for WPP 2021
20

Click to edit Master subtitle style
Click to edit Master title style
Population Division
Over 4,500 series:• Vital registration
o more than 4,000 annual series for 71 countries covering age 12-55 from 1891 to 2018,o Sources are Human Fertility Database (HFD), Eurostat and Human Fertility Collection
(HFC) in a hierarchical order (no overlap for each country x year).• Survey
o 451 series for 109 countries covering age 10- 49 from 1964 to 2019,o Sources are DHS, MICS and other surveys collecting Full Birth Histories,o Rates for 10 years before each survey, computed by B. Schoumaker directly from
micro-data using his Stata code, • Health and Demographic Surveillance System
o 72 series for 14 countries covering age 10-54 from 1976 to 2018,o Rates for 3 to 8 years period, computed by UNPD using the Stata code developed by B.
Schoumaker.
Availability of single age fertility data
21

Click to edit Master subtitle style
Click to edit Master title style
Population Division
Availability by SDG region
22
Number of series by source and SDG region
Survey Health and Demographic Surveillance System Vital Registration***
Sustainable Development Goal (SDG) regions DHS MICS Other surveys** HDSS HFD Eurostat HFCSub-Saharan Africa 142 28 48 66Northern Africa and Western Asia 31 10 20 0 27 67 130
Central and Southern Asia 30 5 6 3 7
Eastern and South-Eastern Asia 25 3 3 3 130 61
Latin America and the Caribbean 49 6 32 14 31
Australia and New Zealand 180
Oceania* 1 1 1Europe and Northern America 4 2 4 2402 308 779
*(excluding Australia and New Zealand)**including WFS, MIS, RHS, PHS, PAPFAM, PAPCHILD and more.***the numbers do not reflect the data availability in the three databases. The criteria chosen is to have one series of Vital Registration data for each country x year. The priority has been given to data coming from HFD, then Eurostat and eventually HFC.
Number of years of observation by time period and SDG regionSustainable Development Goal (SDG) regions Before 1950 1950-1969 1970-1989 1990-2009 2010-2019
Sub-Saharan Africa 11 393 1595 680Northern Africa and Western Asia 26 283 484 102Central and Southern Asia 9 71 277 121Eastern and South-Eastern Asia 5 27 125 297 102Latin America and the Caribbean 42 330 552 78Australia and New Zealand 42 40 40 40 18Oceania* 6 5 5 17Europe and Northern America 336 782 999 1045 437
Years of observation:• VR = single year,• Survey/HDSS = years
covered retrospectively
Series:• 4,136 VR,• 451 surveys,• 72 HDSS

Click to edit Master subtitle style
Click to edit Master title style
Population Division 23
Years of observation by country

Click to edit Master subtitle style
Click to edit Master title style
Population Division
• For countries with reliable vital registration, single age fertility series will be used as empirical data;
• For countries that heavily rely on surveys/HDSS to gather information on fertility, the series will be smoothed using the method as proposed by Bruno Schoumaker (2020) and based on Pantazis and Clark (2018):o Principal component analysis applied to the 523 series, o Single age fertility rates smoothed using a linear combination of the first 5
components resulting from the PCA (capturing 99% of the variance),o Data further smoothed using a cubic spline (degree of smoothness determined
by cross-validation) with monotonicity constraints on the tails (age < 15 & age 50+),
o Smoothed series to be used as empirical data.
Use of single age fertility data (1)
24

Click to edit Master subtitle style
Click to edit Master title style
Population Division
• Information on single age fertility rates to be used for the graduation of 5-year age to single age rates using the Calibrated Spline (CS) estimator developed by Carl Schmertmann (2014):o The method expands observed abridged fertility schedules based on similarity
with known single age fertility rates,o The output is a set of multipliers that can be applied to any abridged ASFR
series to obtain the desired graduated series.
• For WPP 2021, re-calibration of the CS using the available single age series:o Vital registration series (5-year average to avoid overcounting of highly
correlated data),o Survey/HDSS data smoothed using the PCA and cubic spline.
Use of single age fertility data (2)
25

Click to edit Master subtitle style
Click to edit Master title style
Population Division 26
Example: Bangladesh

Click to edit Master subtitle style
Click to edit Master title style
Population Division 27
Example: Colombia

Click to edit Master subtitle style
Click to edit Master title style
Population Division 28
Example: Ghana

Click to edit Master subtitle style
Click to edit Master title style
Population Division 29
Example: Senegal

Click to edit Master subtitle style
Click to edit Master title style
Population Division 30
Example: Senegal HDSS

Click to edit Master subtitle style
Click to edit Master title style
Population Division 31
Example: Kenya HDSS

Click to edit Master subtitle style
Click to edit Master title style
Population Division 32
Example: South Africa HDSS

Click to edit Master subtitle style
Click to edit Master title style
Population Division
• Vital registration:o Age 12-13 available in 2573 series out of 4136, age 14 in 3644, Age 15 in 4127.
• Survey:o Age 10-14 available in 446 out of 451 series.
• Health and Demographic Surveillance System:o Age 10-14 available in all the 72 series
Adolescent fertility
33
Surveys HDSS Vital registration
Sustainable Development Goal (SDG) regions Age 10-14 Age 10-14 Age 12 Age 13 Age 14
Sub-Saharan Africa 218 66Northern Africa and Western Asia 61 27 27 157Central and Southern Asia 41 3Eastern and South-Eastern Asia 31 3 130 130 182Latin America and the Caribbean 82 14 14 45Australia and New Zealand 180Oceania (excluding Australia and New Zealand) 3Europe and Northern America 10 2402 2402 3080

Click to edit Master subtitle style
Click to edit Master title style
Population Division 34
Model performance on age 10-14 by countryRoot Mean Square Erroris the standard deviation of the residuals
(𝑒𝑒𝑒𝑒𝑒𝑒 − 𝑜𝑜𝑜𝑜𝑒𝑒)2
95% of countries have RMSE < 0.0022

Click to edit Master subtitle style
Click to edit Master title style
Population Division 35

Click to edit Master subtitle style
Click to edit Master title style
Population Division 36
Model performance on age 15-19 by country
95% of countries have RMSE < 0.007

Click to edit Master subtitle style
Click to edit Master title style
Population Division 37

Click to edit Master subtitle style
Click to edit Master title style
Population Division
• More than 4,500 series with single age fertility available from VR, surveys and HDSS for 171 countries, covering age 10-54 from 1891 onwards,
• VR series used as-is for countries/areas with complete birth registration and accurate reporting of the age of mother (i.e. no heaping)
• For other countries/areas, use 5-year age groups graduated into single age using a recalibrated spline model developed by Schmertmann:o VR data + Survey/HDSS series smoothed using PCA and cubic splineo Fertility multipliers compiled using a calibrated spline estimator. The model:
• is able to reproduce single age fertility patterns when only 5-year age are available,• works well across different regions and time, and with different shapes of fertility
distribution by age,• Provides reasonable estimates also for fertility at very young ages (10-14) and old
ages (50+)
Conclusions for fertility age patterns
38

Click to edit Master subtitle style
Click to edit Master title style
Population Division
• Pantazis A, Clark S.J. (2018). A parsimonious characterization of change in global age-specific and total fertility rates. PLoS ONE 13 (1): e0190574. https://doi.org/10.1371/journal.pone.0190574
• Schoumaker, B. (2020). Presentation for the United Nations Expert Group Meeting on methods for the World Population Prospects 2021 and beyond. https://www.un.org/development/desa/pd/sites/www.un.org.development.desa.pd/files/unpd_egm_202004_s2_schoumaker.pdf
• Schmertmann, C. P. (2014). Calibrated spline estimation of detailed fertility schedules from abridged data. Revista Brasileira de Estudos de População, 31(2), 291-307. https://www.scielo.br/scielo.php?pid=S0102-30982014000200004&script=sci_arttext
References
39