Embed Size (px)
Citation preview

w w w . d i g s i l e n t . d e P a g e 1 | 26
P2029 Security of Supply in Curaçao’s Electricity System
Analysis of Grid Events - 04.01.2021
Prepared for:
Aqualectra
Curaçao - Netherland Antilles
Publisher:
DIgSILENT GmbH, February 2021

P 2 0 2 9 S e c u r i t y o f S u p p l y i n C u r a ç a o ’ s E l e c t r i c i t y S y s t e m P a g e 2 | 2 6
All content of this report is Copyright © DIgSILENT, 2021.
Unless otherwise stated, the content (including text, graphics, logos, images and attached documents),
design and layout of this report is the property of DIgSILENT. Any unauthorized publication, copying,
hiring, lending or reproduction is strictly prohibited and constitutes a breach of copyright.
DIgSILENT GmbH
Heinrich-Hertz-Straße 9 D-72810 Gomaringen
Tel.: +49 7072 9168 - 0
Fax: +49 7072 9168- 88 http://www.digsilent.de
Please contact José Gómez
T: +49 (0)7072 9188-84 [email protected]

P 2 0 2 9 S e c u r i t y o f S u p p l y i n C u r a ç a o ’ s E l e c t r i c i t y S y s t e m P a g e 3 | 2 6
Document Revision History
Version Status File Issued Prepared by
01 Draft Version P2029_Aqualectra_Event-Analysis-20210104_REPTRIP04_R01_V01.docx
05.02.2021 J. Gómez

P 2 0 2 9 S e c u r i t y o f S u p p l y i n C u r a ç a o ’ s E l e c t r i c i t y S y s t e m P a g e 4 | 2 6
Table of Contents
1 INTRODUCTION .................................................................................................................. 6
2 MONITORING SYSTEMS ...................................................................................................... 6
3 RECORDINGS ...................................................................................................................... 7
4 TIMELINE OF EVENTS ......................................................................................................... 8
5 CONCLUSIONS AND RECOMMENDATIONS ....................................................................... 10
6 REFERENCES ..................................................................................................................... 11
7 ANNEX A: MEASUREMENT SIGNALS ................................................................................. 12
8 ANNEX B: PFM RECORDINGS ............................................................................................ 14
9 ANNEX C: SCADA RECORDINGS ........................................................................................ 24
10 ANNEX D: OVERCURRENT PROTECTION (P139) SETTINGS IN LINE DOKWEG 66KV-
ISLA 66 KV ............................................................................................................................... 26

P 2 0 2 9 S e c u r i t y o f S u p p l y i n C u r a ç a o ’ s E l e c t r i c i t y S y s t e m P a g e 5 | 2 6
List of Abbreviations
PFM DIgSILENT Monitoring System
SCADA Supervisory Control and Data Acquisition
UFLS Under-Frequency Load-Shedding
I n t r o d u c t i o n
P 2 0 2 9 S e c u r i t y o f S u p p l y i n C u r a ç a o ’ s E l e c t r i c i t y S y s t e m P a g e 6 | 2 6
1 Introduction
On the 4th of January 2021, approximately at 14:13:23 hours, the power system of Aqualectra
experienced a blackout. This report includes the analysis of the sequence of events and the results of the
preliminary investigations.
2 Monitoring Systems
Several PFM monitoring systems are installed in the main substations of Aqualectra. However, some of
them were not accessible and/or did not record the events of interest on the specific date subject of
analysis. The following table shows an overview of their status at the time of the events:
Table 2-1: DIgSILENT Monitoring systems – Aqualectra - Curaçao
# Substation Type Status (04.01.2021)
1 Isla NDPP PFM300 Online, with recordings of the event available
2 Isla 66 kV PFM300 Online, with recordings of the event available
3 Dokweg 1 PFM300 Online, but with no recordings at the time of the event
4 Dokweg 2 PFM300 Not accessible
5 Dokweg 66 kV PFM300 Online, with recordings of the event available
6 Mundo Nobo PFM2 Not accessible
7 Tera Cora PFM2 Not accessible
8 Playa Canoa PFM2 Not accessible
In addition, there is a SCADA system from Aqualectra which records measurements from multiple
locations in the power system.
Annex A includes detailed information of the measurement signals available.

R e c o r d i n g s
P 2 0 2 9 S e c u r i t y o f S u p p l y i n C u r a ç a o ’ s E l e c t r i c i t y S y s t e m P a g e 7 | 2 6
3 Recordings
The following recordings have been used in the analysis of the events:
Table 3-1: Recordings used in the analysis of the events
File Name Source Resolution Duration
Generation 2021 jan.xlsx [1] SCADA 1-minute 24/12/2020 00:00 22/01/2021 23:59
Load 2021 jan.xlsx [2] SCADA 1-minute 24/12/2020 00:00 22/01/2021 23:59
Monitor_2020.01.04 23.59.59.dat [3] PFM300 – Dokweg 66 kV
1-second 04/01/2021 00:00:00.000 05/01/2021 00:00:00.000
RMS_2020.01.04 14.13.23.dat [4] PFM300 – Dokweg 66 kV
20-milisecond 04/01/2021 14:12:23 04/01/2021 14:26:29
Monitor_2020.01.04 23.59.59.dat [5] PFM300 – Isla 66 kV 1-second 04/01/2021 00:00:00.000 05/01/2021 00:00:00.000
RMS_2020.01.04 14.13.23.dat [6] PFM300 – Isla 66 kV 20-milisecond 04/01/2021 14:12:23 04/01/2021 14:26:29
Monitor_2020.01.04 23.59.59.dat [7] PFM300 – Isla NDPP 1-second 04/01/2021 00:00:00.000 05/01/2021 00:00:00.000
RMS_2020.01.04 14.13.23.dat [8] PFM300 – Isla NDPP 20-milisecond 04/01/2021 14:12:23 04/01/2021 14:26:29
T i m e l i n e o f E v e n t s
P 2 0 2 9 S e c u r i t y o f S u p p l y i n C u r a ç a o ’ s E l e c t r i c i t y S y s t e m P a g e 8 | 2 6
4 Timeline of Events
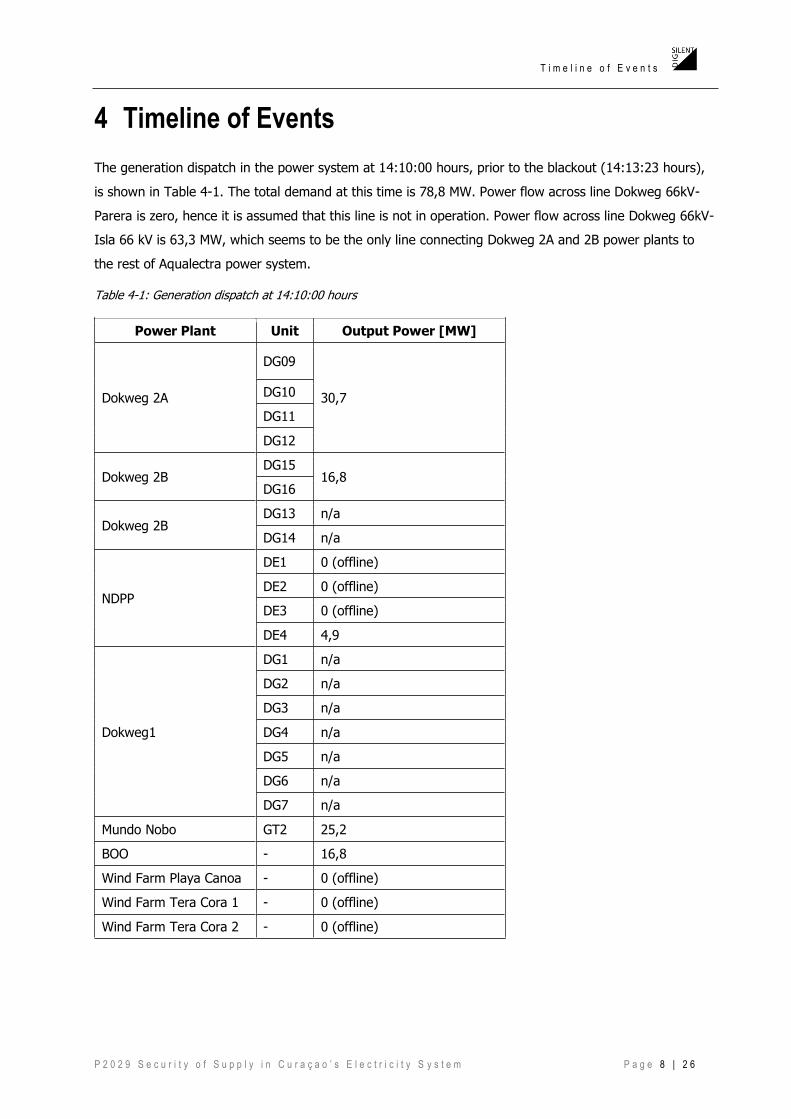
The generation dispatch in the power system at 14:10:00 hours, prior to the blackout (14:13:23 hours),
is shown in Table 4-1. The total demand at this time is 78,8 MW. Power flow across line Dokweg 66kV-
Parera is zero, hence it is assumed that this line is not in operation. Power flow across line Dokweg 66kV-
Isla 66 kV is 63,3 MW, which seems to be the only line connecting Dokweg 2A and 2B power plants to
the rest of Aqualectra power system.
Table 4-1: Generation dispatch at 14:10:00 hours
Power Plant Unit Output Power [MW]
Dokweg 2A
DG09
30,7 DG10
DG11
DG12
Dokweg 2B DG15
16,8 DG16
Dokweg 2B DG13 n/a
DG14 n/a
NDPP
DE1 0 (offline)
DE2 0 (offline)
DE3 0 (offline)
DE4 4,9
Dokweg1
DG1 n/a
DG2 n/a
DG3 n/a
DG4 n/a
DG5 n/a
DG6 n/a
DG7 n/a
Mundo Nobo GT2 25,2
BOO - 16,8
Wind Farm Playa Canoa - 0 (offline)
Wind Farm Tera Cora 1 - 0 (offline)
Wind Farm Tera Cora 2 - 0 (offline)
T i m e l i n e o f E v e n t s
P 2 0 2 9 S e c u r i t y o f S u p p l y i n C u r a ç a o ’ s E l e c t r i c i t y S y s t e m P a g e 9 | 2 6
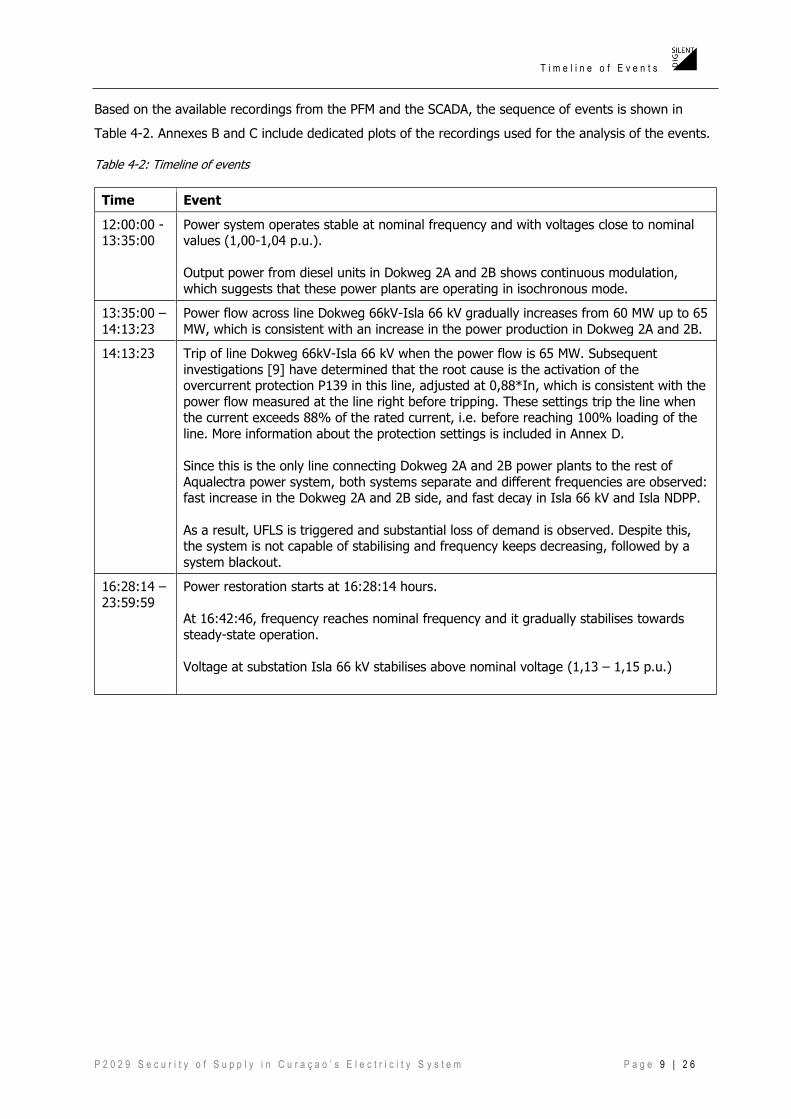
Based on the available recordings from the PFM and the SCADA, the sequence of events is shown in
Table 4-2. Annexes B and C include dedicated plots of the recordings used for the analysis of the events.
Table 4-2: Timeline of events
Time Event
12:00:00 - 13:35:00
Power system operates stable at nominal frequency and with voltages close to nominal values (1,00-1,04 p.u.).
Output power from diesel units in Dokweg 2A and 2B shows continuous modulation,
which suggests that these power plants are operating in isochronous mode.
13:35:00 –
14:13:23
Power flow across line Dokweg 66kV-Isla 66 kV gradually increases from 60 MW up to 65
MW, which is consistent with an increase in the power production in Dokweg 2A and 2B.
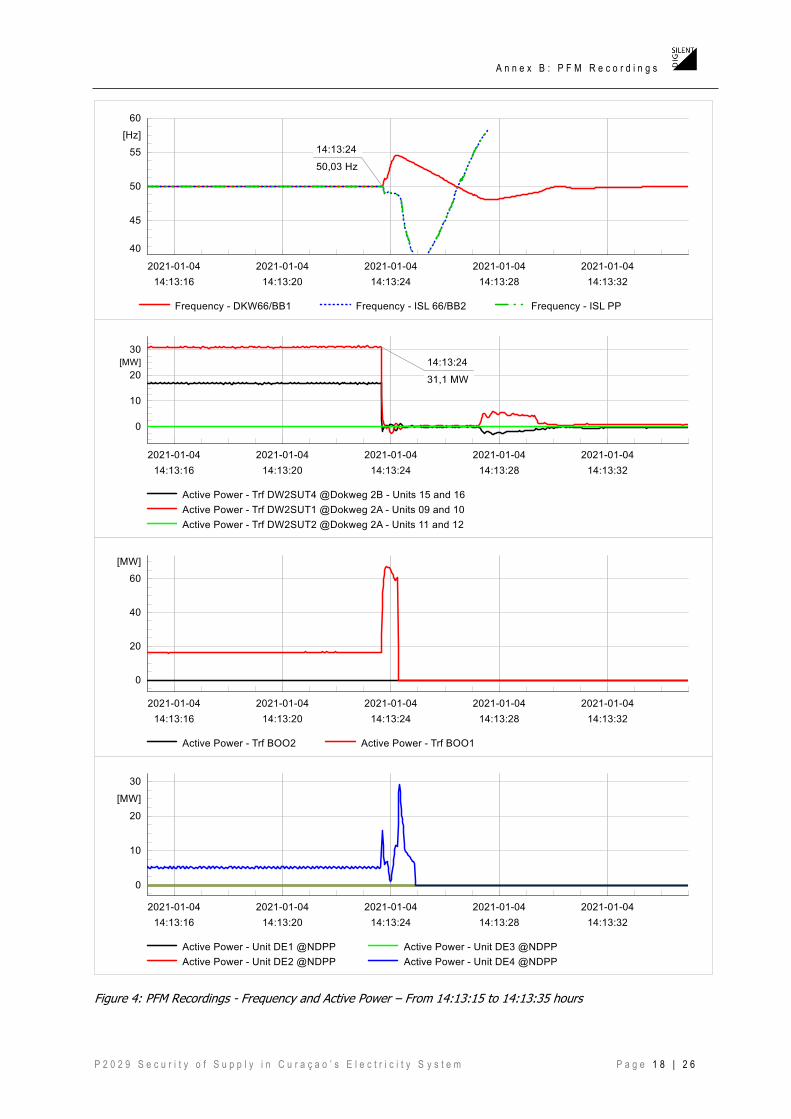
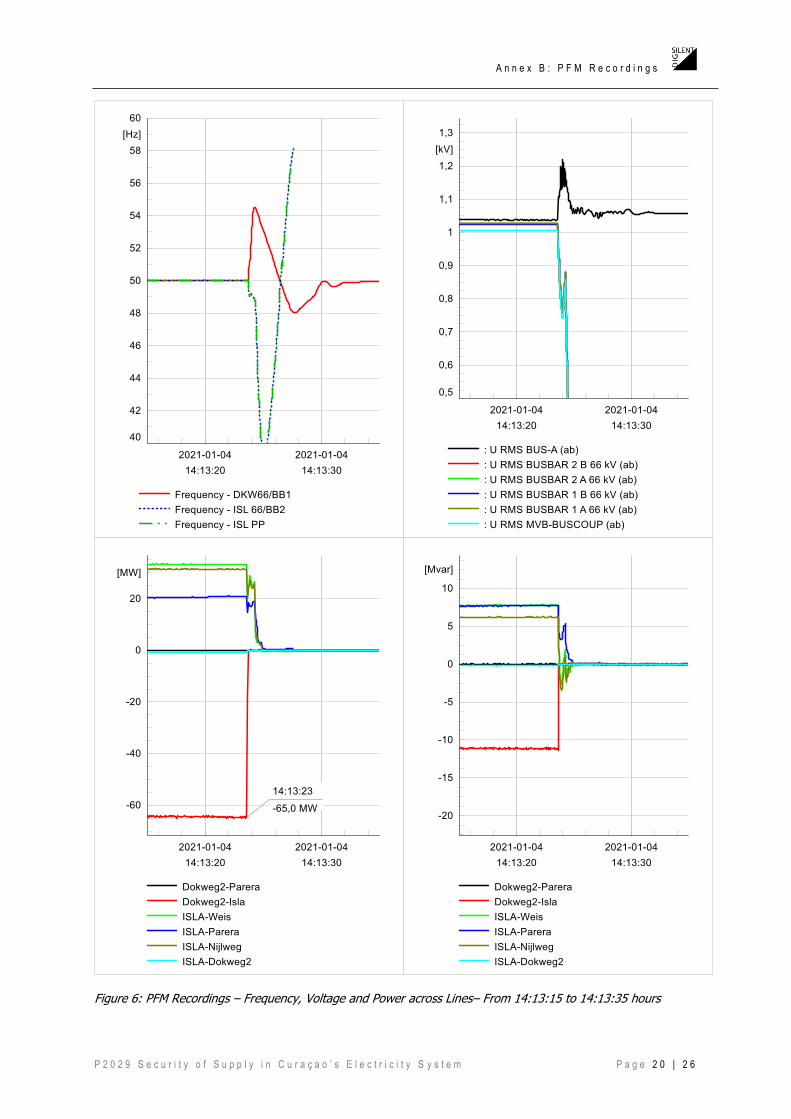
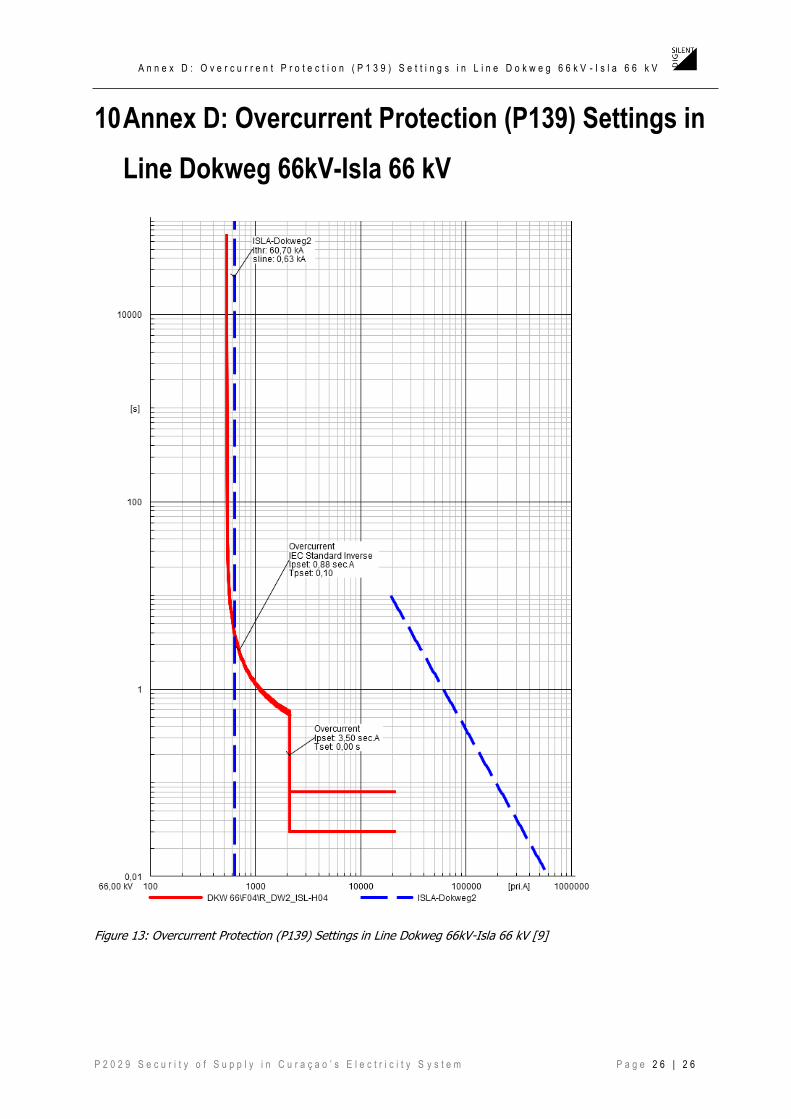
14:13:23 Trip of line Dokweg 66kV-Isla 66 kV when the power flow is 65 MW. Subsequent
investigations [9] have determined that the root cause is the activation of the overcurrent protection P139 in this line, adjusted at 0,88*In, which is consistent with the
power flow measured at the line right before tripping. These settings trip the line when the current exceeds 88% of the rated current, i.e. before reaching 100% loading of the
line. More information about the protection settings is included in Annex D.
Since this is the only line connecting Dokweg 2A and 2B power plants to the rest of
Aqualectra power system, both systems separate and different frequencies are observed: fast increase in the Dokweg 2A and 2B side, and fast decay in Isla 66 kV and Isla NDPP.
As a result, UFLS is triggered and substantial loss of demand is observed. Despite this, the system is not capable of stabilising and frequency keeps decreasing, followed by a
system blackout.
16:28:14 –
23:59:59
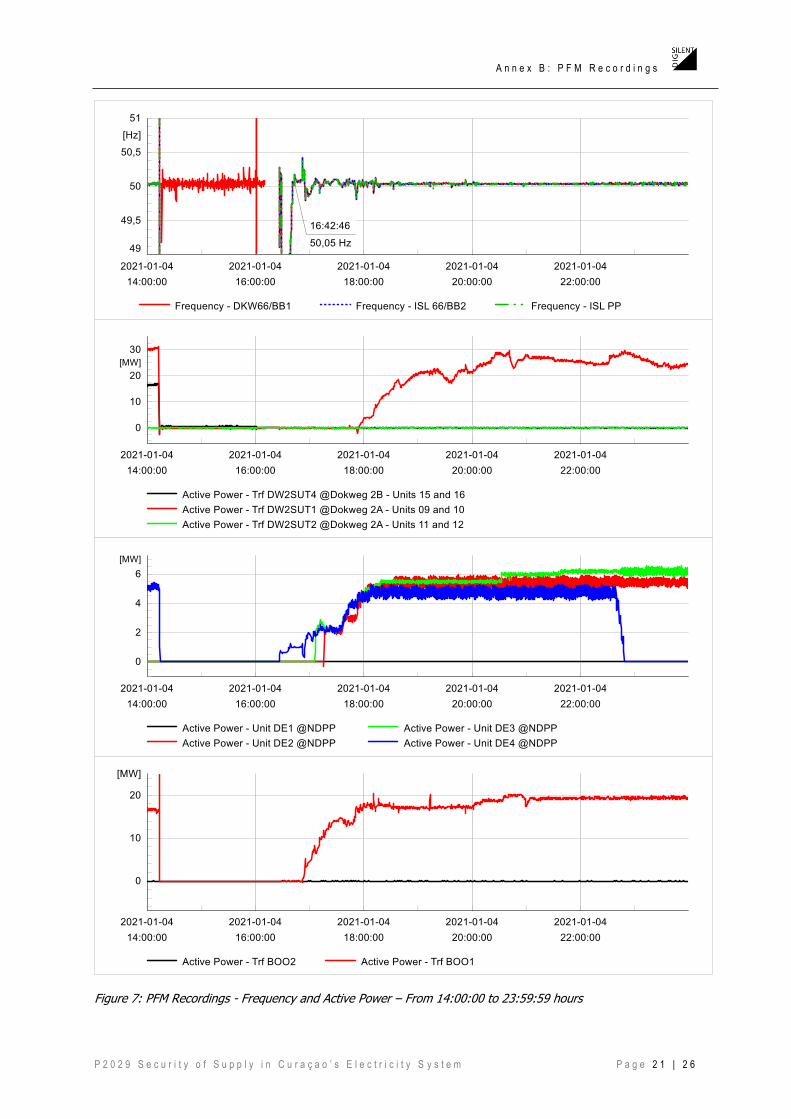
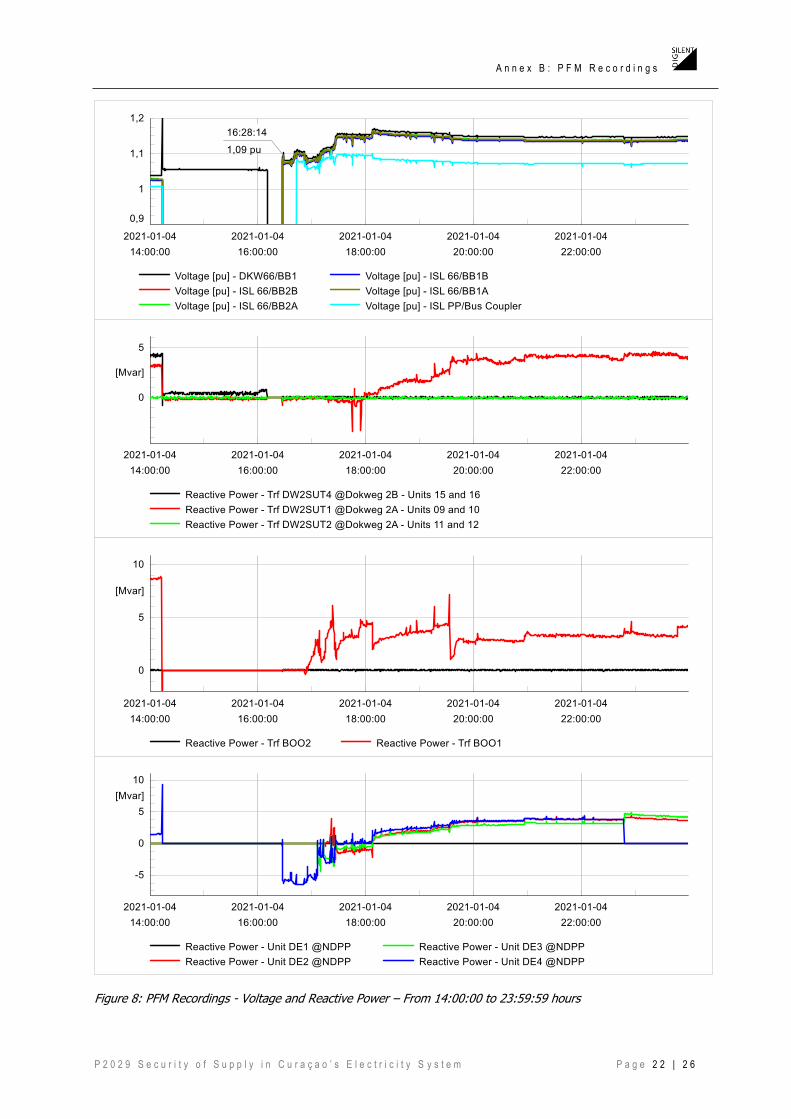
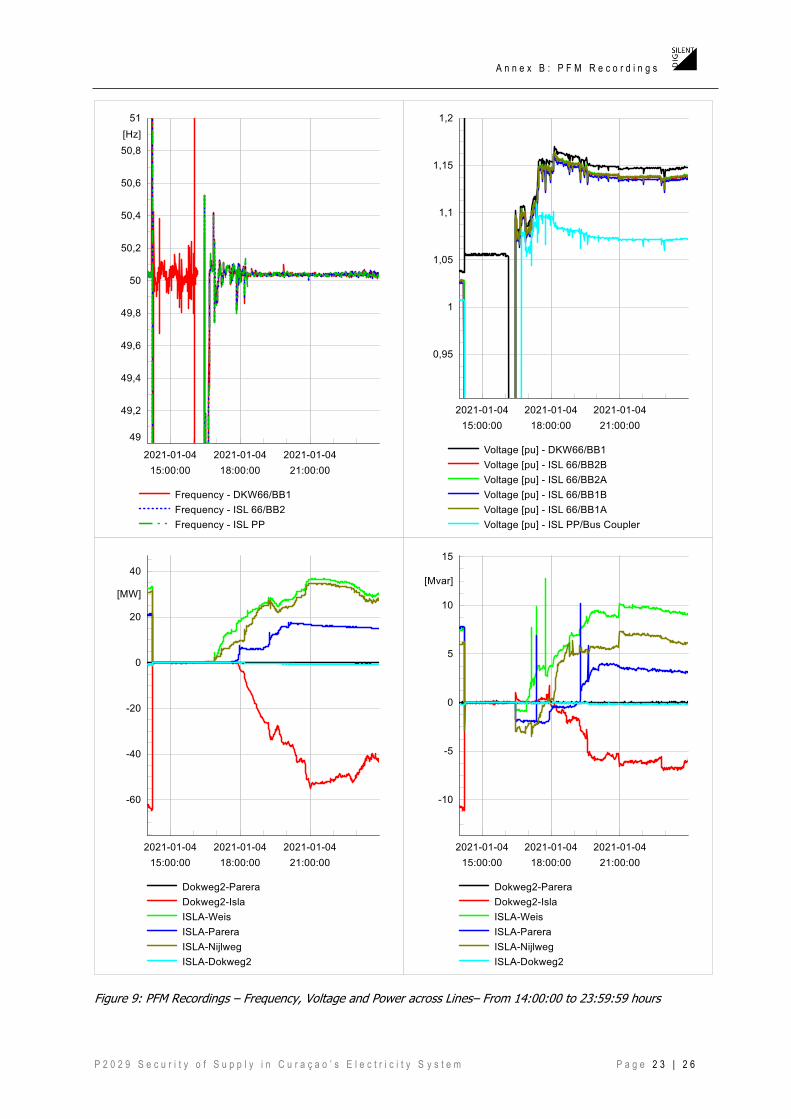
Power restoration starts at 16:28:14 hours.
At 16:42:46, frequency reaches nominal frequency and it gradually stabilises towards
steady-state operation.
Voltage at substation Isla 66 kV stabilises above nominal voltage (1,13 – 1,15 p.u.)

C o n c l u s i o n s a n d R e c o m m e n d a t i o n s
P 2 0 2 9 S e c u r i t y o f S u p p l y i n C u r a ç a o ’ s E l e c t r i c i t y S y s t e m P a g e 1 0 | 2 6
5 Conclusions and Recommendations
The blackout on the 4th of January of 2021 shares similar root causes and consequences with the
blackout experienced on the 10th and 12th of December of 2020, for which dedicated investigation reports
are also available [10] [11].
The analysis of the events reveals that the main cause leading to the blackout is the activation of the
overcurrent protection of the line Dokweg 66kV-Isla 66 kV, currently adjusted at 0,88*In. This setting
does not allow loading of the line above 88% of the rated current.
It is recommended to review these protection settings in order to verify if there is any justified limitation
that prevents that, in steady-state conditions, rated current can flow continuously through the line.
Moreover, this review should be extended to the rest of protection functions in the line Dokweg 66kV-Isla
66 kV, as well as the other transmission lines in Aqualectra power system.
Prior to the blackout, line Dokweg 66kV-Parera was out-of-service, hence all generation from Dokweg 2
power plant was being exported through line Dokweg 66kV-Isla 66 kV. This operation has revealed as not
N-1 secure with very critical consequences for system stability. Therefore, it is recommended to review
operational practices in order to define a maximum power export from Dokweg 2 power plant, especially
when line Dokweg 66kV-Parera is out-of-service.
R e f e r e n c e s
P 2 0 2 9 S e c u r i t y o f S u p p l y i n C u r a ç a o ’ s E l e c t r i c i t y S y s t e m P a g e 1 1 | 2 6
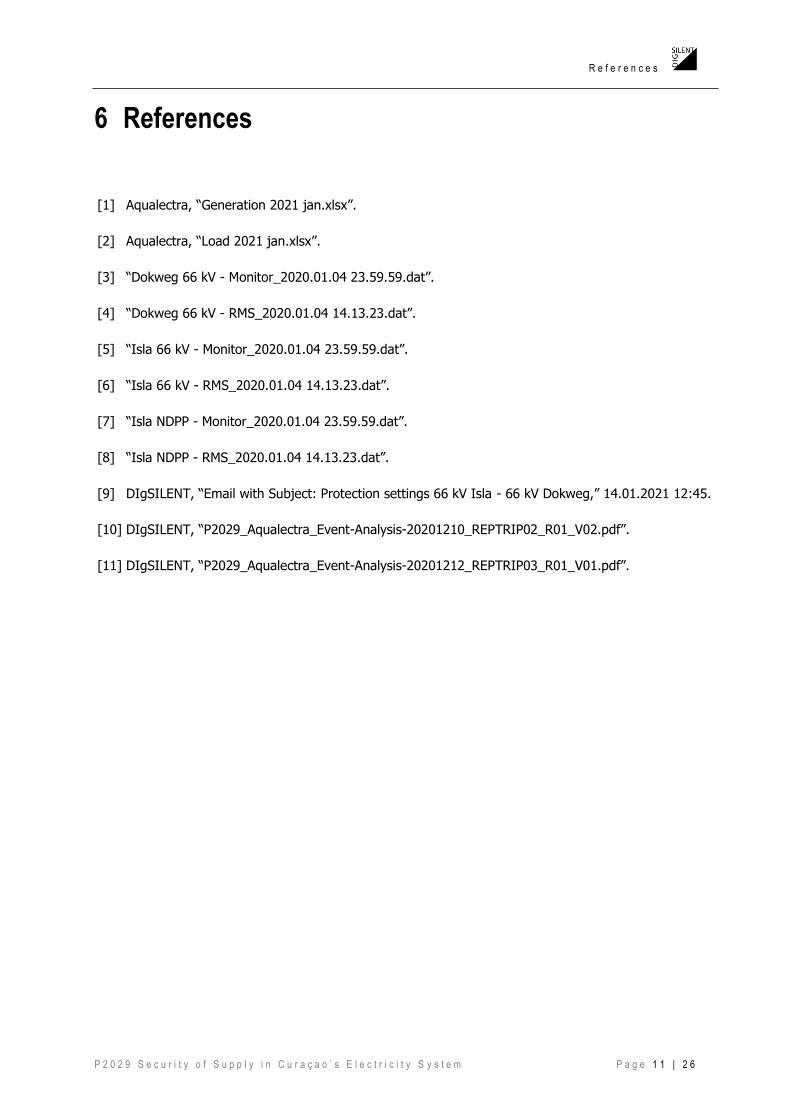
6 References
[1] Aqualectra, “Generation 2021 jan.xlsx”.
[2] Aqualectra, “Load 2021 jan.xlsx”.
[3] “Dokweg 66 kV - Monitor_2020.01.04 23.59.59.dat”.
[4] “Dokweg 66 kV - RMS_2020.01.04 14.13.23.dat”.
[5] “Isla 66 kV - Monitor_2020.01.04 23.59.59.dat”.
[6] “Isla 66 kV - RMS_2020.01.04 14.13.23.dat”.
[7] “Isla NDPP - Monitor_2020.01.04 23.59.59.dat”.
[8] “Isla NDPP - RMS_2020.01.04 14.13.23.dat”.
[9] DIgSILENT, “Email with Subject: Protection settings 66 kV Isla - 66 kV Dokweg,” 14.01.2021 12:45.
[10] DIgSILENT, “P2029_Aqualectra_Event-Analysis-20201210_REPTRIP02_R01_V02.pdf”.
[11] DIgSILENT, “P2029_Aqualectra_Event-Analysis-20201212_REPTRIP03_R01_V01.pdf”.
A n n e x A : M e a s u r e m e n t S i g n a l s
P 2 0 2 9 S e c u r i t y o f S u p p l y i n C u r a ç a o ’ s E l e c t r i c i t y S y s t e m P a g e 1 2 | 2 6
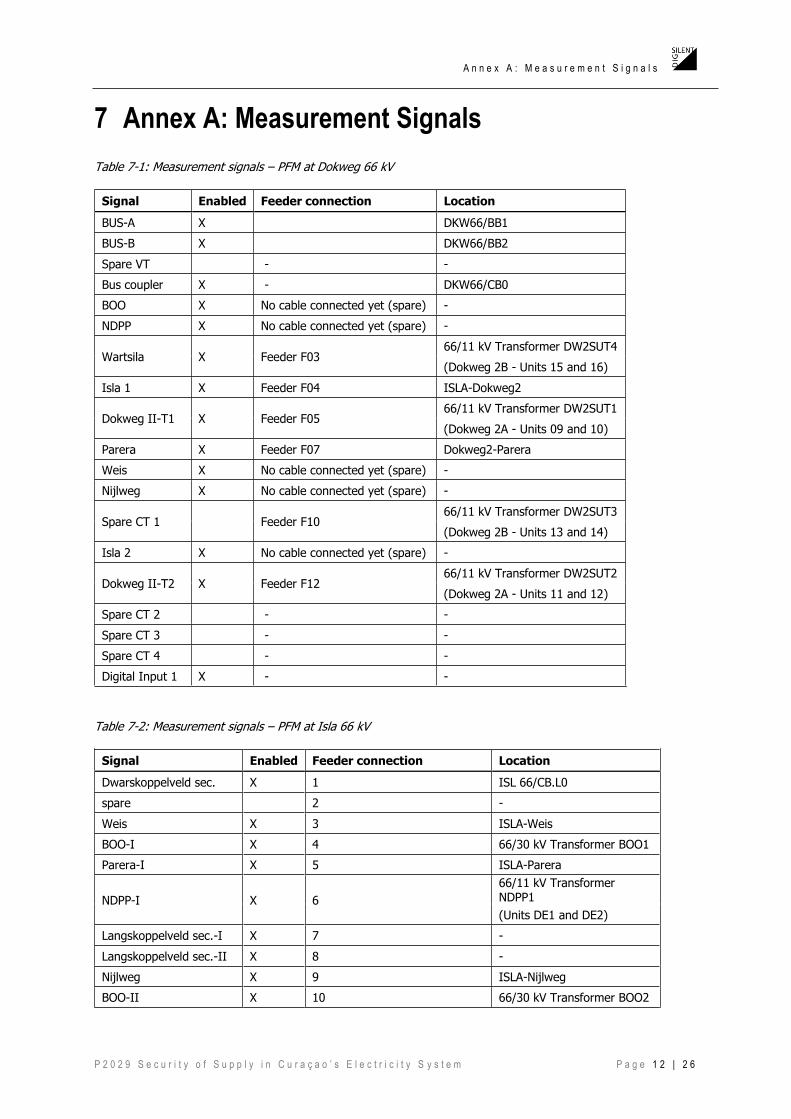
7 Annex A: Measurement Signals
Table 7-1: Measurement signals – PFM at Dokweg 66 kV
Signal Enabled Feeder connection Location
BUS-A X DKW66/BB1
BUS-B X DKW66/BB2
Spare VT - -
Bus coupler X - DKW66/CB0
BOO X No cable connected yet (spare) -
NDPP X No cable connected yet (spare) -
Wartsila X Feeder F03 66/11 kV Transformer DW2SUT4
(Dokweg 2B - Units 15 and 16)
Isla 1 X Feeder F04 ISLA-Dokweg2
Dokweg II-T1 X Feeder F05 66/11 kV Transformer DW2SUT1
(Dokweg 2A - Units 09 and 10)
Parera X Feeder F07 Dokweg2-Parera
Weis X No cable connected yet (spare) -
Nijlweg X No cable connected yet (spare) -
Spare CT 1 Feeder F10 66/11 kV Transformer DW2SUT3
(Dokweg 2B - Units 13 and 14)
Isla 2 X No cable connected yet (spare) -
Dokweg II-T2 X Feeder F12 66/11 kV Transformer DW2SUT2
(Dokweg 2A - Units 11 and 12)
Spare CT 2 - -
Spare CT 3 - -
Spare CT 4 - -
Digital Input 1 X - -
Table 7-2: Measurement signals – PFM at Isla 66 kV
Signal Enabled Feeder connection Location
Dwarskoppelveld sec. X 1 ISL 66/CB.L0
spare 2 -
Weis X 3 ISLA-Weis
BOO-I X 4 66/30 kV Transformer BOO1
Parera-I X 5 ISLA-Parera
NDPP-I X 6
66/11 kV Transformer NDPP1
(Units DE1 and DE2)
Langskoppelveld sec.-I X 7 -
Langskoppelveld sec.-II X 8 -
Nijlweg X 9 ISLA-Nijlweg
BOO-II X 10 66/30 kV Transformer BOO2
A n n e x A : M e a s u r e m e n t S i g n a l s
P 2 0 2 9 S e c u r i t y o f S u p p l y i n C u r a ç a o ’ s E l e c t r i c i t y S y s t e m P a g e 1 3 | 2 6
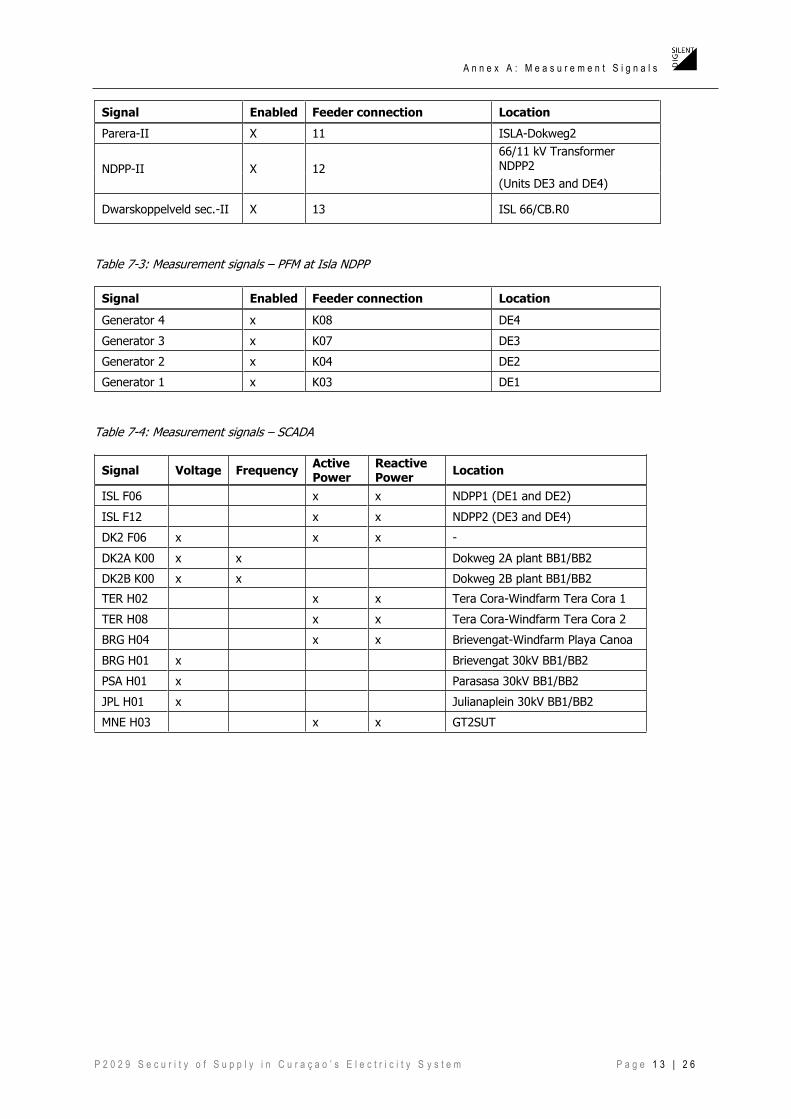
Signal Enabled Feeder connection Location
Parera-II X 11 ISLA-Dokweg2
NDPP-II X 12
66/11 kV Transformer NDPP2
(Units DE3 and DE4)
Dwarskoppelveld sec.-II X 13 ISL 66/CB.R0
Table 7-3: Measurement signals – PFM at Isla NDPP
Signal Enabled Feeder connection Location
Generator 4 x K08 DE4
Generator 3 x K07 DE3
Generator 2 x K04 DE2
Generator 1 x K03 DE1
Table 7-4: Measurement signals – SCADA
Signal Voltage Frequency Active Power
Reactive Power
Location
ISL F06 x x NDPP1 (DE1 and DE2)
ISL F12 x x NDPP2 (DE3 and DE4)
DK2 F06 x x x -
DK2A K00 x x Dokweg 2A plant BB1/BB2
DK2B K00 x x Dokweg 2B plant BB1/BB2
TER H02 x x Tera Cora-Windfarm Tera Cora 1
TER H08 x x Tera Cora-Windfarm Tera Cora 2
BRG H04 x x Brievengat-Windfarm Playa Canoa
BRG H01 x Brievengat 30kV BB1/BB2
PSA H01 x Parasasa 30kV BB1/BB2
JPL H01 x Julianaplein 30kV BB1/BB2
MNE H03 x x GT2SUT

A n n e x B : P F M R e c o r d i n g s
P 2 0 2 9 S e c u r i t y o f S u p p l y i n C u r a ç a o ’ s E l e c t r i c i t y S y s t e m P a g e 1 4 | 2 6
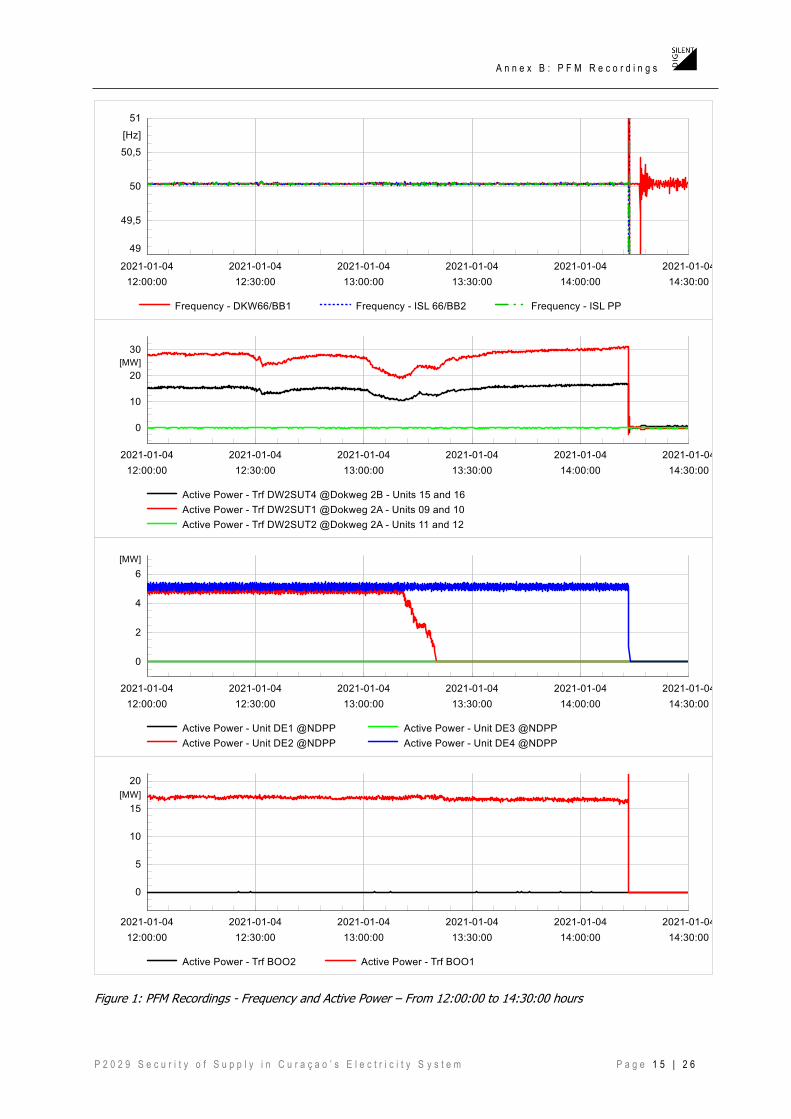
8 Annex B: PFM Recordings
A n n e x B : P F M R e c o r d i n g s
P 2 0 2 9 S e c u r i t y o f S u p p l y i n C u r a ç a o ’ s E l e c t r i c i t y S y s t e m P a g e 1 5 | 2 6
Figure 1: PFM Recordings - Frequency and Active Power – From 12:00:00 to 14:30:00 hours

A n n e x B : P F M R e c o r d i n g s
P 2 0 2 9 S e c u r i t y o f S u p p l y i n C u r a ç a o ’ s E l e c t r i c i t y S y s t e m P a g e 1 6 | 2 6
Figure 2: PFM Recordings - Voltage and Reactive Power – From 12:00:00 to 14:30:00 hours

A n n e x B : P F M R e c o r d i n g s
P 2 0 2 9 S e c u r i t y o f S u p p l y i n C u r a ç a o ’ s E l e c t r i c i t y S y s t e m P a g e 1 7 | 2 6
Figure 3: PFM Recordings – Frequency, Voltage and Power across Lines– From 12:00:00 to 14:30:00 hours
A n n e x B : P F M R e c o r d i n g s
P 2 0 2 9 S e c u r i t y o f S u p p l y i n C u r a ç a o ’ s E l e c t r i c i t y S y s t e m P a g e 1 8 | 2 6
Figure 4: PFM Recordings - Frequency and Active Power – From 14:13:15 to 14:13:35 hours

A n n e x B : P F M R e c o r d i n g s
P 2 0 2 9 S e c u r i t y o f S u p p l y i n C u r a ç a o ’ s E l e c t r i c i t y S y s t e m P a g e 1 9 | 2 6
Figure 5: PFM Recordings - Voltage and Reactive Power – From 14:13:15 to 14:13:35 hours
A n n e x B : P F M R e c o r d i n g s
P 2 0 2 9 S e c u r i t y o f S u p p l y i n C u r a ç a o ’ s E l e c t r i c i t y S y s t e m P a g e 2 0 | 2 6
Figure 6: PFM Recordings – Frequency, Voltage and Power across Lines– From 14:13:15 to 14:13:35 hours
A n n e x B : P F M R e c o r d i n g s
P 2 0 2 9 S e c u r i t y o f S u p p l y i n C u r a ç a o ’ s E l e c t r i c i t y S y s t e m P a g e 2 1 | 2 6
Figure 7: PFM Recordings - Frequency and Active Power – From 14:00:00 to 23:59:59 hours
A n n e x B : P F M R e c o r d i n g s
P 2 0 2 9 S e c u r i t y o f S u p p l y i n C u r a ç a o ’ s E l e c t r i c i t y S y s t e m P a g e 2 2 | 2 6
Figure 8: PFM Recordings - Voltage and Reactive Power – From 14:00:00 to 23:59:59 hours
A n n e x B : P F M R e c o r d i n g s
P 2 0 2 9 S e c u r i t y o f S u p p l y i n C u r a ç a o ’ s E l e c t r i c i t y S y s t e m P a g e 2 3 | 2 6
Figure 9: PFM Recordings – Frequency, Voltage and Power across Lines– From 14:00:00 to 23:59:59 hours
A n n e x C : S C A D A R e c o r d i n g s
P 2 0 2 9 S e c u r i t y o f S u p p l y i n C u r a ç a o ’ s E l e c t r i c i t y S y s t e m P a g e 2 4 | 2 6
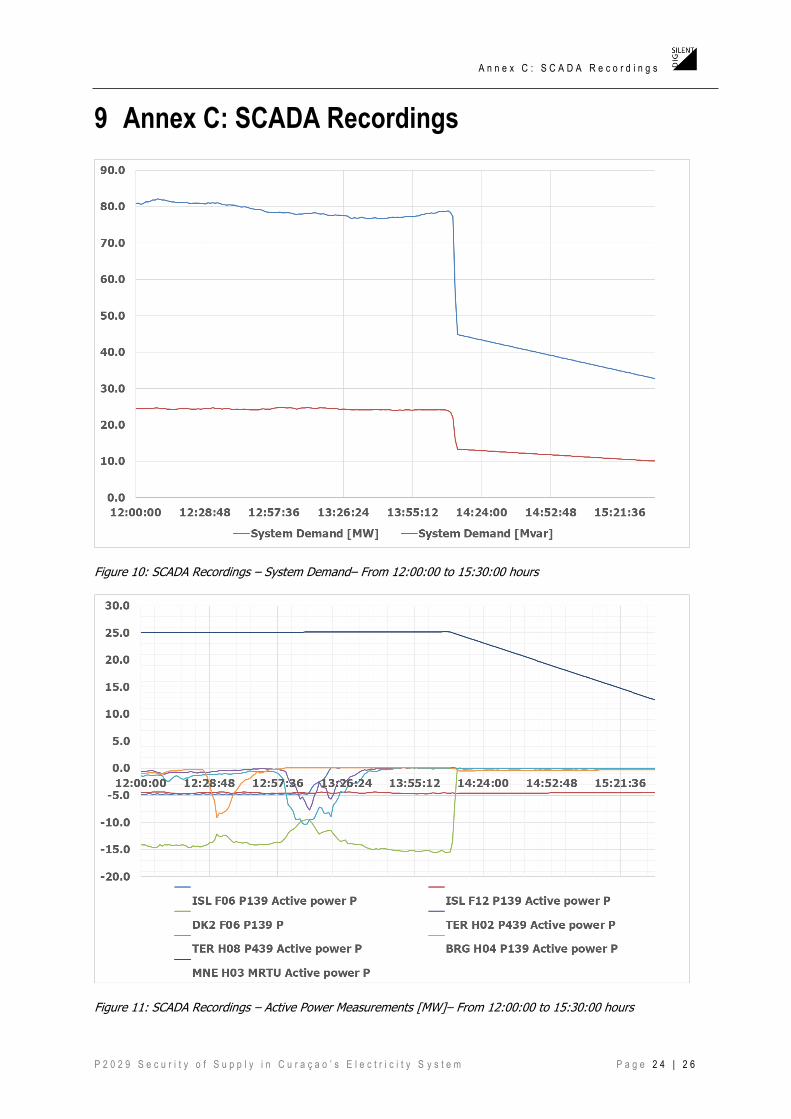
9 Annex C: SCADA Recordings
Figure 10: SCADA Recordings – System Demand– From 12:00:00 to 15:30:00 hours
Figure 11: SCADA Recordings – Active Power Measurements [MW]– From 12:00:00 to 15:30:00 hours
A n n e x C : S C A D A R e c o r d i n g s
P 2 0 2 9 S e c u r i t y o f S u p p l y i n C u r a ç a o ’ s E l e c t r i c i t y S y s t e m P a g e 2 5 | 2 6
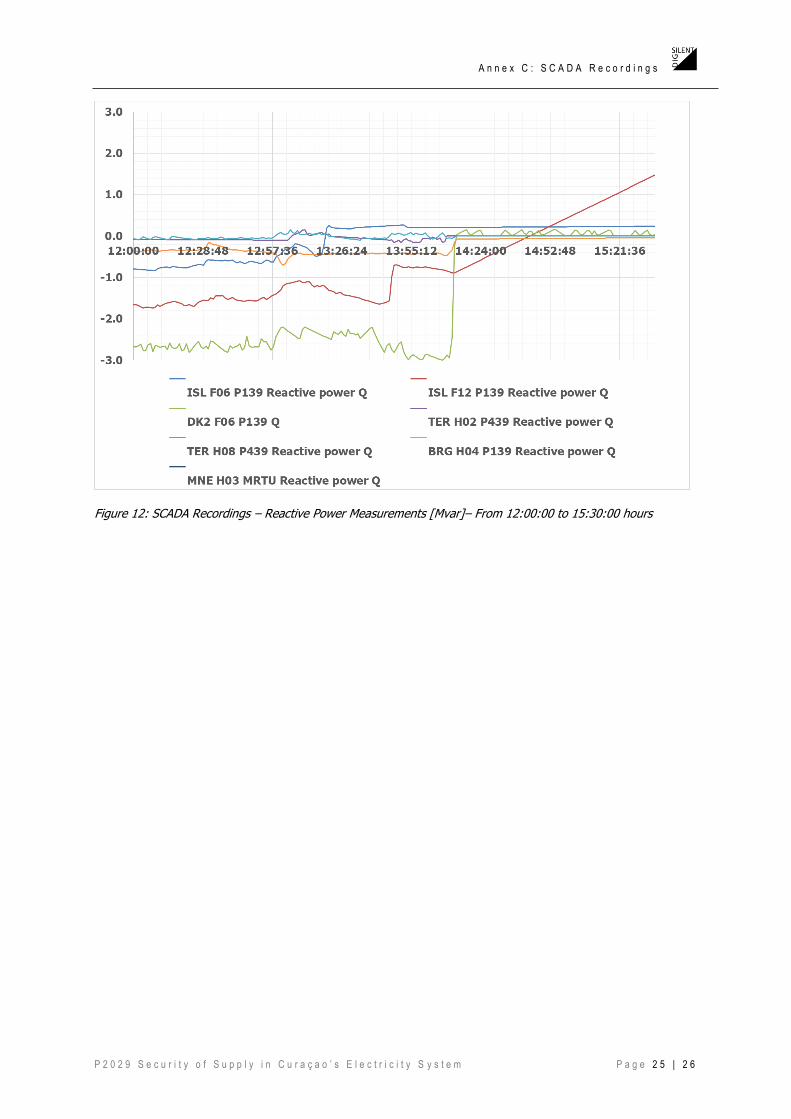
Figure 12: SCADA Recordings – Reactive Power Measurements [Mvar]– From 12:00:00 to 15:30:00 hours
A n n e x D : O v e r c u r r e n t P r o t e c t i o n ( P 1 3 9 ) S e t t i n g s i n L i n e D o k w e g 6 6 k V - I s l a 6 6 k V
P 2 0 2 9 S e c u r i t y o f S u p p l y i n C u r a ç a o ’ s E l e c t r i c i t y S y s t e m P a g e 2 6 | 2 6
10 Annex D: Overcurrent Protection (P139) Settings in
Line Dokweg 66kV-Isla 66 kV
Figure 13: Overcurrent Protection (P139) Settings in Line Dokweg 66kV-Isla 66 kV [9]