Embed Size (px)
Citation preview

Turn over
Surname
Total Marks
Paper Reference
Candidate NumberCentre Number
Other names
Write your name here
P44240A©2014 Pearson Education Ltd.
5/5/5/5/
*P44240A0120*
Statistical MethodsLevel 2Calculator allowed
Monday 13 January 2014 – AfternoonTime: 1 hour 30 minutes AST20/01
You must have:Pen, HB pencil, eraser, calculator, ruler.
Instructions Use black ink or ball-point pen. Fill in the boxes at the top of this page with your name,
centre number and candidate number. Answer all questions. Answer the questions in the spaces provided
– there may be more space than you need. Calculators may be used. If your calculator does not have a button, take the value of to be 3.142
unless the question instructs otherwise.
Information The total mark for this paper is 80 The marks for each question are shown in brackets
– use this as a guide as to how much time to spend on each question.
Advice Read each question carefully before you start to answer it. Keep an eye on the time. Try to answer every question. Check your answers if you have time at the end.
Pearson Edexcel Award

2
*P44240A0220*
Answer ALL questions.
Write your answers in the spaces provided.
You must write down all stages in your working.
1 Complete the sentences below using one of the following words.
discrete continuous categorical
The weight of a dog is .. . . . . . . . . . . . . . . . . . . . . . . . . . . . . . . . . . . . . . . . . . . . . . . . . . . . . . . . . . . . . . . . . . . . . . . . . . . . . . . . . . . . . . . . . . . . . . . . . . . . . . . . . . . . . . . . . . . . data.
The number of eggs in a basket is .. . . . . . . . . . . . . . . . . . . . . . . . . . . . . . . . . . . . . . . . . . . . . . . . . . . . . . . . . . . . . . . . . . . . . . . . . . . . . . . . . . . . . . . . . . data.
The colour of a person’s hair is .. . . . . . . . . . . . . . . . . . . . . . . . . . . . . . . . . . . . . . . . . . . . . . . . . . . . . . . . . . . . . . . . . . . . . . . . . . . . . . . . . . . . . . . . . . . . . . . . data.
(Total for Question 1 is 2 marks)
2 Here are the ages, in years, of 25 people.
22 35 22 28 23
41 26 33 39 32
32 26 18 44 27
19 30 26 39 33
29 38 28 32 34
(a) Complete the grouped frequency table for this information.
Age (years) Tally Frequency
15 < y 20
20 < y 25
25 < y 30
30 < y 35
35 < y 40
40 < y 45
(3)
(b) Find the class interval that contains the median.
.. . . . . . . . . . . . . . . . . . . . . . . . . . . . . . . . . . . . . . . .
(1)
(Total for Question 2 is 4 marks)
*P44240A0320* Turn over
3
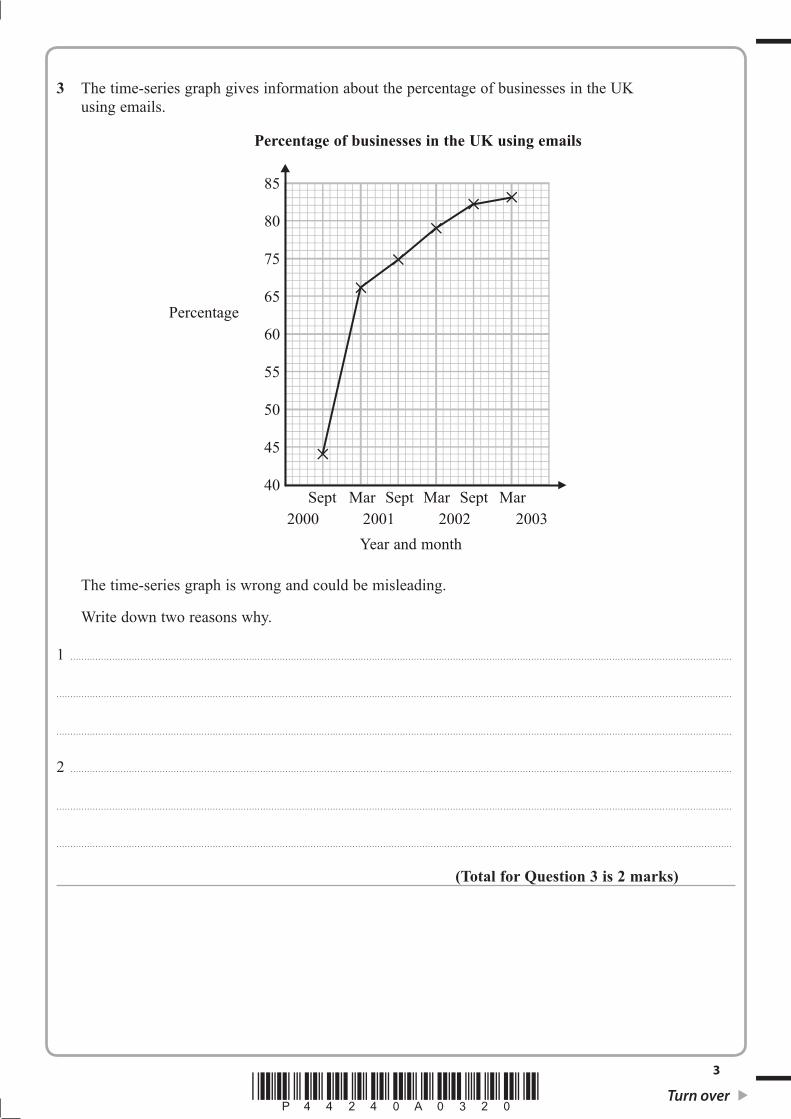
3 The time-series graph gives information about the percentage of businesses in the UK using emails.
The time-series graph is wrong and could be misleading.
Write down two reasons why.
1 . . . . . . . . . . . . . . . . . . . . . . . . . . . . . . . . . . . . . . . . . . . . . . . . . . . . . . . . . . . . . . . . . . . . . . . . . . . . . . . . . . . . . . . . . . . . . . . . . . . . . . . . . . . . . . . . . . . . . . . . . . . . . . . . . . . . . . . . . . . . . . . . . . . . . . . . . . . . . . . . . . . . . . . . . . . . . . . . . . . . . . . . . . . . . . . . . . . . . . . . . . . . . . . . . . . . . . . . . . . . . . . . . . . . . . . . . . . . .
. . . . . . . . . . . . . . . . . . . . . . . . . . . . . . . . . . . . . . . . . . . . . . . . . . . . . . . . . . . . . . . . . . . . . . . . . . . . . . . . . . . . . . . . . . . . . . . . . . . . . . . . . . . . . . . . . . . . . . . . . . . . . . . . . . . . . . . . . . . . . . . . . . . . . . . . . . . . . . . . . . . . . . . . . . . . . . . . . . . . . . . . . . . . . . . . . . . . . . . . . . . . . . . . . . . . . . . . . . . . . . . . . . . . . . . . . . . . . . . . . .
. . . . . . . . . . . . . . . . . . . . . . . . . . . . . . . . . . . . . . . . . . . . . . . . . . . . . . . . . . . . . . . . . . . . . . . . . . . . . . . . . . . . . . . . . . . . . . . . . . . . . . . . . . . . . . . . . . . . . . . . . . . . . . . . . . . . . . . . . . . . . . . . . . . . . . . . . . . . . . . . . . . . . . . . . . . . . . . . . . . . . . . . . . . . . . . . . . . . . . . . . . . . . . . . . . . . . . . . . . . . . . . . . . . . . . . . . . . . . . . . . .
2 . . . . . . . . . . . . . . . . . . . . . . . . . . . . . . . . . . . . . . . . . . . . . . . . . . . . . . . . . . . . . . . . . . . . . . . . . . . . . . . . . . . . . . . . . . . . . . . . . . . . . . . . . . . . . . . . . . . . . . . . . . . . . . . . . . . . . . . . . . . . . . . . . . . . . . . . . . . . . . . . . . . . . . . . . . . . . . . . . . . . . . . . . . . . . . . . . . . . . . . . . . . . . . . . . . . . . . . . . . . . . . . . . . . . . . . . . . . . .
. . . . . . . . . . . . . . . . . . . . . . . . . . . . . . . . . . . . . . . . . . . . . . . . . . . . . . . . . . . . . . . . . . . . . . . . . . . . . . . . . . . . . . . . . . . . . . . . . . . . . . . . . . . . . . . . . . . . . . . . . . . . . . . . . . . . . . . . . . . . . . . . . . . . . . . . . . . . . . . . . . . . . . . . . . . . . . . . . . . . . . . . . . . . . . . . . . . . . . . . . . . . . . . . . . . . . . . . . . . . . . . . . . . . . . . . . . . . . . . . . .
. . . . . . . . . . . . . . . . . . . . . . . . . . . . . . . . . . . . . . . . . . . . . . . . . . . . . . . . . . . . . . . . . . . . . . . . . . . . . . . . . . . . . . . . . . . . . . . . . . . . . . . . . . . . . . . . . . . . . . . . . . . . . . . . . . . . . . . . . . . . . . . . . . . . . . . . . . . . . . . . . . . . . . . . . . . . . . . . . . . . . . . . . . . . . . . . . . . . . . . . . . . . . . . . . . . . . . . . . . . . . . . . . . . . . . . . . . . . . . . . . .
(Total for Question 3 is 2 marks)
Percentage of businesses in the UK using emails
85
80
75
65
60
55
50
45
40
Year and month
Percentage
Sept Mar Sept Mar Sept Mar2000 2001 2002 2003

4
*P44240A0420*
4 The incomplete table and composite bar chart show, for two countries, the percentages of the population in 3 age ranges.
Under 15 15 to 64 65 and over
UK
Mexico 36% 60% 4%
(a) Use the information from the composite bar chart for the UK to complete the table.(3)
(b) Use the information from the table to complete the composite bar chart for Mexico.(3)
(Total for Question 4 is 6 marks)
Percentage
100
90
80
70
60
50
40
30
20
10
0UK Mexico
Key:
65 and over
15 to 64
Under 15

5
*P44240A0520* Turn over
5 Pam has a 6-sided dice.
The dice is biased.
The table shows the probabilities that when the dice is thrown, it will land on 1 or 2 or 3 or 4 or 5
Number 1 2 3 4 5 6
Probability 0.15 0.25 0.1 0.2 0.15
Pam throws the dice.
(a) Work out the probability that the dice will land on 6
.. . . . . . . . . . . . . . . . . . . . . . . . . . . . . . . . . . . . . . . .
(2)
(b) Work out the probability that the dice will land on 1 or 3 or 5
.. . . . . . . . . . . . . . . . . . . . . . . . . . . . . . . . . . . . . . . .
(2)
Pam is going to throw the dice 300 times.
(c) Work out an estimate for the number of times the dice will land on 4
.. . . . . . . . . . . . . . . . . . . . . . . . . . . . . . . . . . . . . . . .
(2)
(d) Compare this estimate for the number of times the dice will land on 4 with the expected number of times the dice will land on 4 when the dice is fair.
. . . . . . . . . . . . . . . . . . . . . . . . . . . . . . . . . . . . . . . . . . . . . . . . . . . . . . . . . . . . . . . . . . . . . . . . . . . . . . . . . . . . . . . . . . . . . . . . . . . . . . . . . . . . . . . . . . . . . . . . . . . . . . . . . . . . . . . . . . . . . . . . . . . . . . . . . . . . . . . . . . . . . . . . . . . . . . . . . . . . . . . . . . . . . . . . . . . . . . . . . . . . . . . . . . . . . . . . . . . . . . . . . . . . . . . . . . . . . . . . . .
. . . . . . . . . . . . . . . . . . . . . . . . . . . . . . . . . . . . . . . . . . . . . . . . . . . . . . . . . . . . . . . . . . . . . . . . . . . . . . . . . . . . . . . . . . . . . . . . . . . . . . . . . . . . . . . . . . . . . . . . . . . . . . . . . . . . . . . . . . . . . . . . . . . . . . . . . . . . . . . . . . . . . . . . . . . . . . . . . . . . . . . . . . . . . . . . . . . . . . . . . . . . . . . . . . . . . . . . . . . . . . . . . . . . . . . . . . . . . . . . . .
(1)
(Total for Question 5 is 7 marks)

6
*P44240A0620*
6 A restaurant offers the following main courses and desserts.
Main Course Dessert
Fish and Chips (F) Ice Cream (I)
Spaghetti Bolognese (S) Apple Pie (P)
Jacket Potato and Tuna (J) Strawberry Yoghurt (Y)
Chicken Curry (C)
The sample space diagram below shows some of the possible outcomes when one main course and one dessert are chosen.
Main Course
F S J C
Dessert
I (F, I) (S, I)
P (F, P)
Y
(a) Complete the sample space diagram.(2)
Sally is going to pick at random one main course and one dessert.
(b) Find the probability that she picks fish and chips and a strawberry yoghurt.
.. . . . . . . . . . . . . . . . . . . . . . . . . . . . . . . . . . . . . . . .
(1)
(Total for Question 6 is 3 marks)

7
*P44240A0720* Turn over
7 The manager of a factory making candles decides to test the quality of the candles.
A sample of the candles is to be tested rather than the population of the candles.
(a) Explain why.
.. . . . . . . . . . . . . . . . . . . . . . . . . . . . . . . . . . . . . . . . . . . . . . . . . . . . . . . . . . . . . . . . . . . . . . . . . . . . . . . . . . . . . . . . . . . . . . . . . . . . . . . . . . . . . . . . . . . . . . . . . . . . . . . . . . . . . . . . . . . . . . . . . . . . . . . . . . . . . . . . . . . . . . . . . . . . . . . . . . . . . . . . . . . . . . . . . . . . . . . . . . . . . . . . . . . . . . . . . . . . . . . . . . . . . . . . . . . . . . . . .
. . . . . . . . . . . . . . . . . . . . . . . . . . . . . . . . . . . . . . . . . . . . . . . . . . . . . . . . . . . . . . . . . . . . . . . . . . . . . . . . . . . . . . . . . . . . . . . . . . . . . . . . . . . . . . . . . . . . . . . . . . . . . . . . . . . . . . . . . . . . . . . . . . . . . . . . . . . . . . . . . . . . . . . . . . . . . . . . . . . . . . . . . . . . . . . . . . . . . . . . . . . . . . . . . . . . . . . . . . . . . . . . . . . . . . . . . . . . . . . . . .
(1)
5000 candles per day are made in the factory.
The manager decides to test the last 5 candles produced one day.
This is not a good sample.
(b) Give two reasons why.
1 . . . . . . . . . . . . . . . . . . . . . . . . . . . . . . . . . . . . . . . . . . . . . . . . . . . . . . . . . . . . . . . . . . . . . . . . . . . . . . . . . . . . . . . . . . . . . . . . . . . . . . . . . . . . . . . . . . . . . . . . . . . . . . . . . . . . . . . . . . . . . . . . . . . . . . . . . . . . . . . . . . . . . . . . . . . . . . . . . . . . . . . . . . . . . . . . . . . . . . . . . . . . . . . . . . . . . . . . . . . . . . . . . . . . . . . . . . . .
. . . . . . . . . . . . . . . . . . . . . . . . . . . . . . . . . . . . . . . . . . . . . . . . . . . . . . . . . . . . . . . . . . . . . . . . . . . . . . . . . . . . . . . . . . . . . . . . . . . . . . . . . . . . . . . . . . . . . . . . . . . . . . . . . . . . . . . . . . . . . . . . . . . . . . . . . . . . . . . . . . . . . . . . . . . . . . . . . . . . . . . . . . . . . . . . . . . . . . . . . . . . . . . . . . . . . . . . . . . . . . . . . . . . . . . . . . . . . . . . . .
2 . . . . . . . . . . . . . . . . . . . . . . . . . . . . . . . . . . . . . . . . . . . . . . . . . . . . . . . . . . . . . . . . . . . . . . . . . . . . . . . . . . . . . . . . . . . . . . . . . . . . . . . . . . . . . . . . . . . . . . . . . . . . . . . . . . . . . . . . . . . . . . . . . . . . . . . . . . . . . . . . . . . . . . . . . . . . . . . . . . . . . . . . . . . . . . . . . . . . . . . . . . . . . . . . . . . . . . . . . . . . . . . . . . . . . . . . . . . .
. . . . . . . . . . . . . . . . . . . . . . . . . . . . . . . . . . . . . . . . . . . . . . . . . . . . . . . . . . . . . . . . . . . . . . . . . . . . . . . . . . . . . . . . . . . . . . . . . . . . . . . . . . . . . . . . . . . . . . . . . . . . . . . . . . . . . . . . . . . . . . . . . . . . . . . . . . . . . . . . . . . . . . . . . . . . . . . . . . . . . . . . . . . . . . . . . . . . . . . . . . . . . . . . . . . . . . . . . . . . . . . . . . . . . . . . . . . . . . . . . .
(2)
(Total for Question 7 is 3 marks)
8
*P44240A0820*
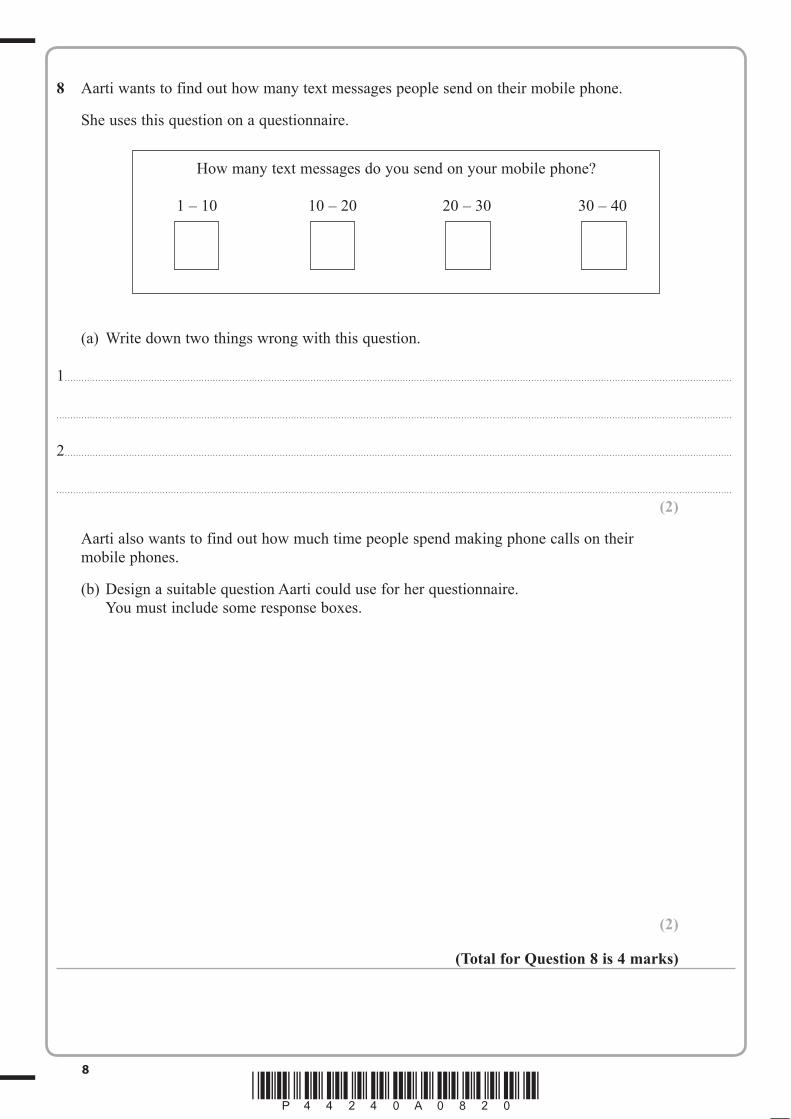
8 Aarti wants to find out how many text messages people send on their mobile phone.
She uses this question on a questionnaire.
(a) Write down two things wrong with this question.
1 . . . . . . . . . . . . . . . . . . . . . . . . . . . . . . . . . . . . . . . . . . . . . . . . . . . . . . . . . . . . . . . . . . . . . . . . . . . . . . . . . . . . . . . . . . . . . . . . . . . . . . . . . . . . . . . . . . . . . . . . . . . . . . . . . . . . . . . . . . . . . . . . . . . . . . . . . . . . . . . . . . . . . . . . . . . . . . . . . . . . . . . . . . . . . . . . . . . . . . . . . . . . . . . . . . . . . . . . . . . . . . . . . . . . . . . . . . . . . . .
. . . . . . . . . . . . . . . . . . . . . . . . . . . . . . . . . . . . . . . . . . . . . . . . . . . . . . . . . . . . . . . . . . . . . . . . . . . . . . . . . . . . . . . . . . . . . . . . . . . . . . . . . . . . . . . . . . . . . . . . . . . . . . . . . . . . . . . . . . . . . . . . . . . . . . . . . . . . . . . . . . . . . . . . . . . . . . . . . . . . . . . . . . . . . . . . . . . . . . . . . . . . . . . . . . . . . . . . . . . . . . . . . . . . . . . . . . . . . . . . . .
2 . . . . . . . . . . . . . . . . . . . . . . . . . . . . . . . . . . . . . . . . . . . . . . . . . . . . . . . . . . . . . . . . . . . . . . . . . . . . . . . . . . . . . . . . . . . . . . . . . . . . . . . . . . . . . . . . . . . . . . . . . . . . . . . . . . . . . . . . . . . . . . . . . . . . . . . . . . . . . . . . . . . . . . . . . . . . . . . . . . . . . . . . . . . . . . . . . . . . . . . . . . . . . . . . . . . . . . . . . . . . . . . . . . . . . . . . . . . . . . .
. . . . . . . . . . . . . . . . . . . . . . . . . . . . . . . . . . . . . . . . . . . . . . . . . . . . . . . . . . . . . . . . . . . . . . . . . . . . . . . . . . . . . . . . . . . . . . . . . . . . . . . . . . . . . . . . . . . . . . . . . . . . . . . . . . . . . . . . . . . . . . . . . . . . . . . . . . . . . . . . . . . . . . . . . . . . . . . . . . . . . . . . . . . . . . . . . . . . . . . . . . . . . . . . . . . . . . . . . . . . . . . . . . . . . . . . . . . . . . . . . .
(2)
Aarti also wants to find out how much time people spend making phone calls on their mobile phones.
(b) Design a suitable question Aarti could use for her questionnaire. You must include some response boxes.
(2)
(Total for Question 8 is 4 marks)
How many text messages do you send on your mobile phone?
1 – 10 10 – 20 20 – 30 30 – 40

9
*P44240A0920* Turn over
9 60 students take a history test. The test is marked out of 50
This table shows information about the students’ marks.
History mark (m) 0 < m 10 10 < m 20 20 < m 30 30 < m 40 40 < m 50
Frequency 2 11 15 17 5
(a) On the grid, draw a frequency polygon for this information.
(2)
(b) Write down the modal class interval... . . . . . . . . . . . . . . . . . . . . . . . . . . . . . . . . . . . . . . . . . . . . . . . . . . . . . . . . . . . . . . . . . . . . . . . . . . . . . . .
(1)
(Total for Question 9 is 3 marks)
20
15
10
5
0
Frequency
History mark
0 10 20 30 40 50

10
*P44240A01020*
10 20 students scored goals for a school football team last month.
The table gives information about the number of goals scored by each student.
Goals scored Number of students
1 9
2 3
3 5
4 3
(a) Work out the median number of goals scored.
.. . . . . . . . . . . . . . . . . . . . . . . . . . . . . . . . . . . . . . . .
(2)
(b) Work out the range of the number of goals scored.
.. . . . . . . . . . . . . . . . . . . . . . . . . . . . . . . . . . . . . . . .
(1)
(c) Work out the mean number of goals scored.
.. . . . . . . . . . . . . . . . . . . . . . . . . . . . . . . . . . . . . . . .
(3)
(Total for Question 10 is 6 marks)

11
*P44240A01120* Turn over
11 The scatter graph shows the science mark and the maths mark for 16 students.
(a) What name would you give to the point (50, 20) which does not fit the pattern of the other points?
.. . . . . . . . . . . . . . . . . . . . . . . . . . . . . . . . . . . . . . . . . . . . . . . . . . . . . . . . . . . . . . . . . . . . . . . . . . . . . . . . . . . . . . . . . . . . . . . . . . . . . . . . . . . . . . . . . . . . . . . . . . . . . . . . . . . . . . . . . . . . . . . . . . . . . . . . . . . . . . . . . . . . . . . . . . . . . . . . . . . . . . . . . . . . . . . . . . . . . . . . . . . . . . . . . . . . . . . . . . . . . . . . . . . . . . . . . . . . . . . . .
(1)
(b) Describe the relationship between the mark in science and the mark in maths.
.. . . . . . . . . . . . . . . . . . . . . . . . . . . . . . . . . . . . . . . . . . . . . . . . . . . . . . . . . . . . . . . . . . . . . . . . . . . . . . . . . . . . . . . . . . . . . . . . . . . . . . . . . . . . . . . . . . . . . . . . . . . . . . . . . . . . . . . . . . . . . . . . . . . . . . . . . . . . . . . . . . . . . . . . . . . . . . . . . . . . . . . . . . . . . . . . . . . . . . . . . . . . . . . . . . . . . . . . . . . . . . . . . . . . . . . . . . . . . . . . .
(1)
(c) Draw a line of best fit on the scatter graph.(1)
Sophina’s science mark was 30
(d) Use your line of best fit to find an estimate for Sophina’s maths mark... . . . . . . . . . . . . . . . . . . . . . . . . . . . . . . . . . . . . . . .
(1)
(Total for Question 11 is 4 marks)
Mathsmark
Science mark
0 10 20 30 40 50 60
60
50
40
30
20
10
0

12
*P44240A01220*
12 Robyn recorded the heights, in centimetres, of the girls in her class.
Here are her results.
132 144 150 152 160 162 162 167
167 170 172 177 181 182 182
(a) (i) Find the median.
.. . . . . . . . . . . . . . . . . . . . . . . . . . . . . . . . . . . . . . . . cm
(ii) Find the lower quartile.
.. . . . . . . . . . . . . . . . . . . . . . . . . . . . . . . . . . . . . . . . cm
(iii) Find the upper quartile.
.. . . . . . . . . . . . . . . . . . . . . . . . . . . . . . . . . . . . . . . . cm(3)
(b) On the grid, draw a box plot for Robyn’s results.
(3)
(c) Describe the skew of the distribution of the heights.
.. . . . . . . . . . . . . . . . . . . . . . . . . . . . . . . . . . . . . . . . . . . . . . . . . . . . . . . . . . . . . . . . . . . . . . . . . . . . . . . . . . . . . . . . . . . . . . . . . . . . . . . . . . . . . . . . . . . . . . . . . . . . . . . . . . . . . . . . . . . . . . . . . . . . . . . . . . . . . . . . . . . . . . . . . . . . . . . . . . . . . . . . . . . . . . . . . . . . . . . . . . . . . . . . . . . . . . . . . . . . . . . . . . . . . . . . . . . . . . . . .
(1)
(Total for Question 12 is 7 marks)
130 140 150 160 170 180 190 cm

13
*P44240A01320* Turn over
13 The following table shows the value of a house in Ockendon for the years 1990 and 1991.
Ockendon
Year 1990 1991
Value (£) £80 000 £88 000
(a) Taking 1990 as the base year, work out the value of the house in Ockendon in 1991 as an index number.
.. . . . . . . . . . . . . . . . . . . . . . . . . . . . . . . . . . . . . . . . . . . . . . . . . . . . . .
(2)
Using 1990 as the base year, the value of a house in Tilbury in 1991 as an index number is 108.5
(b) Interpret and compare the index numbers for Ockendon and Tilbury in 1991.
.. . . . . . . . . . . . . . . . . . . . . . . . . . . . . . . . . . . . . . . . . . . . . . . . . . . . . . . . . . . . . . . . . . . . . . . . . . . . . . . . . . . . . . . . . . . . . . . . . . . . . . . . . . . . . . . . . . . . . . . . . . . . . . . . . . . . . . . . . . . . . . . . . . . . . . . . . . . . . . . . . . . . . . . . . . . . . . . . . . . . . . . . . . . . . . . . . . . . . . . . . . . . . . . . . . . . . . . . . . . . . . . . . . . . . . . . . . . . . . . . .
. . . . . . . . . . . . . . . . . . . . . . . . . . . . . . . . . . . . . . . . . . . . . . . . . . . . . . . . . . . . . . . . . . . . . . . . . . . . . . . . . . . . . . . . . . . . . . . . . . . . . . . . . . . . . . . . . . . . . . . . . . . . . . . . . . . . . . . . . . . . . . . . . . . . . . . . . . . . . . . . . . . . . . . . . . . . . . . . . . . . . . . . . . . . . . . . . . . . . . . . . . . . . . . . . . . . . . . . . . . . . . . . . . . . . . . . . . . . . . . . . .
(2)
(Total for Question 13 is 4 marks)

14
*P44240A01420*
14 The table shows information about the numbers of shoes sold in a shop.
Year Quarter Number of Shoes
2010 1 255
2 309
3 285
4 243
2011 1 294
2 330
(a) Calculate the 4-point moving averages for this information.
.. . . . . . . . . . . . . . . . . . . . . . . . . . . . . . . . . . . . . . . . . . . . . . . . . . . . . . . . . . . . . . . . .
(2)
(b) Describe what the moving averages show about the trend in the numbers of shoes sold in the shop over this period of time.
.. . . . . . . . . . . . . . . . . . . . . . . . . . . . . . . . . . . . . . . . . . . . . . . . . . . . . . . . . . . . . . . . . . . . . . . . . . . . . . . . . . . . . . . . . . . . . . . . . . . . . . . . . . . . . . . . . . . . . . . . . . . . . . . . . . . . . . . . . . . . . . . . . . . . . . . . . . . . . . . . . . . . . . . . . . . . . . . . . . . . . . . . . . . . . . . . . . . . . . . . . . . . . . . . . . . . . . . . . . . . . . . . . . . . . . . . . . . . . . . . .
(1)
(Total for Question 14 is 3 marks)
15
*P44240A01520* Turn over
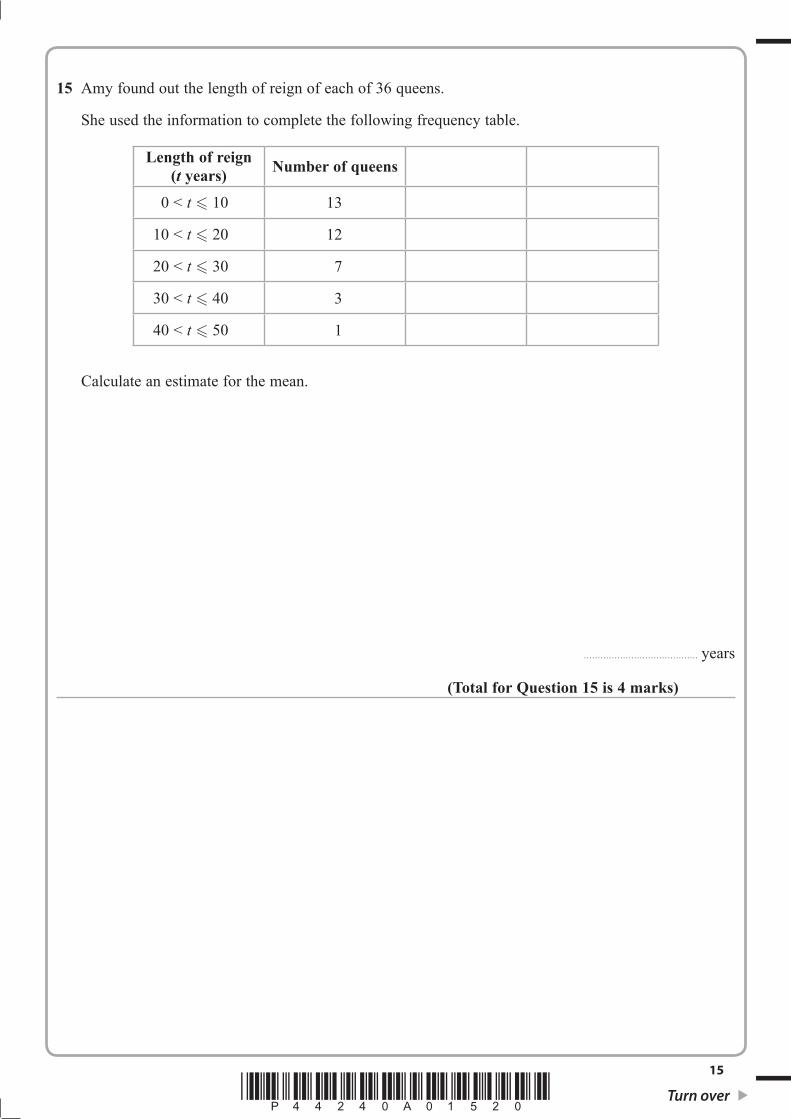
15 Amy found out the length of reign of each of 36 queens.
She used the information to complete the following frequency table.
Length of reign (t years) Number of queens
0 < t 10 13
10 < t 20 12
20 < t 30 7
30 < t 40 3
40 < t 50 1
Calculate an estimate for the mean.
.. . . . . . . . . . . . . . . . . . . . . . . . . . . . . . . . . . . . . . . . years
(Total for Question 15 is 4 marks)

16
*P44240A01620*
16 Natalie has two bags. Bag A contains 3 red counters and 2 blue counters. Bag B contains 2 red counters and 5 blue counters.
Natalie takes at random one counter from each bag.
(a) Complete the probability tree diagram.
(2)
(b) Work out the probability that the counter from bag A is red and the counter from bag B is blue.
.. . . . . . . . . . . . . . . . . . . . . . . . . . . . . . . . . . . . . . . .
(2)
(c) Work out the probability that the counter from bag A and the counter from bag B are the same colour.
.. . . . . . . . . . . . . . . . . . . . . . . . . . . . . . . . . . . . . . . .
(2)
(Total for Question 16 is 6 marks)
. . . . . . . . . . . . . . . .
. . . . . . . . . . . . . . . .
red
blue
red
counter from bag B
blue.. . . . . . . . . . . . . . .
27
. . . . . . . . . . . . . . . .
red
blue
35
counter from bag A

17
*P44240A01720* Turn over
17 A school has 650 students. Each student studies one of Latin, Japanese, French and Spanish. The table shows the number of students who study each of these languages.
Language Number of students
Latin 145
Japanese 121
French 195
Spanish 189
Peter takes a sample of 50 of these students stratified by the language studied.
Find the number of students in his sample who study French.
.. . . . . . . . . . . . . . . . . . . . . . . . . . . . . . . . . . . . . . . .
(Total for Question 17 is 2 marks)

18
*P44240A01820*
18 Bob takes a random sample of the lengths of male and female corn snakes. He measures the length of the snake to the nearest cm.
The box plots summarise his results.
Compare the distributions of the lengths of male and female snakes. Write down three comparisons.
1 . . . . . . . . . . . . . . . . . . . . . . . . . . . . . . . . . . . . . . . . . . . . . . . . . . . . . . . . . . . . . . . . . . . . . . . . . . . . . . . . . . . . . . . . . . . . . . . . . . . . . . . . . . . . . . . . . . . . . . . . . . . . . . . . . . . . . . . . . . . . . . . . . . . . . . . . . . . . . . . . . . . . . . . . . . . . . . . . . . . . . . . . . . . . . . . . . . . . . . . . . . . . . . . . . . . . . . . . . . . . . . . . . . . . . . . . . . . . . . .
. . . . . . . . . . . . . . . . . . . . . . . . . . . . . . . . . . . . . . . . . . . . . . . . . . . . . . . . . . . . . . . . . . . . . . . . . . . . . . . . . . . . . . . . . . . . . . . . . . . . . . . . . . . . . . . . . . . . . . . . . . . . . . . . . . . . . . . . . . . . . . . . . . . . . . . . . . . . . . . . . . . . . . . . . . . . . . . . . . . . . . . . . . . . . . . . . . . . . . . . . . . . . . . . . . . . . . . . . . . . . . . . . . . . . . . . . . . . . . . . . .
. . . . . . . . . . . . . . . . . . . . . . . . . . . . . . . . . . . . . . . . . . . . . . . . . . . . . . . . . . . . . . . . . . . . . . . . . . . . . . . . . . . . . . . . . . . . . . . . . . . . . . . . . . . . . . . . . . . . . . . . . . . . . . . . . . . . . . . . . . . . . . . . . . . . . . . . . . . . . . . . . . . . . . . . . . . . . . . . . . . . . . . . . . . . . . . . . . . . . . . . . . . . . . . . . . . . . . . . . . . . . . . . . . . . . . . . . . . . . . . . . .
2 . . . . . . . . . . . . . . . . . . . . . . . . . . . . . . . . . . . . . . . . . . . . . . . . . . . . . . . . . . . . . . . . . . . . . . . . . . . . . . . . . . . . . . . . . . . . . . . . . . . . . . . . . . . . . . . . . . . . . . . . . . . . . . . . . . . . . . . . . . . . . . . . . . . . . . . . . . . . . . . . . . . . . . . . . . . . . . . . . . . . . . . . . . . . . . . . . . . . . . . . . . . . . . . . . . . . . . . . . . . . . . . . . . . . . . . . . . . . . . .
. . . . . . . . . . . . . . . . . . . . . . . . . . . . . . . . . . . . . . . . . . . . . . . . . . . . . . . . . . . . . . . . . . . . . . . . . . . . . . . . . . . . . . . . . . . . . . . . . . . . . . . . . . . . . . . . . . . . . . . . . . . . . . . . . . . . . . . . . . . . . . . . . . . . . . . . . . . . . . . . . . . . . . . . . . . . . . . . . . . . . . . . . . . . . . . . . . . . . . . . . . . . . . . . . . . . . . . . . . . . . . . . . . . . . . . . . . . . . . . . . .
. . . . . . . . . . . . . . . . . . . . . . . . . . . . . . . . . . . . . . . . . . . . . . . . . . . . . . . . . . . . . . . . . . . . . . . . . . . . . . . . . . . . . . . . . . . . . . . . . . . . . . . . . . . . . . . . . . . . . . . . . . . . . . . . . . . . . . . . . . . . . . . . . . . . . . . . . . . . . . . . . . . . . . . . . . . . . . . . . . . . . . . . . . . . . . . . . . . . . . . . . . . . . . . . . . . . . . . . . . . . . . . . . . . . . . . . . . . . . . . . . .
3 . . . . . . . . . . . . . . . . . . . . . . . . . . . . . . . . . . . . . . . . . . . . . . . . . . . . . . . . . . . . . . . . . . . . . . . . . . . . . . . . . . . . . . . . . . . . . . . . . . . . . . . . . . . . . . . . . . . . . . . . . . . . . . . . . . . . . . . . . . . . . . . . . . . . . . . . . . . . . . . . . . . . . . . . . . . . . . . . . . . . . . . . . . . . . . . . . . . . . . . . . . . . . . . . . . . . . . . . . . . . . . . . . . . . . . . . . . . . . . .
. . . . . . . . . . . . . . . . . . . . . . . . . . . . . . . . . . . . . . . . . . . . . . . . . . . . . . . . . . . . . . . . . . . . . . . . . . . . . . . . . . . . . . . . . . . . . . . . . . . . . . . . . . . . . . . . . . . . . . . . . . . . . . . . . . . . . . . . . . . . . . . . . . . . . . . . . . . . . . . . . . . . . . . . . . . . . . . . . . . . . . . . . . . . . . . . . . . . . . . . . . . . . . . . . . . . . . . . . . . . . . . . . . . . . . . . . . . . . . . . . .
. . . . . . . . . . . . . . . . . . . . . . . . . . . . . . . . . . . . . . . . . . . . . . . . . . . . . . . . . . . . . . . . . . . . . . . . . . . . . . . . . . . . . . . . . . . . . . . . . . . . . . . . . . . . . . . . . . . . . . . . . . . . . . . . . . . . . . . . . . . . . . . . . . . . . . . . . . . . . . . . . . . . . . . . . . . . . . . . . . . . . . . . . . . . . . . . . . . . . . . . . . . . . . . . . . . . . . . . . . . . . . . . . . . . . . . . . . . . . . . . . .
(Total for Question 18 is 3 marks)
Female
Male
Length of the snake (cm)
0 40 80 120 160 200

19
*P44240A01920* Turn over
19 n = 20 x = 240 x2 = 3000
Work out the standard deviation. Give your answer correct to 3 decimal places.
.. . . . . . . . . . . . . . . . . . . . . . . . . . . . . . . . . . . . . . . .
(Total for Question 19 is 3 marks)

20
*P44240A02020*
20 The mean of eight numbers is 41 The mean of two of the numbers is 29
What is the mean of the other six numbers?
.. . . . . . . . . . . . . . . . . . . . . . . . . . . . . . . . . . . . . . . .
(Total for Question 20 is 4 marks)
TOTAL FOR PAPER IS 80 MARKS