Embed Size (px)
Citation preview
Pedestrian Accessibility and Attractiveness
Indicators for Walkability Assessment
Paulo Jorge Monteiro de Cambra
Dissertação para a Obtenção do Grau de Mestre em
Urbanismo e Ordenamento do Território
Júri
Presidente: Prof.Doutor José Álvaro Antunes Ferreira
Orientador: Prof. Doutor Filipe Manuel Mercier Vilaça e Moura
Co-Orientador: Prof. Doutor Alexandre Bacelar Gonçalves
Vogais: Prof. Doutor João António de Abreu e Silva
Eng. Mário José Brandão Martins e Alves
Outubro 2012
i
Caminante, son tus huellas
el camino y nada más;
Caminante, no hay camino,
se hace camino al andar.
Al andar se hace el camino,
y al volver la vista atrás
se ve la senda que nunca
se ha de volver a pisar.
Caminante no hay camino
sino estelas en la mar”
Antonio Machado, Proverbios y cantares XXIX in Campos de Castilla

ii
Acknowledgements
Foremost I wish to thank, if possible, the scientific community as a whole, for sharing their research,
findings and ideas.
I am very thankful to all my colleagues and friends at CESUR, for all the professional and personal
contributions I had during this enriching journey (sorry folks no names but you know who you are). Special
regards go the NUA research group, whose critics and feedback were determinant in shaping this
research.
I want to thank my advisors, Filipe Moura and Alexandre Gonçalves, who gave me enough freedom to
explore this vast field, providing the most straightforward and patient guidance.
I also want to thank the time and the most valuable insights from the conversations with Prof.Rui Oliveira
(Cesur) and Marcus Weil (Urbaplan). And the kind words of encouragement from Daniel Sauter (Urban
Mobility Research) and Lefteris Sdoukopoulos (CERT-HIT).
A special word of stimulus goes to my MUOT mates, thank you for the companionship and may you all
achieve your goals.
To Eleonora for being there at all times,
And to my mother and my father for their endless support.
iii
ABSTRACT
Every journey begins with a walking step. Walking is the elementary mean of people moving around, of
integrating and living the urban space and of accomplishing salutary physical activity. Many benefits have
been associated with walking, ranging from reducing traffic congestion and pollution to solving obesity,
being walking also regarded as an essential factor in the creation of “livable communities”. With such
associated benefits, critical questions are posed to researchers and urban planners: how and to what
extent can the built environment encourage people to walk, and how to measure the intensity of that link.
Walkability research is recent and agreement on what to measure and how to measure is still very much
in contention. From the multiplicity of urban attributes that may influence walking, accessibility and
attractiveness of the pedestrian environment seem to play a major role.
The aim of this work is to find suitable pedestrian accessibility and attractiveness indicators for walkability
assessment. Assessing the extent to which the built environment is walker friendly may support more
objective and comprehensive planning strategies and interventions, facilitating the progress towards more
sustainable, integrated and appealing, walking cities.
A walkability assessment model was developed with the aid of multi criteria decision analysis techniques
and GIS network analysis, able to address different scales (city, neighborhood and street). The model was
then applied to case studies (Lisbon, Bairro Alto quarter, and Bairro Alto streets) with the results showing
a positive correlation between estimated walkability and pedestrian travel patterns.
Keywords: walkability, pedestrian; accessibility; attractiveness; measurement; assessment
iv
RESUMO
Toda a viagem começa com um passo. Caminhar é o meio mais elementar de deslocação, de integração
e de vivência do espaço urbano. A marcha a pé tem sido alvo de atenção crescente, sendo por vezes
apresentada como remédio para maleitas dos tempos modernos, dos engarrafamentos e poluição ao
combate à obesidade. Dados tais benefícios, tem sido colocada a questão de como motivar as pessoas a
andar mais, e de saber em que termos e com que intensidade pode o ambiente urbano influenciar o
andar a pé.
O conceito de “walkability” prende-se com o avaliar em que medida certos atributos e qualidades do
espaço urbano vão de encontro à satisfação das necessidades do peão. Sendo um campo de
investigação recente, a identificação de tais atributos e a sua forma de avaliação não tem sido
consensual. Da multiplicidade de factores urbanísticos que parece influenciar a marcha a pé, a
acessibilidade e a atractividade parecem assumir um papel fundamental.
O objectivo deste trabalho é a identificação de indicadores de acessibilidade e atractividade pedonal com
vista à avaliação/medição da caminhabilidade, o que poderá contribuir para a fundamentação e
acompanhamento de estratégias e intervenções ao nível de gestão urbanística, e por sua vez à
promoção de cidades mais sustentáveis.
Nesse âmbito, foi desenvolvido um modelo de avaliação de “walkability”, com recurso a técnicas de
análise multicritério e apoio à decisão em combinação com sistemas de informação geográfica,
permitindo a análise a diferentes escalas (cidade, bairro, rua). O modelo foi testado às diferentes escalas
(cidade de Lisboa e Bairro Alto) evidenciando os resultados uma correlação positiva entre a “walkabiliy”
estimada e o nº de viagens pendulares feitas a pé.
Keywords: caminhabilidade, pedonal; acessibilidade; atractividade; medição; walkability
v
Table of contents
Table of contents .................................................................................................................................... v
1 . Introduction .................................................................................................................................. 1
2 . The Walk ...................................................................................................................................... 4
2.1 Why walk .................................................................................................................................. 4
2.2 Walk and the city - What influences people to walk ................................................................... 7
2.3 The city and the walker –Built .Environment factors influencing walking .................................. 10
2.4 Built environment correlates .................................................................................................... 14
2.5 Walkability concept ................................................................................................................. 18
2.6 State of practice – 2012 .......................................................................................................... 21
3 . Walkability measurement ............................................................................................................ 26
3.1 Why measure walking ............................................................................................................. 26
3.2 Methodologies ........................................................................................................................ 27
3.3 Issues ..................................................................................................................................... 30
4 . Developing a walkability assessment model ............................................................................... 39
4.1 Conceptual framework ............................................................................................................ 39
4.2 Structure it .............................................................................................................................. 42
4.2.1 Structuring stage ............................................................................................................. 42
4.2.2 Indicator selection and operationalization ........................................................................ 47
4.3 Score it ................................................................................................................................... 49
4.3.1 Global SCALE ................................................................................................................. 50
4.3.2 MACRO SCALE .............................................................................................................. 52
4.3.3 Meso SCALE .................................................................................................................. 53
4.3.4 micro SCALE .................................................................................................................. 54
4.3.5 Weigths........................................................................................................................... 55
4.4 Assemble it ............................................................................................................................. 57
4.4.1 Model calibration and validation ...................................................................................... 59
5 . Test it : case studies ................................................................................................................... 61
5.1 Global scale ............................................................................................................................ 61
vi
5.2 Macro scale ............................................................................................................................ 66
5.3 Micro scale ............................................................................................................................. 68
6 . Discussion and conclusions ........................................................................................................ 71
6.1 Result discussion .................................................................................................................... 71
6.2 Further developments ............................................................................................................. 73
6.3 Concluding Remarks .............................................................................................................. 76
7 . References ................................................................................................................................. 78
8 . Web references .......................................................................................................................... 80
9 . ANNEXES .................................................................................................................................. 81
9.1 ANNEX A: Indicators (descriptors) for Macro scale.................................................................. 81
9.2 ANNEX B:Indicators (descriptors) – micro scale ...................................................................... 91
9.3 ANNEX C: Normalization ...................................................................................................... 103
9.4 ANNEX D: Street and Pedestrian network diagrams ............................................................. 104
9.5 ANNEX E: Macro Scale GIS analysis and evaluation ............................................................ 105
9.6 ANNEX F : Micro scale evaluation ........................................................................................ 111
Figure index
Figure 1: Conceptual relations of factors influencing walking, adapted from Handy (2005) and Schmid
(2006) ...................................................................................................................................................... 9
Figure 2 : Conceptual framework of the role of perceptions in mediation of physical features of the
environment and walking behavior. Source: Ewing and Handy (2009) .................................................... 11
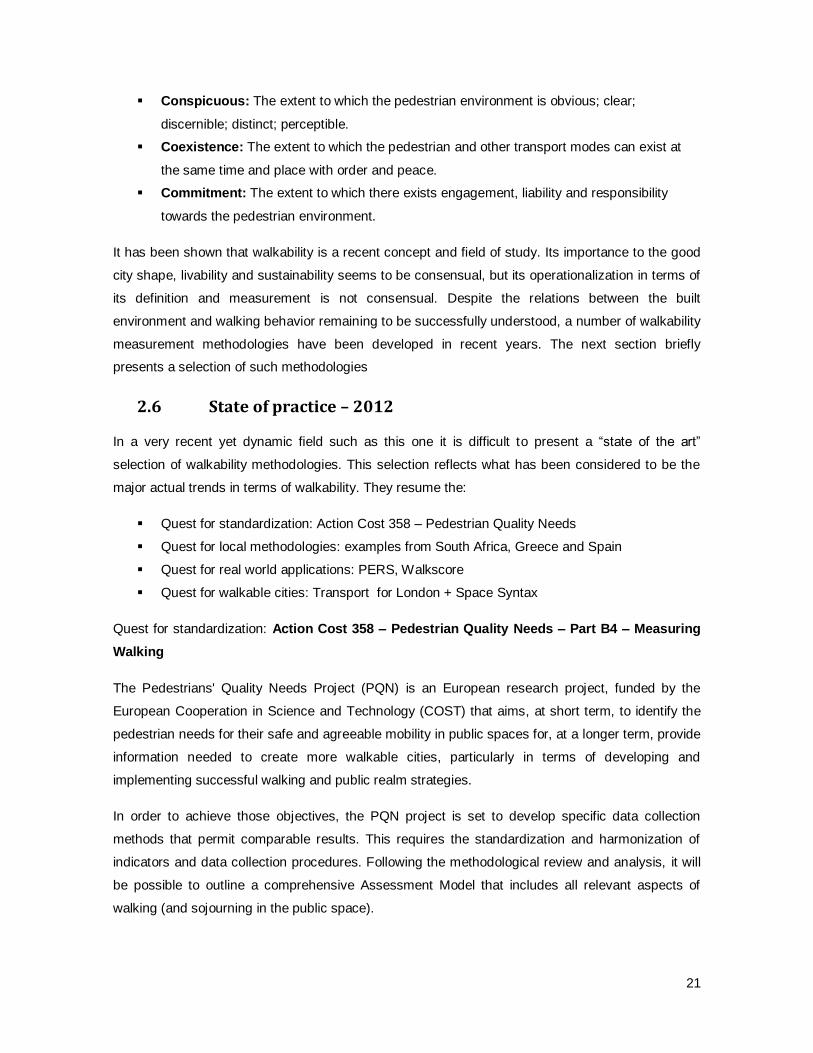
Figure 3: Walk score, internet application. .............................................................................................. 24
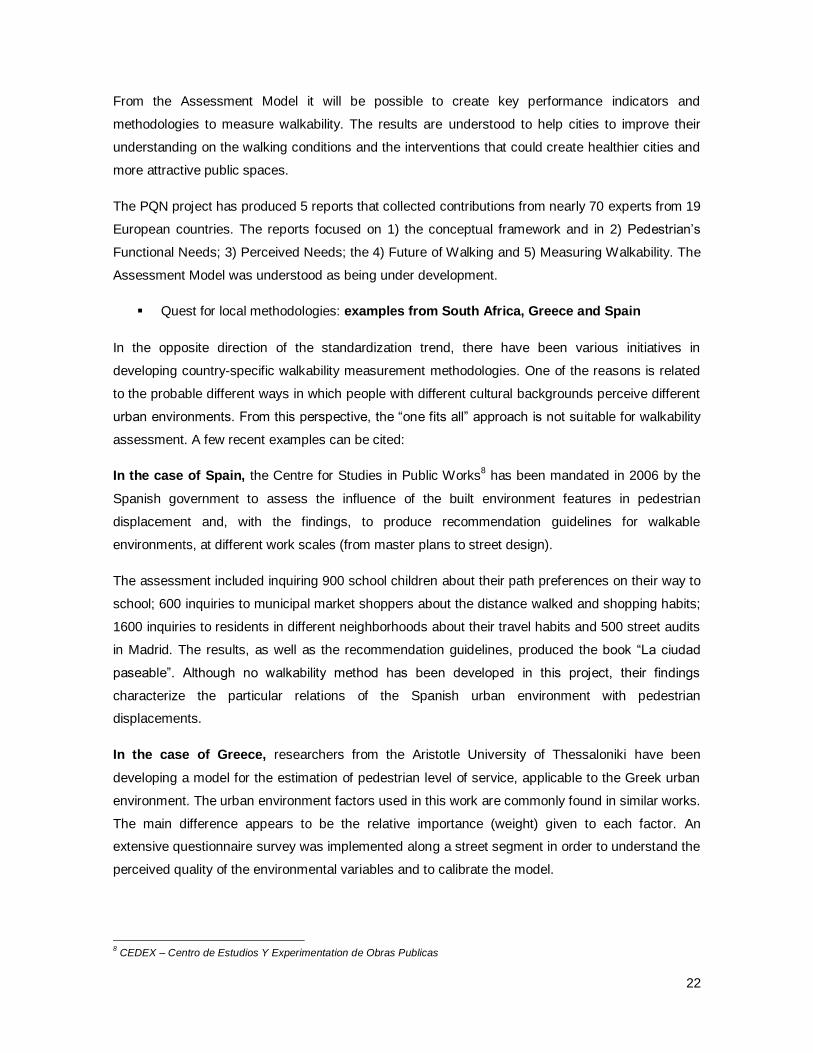
Figure 4: Walkonomics, internet application. ........................................................................................... 24
Figure 5: London axial map for integrated pedestrian movement analysis ............................................... 25
Figure 6: Table of walkability measurement areas of concern and key concerns ..................................... 46
Figure 7: Global scale walkability assessment – Lisbon case study ........................................................ 62
Figure 8: Walkability potential scores – Lisbon case study ...................................................................... 63
Figure 9: Correlation between walkability potential scores and commuter trips done on foot and by public
transport ................................................................................................................................................ 64
Figure 10 : Correlation between walkability potential scores and pedestrian commuter trips ................... 65
vii
Figure 11: Correlation between walkability potential scores and commuter trips done on foot – highest and
lowest 10 walkability potential ranks ....................................................................................................... 65
Figure 12: Bairro Alto study area ............................................................................................................ 66
Figure 13:Micro scale path case study ................................................................................................... 68
Figure 14: Micro scale walkability assessment - Segment and Path score – Bairro Alto case study ......... 69
Figure 15: Micro scale walkability assessment – output examples – Bairro Alto case study..................... 70
Figure 16: Scale mix issue ..................................................................................................................... 75
Figure 17: Value function (normalization expressions) for macro scale ................................................. 112
Figure 18: Value function for micro scale .............................................................................................. 112
Figure 19: Street network, pedestrian network and intersection nodes .................................................. 112
Table index
Table 1: Causal roles of built environment (adapted from Handy 2005) .................................................. 33
Table 2 :Walkability indicators related to the Connectivity and Conspicuous dimensions ......................... 35
Table 3: Walkability indicators related to the Convenience dimension ..................................................... 36
Table 4: Walkability indicators related to the Comfort and Conviviality dimension ................................... 37
Table 5: Walkability indicators related to the Coexintence and Commitment dimensions ......................... 38
Table 6: Global scale key family of key concerns and elementary viewpoints.......................................... 46
Table 7: Macro scale key family of key concerns and elementary viewpoints .......................................... 46
Table 8: Meso scale key family of key concerns and elementary viewpoints ........................................... 46
Table 9: Micro scale family of key concerns and elementary viewpoints ................................................. 47
Table 10 : Walkability index .................................................................................................................... 50
Table 11: Potential walkability indicator .................................................................................................. 51
Table 12: Macro scale descriptors, thresholds and normalization............................................................ 52
Table 13: Micro scale descriptors and tresholds ..................................................................................... 54
Table 14: Macro scale weight factors ..................................................................................................... 56
Table 15: Micro scale weight factors....................................................................................................... 56
Table 16: Bairro Alto Macro Walkability assessment ............................................................................... 67
1
1 . Introduction
Today walking matters.
Walking is the elementary mean of people getting around and reaching destinations, of integrating
and living the urban space, of accomplishing essential and salutary physical activity.
Walking has been associated with many benefits, ranging from reducing air pollution, traffic
congestion and resource consumption to solving obesity and other health problems. (Park 2008) It
has been regarded as an essential factor in the creation of “livable communities”, encouraging
neighborly interactions and making the urban environment a more enjoyable and safer place to live
(Emery and Crump 2003).
With such associated benefits, one of the most critical questions to be asked is how to encourage
people to walk. This question has been particularly addressed to urban planners in terms of the
contribution of the urban built environment in encouraging and promoting walking. From one
perspective, the relation of the built environment with walking behavior has been mostly intuitive, as
there has been little scientific evidence in supporting the extent and intensity of such relation (Park
2008). From another point of view, research has provided sufficient evidence on the link between
built environment and walking (Handy 2005), and focus should be set in identifying and assessing
the built environment attributes that make up a pedestrian friendly environment.
Walkability has been recently introduced as a concept that translates the extent to which the urban
environment is pedestrian friendly (Abley and Turner 2011). By assessing (or measuring) it,
planning professionals may be able to address the quality of the pedestrian environment, what may
facilitate the progress towards more integrated, appealing and walking conductive cities, towards
more sustainable cities.
The objective of this work is to find suitable pedestrian accessibility and attractiveness indicators
for walkability assessment.
This research’s object is composed by:
The understanding of the link between the built environment and walking behavior;
The identification of the relevant environmental features in defining pedestrian friendly
environments;
The comprehension of walkability metrics and assessment techniques;
2
The research’s motivations are drawn from the urbanism and territorial planning fields. They are
related to the perceived importance of:
Benchmarking and monitoring of pedestrian accessibility conditions;
Decision aid factual information for policy makers (for prioritizing interventions, for
comparison of alternatives, etc.);
Cost effective, operational analysis frameworks (for implementation at the resource scarce
Portuguese municipal context)
In order to frame the object according to the motivations in achieving the objective, the following
methodological steps are taken:
1) Literature review, focusing at a first stage in the understanding of the factors influencing
walking behavior, at a second stage in defining the walkability concepts and at a third stage
in collecting existing walkability measurement tools, models and indicators;
2) Walkability measurement appreciation, focusing in the suitability of existing
methodologies in achieving this research’s proposed objective;
3) Conceptual development of a walkability assessment model suitable for use at municipal
planning offices (therefore mainly operational).
4) Operational development of the model, concerning its structure and formulations;
5) Testing of the model, with application in real world cases;
6) Validation and discussion of the obtained results
This research report consists of the following sections:
First, in chapter 2, an extended introduction to the relevance of the subject is presented (2.1 ),
framing the possible relations between the built environment and walking (2.2 ;2.3 ) and the
contribution of different research fields to the subject (2.3 ). Next, factors believed to influence
walking are addressed, with emphasis in particular built environment correlates (2.4 ). The
walkability concept is then presented (2.5 ), together with a brief state of the arte in walkability
measurement approaches (2.6 ).
Chapter 3 deals mainly with the reviewing and appreciation of walkability measurement techniques
and models. The importance of walkability assessment is introduced (3.1 ), followed by a brief
review and appreciation of existing walkability assessment methods (3.2 ), identifying current
methodological and operational issues (3.3 ).
The development of a method for walkability assessment is presented in chapter 4. It comprises
several stages, being defined in first place its conceptual framework (4.1 ). Multi Criteria Decision
Analysis (MCDA) techniques are used in the structuring stage of the model (4.2 ) which contributes
3
to a comprehensive selection and definition of indicators (4.2.2). The next stage consists in
developing the formulations needed to perform the walkability assessment (4.3 ), for each one of
the considered work scales – the global, macro, meso and micro scales- (4.3.1, 4.3.2, 4.3.3,4.3.4 ),
and includes the weighting of the assessment components (4.3.5). Finally the implementation stage
in GIS is overviewed (4.4 ) with reference to concerns on model calibration and validation.(4.4.1)
The model application in case studies is described in chapter 5. There are three case studies, one
for the global scale of analysis (city of Lisbon, 5.1 ); one for the macro scale analysis (Bairro Alto
quarter, 5.2 ) and one for the micro scale analysis (5.3 set of streets from Bairro Alto).
Chapter 6 discusses the obtained results, addressing its validation, validity, limitations and
applicability (6.1 ). Future developments of the research are suggested (6.2 ) as well as a brief set
of concluding remarks (6.3 ).
4
2 . The Walk
“Walking is the first thing an infant wants to do and the last thing an old person wants to give up.
Walking is the exercise that does not need a gym. It is the prescription without medicine, the weight control
without diet, and the cosmetic that can’t be found in a chemist.
It is the tranquillizer without a pill, the therapy without a psychoanalyst, and the holiday that does not cost a
penny.
What’s more, it does not pollute, consumes few natural resources and is highly efficient.
Walking is convenient, it needs no special equipment, is self-regulating and inherently safe.
Walking is as natural as breathing. “
John Butcher, Founder Walk21, 19991
These lines from the international charter for walking have covered many benefits of walking for the
individual. Walking is the most natural human way of getting around and while doing it the human
body exercises both physically and mentally.
Walking has even greater benefits at the community level, providing both a social and a spatial
interaction. Cities have grown in population and size but somewhere along the line the pedestrian
was tagged as a second class street user and people forgot how to walk and why to walk. On the
urban sustainability debate, the role of walking is unavoidable.
Today walking is again in the agenda, and today walking matters.
The next section introduces the importance of walking in terms of urban sustainability, bringing up
its social, environmental and economic benefits. The sections following briefly introduce the factors
believed to influence walking behavior, focusing on the link between the built environment and
walking. Next the walkability concept is presented, together with an overview of the recent
walkability measurement methods.
2.1 Why walk
Every trip begins and ends with a walking trip, and everyone is a pedestrian at least for a part of its
journey. Walking is often the only way that many people can access everyday activities, yet, the
streets and public spaces, once meant for pedestrians, struggle with degradation and invasion from
private vehicles, with the social live being drawn away from them (Ghidini 2011) (Krambeck and
1 In International charter for walking
5
Shah 2006) (Abley and Turner 2011). Walking is “the foundation of the sustainable city” providing
social, environmental and economic benefits. (Forsyth and Southworth 2008),
From the social point of view, walking can be seen as the most equitable mean of transportation, as
it is cheap, and it needs only basic infrastructure. Walkable environments have been associated
with more democratic and “civilized cities”, since pedestrian facilities can provide accessibility
benefits to a greater portion of the community when compared to road or rail improvements (Lo
2009). These benefits are extended not only in terms of population figures but also across classes,
including children and seniors, and low income groups who are disqualified from owning or
operating automobiles. (Forsyth and Southworth 2008).
Walking also brings life to streets and livable streets contribute to safer urban environments. The
contribute of walking to community safety, accessibility and social inclusion has emerged as a
particular challenge to the design of the urban environment (Evans 2009), as over the past century
pedestrian access has declined steadily in most cities (Forsyth and Southworth 2008).
From the environmental point of view, walking is a “green” mode of transport, as it has low
environmental impact, without air and noise pollution. The presence of walkable environments and
transit systems may create alternatives to private car usage, thus reducing traffic congestion, noise
and emissions.
Looking at the economic perspective, for the pedestrian walking has a little cost associated. In
general terms, it can be associated with less energy and resources consumption when compared to
other means of transport. Other economic benefits include thrive of local businesses such as street
shopping and tourism and, at a larger scale, public health savings.
Many recent health studies have demonstrated that walking can promote mental and physical
health, including cardio-vascular fitness and reduced stress (Forsyth and Southworth 2008),
constituting a moderate intensity physical activity. Several countries’ public health officials have
adopted, over the last years, guidelines to encourage people to accumulate at least 30 minutes of
moderate physical activity on preferably all days of the week, but it has been observed that a large
proportion (30-60%) of the population maintains a sedentary lifestyle (Bourdeaudhuij et al. 2005).
The consequences of such sedentary lifestyle have been acknowledged by the World Health
Organization (WHO), stating the sedentary lifestyle not only as a disease but as “the scourge of the
XXI century” (Weil 2009).
In this context, the recent Portuguese figures related to walking have been alarming. A recent study
by the European Environmental Agency2 has revealed that the average walked distance per year
was approx. 342 kms, in contrast with the 457 kms walked per person per year in Luxemburg and
2 In Diário de Notícias, 6 March 2008
6
the 382 kms of the European average. These figures mean that in average a Portuguese walks less
than 15 minutes per day, half of what has been considered to be adequate in combating the
sedentary lifestyle. Previous studies have also shown that Portugal had relatively low levels of
physical activity in terms of vigorous activities but nearly half of the population reported moderate
activities and walking (Bourdeaudhuij et al. 2005). In fact, in terms of walking as a daily means of
transport, Portuguese figures are within the European average.
Looking at the daily commuting patterns registered in Portugal, in 20013, it can be seen that a
approx. a quarter of the trips are done on foot. Values for the city of Lisbon are slightly lower (21%)
than the national average (25%). When compared to other European countries, this value can be
considered quite acceptable, being consistent with the travel patters observed in Holland (22% trips
done on foot), Sweden (23%), Germany (23%) and the UK (24%), being slightly higher than France
(19%) and Belgium (16%).
Switzerland registers the highest proportion of pedestrian commuting (45%) whilst new world
countries register low pedestrian commuting: USA – 9%; Canada – 7% and Australia 5%.(Bassett
Jr et al. 2008) In these countries in particular, walking has being considered as a mean to fight the
sedentary lifestyle, and the concept of walkable neighborhoods has been receiving an increasing
amount of attention (Moudon et al. 2006).
3 Source: www.ine.pt
7
2.2 Walk and the city - What influences people to walk
Walking is a fundamental means of transport for everyone, as the disabled people are also
considered pedestrians with reduced mobility. And, to most people, their human body has all-terrain
characteristics in the way that it can face slopes, stairs, irregular surfaces and various weather
conditions (Allan 2001).
There are, however, limitations to these characteristics. Stamina has been considered to be the
most influent limitation, as the person’s fitness diminishes as fatigue increases. This means that the
person’s initial speed will drop over time, making long distances difficult to bear. For instance, a
steady speed of 6km/h can be maintained by a walker for 20 minutes, declining to 5 km/h over 30
minutes and dropping to 4 km/h over an hour (Allan 2001).
The main practical (physical) limitations to walking as transportation are then related with the
distance needed to walk, or, in the other hand, with the time needed to walk those distances, with
walking performance also being compromised by adverse weather conditions (heat, rain, snow).
Over short distances walking has been regarded as the most attractive means of transport and
research has shown that almost 80% of people are willing to walk up to half mile (nearly 800m) to
reach their destinations (Emery and Crump 2003) (Allan 2001).
In the urban context, many other factors have been considered to be limitations or constraints to
walking (Handy 2005). Such factors include stressors, like crowding, noise, traffic congestion,
community violence and crime and physical features that reduce the sense of place. The safety
factor (as in fear of crime) has been frequently cited as the highest constraint to walking by the
more vulnerable groups and the people who rely more on walking (Evans 2009).
On the other hand, there have also been identified environmental factors that promote walking (as a
physical activity). These factors include the prevalence of recreational facilities, the community
cohesion and physical features that enhance imageability and legibility (Handy 2005).
Together with environmental factors, socioeconomic characteristics have also been widely known to
affect travel behavior (Handy 2005). Travel behavior theories have been useful in understanding
what influences people to walk and what do people value when they choose a particular path.
In travel behavior theory, as lined out by Handy (ibidem), utility maximization usually relates to the
minimization of monetary costs and/or travel time. Instead of monetary costs, the concept of
“Everywhere is walking distance if you have the time “
Steven Wright
8
generalized costs can be used, meaning cost is operationalized as a linear sum of attributes, each
with a weight reflecting its importance, and meaning that factors as “comfort” and “convenience” can
be included.
For walking it has been suggested that considering generalized cost factors as comfort and
convenience is probably more relevant than considering travel time or distance alone. And when
considering travel time or distance, the perceived time or distance may be more relevant to travel
choices than actual time and cost (Handy 2005).
The standard application of utility-maximization model in travel behavior has assumed that travelers
will minimize travel time in order to maximize utility, and, in this case, walking would be a travel
choice only if it could deliver shorter travel times compared to other means of transport. However
other positive utilities can be associated with walking (such as the enjoyment of walking itself, the
social interaction or the scenery interaction) that might add significantly to the utility of the walking
choice (Handy 2005).
Still other complexity layers have been added to the understanding of walking choices. The work by
Kahneman and others (Kahneman, Wakker et al. 1997 cit. Handy 2005) suggests that the
rationality of the choice is not always “rational”. The “remembered utility” is referred as being the
retrospective evaluation of a choice that can influence a future decision. In the case of inaccurate
retrospective evaluations, the remembered utility may lead to choices that do not maximize utility.
The experiments by Ratner and others (Ratner, Kahn et al. 1999 cit. Handy 2005) have shown that
individuals are willing to sacrifice the maximization of utility for the sake of variety. Or, in other
words, instead of selecting the option that maximizes utility at that moment, individuals may choose
a less-preferred alternative, gaining but a more favorable memory of the sequence of choices.
The theories of planned behavior, drawn from the field of psychology, have added yet other useful
insights in understanding and identifying factors that determine behavior. In this theory, it is the
individual’s beliefs –or perceptions- about the existence of such factors than explain behavior,
rather than their objective existence. This means that for walking, the perception of presence or
absence of sidewalks, presence or absence of traffic for instance, can facilitate or constrain a
behavior. Social norms also play an important role in this theory, especially when related to
choosing alternatives to automobile (like walking, biking or public transportation) (Handy 2005).
In terms of longer term choices, it can be admitted that the choice is influenced by a person’s
lifestyle. meaning that certain types of persons may choose to live and work in areas that suit their
lifestyles and resources, what is referred to as “self-selection”.(e Silva, Golob, and Goulias 2006). In
this case, persons who enjoy walking will opt to live in more walkable neighborhoods. On the other
hand, it can also be admitted that the environment affects choices, and, in this case, people who
live in walkable neighborhoods will choose to walk more often (Schmid 2006).
9
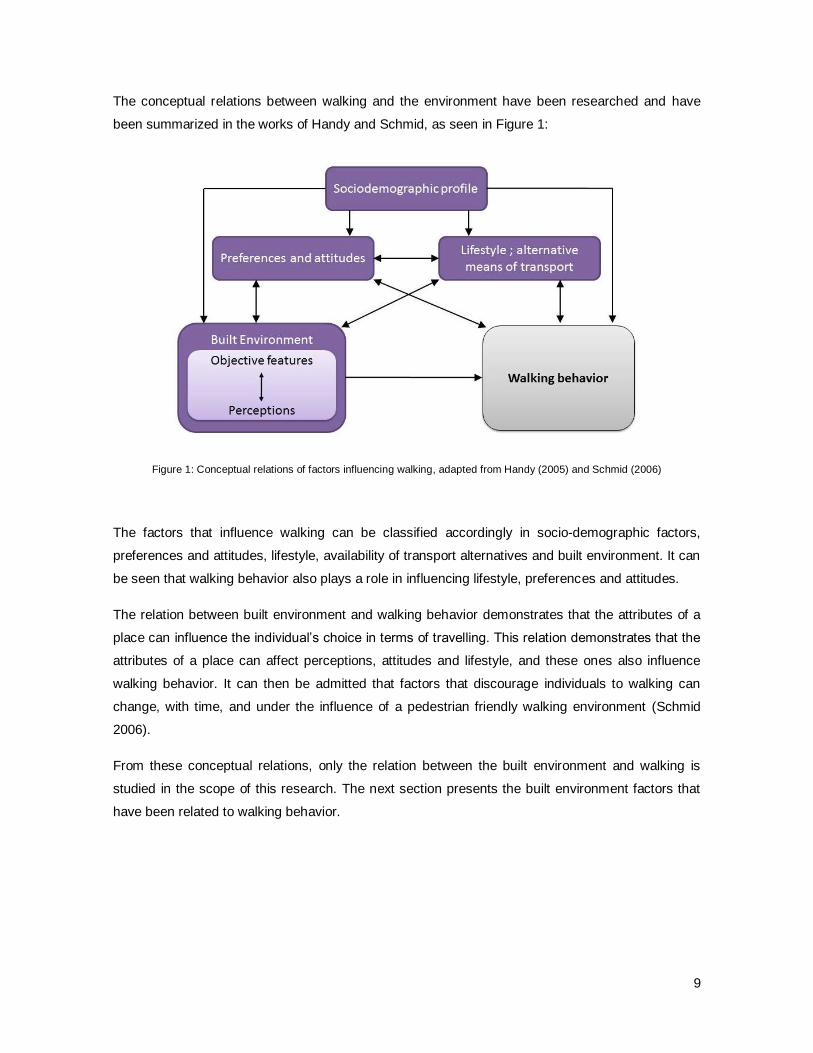
The conceptual relations between walking and the environment have been researched and have
been summarized in the works of Handy and Schmid, as seen in Figure 1:
Figure 1: Conceptual relations of factors influencing walking, adapted from Handy (2005) and Schmid (2006)
The factors that influence walking can be classified accordingly in socio-demographic factors,
preferences and attitudes, lifestyle, availability of transport alternatives and built environment. It can
be seen that walking behavior also plays a role in influencing lifestyle, preferences and attitudes.
The relation between built environment and walking behavior demonstrates that the attributes of a
place can influence the individual’s choice in terms of travelling. This relation demonstrates that the
attributes of a place can affect perceptions, attitudes and lifestyle, and these ones also influence
walking behavior. It can then be admitted that factors that discourage individuals to walking can
change, with time, and under the influence of a pedestrian friendly walking environment (Schmid
2006).
From these conceptual relations, only the relation between the built environment and walking is
studied in the scope of this research. The next section presents the built environment factors that
have been related to walking behavior.
10
2.3 The city and the walker –Built .Environment factors
influencing walking
To this point the distinction between types of walking has not been made. The general “walking”
can be defined as being walking for transport, exercise or pleasure/recreation. This distinction is of
relevance because the attributes of the urban environment that influence walking behavior have
been considered to be different when relating to walking for transport or walking for
exercise/recreation (Leslie et al. 2007).
In walking for transport, or utilitarian, walking becomes a mean of reaching a destination, being it a
resource, activity or function, like going to school or to work, shopping, meeting friends, etc. In
walking for pleasure or recreation, walking becomes an end on its own, being for exercise, for
relaxing, for contemplation, etc. Although the latter is considered to be of greater importance in
terms of physical activity, mobility studies have always paid more attention to the utilitarian walking
than to the recreational walking (Schmid 2006).
Also to this point the concept of built environment has not been presented. There have been many
interpretations of “built environment”, and the lack of an agreed-upon conceptualization of the term
has been an apparent cause to the inconsistent approach to defining and measuring dimensions of
the built environment (Handy 2005).
The “built environment” concept this research has followed has been the one used by Cervero,
defined as “the physical features of the urban landscape (i.e. alterations to the natural landscape)
that collectively define the public realm, which might be as modest as a sidewalk or an in-
neighborhood retail shop or as large as a new town.” (Cervero and Kockelman 1997).
As with the different types of walking, at each spatial scale, different characteristics of the built
environment are more or less relevant, and the influence of the built environment on physical
activity at one spatial scale may depend on the influence of the built environment at another spatial
scale (Handy 2005).
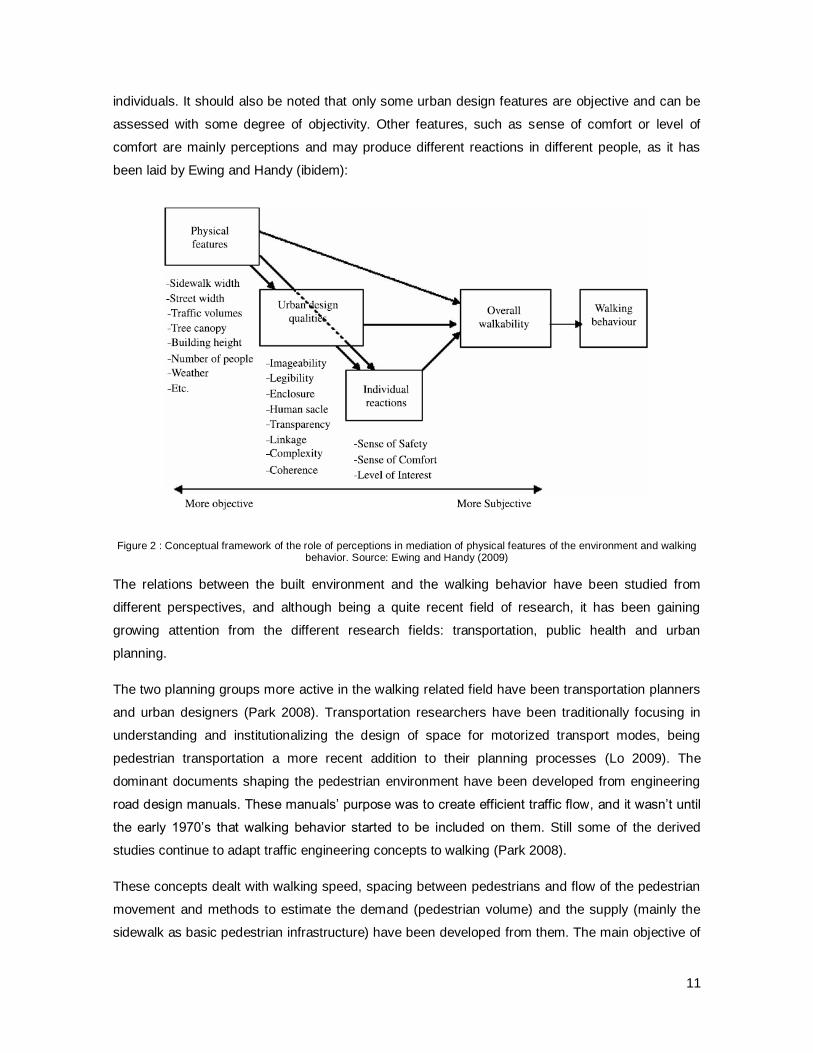
According to the conceptual diagram presented in Figure 1, the built environment has been split into
2 different dimensions – the objective and the perceived.
Perception has been defined, in urban planning literature, as the process of attaining awareness of
understanding of sensory information. What is perceived results from “interplays between past
experiences, one’s culture and the interpretation of the perceived” (Ewing and Handy 2009).
It should be then noted that physical, objective, features of the environment influence the quality of
the walking environment both directly and indirectly through the perceptions and sensitivities of the
11
individuals. It should also be noted that only some urban design features are objective and can be
assessed with some degree of objectivity. Other features, such as sense of comfort or level of
comfort are mainly perceptions and may produce different reactions in different people, as it has
been laid by Ewing and Handy (ibidem):
Figure 2 : Conceptual framework of the role of perceptions in mediation of physical features of the environment and walking behavior. Source: Ewing and Handy (2009)
The relations between the built environment and the walking behavior have been studied from
different perspectives, and although being a quite recent field of research, it has been gaining
growing attention from the different research fields: transportation, public health and urban
planning.
The two planning groups more active in the walking related field have been transportation planners
and urban designers (Park 2008). Transportation researchers have been traditionally focusing in
understanding and institutionalizing the design of space for motorized transport modes, being
pedestrian transportation a more recent addition to their planning processes (Lo 2009). The
dominant documents shaping the pedestrian environment have been developed from engineering
road design manuals. These manuals’ purpose was to create efficient traffic flow, and it wasn’t until
the early 1970’s that walking behavior started to be included on them. Still some of the derived
studies continue to adapt traffic engineering concepts to walking (Park 2008).
These concepts dealt with walking speed, spacing between pedestrians and flow of the pedestrian
movement and methods to estimate the demand (pedestrian volume) and the supply (mainly the
sidewalk as basic pedestrian infrastructure) have been developed from them. The main objective of
12
these methods was to obtain an optimum level-of-service (LOS), accomplished with unobstructed
pedestrian movement, or, in other words, to design a sidewalk wide enough to provide unobstructed
movement for a given number of pedestrians (Park 2008).
Concerns towards biased motorized transport modes have introduced pedestrian planning
guidelines in the HCM 20004, providing methods for grading the pedestrian infrastructure in terms of
LOS and allowing the comparison between the performances of pedestrian facilities and other
transportation facilities. (Lo 2009). However, this approach has had some criticism from the urban
planning point of view, since “it reflects a gross lack of understanding about the difference between
vehicles and people. The standard treats pedestrians as atomistic and antisocial entities.” (Lo
2009). This means in practice that busy pedestrian sidewalks in the city centers can be rated with a
lower mark than empty sidewalks in industrial areas. Additionally, the presence of other people has
been considered by these guidelines as sources of potential conflict, whilst being regarded has a
sign of street vitality in the urban planning literature.
The urban design literature relating to walking has been largely inspired from the work by Jane
Jacobs in the early 1960’s In this field, the questions have been addressed to the quality and the
enjoyment of walking rather than the efficiency of traffic flow. For that purpose more subjective
aspects of walking, such as visual interest, complexity or human scale have been looked at (Jacobs
1961). Other pedestrians have been considered, in this field, as attractors instead of conflicts, as
they increase the general sense of security.
In the following years, other seminal authors from the urban planning theory developed work on the
pedestrian environment, such as Kevin Lynch, Gordon Cullen, Jan Gehl and Donald Appleyard.
The latter’s research related street traffic with social interaction, finding that fast moving
automobiles discouraged social interaction and street activities, decreasing the neighborhood
livability (Park 2008).
The qualities of the built environment that have been suggested from the urban planning and design
literature as more relevant to walking include (Handy 2005):
Legibility: the ease with the spatial structure can be understood and navigated as a whole;
Imageability: The quality of a place that makes it distinct, recognizable and memorable;
Enclosure: The degree to which streets and other public spaces are visually defined by
buildings, trees, walls and other elements;
Human scale: a size, texture, and articulation of physical elements that match the size and
proportions of humans and, equally important, the speed at which humans walk;
4 Transport Research Board – Highway Capacity Manual
13
Transparency: the degree to which people can see or perceive what lies beyond the edge
of a street or other public space and, more specifically, the degree to which people can see
or perceive human activity beyond the edge of a street or other public space;
Linkage: Physical and visual connections from building to street, building to building, space
to space, or one side of the street to the other;
Coherence: A sense of visual order;
Complexity: The visual richness of a place;
More objective characteristics have been pointed out by Appleyard and Gehl and include traffic
levels, slope, vegetation, barriers, parking, services and amenities (Appleyard 1981, Gehl 1986 cit.
Handy 2005)
The approaches from the urban theorists also have had some degree of criticism. Urban design
researches and observations have been the base for urban planning guidelines but there has been
little effort into developing objective ways of measuring the walking environment and testing those
observations and intuitions. They have been sometimes considered as “just suggestions” thus
being less influential than engineer’s road design manuals in shaping the urban form. (Park
2008)(Lo 2009).
Finally, in the field of public health, the role of the built environment has been studied as a basis
for physical activity promotion in general, not focusing in walking in particular. However, this field’s
research was in some ways better situated in addressing the built environment’s role in explaining
physical activity. In this field, behavioral theory has been the basis for the research and the primary
goal has been to understand behavior, being then able to derive effective ways of changing it
(Handy 2005).
Also, the built environment study has emerged as a high priority for public health given that the
more prevalent obesity and cardiovascular conditions occur in areas where land use and urban
pattern makes it difficult to walk to destinations. (Frank et al. 2005).
The public health field has been researching actively the environmental variables correlated to
physical activity (where walking is included) and has contributed greatly to the finding that built
environment does affect walking behavior.
Transportation and urban planning studies also have provided evidence that urban features and
transportation systems are related to walking behavior. And researchers in both public health and
the urban planning and transportation fields have highlighted the importance of using objective
measures to help better understand the relations between the environmental attributes and the
walking behaviors (Leslie et al. 2007)
14
In any of the cases, the interest in the role of the built environment in explaining walking behavior
has been relatively recent (Handy 2005), but the existing studies documenting these associations
have been considered sufficient to consider transportation and urban planning as critical public
health issues (Frank et al. 2005).
The next section presents briefly the built environment features that have been considered as the
most consensual and influent in the literature.
2.4 Built environment correlates
It has been cited in the previous sections6 that distance is one of the key physical constraints to
walking as a transport mode. Using common sense for a moment, it can be understood that the
spatial arrangement of the physical elements of a given urban area determine the distance (or the
proximity) of the trip. One key element of the urban pattern that has a major influence in the
distances between origins and destinations is density. Density can be defined as the number of a
given entity in a defined area and several types do density are usually used in urban analysis:
population density, housing density, employment density, etc.
It can be admitted that to a high population density is usually associated an equally high density of
physical structures (buildings, infrastructures, amenities) where activities and functions take place.
In this case, because there is a great number of potential origins and destinations in the same area,
the trip distance can be lower, affecting modal choice.(Frank and Pivo 1994)
Another factor that can influence the proximity between origin and destination is the spatial
distribution of the activities in the urban fabric. Functional mix can be understood as the extent to
which a given area hosts different types of activities and functions (commerce, services, houses). If
the area hosts a single type of activity, accessing other types of activities and functions will imply an
increased effort as it will be needed to reach other area. On the other hand, an area that hosts
diverse (but compatible) activities and functions can reduce the travel effort, given that there is no
need of reaching other area. (Schmid 2006)
Density and Diversity have been complemented with Design in Cervero’s seminal work on the
relation between built environment and travel patterns. His research in S.Francisco’s Bay Area has
found that density, land-use diversity and pedestrian oriented designs were able to generally reduce
trip rates and influence travel mode choice, favoring non-motorized transport. These results were
considered statistically significant but only with a “fairly marginal” influence. The elasticities between
built environment dimensions and travel demand have been considered “modest to moderate” but
“certainly not inconsequential”. (Cervero and Kockelman 1997). These findings were supportive of
6 See section 2.2
15
the “New Urbanism” movement, which arose in the United States in the early 1980’s, advocating for
the creation of mixed-use, compact and walkable neighborhoods.
These finding have been widely accepted as relating positively three main dimensions of the built
environment – density, diversity and design – with walking behavior. Having a diversity of options
(destinations or opportunities) within a walking range can be translated into having good pedestrian
accessibility, as accessibility can be defined as the ease in accessing an opportunity (as a
synonym for and activity, function, destination, etc).
But choosing walking as transport mode does not have accessibility as only concern. It also
depends on the attractiveness of the built environment, as it is perceived along the way. The
attractiveness of the built environment has been largely related to the urban design. Given the fact
that a pedestrian moves at a relative slow speed, it can absorb the environment with all his senses.
In opposition to drivers, the pedestrian has the capacity to observe and perceive a great number of
visual and architectural details. The attractiveness of the built environment has also been related to
the quality of the pedestrian infrastructure, to the presence of amenities, to the presence of hostile
traffic, among others (Schmid 2006).
The major role of accessibility and attractiveness has been also addressed in the works by Handy
and others (Handy 2005). According to this author, models of destination choice using the utility
maximizing framework describe both the activities found in different locations as well as the quality
of the links between activity locations, that is to say, the combined effect of land use patterns and
the transportation system. Such combined effect equates to concept of accessibility, defined as
reflecting both the ease of reaching potential destinations (an “impedance” factor) and the nature of
the opportunities for activity found there. It can be possible to include a wide variety of
characteristics of both land use patterns and of the transportation system in one composite
measure by expanding the concepts of “impedance” and attractiveness” (Handy 2005).
Other built environment features that have been widely accepted as relevant to influence the choice
to walk include proximity and connectivity (Saelens, Sallis and Frank 2003, cit. Leslie et al. 2007). In
these studies, proximity has been also defined as a broad concept, reflecting land use density and
land use mix (also understood as density and diversity). Connectivity has here been defined as the
directness of routes between households, stores and workplaces, being walking facilitated where
interconnecting streets exist.
The presence of retail activities have been shown to be also a significant inducer of choosing
walking as a transport mode (in connection to transit), as the presence of convenience and grocery
stores near residences would encourage transit commuting by allowing workers to shop en-route
while returning to their homes (Cervero and Kockelman 1997).
16
Being the public health field the most active in researching this subject, it has been the source for
identifying correlations between the built environment and physical activity. Nevertheless walking is
a form of physical activity in the urban space and therefore the correlations drawn from the public
health field have been accepted in walkability studies.
Perhaps the most complete assessment of built environment correlates to physical activity has been
the work by Handy (Handy 2005) in which 50 studies from the travel behavior literature and from the
physical activity literature have been examined. The reviewed studies have proven convincing
evidence of a link between the built environment and physical activity but provided less
convincing evidence of what built environment features were most associated with physical activity
and a firm causal relationship could not be established. Certain patterns have however been
observed, tending to suggest specific relationships between the built environment and physical
activity, namely:
Accessibility, measured in various ways, emerges most clearly from both literatures as a
strong correlate of away-from-home physical activity;
The importance of design variables in explaining active travel or physical activity was
somewhat more ambiguous, in both literatures;
Design may prove more important for other physical activity than for active travel and
distance more important than design for active travel;
Individual and interpersonal factors are potentially more important than the built
environment in explaining physical activity;
Supportive built environment is not enough on its own to ensure physical activity but it does
facilitate physical activity.
It has been shown, with this concluding set of remarks, that the relations between built
environment and physical activity (that includes walking for recreation and walking for active
travel) are not consensual. Evidence has been produced in proving such relations but the extent
to which the built environment does, in fact, influence travel behavior in terms of encouraging or
deterring walking is still unclear.
Urban design variables have been found to be ambiguous in the review studies and its importance
for travel choices has been questioned, especially when compared to other macro factors. A study
across a number of U.S. cities (Cervero 1993 cit Cervero and Kockelman 1997) has concluded that
“‘micro-design elements are too ‘micro’ to exert any fundamental influences on travel behavior;
more macro factors, like density and the comparative cost of transit vs. automobile travel, are the
principal determinants of commuting choices.” (Cervero and Kockelman 1997).
It has also been shown that finding the particular attributes of the built environment that might be
more important in influencing walking remains a challenge. One factor that contributes to this
17
challenge has been identified as the colinearity between the environmental attributes like
neighborhood densities, mixed land use and pedestrian amenities (Cervero and Kockelman 1997),
as the observed denser neighborhoods tend to have a greater variety of land uses and a suitable
pedestrian network.
The same challenge has been referred by Frank (Frank 2003, cit. Schmid 2006), observing that the
urban environment tends to be organized and structured. As a result, many of the attributes that
can influence walking appear usually spatially connected, being this phenomenon referred to as
“spatial multicollinearity”. Such “spatial multicollinearity” has suggested that some of the relations
between the built environment and walking are, in fact, complementary. For this reason the
interpretation of the relative contribution of each factor may result extremely challenging (Schmid
2006)(Frank et al. 2005).
The use of a composite index has been suggested as providing a better estimation of the factors’
effects. Using such method, the combination of inter-related variables could provide an useful tool
for “explaining to planning professionals and policymakers that multiple design variables need to be
considered simultaneously in creating ‘active-friendly’ communities” (Frank et al. 2005). Moreover,
trying to measure the influence of a single element of the built environment in travelling patterns has
said to be “fruitless”, given the observed high multicolinearity and statistical interaction of built
environment variables (Cervero and Kockelman 1997). However, using larger sets of variables in
order to contour this issue has been questioned as their statistical significance may be proven
insufficient. In fact, measurement was believed to remain imperfect regardless of the number of
variables used to capture elements of the built environment (Cervero and Kockelman 1997).
Not only have the variables been found to be related, thus making its individual interpretation more
complex, but their relation can be said to assume different interaction types. Usually three
interaction types are identified: the additive, where the combined effect equals the sum of effects;
the antagonist, where the combined effect is less than the sum of effects and the synergy, where
the combined effects are greater the its sum (Bana e Costa and Beinat 2010).
The latter has been believed to be in relation with the built environment factors, as pointed out by
Cervero: “Higher densities, diverse land uses and pedestrian friendly designs, we believe, must co-
exist to a certain degree if meaningful transportation benefits are to accrue. Having nice sidewalks,
attractive landscaping, and other pedestrian amenities in a low-density, residential only
neighborhood is unlikely to prompt many residents to walk to shops and stores. However, the
synergy of the 3 Ds in combination is likely to yield more appreciable impacts.“ (Cervero and
Kockelman 1997).
Built environment correlates to walking behavior (and to physical activity in general) have been
proven to exist and to be object of study by many research fields. Being a recent and complex
18
subject, results are to be handled cautiously, as the relations’ effect on walking are often only
moderated and in ways that are not still fully understood.
The sole evidence of the connection between built environment and walking (or even its
assumption) has led to a field of work specifically interested in assessing and measuring that
connection, has led to the walkability research.
In the next section the walkability concept is presented, followed by a brief review of recent
walkability methodologies in use.
2.5 Walkability concept
“Walkability” has been probably brought to the debate by Chris Bradshaw in 1993. Following a
property tax raise in Ottawa (1992) in connection to road infrastructure improvements, land owners
and local shop owners argued that most people in their neighborhood walked in their daily trips
instead of driving. Because they walked instead of driving, they had less need for the road
infrastructure expansion and therefore should not pay extra tax(Ghidini 2011)(Bradshaw 1993).
Bradhsaw, at the time a city planner expert, has then proposed an index to rate the “walkability” of
the neighborhoods. Such index could be used to calculate the tax rates applicable to each
neighborhood. It could also prove itself useful for homebuyers, providing a reading on the walking
conditions of a neighborhood that included the assessment of the local safety conditions, and transit
coverage. (Ghidini 2011)(Bradshaw 1993).
From a conceptual point of view, walkability was then defined as a “quality of place” which had 4
basic characteristics (Bradshaw 1993):
A "foot-friendly" man-made, physical micro-environment: wide. leveled sidewalks, small
intersections, narrow streets, lots of litter containers, good lighting, and an absence of
obstructions;
A full range of useful, active destinations within walking distance: shops, services,
employment, professional offices, recreation, libraries, etc;
A natural environment that moderates the extremes of weather- wind, rain, sunlight - while
providing the refreshment of the absence of man's overuse. It has no excessive noise, air
pollution, or the dirt, stains, and grime of motor traffic;
A local culture that is social and diverse. This increases contact between people and the
conditions for social and economic commerce.
Its assessment it was suggested a qualitative ranking of 1 (best situation) to 4 (worst situation) in 10
different categories, which were in fact very different in terms of their nature. They included the
population density; the number of parking places; the chances of meeting someone while walking;
19
the age at which a child would be allowed to walk alone; the women's rating of neighborhood safety;
the responsiveness of transit service; the number of neighborhood "places of significance"; the area
covered by parks and the sidewalk availability. The final score should be divided by 20, producing
an index between 0,45 (best) and 2,00 (worst).
From this seminal attempt in defining and measuring walkability, many researchers have been
“grappling with the concept of walkability – what is it, how to measure it and what it might mean for
the design of the cities” (Forsyth and Southworth 2008). The terms “walkability” and “walkable” have
become common in the fields of urban planning, transport engineering and public health as the
benefits of walkable urban areas have become recognized as having benefits for the social, health
and economic well-being of a society(Abley and Turner 2011). Despite having emerged as a
popular topic in forums related to transportation and urban planning there has been a generalized
lack of consensus on the meaning of walkability. A wide range of actors have been involved in
pursuing the evaluation of the relations between the urban environment and the pedestrian
behavior, and all have a different definition on how to measure walkability (Lo 2009).
The walkability of a community has been conceptualized as “the extent to which characteristics of
the built environment and land use may or may not be conductive to residents in the area walking
for either leisure, exercise or recreation, to access services, or to travel to work” (Leslie et al. 2007),
or in simpler terms, “the extent to which the built environment is walking friendly” (Abley and
Turner 2011). The latter definition is used in the scope of this research, implying the clarification of
what can constitute a “walking friendly” environment.
This question has been addressed in the work by Transport for London (cit (COST 358 2010),
where the pedestrian concerns and needs were classified under 5 main factors. These factors
have been referred to as the 5Cs and have been considered in accordance to the concept of
walkability. The five “Cs” are here defined in succession ((COST 358 2010):
Connected: The extent to which the pedestrian network links to key trip origins and
destinations, as well as the extent of linkages between different routes on the network;
Convivial: The extent to which walking is a pleasant activity, in terms of interaction with
people, the built and natural environment, and other road users;
Conspicuous: The extent to which walking routes and public spaces feel safe and inviting
for pedestrians, in terms of clear and legible signing and information;
Comfortable: The extent to which walking is accommodated to competences and abilities
of all types of pedestrians;
Convenient: The extent to which walking is possible and able to compete with other modes
of transport in terms of efficiency (time, money and space).
20
In the scope of this research, the above definitions have been adapted to meet the dictionary’s
definitions and have been added two other dimensions – coexistence and commitment.
Coexistence: motorized vehicles (automobiles in particular) have been pointed has a major factor
contributing for less people walking in the cities. Their role in influencing the attitude towards
walking is felt at different levels. First, cars (and motorized vehicles in general) need space to
circulate. The motorized network has gained the once pedestrian territory of cities, taking over
public space and streets and segregating the pedestrian. Second, cars consume energy and
produce noise and gas emissions that make the urban environment less attractive to enjoy on foot.
Third, cars can be dangerous, as a number of accidents and conflicts occur daily in the urban
space, being pedestrian safety a growing concern.
These reasons are valid, in this research perspective, for considering the coexistence of the
pedestrian with other street users, namely vehicles and including bicycles and public transportation
as a walkability dimension on its own.
Commitment: much of what composes the built environment is a result of policy maker’s decisions
and planning standards. Also, much of what results from the usage of the built environment relates
to the community behavior and attitude. Finally behaviors and attitudes can be influenced by
initiatives and regulations. This dimension tries to capture the engagement of the actors in
promoting pedestrian friendly environments. It does not relate solely to the built environment, as it
may include programs or initiatives to encourage walking or the degree of enforcement of laws and
regulations. But it can address directly to the built environment, with the amount of public space
created each year for instance, or the implementation of universal access features. In general
terms, the governance layer plays an essential role in the factors that affect travel behavior.
These reasons are valid, in this research perspective, for considering the commitment of the actors
in creating and maintaining a pedestrian friendly environment as a walkability dimension on its own.
The proposed set of walkability dimensions forms the 7Cs layout:
Connectivity: The extent to which the pedestrian environment is linked; interfaced; joined;
attached; networked.
Convenience: The extent to which the pedestrian environment is appropriate; useful;
proper; suitable; time-saving.
Comfort: The extent to which the pedestrian environment is easy; pleasant; protected;
relaxed; sheltered; untroubled.
Conviviality: The extent to which the pedestrian environment is entertaining; lively;
pleasant; sociable.
21
Conspicuous: The extent to which the pedestrian environment is obvious; clear;
discernible; distinct; perceptible.
Coexistence: The extent to which the pedestrian and other transport modes can exist at
the same time and place with order and peace.
Commitment: The extent to which there exists engagement, liability and responsibility
towards the pedestrian environment.
It has been shown that walkability is a recent concept and field of study. Its importance to the good
city shape, livability and sustainability seems to be consensual, but its operationalization in terms of
its definition and measurement is not consensual. Despite the relations between the built
environment and walking behavior remaining to be successfully understood, a number of walkability
measurement methodologies have been developed in recent years. The next section briefly
presents a selection of such methodologies
2.6 State of practice – 2012
In a very recent yet dynamic field such as this one it is difficult to present a “state of the art”
selection of walkability methodologies. This selection reflects what has been considered to be the
major actual trends in terms of walkability. They resume the:
Quest for standardization: Action Cost 358 – Pedestrian Quality Needs
Quest for local methodologies: examples from South Africa, Greece and Spain
Quest for real world applications: PERS, Walkscore
Quest for walkable cities: Transport for London + Space Syntax
Quest for standardization: Action Cost 358 – Pedestrian Quality Needs – Part B4 – Measuring
Walking
The Pedestrians' Quality Needs Project (PQN) is an European research project, funded by the
European Cooperation in Science and Technology (COST) that aims, at short term, to identify the
pedestrian needs for their safe and agreeable mobility in public spaces for, at a longer term, provide
information needed to create more walkable cities, particularly in terms of developing and
implementing successful walking and public realm strategies.
In order to achieve those objectives, the PQN project is set to develop specific data collection
methods that permit comparable results. This requires the standardization and harmonization of
indicators and data collection procedures. Following the methodological review and analysis, it will
be possible to outline a comprehensive Assessment Model that includes all relevant aspects of
walking (and sojourning in the public space).
22
From the Assessment Model it will be possible to create key performance indicators and
methodologies to measure walkability. The results are understood to help cities to improve their
understanding on the walking conditions and the interventions that could create healthier cities and
more attractive public spaces.
The PQN project has produced 5 reports that collected contributions from nearly 70 experts from 19
European countries. The reports focused on 1) the conceptual framework and in 2) Pedestrian’s
Functional Needs; 3) Perceived Needs; the 4) Future of Walking and 5) Measuring Walkability. The
Assessment Model was understood as being under development.
Quest for local methodologies: examples from South Africa, Greece and Spain
In the opposite direction of the standardization trend, there have been various initiatives in
developing country-specific walkability measurement methodologies. One of the reasons is related
to the probable different ways in which people with different cultural backgrounds perceive different
urban environments. From this perspective, the “one fits all” approach is not suitable for walkability
assessment. A few recent examples can be cited:
In the case of Spain, the Centre for Studies in Public Works8 has been mandated in 2006 by the
Spanish government to assess the influence of the built environment features in pedestrian
displacement and, with the findings, to produce recommendation guidelines for walkable
environments, at different work scales (from master plans to street design).
The assessment included inquiring 900 school children about their path preferences on their way to
school; 600 inquiries to municipal market shoppers about the distance walked and shopping habits;
1600 inquiries to residents in different neighborhoods about their travel habits and 500 street audits
in Madrid. The results, as well as the recommendation guidelines, produced the book “La ciudad
paseable”. Although no walkability method has been developed in this project, their findings
characterize the particular relations of the Spanish urban environment with pedestrian
displacements.
In the case of Greece, researchers from the Aristotle University of Thessaloniki have been
developing a model for the estimation of pedestrian level of service, applicable to the Greek urban
environment. The urban environment factors used in this work are commonly found in similar works.
The main difference appears to be the relative importance (weight) given to each factor. An
extensive questionnaire survey was implemented along a street segment in order to understand the
perceived quality of the environmental variables and to calibrate the model.
8 CEDEX – Centro de Estudios Y Experimentation de Obras Publicas
23
In the case of South Africa, the main driver for developing a walkability assessment instrument
has been the pedestrian safety, particularly relevant in a country where approx. 60% of the
population is mainly pedestrian. The Pedestrian Environment Assessment Tool (PEAT) has been
developed by the University of Pretoria (2010) and tested in 5 different locations. Some of the urban
environment factors used by PEAT reflect the local conditions, and include, among others, the
presence of taxi (minibus) stops; the presence of hawkers; the presence of beggars; the presence
of surveillance cameras and the presence of security guards.
Quest for real world applications: PERS, Walkscore; Walkanomics
PERS, or Pedestrian Environment Review System, is a walking audit tool developed by TRL9
consisting of two parts: field check-sheets for scoring the pedestrian environment and software to
analyze and produce the assessment output.
PERS is used mainly at street level, assessing links (sidewalks), crossings, public spaces and
public transport waiting areas and interfaces. The audit is qualitative and performed on field by a
trained auditor who tries to review the environment from the user perspective (including the most
vulnerable users perspective). The software assigns weights to the audit scores, allowing the
analysis to be performed in a flexible and adaptable way according to the factors considered to be
more relevant in the circumstance. PERS has been implemented in cities in the UK and Australia.
Walkscore10
is a web-based application that rates urban areas (from neighborhoods to whole
cities) on a scale of 0-100. It allows users to pick a point in a map (google maps), finding the
walkability score of the neighborhood. It also outputs a “simcity”–like raster map, allowing the user
to see which areas of the city are more (green) or less (red) walkable.
The walkability measurement is performed by an algorithm that takes into account the number, the
type and the spatial distribution of amenities present in the study area, with the amenities being
land uses and activities (grocery shops, restaurants, banks, parks, etc.).
Walkanomics11
is another web-based application that uses user feedback and automated
processes to rate streets on a scale of 0-5. A navigation map allows seeing the score of individual
streets
The scoring of streets is performed through the assessment of various key-factors combined into
eight categories: road safety, road crossing difficulty, pavements and sidewalks, slope, navigation
(orientation), fear of crime, “smart and beautiful” and “fun and relaxing”. Users can introduce their
9 Transport Research Laboratory, London
10 Additional information can be found at www.walkscore.com
11 Additional information can be found at www.walkanomics.com
24
street review, presumably by scoring each key-factor factor on a 1-5 scale, contributing to the
average street score. In order to have an extended score set, a “WalkoBot” was developed,
consisting in an automated system that interprets publicly available data. In cases of non-existing
data (such as pavement/sidewalk), an average score (2.5) is assigned.
Figure 3: Walk score, internet application. Source: www.walkscore.com
Figure 4: Walkonomics, internet application. Source: www.walkonomics.com
Quest for walkable cities: Transport for London + Space Syntax
The Mayor of Greater London (7.3 million people; 1600 km2) has set one of the strategic transport
objectives to be making London one of the world’s most walkable cities. Transport for London (TfL),
the regional transport authority, was commissioned to perform the city’s walkability index.
This index was based on “space syntax” techniques of pedestrian movement analysis. Space
syntax techniques allow forecasts on the basis of “spatial integration” (Hillier et al. 1993), where the
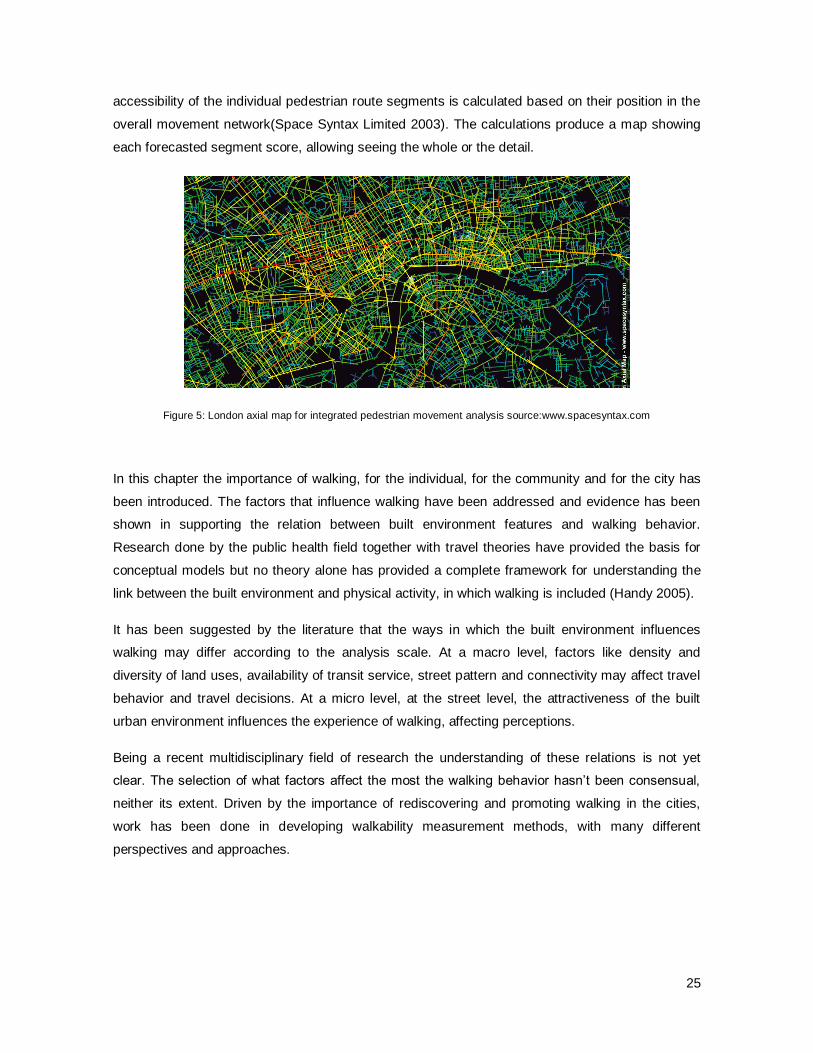
25
accessibility of the individual pedestrian route segments is calculated based on their position in the
overall movement network(Space Syntax Limited 2003). The calculations produce a map showing
each forecasted segment score, allowing seeing the whole or the detail.
Figure 5: London axial map for integrated pedestrian movement analysis source:www.spacesyntax.com
In this chapter the importance of walking, for the individual, for the community and for the city has
been introduced. The factors that influence walking have been addressed and evidence has been
shown in supporting the relation between built environment features and walking behavior.
Research done by the public health field together with travel theories have provided the basis for
conceptual models but no theory alone has provided a complete framework for understanding the
link between the built environment and physical activity, in which walking is included (Handy 2005).
It has been suggested by the literature that the ways in which the built environment influences
walking may differ according to the analysis scale. At a macro level, factors like density and
diversity of land uses, availability of transit service, street pattern and connectivity may affect travel
behavior and travel decisions. At a micro level, at the street level, the attractiveness of the built
urban environment influences the experience of walking, affecting perceptions.
Being a recent multidisciplinary field of research the understanding of these relations is not yet
clear. The selection of what factors affect the most the walking behavior hasn’t been consensual,
neither its extent. Driven by the importance of rediscovering and promoting walking in the cities,
work has been done in developing walkability measurement methods, with many different
perspectives and approaches.
26
3 . Walkability measurement
The walkability concept has been introduced with a straight relation with the idea of measuring or
assessing the pedestrian environment. Metrics and performances have been always present when
debating walkability.
This chapter addresses first the importance of such metrics in terms of urban planning and
management. Next, selected walkability measurement methodologies are presented and discussed
in terms of their methodological particularities and their indicators. The section following deals with
operational issues identified from the selected methodologies.
3.1 Why measure walking
Walking has been often considered as a “forgotten” mode of transport. Other modes of transport,
especially the private motor vehicle, have undergone significant study over the last decades and
have a high degree of measurability. Walking, being a simple way of getting around and with little
need for special infrastructure has lagged behind the other modes in terms of research and there
have been very few analytical techniques to enable practitioners in improving the provision for this
mode of travel (Abley and Turner 2011).
The quality of the on-foot journeys, in particular, has been measured by sometimes very subjective
judgments, being “left to urban designers and landscape architects to determine the visual appeal
of the walking environment, and to engineers to assess the functionality of specific walking
schemes.” (Abley and Turner 2011) often resulting in contradictory recommendations from the parts
involved.
In terms of urban management, the lack of objective evidence has been pointed out as a reason for
relatively little interventions and improvements in the pedestrian environment, as “there are no facts
to convince policymakers. In the struggle for public money, those with the facts have more chance
to get the funds.” (Park 2008) Developing analysis tools that can evaluate the quality of a walking
environment has been pointed as a need in order to include the pedestrian network in the general
network planning and economic analysis of transport decisions (Abley and Turner 2011).
At a local authority level (municipality), problems in the built environment have been addressed in
different ways in the case of road problems and in the case of pedestrian network problems. In the
former, proactive methods are used, such as consultation, traffic modeling or safety and efficiency
measurement. In the latter, problems are identified through resident or user complaints, what
constitute reactive methods. Such reactive methods do not promote forward planning and may in
27
practice mean that funds will not be directed to serious, unreported, problems, what is, in practice
“clearly not an efficient use of finite funds” (Abley and Turner 2011).
Measuring or assessing the quality or the friendliness of the built environment may be considered of
capital importance for urban planning and management. Factual evidence may support more
objective and comprehensive planning strategies and interventions, facilitating the progress towards
more sustainable, integrated and appealing walking cities. The next section overviews a sample of
walkability measurement methodologies.
3.2 Methodologies
Many tools have emerged, during the past few years, for measuring the quality of the built
environment, or the walkability of neighborhood designs (Ewing and Handy 2009) (Leslie et al.
2007). A number of these approaches have been validated to some degree and have been widely
used across the US of A. The Robert Wood Johnson Foundation (Active Living Research) alone
has sponsored and made available 13 of these walkability auditing instruments (Ewing and Handy
2009).
The assessment of the walking environment has been done using various methods. These methods
include audit tools; checklists; inventories; level-of-service scales; surveys; questionnaires and
indices. Although they may differ in their operationalization these methods have two major types of
outcome: either a single number that categorizes the environment as high vs. low suitability for
walking; or the measure of the amount of features that support or hinder walking. (Maghelal 2010).
A few of these methods have been briefly presented previously, as part of the Start of the Art13
.
Such examples have shown that this measurement can be performed quantitatively or
qualitatively. Moreover, there have been techniques developed to address to different scales, from
the neighborhood area to the street segments and even intersections.
Hence, walkability methodologies can be classified according to the type of assessment
(quantitative or qualitative) and applications scale (area, segment, point):
1) Area quantitative
The neighborhood level walkability assessment has been the most common application of area
quantitative techniques. These techniques focus in producing objective measurements and are
usually implemented with the aid of GIS. Statistical data at census level (population figures, land
use types, etc.) is used in combination with geographical features (street network, city blocks, etc.).
The study area relates to the “neighborhood”, that can be understood as a portion of the urban
tissue with more or less homogenous characteristics but to which the residing community relate to
13
See section 2.6
28
as a “place”. The index developed by Frank (Frank et al. 2005) is an example of an area
quantitative technique.
The study area is limited by a 1km buffer around the neighborhood bounds, and for this area
statistical and geographical data regarding land use (floor area occupied by each land use),
residential density and street intersection is collected. A walkability index is then calculated from the
collected data, according to the following expression:
( ) ( )
( )
By using normalized values as input the result is a single value that can be used for comparison of
neighborhoods or for benchmarking purposes.
2) Area qualitative
This type of technique also has been used at the neighborhood level, in particular by the public
health/social science body of research.
It consists in addressing the resident’s point of view concerning the area’s walking environment.
Surveys and inquiries are usually distributed among the residents, consisting in a fill-form with
questions and a set of possible answers. The Neighborhood Environment Walkability Scale
(NEWS), developed by Saelens (Saelens et al. 2003) is an example of an area qualitative
technique, being the questions posed in the following format:
Question C.1. I can do most of my shopping at local stores. (answer to be circled)
Answer: 1 - strongly disagree ; 2 -somewhat disagree; 3 - somewhat agree; 4 – strongly
agree.
Question I.3 How satisfied are you with the access to public transportation in your
neighborhood?
Answer: 1 - strongly dissatisfied; 2 -somewhat dissatisfied; 3 – neither satisfied nor
dissatisfied; 4 - somewhat satisfied; 5 – strongly satisfied.
Each answer has an associated value and the results (to the 85 questions) are computed and
classified in 8 major groups: 1) residential density; 2) land use mix; 3) land use access; 4) street
connectivity; 5) walking/cycling facilities; 6) aesthetics; 7) pedestrian/traffic safety and 8) crime
safety. The output is a value for each one of the 8 categories. These values can be used for
comparison of neighborhoods or for benchmarking purposes.
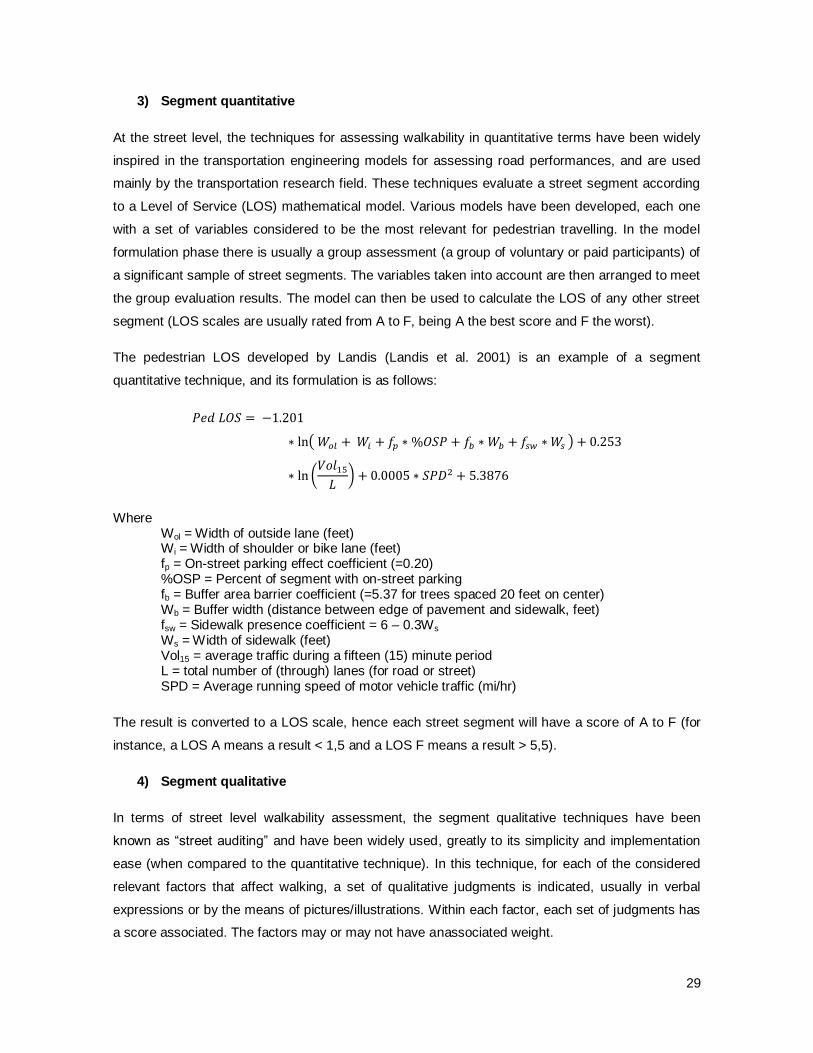
29
3) Segment quantitative
At the street level, the techniques for assessing walkability in quantitative terms have been widely
inspired in the transportation engineering models for assessing road performances, and are used
mainly by the transportation research field. These techniques evaluate a street segment according
to a Level of Service (LOS) mathematical model. Various models have been developed, each one
with a set of variables considered to be the most relevant for pedestrian travelling. In the model
formulation phase there is usually a group assessment (a group of voluntary or paid participants) of
a significant sample of street segments. The variables taken into account are then arranged to meet
the group evaluation results. The model can then be used to calculate the LOS of any other street
segment (LOS scales are usually rated from A to F, being A the best score and F the worst).
The pedestrian LOS developed by Landis (Landis et al. 2001) is an example of a segment
quantitative technique, and its formulation is as follows:
( )
( )
Where Wol = Width of outside lane (feet) Wi = Width of shoulder or bike lane (feet) fp = On-street parking effect coefficient (=0.20) %OSP = Percent of segment with on-street parking fb = Buffer area barrier coefficient (=5.37 for trees spaced 20 feet on center) Wb = Buffer width (distance between edge of pavement and sidewalk, feet) fsw = Sidewalk presence coefficient = 6 – 0.3Ws Ws = Width of sidewalk (feet) Vol15 = average traffic during a fifteen (15) minute period L = total number of (through) lanes (for road or street) SPD = Average running speed of motor vehicle traffic (mi/hr)
The result is converted to a LOS scale, hence each street segment will have a score of A to F (for
instance, a LOS A means a result < 1,5 and a LOS F means a result > 5,5).
4) Segment qualitative
In terms of street level walkability assessment, the segment qualitative techniques have been
known as “street auditing” and have been widely used, greatly to its simplicity and implementation
ease (when compared to the quantitative technique). In this technique, for each of the considered
relevant factors that affect walking, a set of qualitative judgments is indicated, usually in verbal
expressions or by the means of pictures/illustrations. Within each factor, each set of judgments has
a score associated. The factors may or may not have anassociated weight.
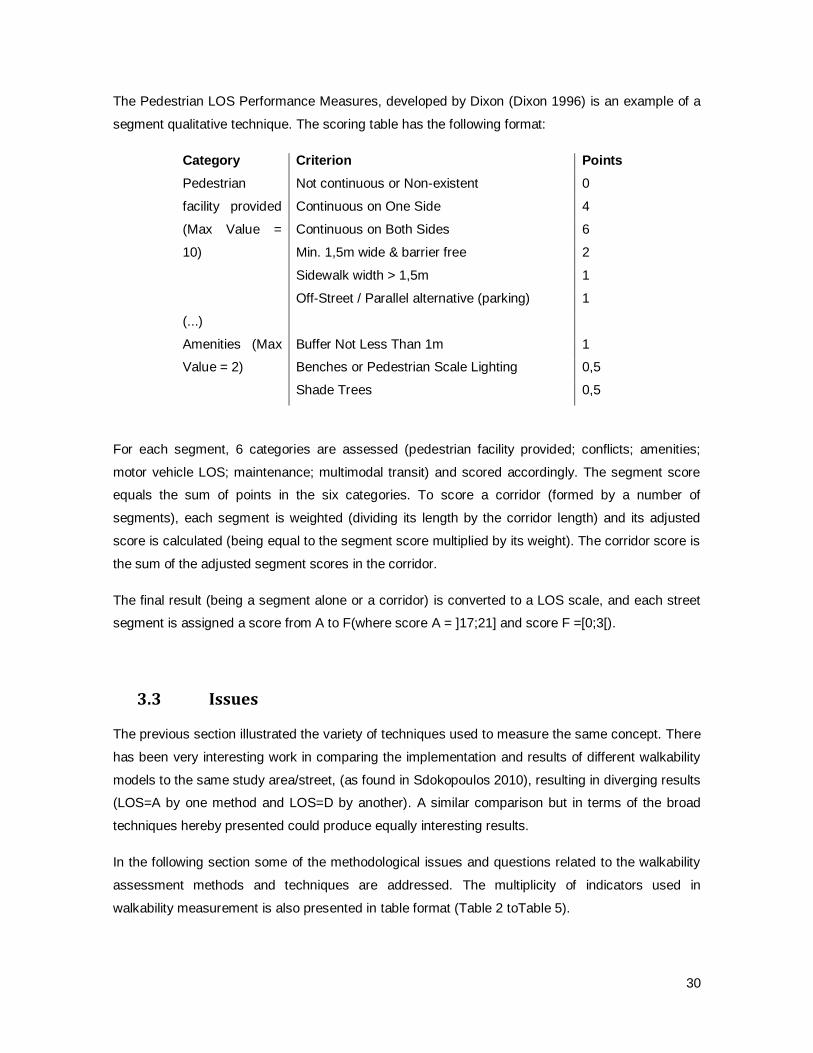
30
The Pedestrian LOS Performance Measures, developed by Dixon (Dixon 1996) is an example of a
segment qualitative technique. The scoring table has the following format:
Category Criterion Points
Pedestrian
facility provided
(Max Value =
10)
Not continuous or Non-existent 0
Continuous on One Side 4
Continuous on Both Sides 6
Min. 1,5m wide & barrier free 2
Sidewalk width > 1,5m 1
Off-Street / Parallel alternative (parking) 1
(...)
Amenities (Max
Value = 2)
Buffer Not Less Than 1m 1
Benches or Pedestrian Scale Lighting 0,5
Shade Trees 0,5
For each segment, 6 categories are assessed (pedestrian facility provided; conflicts; amenities;
motor vehicle LOS; maintenance; multimodal transit) and scored accordingly. The segment score
equals the sum of points in the six categories. To score a corridor (formed by a number of
segments), each segment is weighted (dividing its length by the corridor length) and its adjusted
score is calculated (being equal to the segment score multiplied by its weight). The corridor score is
the sum of the adjusted segment scores in the corridor.
The final result (being a segment alone or a corridor) is converted to a LOS scale, and each street
segment is assigned a score from A to F(where score A = ]17;21] and score F =[0;3[).
3.3 Issues
The previous section illustrated the variety of techniques used to measure the same concept. There
has been very interesting work in comparing the implementation and results of different walkability
models to the same study area/street, (as found in Sdokopoulos 2010), resulting in diverging results
(LOS=A by one method and LOS=D by another). A similar comparison but in terms of the broad
techniques hereby presented could produce equally interesting results.
In the following section some of the methodological issues and questions related to the walkability
assessment methods and techniques are addressed. The multiplicity of indicators used in
walkability measurement is also presented in table format (Table 2 toTable 5).
31
Objective vs. Subjective measurement
The issue of subjective versus objective measurements of the built environment has been
considered to merit particular attention (Handy 2005), as some aspects of the pedestrian
environment can be measured objectively and therefore with more ease being others are more
subjective in nature.(Maghelal 2010).
The present trend has appeared to be towards standardized protocols and use of objective
measures (COST 358 2010), adapted or not to local conditions (Christopoulou and Pitsiava-
Lationopolou 2012)(Albers, Wright, and Olwoch 2010)(Dauden, Echavarri, and Schettino 2009).
Objective measures have been suggested to be better predictors of behavior than perceived
(subjective) ones, but on the other hand, perceptions and beliefs have been suggested, by
behavioral theories, to affect behavior in more direct ways than reality (Handy 2005). In a study by
Moudon (Moudon et al. 2006), the enhanced perceptions of the urban space have been related to
relatively high levels of walking, meaning people who have a stronger perception of the
neighborhood environment may walk more than others who do not “know” the area.
Adding to the problem, it has been shown that perceived measures may differ significantly from
objective measures. (Sallis et al 1997 cit. Handy 2005) with the assessment of perceived and
objective measures of the same environment finding mostly fair to poor consistency of the results
(Kitlend et al 2003 cit. Handy 2005).
The public health field has pioneered the research on the built environment influence in promoting
walking and has done so using mainly perceived measures of the built environment. Perceived (or
self-reported measures) have been shown in other studies to have lesser reliability when compared
to objective measures using GIS (Maghelal 2010).
Advocates of objective measurement have been arguing that such measures can be more reliable
and therefore should be used for built-environment assessment, allowing the measurement to be
replicated, capturing the same variables.
On the other hand it has been argued that physical features individually do not contribute to the
understanding of the experience of walking in a particular environment. Specifically, objective
measures do not capture people’s overall perceptions of the street environment, and people’s
perception may affect walking behavior to a greater extent than objective attributes of the built
environment.
Finally, it has been suggested that the use of objectively measured environmental variables next to
environmental perceptions is essential to enhance the understanding of the influence of the built
environment in walking behavior. In order to achieve that, it is suggested more research and with
32
multidisciplinary contributes, as “at this point in time, the conceptualization and measurements of
environmental attributes is still in its infancy compared with the knowledge on psychosocial factors
built for about three decades” (Bourdeaudhuij et al. 2005).
Model validation
The validation of the walkability measurement models has been considered a challenge. Only few
of the reviewed methodologies have been, in practice, validated to some extent.
For validation purposes several techniques have been used. In the case of methodologies related
to pedestrian LOS (segment quantitative) there is usually the contribution of a group of participants
that are involved in scoring a sample of street segments. The participants may be chosen in order
to form a representative group (or cross-section) of the population (Abley and Turner 2011). The
correlation of objective measurements with the participant’s perceptions is used to derive predictive
mathematical models. The estimated score is compared to the people’s perception of the
pedestrian environment quality, thus validating the model.
Public participation and community involvement have also been used for the validation of walkability
models. Through group meetings or questionnaire inquiries, participants’ perceptions and concerns
aid in selecting the variables to be measured and in providing feedback on the results(Evans 2009).
The use of objective measures in combination with user evidence has been a recommended
approach as it may provide a “richer, more accurate picture of environmental influences” ibidem)
whereas evolving the community contributes that their perspectives are to be considered. The
participation of urban planning professionals and experts has also been suggested in terms of
measurement validation.
Sampling is another technique that has been used for validation, consisting in collecting and
analyzing a relatively large number of observations, with sufficient variation in the built environment.
The sample size needed to adequately test the link between environment and travel behavior has
been suggested to be “at least 50 areas” (Cervero and Radish 1996 cit. Handy 2005).
Counting pedestrian flow could be thought of being a good validation technique. However
pedestrian counting has not been a common validation method with the reviewed literature not
suggesting the reasons for it. This may be partly because of the myriad of factors that all together
influence travel and walking behavior.
As seen previously in Figure 114
, walking behavior has been believed to be influenced by various
factors. These factors include built environment features but also preferences and attitudes,
lifestyle, availability of alternative modes of transport and socio-demographic profile. That is to say,
14
See chapter 2.2
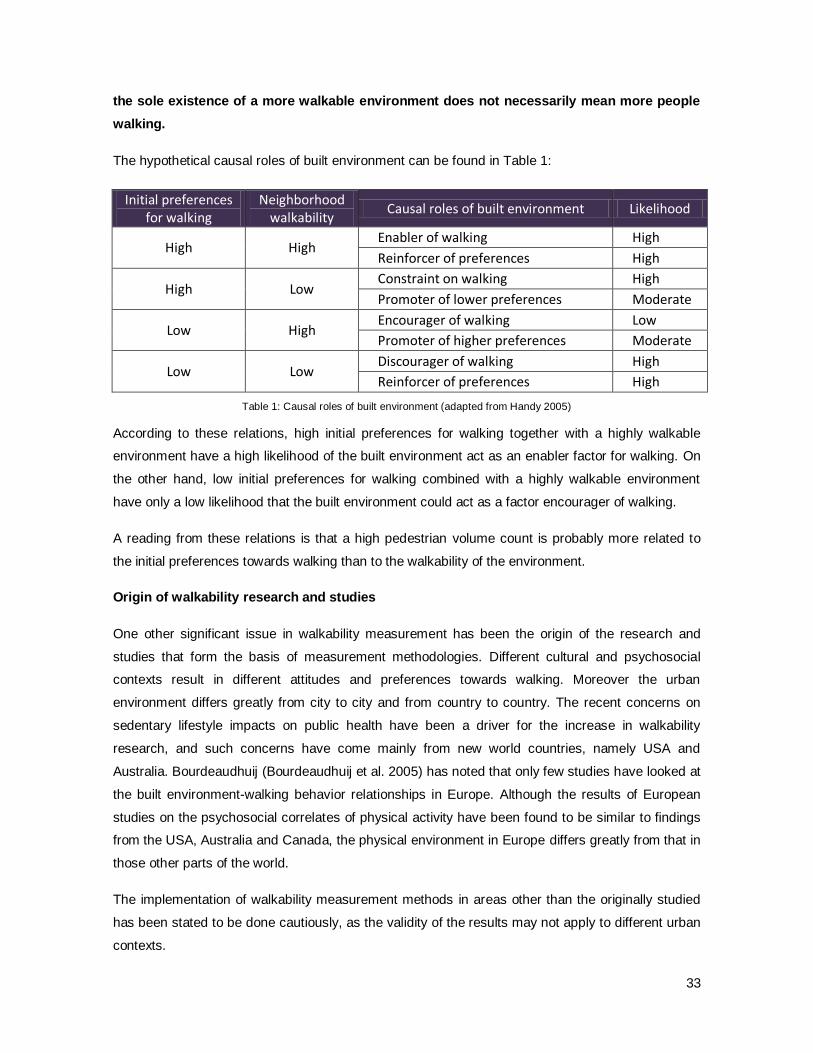
33
the sole existence of a more walkable environment does not necessarily mean more people
walking.
The hypothetical causal roles of built environment can be found in Table 1:
Initial preferences for walking
Neighborhood walkability
Causal roles of built environment Likelihood
High High Enabler of walking High
Reinforcer of preferences High
High Low Constraint on walking High
Promoter of lower preferences Moderate
Low High Encourager of walking Low
Promoter of higher preferences Moderate
Low Low Discourager of walking High
Reinforcer of preferences High
Table 1: Causal roles of built environment (adapted from Handy 2005)
According to these relations, high initial preferences for walking together with a highly walkable
environment have a high likelihood of the built environment act as an enabler factor for walking. On
the other hand, low initial preferences for walking combined with a highly walkable environment
have only a low likelihood that the built environment could act as a factor encourager of walking.
A reading from these relations is that a high pedestrian volume count is probably more related to
the initial preferences towards walking than to the walkability of the environment.
Origin of walkability research and studies
One other significant issue in walkability measurement has been the origin of the research and
studies that form the basis of measurement methodologies. Different cultural and psychosocial
contexts result in different attitudes and preferences towards walking. Moreover the urban
environment differs greatly from city to city and from country to country. The recent concerns on
sedentary lifestyle impacts on public health have been a driver for the increase in walkability
research, and such concerns have come mainly from new world countries, namely USA and
Australia. Bourdeaudhuij (Bourdeaudhuij et al. 2005) has noted that only few studies have looked at
the built environment-walking behavior relationships in Europe. Although the results of European
studies on the psychosocial correlates of physical activity have been found to be similar to findings
from the USA, Australia and Canada, the physical environment in Europe differs greatly from that in
those other parts of the world.
The implementation of walkability measurement methods in areas other than the originally studied
has been stated to be done cautiously, as the validity of the results may not apply to different urban
contexts.
34
Multiplicity of Indicators
The variations found in the urban environment have also contributed to the remarkable quantity of
built environment features being addressed as indicators for walkability measurement. A review of a
small sample of walkability measurement methodologies has identified approx.150 different
indicators that illustrate the multiplicity of approaches.
Some of the listed indicators may express local concerns or simply the researcher’s perspective of
what factors were more relevant to the walkability assessment. As referred previously, not all of the
reviewed methodologies that use these indicators have been validated, and there hasn’t been, to
date, sufficient scientific evidence to support such indicators.
Nevertheless, in the scope of this research, the indicators of the model developed and presented in
the next chapter are drawn from the indicator list. The indicators are classified according to the
walkability dimensions, or in other words, to the 7Cs layout15
.
It has been shown, in this chapter, the relevance of walkability measuring for urban management,
as it can provide factual data for planning practitioners and policymakers (and for population in
general) in terms of benchmarking, monitoring and decision analysis.
Although being a relatively recent field of work, the development of walkability measurement
methodologies has been gaining worldwide attention, resulting in a considerable variety of
approaches. The lack of sufficient theoretical frameworks and scientific evidence on the relative
importance of the different built environment features that influence walking has not been seen as a
constraint for the development of walkability measurement methodologies.
Several approaches have been classified in four major groups, according to their work scale
(area/segment) and nature of scoring (quantitative/qualitative), each with its strengths and
weaknesses.
It has been shown that there is a generalized lack of consensus in walkability measurement.
Several major issues have been identified, relating to the usage of more objective or more
subjective metrics; to the model validation; to the usage of methods in other areas, exterior to the
ones researched.
A multiplicity of indicators has been used in the literature but more research was considered
needed in order to understand their importance.
15
Suggested in chapter 2.5
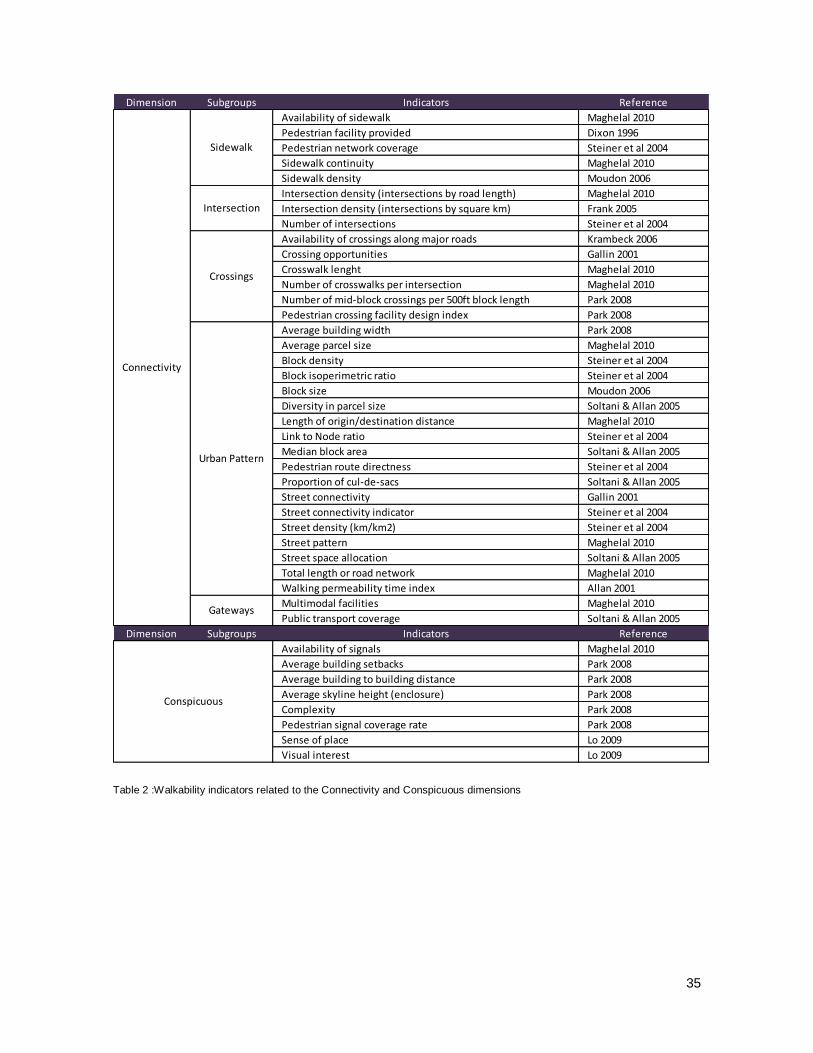
35
Table 2 :Walkability indicators related to the Connectivity and Conspicuous dimensions
Dimension Subgroups Indicators Reference
Availability of sidewalk Maghelal 2010
Pedestrian facility provided Dixon 1996
Pedestrian network coverage Steiner et al 2004
Sidewalk continuity Maghelal 2010
Sidewalk density Moudon 2006
Intersection density (intersections by road length) Maghelal 2010
Intersection density (intersections by square km) Frank 2005
Number of intersections Steiner et al 2004
Availability of crossings along major roads Krambeck 2006
Crossing opportunities Gallin 2001
Crosswalk lenght Maghelal 2010
Number of crosswalks per intersection Maghelal 2010
Number of mid-block crossings per 500ft block length Park 2008
Pedestrian crossing facility design index Park 2008
Average building width Park 2008
Average parcel size Maghelal 2010
Block density Steiner et al 2004
Block isoperimetric ratio Steiner et al 2004
Block size Moudon 2006
Diversity in parcel size Soltani & Allan 2005
Length of origin/destination distance Maghelal 2010
Link to Node ratio Steiner et al 2004
Median block area Soltani & Allan 2005
Pedestrian route directness Steiner et al 2004
Proportion of cul-de-sacs Soltani & Allan 2005
Street connectivity Gallin 2001
Street connectivity indicator Steiner et al 2004
Street density (km/km2) Steiner et al 2004
Street pattern Maghelal 2010
Street space allocation Soltani & Allan 2005
Total length or road network Maghelal 2010
Walking permeability time index Allan 2001
Multimodal facilities Maghelal 2010
Public transport coverage Soltani & Allan 2005
Dimension Subgroups Indicators Reference
Availability of signals Maghelal 2010
Average building setbacks Park 2008
Average building to building distance Park 2008
Average skyline height (enclosure) Park 2008
Complexity Park 2008
Pedestrian signal coverage rate Park 2008
Sense of place Lo 2009
Visual interest Lo 2009
Conspicuous
Connectivity
Sidewalk
Intersection
Crossings
Urban Pattern
Gateways
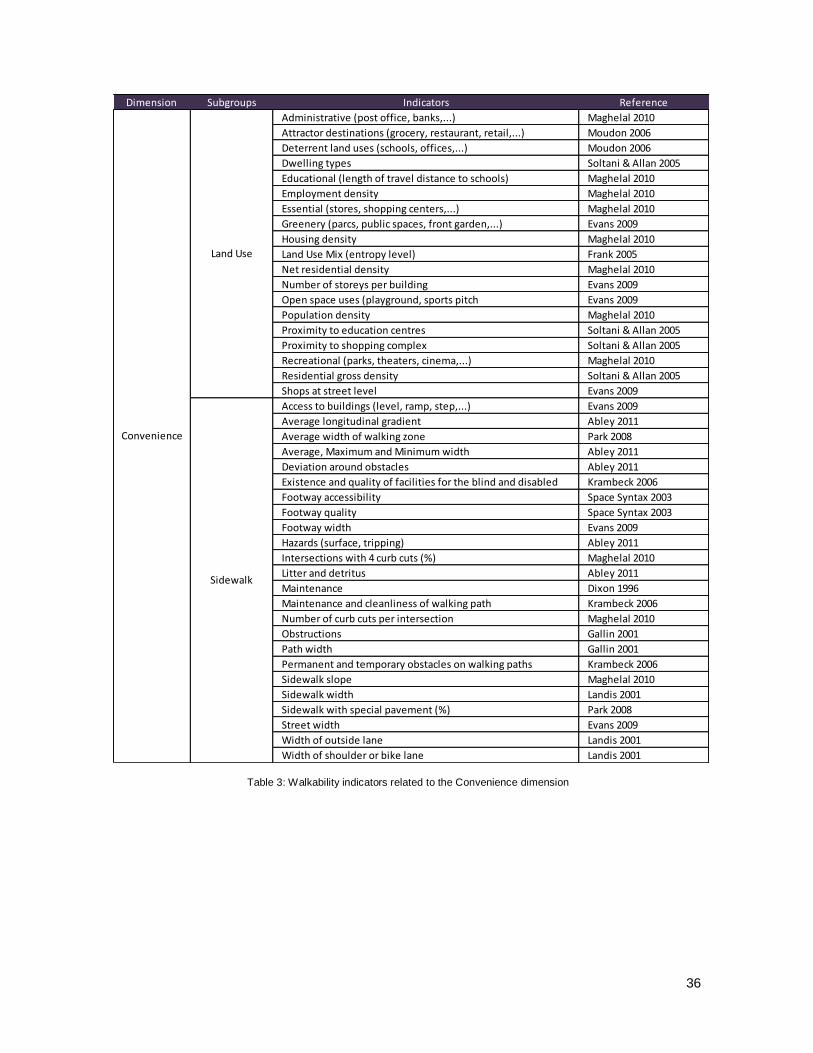
36
Table 3: Walkability indicators related to the Convenience dimension
Dimension Subgroups Indicators Reference
Administrative (post office, banks,...) Maghelal 2010
Attractor destinations (grocery, restaurant, retail,...) Moudon 2006
Deterrent land uses (schools, offices,...) Moudon 2006
Dwelling types Soltani & Allan 2005
Educational (length of travel distance to schools) Maghelal 2010
Employment density Maghelal 2010
Essential (stores, shopping centers,...) Maghelal 2010
Greenery (parcs, public spaces, front garden,...) Evans 2009
Housing density Maghelal 2010
Land Use Mix (entropy level) Frank 2005
Net residential density Maghelal 2010
Number of storeys per building Evans 2009
Open space uses (playground, sports pitch Evans 2009
Population density Maghelal 2010
Proximity to education centres Soltani & Allan 2005
Proximity to shopping complex Soltani & Allan 2005
Recreational (parks, theaters, cinema,...) Maghelal 2010
Residential gross density Soltani & Allan 2005
Shops at street level Evans 2009
Access to buildings (level, ramp, step,...) Evans 2009
Average longitudinal gradient Abley 2011
Average width of walking zone Park 2008
Average, Maximum and Minimum width Abley 2011
Deviation around obstacles Abley 2011
Existence and quality of facilities for the blind and disabled Krambeck 2006
Footway accessibility Space Syntax 2003
Footway quality Space Syntax 2003
Footway width Evans 2009
Hazards (surface, tripping) Abley 2011
Intersections with 4 curb cuts (%) Maghelal 2010
Litter and detritus Abley 2011
Maintenance Dixon 1996
Maintenance and cleanliness of walking path Krambeck 2006
Number of curb cuts per intersection Maghelal 2010
Obstructions Gallin 2001
Path width Gallin 2001
Permanent and temporary obstacles on walking paths Krambeck 2006
Sidewalk slope Maghelal 2010
Sidewalk width Landis 2001
Sidewalk with special pavement (%) Park 2008
Street width Evans 2009
Width of outside lane Landis 2001
Width of shoulder or bike lane Landis 2001
Convenience
Land Use
Sidewalk
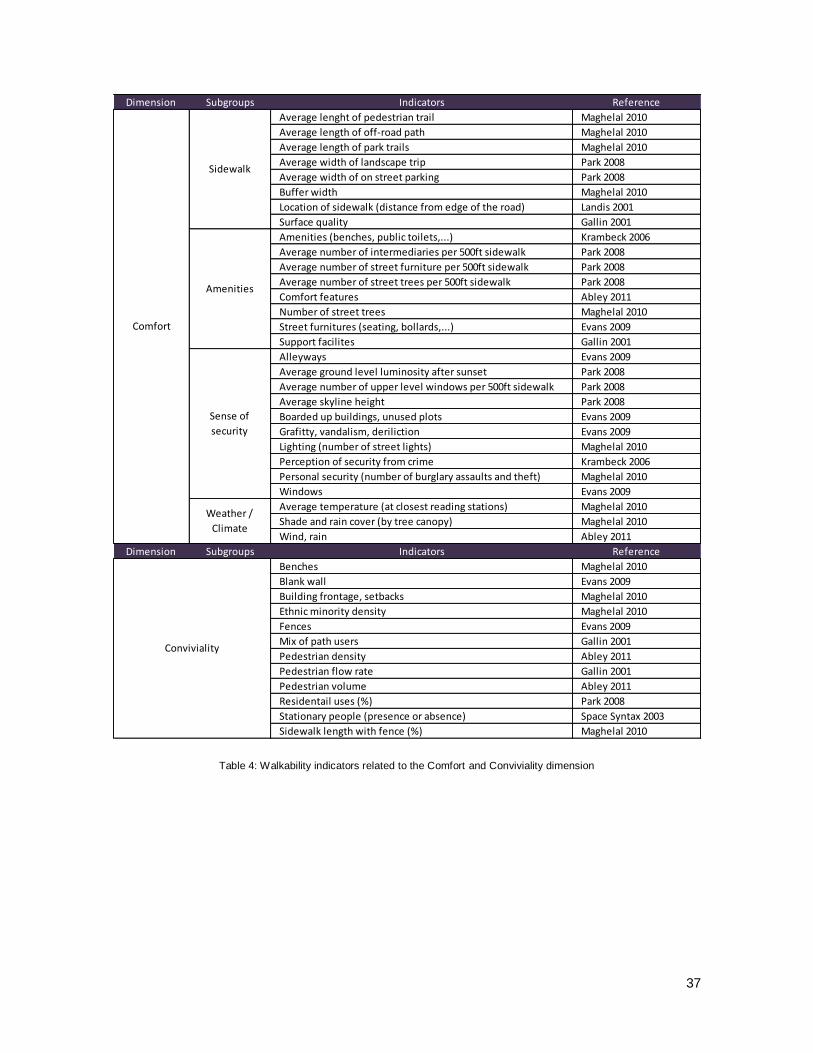
37
Table 4: Walkability indicators related to the Comfort and Conviviality dimension
Dimension Subgroups Indicators Reference
Average lenght of pedestrian trail Maghelal 2010
Average length of off-road path Maghelal 2010
Average length of park trails Maghelal 2010
Average width of landscape trip Park 2008
Average width of on street parking Park 2008
Buffer width Maghelal 2010
Location of sidewalk (distance from edge of the road) Landis 2001
Surface quality Gallin 2001
Amenities (benches, public toilets,...) Krambeck 2006
Average number of intermediaries per 500ft sidewalk Park 2008
Average number of street furniture per 500ft sidewalk Park 2008
Average number of street trees per 500ft sidewalk Park 2008
Comfort features Abley 2011
Number of street trees Maghelal 2010
Street furnitures (seating, bollards,...) Evans 2009
Support facilites Gallin 2001
Alleyways Evans 2009
Average ground level luminosity after sunset Park 2008
Average number of upper level windows per 500ft sidewalk Park 2008
Average skyline height Park 2008
Boarded up buildings, unused plots Evans 2009
Grafitty, vandalism, deriliction Evans 2009
Lighting (number of street lights) Maghelal 2010
Perception of security from crime Krambeck 2006
Personal security (number of burglary assaults and theft) Maghelal 2010
Windows Evans 2009
Average temperature (at closest reading stations) Maghelal 2010
Shade and rain cover (by tree canopy) Maghelal 2010
Wind, rain Abley 2011
Dimension Subgroups Indicators Reference
Benches Maghelal 2010
Blank wall Evans 2009
Building frontage, setbacks Maghelal 2010
Ethnic minority density Maghelal 2010
Fences Evans 2009
Mix of path users Gallin 2001
Pedestrian density Abley 2011
Pedestrian flow rate Gallin 2001
Pedestrian volume Abley 2011
Residentail uses (%) Park 2008
Stationary people (presence or absence) Space Syntax 2003
Sidewalk length with fence (%) Maghelal 2010
Conviviality
Comfort
Sidewalk
Amenities
Sense of
security
Weather /
Climate
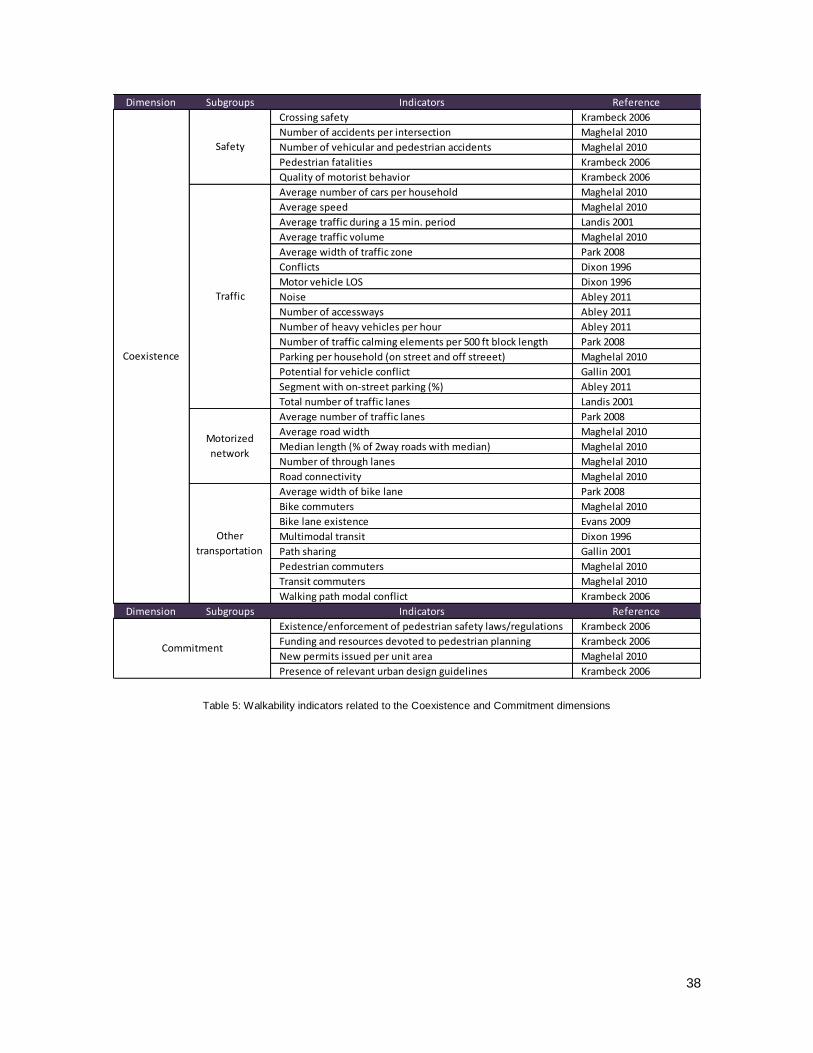
38
Table 5: Walkability indicators related to the Coexistence and Commitment dimensions
Dimension Subgroups Indicators Reference
Crossing safety Krambeck 2006
Number of accidents per intersection Maghelal 2010
Number of vehicular and pedestrian accidents Maghelal 2010
Pedestrian fatalities Krambeck 2006
Quality of motorist behavior Krambeck 2006
Average number of cars per household Maghelal 2010
Average speed Maghelal 2010
Average traffic during a 15 min. period Landis 2001
Average traffic volume Maghelal 2010
Average width of traffic zone Park 2008
Conflicts Dixon 1996
Motor vehicle LOS Dixon 1996
Noise Abley 2011
Number of accessways Abley 2011
Number of heavy vehicles per hour Abley 2011
Number of traffic calming elements per 500 ft block length Park 2008
Parking per household (on street and off streeet) Maghelal 2010
Potential for vehicle conflict Gallin 2001
Segment with on-street parking (%) Abley 2011
Total number of traffic lanes Landis 2001
Average number of traffic lanes Park 2008
Average road width Maghelal 2010
Median length (% of 2way roads with median) Maghelal 2010
Number of through lanes Maghelal 2010
Road connectivity Maghelal 2010
Average width of bike lane Park 2008
Bike commuters Maghelal 2010
Bike lane existence Evans 2009
Multimodal transit Dixon 1996
Path sharing Gallin 2001
Pedestrian commuters Maghelal 2010
Transit commuters Maghelal 2010
Walking path modal conflict Krambeck 2006
Dimension Subgroups Indicators Reference
Existence/enforcement of pedestrian safety laws/regulations Krambeck 2006
Funding and resources devoted to pedestrian planning Krambeck 2006
New permits issued per unit area Maghelal 2010
Presence of relevant urban design guidelines Krambeck 2006
Commitment
Coexistence
Safety
Traffic
Motorized
network
Other
transportation
39
4 . Developing a walkability assessment model
Several walkability measurement methodologies have been recently developed. There has been a
growing interest in this subject from the fields of transportation, public health and urban planning
and scientific evidence on the relations between the built environment and walking has been
produced. Walkability can then be understood as a multidisciplinary concern, or has having
multidisciplinary concerns. Walkability has been studied also at very different scales, from the whole
urban area to the street segments.
A number of these methodologies have been developed to be used in the urban planning field, with
the objective of conducing pedestrian audits for integration in general master plans, transportation
plans or pedestrian plans. Such tools can be used by planning professionals and policymakers to
understand the scope and extent of local pedestrian conditions as well as to identify possible
counteractions for its promotion (Krambeck and Shah 2006).
To date, there has not been a walkability measurement methodology fairly accepted and
implemented in planning offices. The different methodologies analyzed by this research could most
probably be used in the Portuguese urban environment for walkability estimation. However, given
the prevailing local conditions, this research aims to propose a new walkability measurement model,
applicable to the Portuguese municipalities’ context.
This chapter presents such model. The conceptual framework is firstly presented and consists of
the programmatic basis of the model, that is to say, the key issues to address. The following part
presents the structure of the model, which includes a brief description of the multicriteria decision
analysis methods used for structuring. Therefore the evaluation criteria for walkability measurement
are presented (with their critical assessment being found in the Annexes). The chapter concludes
with an overview of the GIS framework assembled to perform the walkability analysis.
4.1 Conceptual framework
The proposed model tries to address several issues and concerns drawn from the various existing
models:
Walkability has multidisciplinary concerns. The different perspectives are to be taken in
consideration, meaning all the different dimensions of walkability should be assessed.
Walkability can be measured at different scales. Each scale can provide a different level of
understanding, being the macro scale (urban areas) more suitable for the characterization of the
pedestrian conditions at a neighborhood level and the micro scale (street level) more suitable for
40
identification of the quality of those conditions. Each one of the reviewed methods addresses one
single scale, and each scale has been focused by different disciplinary approaches. The
neighborhood scale has been studied to a larger extent by the public health and social sciences
group while the street scale (even the sidewalk conditions only) has been the focus of the
transportation group. Separate scale analysis also makes sense in the way that certain
environmental features, namely most micro scale elements (sidewalk, trees) have been reported to
have a lesser importance in travel behavior once more basic explainers, like land use diversity and
demographic attributes were accounted for.(Cervero and Kockelman 1997). Various scales are to
be addressed in the model in order to obtain the various layers of information that could be useful
for planning practitioners. These are the Global scale (at city level); the Macro scale (at
neighborhood level); the Meso scale (as the walkable service area from a certain point) and the
Micro scale (at street level).
Walkability can be measured through a large variety of indicators and variables. Several benefits
can be achieved using GIS capabilities in such studies. GIS enables the network and spatial
analysis of an urban area as disaggregated as possible to characterize the urban form in detail,
being possible to deal with the different work scales, from the global scale to the micro scale
(Soltani and Allan 2005).Their use is now widespread at planning agencies and municipalities,
meaning that the model could be implemented thoughtfully.
Several other benefits can be achieved in such studies using multicriteria decision analysis
(MCDA), as MCDA and its structuring methods can provide an operative field to planning practice
(Batista e Silva et al. 2012). These methods can also provide support to the combination of the
different measured urban features (criteria) that are to be analyzed and provide support in
estimating their relative importance (weights).
Walkability measurement methods use a great variety of data, from statistical census data to on-
field collection and measurement. Many of the methods are developed for research purposes and
lack a degree of connection to the real world when it comes to gathering data. This can be a
particularly sensitive issue when it comes to the cost of obtaining data. In the Portuguese
municipality context, many examples can be found of indicators that are more often just proposed
than effectively measured, given the allocation of resources (people, time, know-how) needed to
perform such measurements. The model should therefore be cost-effective, being able to be
implemented using available data (both statistical as geographic) and uncomplicated field work. The
implementation of the model at different work scales should be independent, meaning that more
detailed data is only used at detailed analysis, thus reducing the field work and the general analysis
cost.
41
The model should also be action-oriented. There are various layers of information that can be
extracted from the pedestrian environment, but some of recorded environmental attributes may be
difficult to use for decision aid or policy making. Land use attributes, such as housing density and
street patterns are usually connected to walking travel behavior, but changing these attributes is
often more difficult and costly than changing street attributes (micro scale walkability). As a way of
providing general characterization information as well as specific diagnosis the different scales
(macro to micro) are analyzed in this research. Being one objective of this research the
implementation of a walkability measurement model suited for municipal authorities offices, special
attention should be given to the form information and results are communicated. The model should
provide outputs that could be read and understood by the main stakeholders – planning
practitioners, local authorities and population – in order to facilitate pedestrian environment
improvement actions.
Walkability is not definable as a single entity. The built environment factors that affect walking
likely differ according to other factors, namely by the user itself (if young, old, male, female, fit, unfit)
and by the walking purpose (if for transportation, if for recreation) (Handy 2005, Moudon et al. 2006)
The environmental correlates of walking may also differ according to the time of the day (day trips,
night trips), or by the region where the walking takes place (if it has harsh climate conditions) and by
other environmental and cultural variables. For the purpose of this research the model will be split in
two different approaches, consisting in the base model and the augmented model.
The augmented model
Given that there can be a walkability model for each population group and for each travel purpose,
and given that the built environment factors that influence walking differ accordingly, the relative
contribution of environmental variables within different contexts should be studied (Bourdeaudhuij et
al. 2005). The formulation of the various indicators best suited for each walkability type and their
relative importance form the augmented model. For the purpose of this research, the augmented
model is theoretically presented.
The base model
The base model consists in developing a walkability measurement model suited for the adult
pedestrian, not impaired, walking for transportation purposes during the day in a mild climate region
(Mediterranean climate).
For the purpose of this research, the model to be developed and tested is the base model.
42
4.2 Structure it
As pointed by the conceptual framework, the proposed walkability measurement methodology
accounts for:
Obtaining models suitable to different pedestrian groups, travel purposes, time of day and
climatic regions;
Obtaining a model for pedestrian attractiveness and accessibility evaluation at different
scales (global, macro, meso, micro);
Obtaining a model suitable for implementation at the Portuguese municipalities’ context
(cost effective, action oriented);
In order to fulfill this conceptual framework, GIS and MCDA methods are used. The structuring
stage, based on MCDA, is presented in the following section. Then, the next section presents the
selected criteria for analysis, followed by the GIS implementation program.
4.2.1 Structuring stage
The “structuring” stage has been considered as a fundamental and essential activity on building
multicriteria evaluation models by some authors in the field of MCDA (Batista e Silva et al. 2012).
The structuring activities should technically result on the definition of a sound operational basis for
the evaluation of options (their pros and cons) and appraisal of their impact against the author’s
multiple points of view (Bana e Costa and Beinat 2005). This phase can start by finding out the key
objectives to achieve, with a broad discussion of the issues of concern in evaluating the
attractiveness of a given option. Structuring is said to be considered a “mixture of art and science”
(ibidem) and a recursive learning process, deepening knowledge of concerns. Further steps, such
as weighting and ranking can become a formality in the process (Batista e Silva et al. 2012) (Bana
e Costa and Beinat 2005).
The key objective to achieve, in this research, is the walkability assessment of the urban
environment, translated into the development of a model for assessing the accessibility and
attractiveness of the built environment.
Model structuring is considered to be an interactive and learning process seeking to build a more or
less formal representation which integrates the objective components of the problem and the
subjective objectives of the actors, in such a way that the value-systems of the actors are made
explicit (Bana e Costa and Beinat 2005). This can be achieved through different frameworks, being
the final goal the actors’ agreement on concerns, value judgments and operational
measurement of impact descriptors.
43
For a better understanding, these concepts will be briefly defined according to MCDA literature
(ibidem):
Concerns are referred to as the relevant factors for the analysis. Their value meaning should be
well defined and perceived by everybody to avoid ambiguity and misunderstanding. A key-concern
can be an individual concern, or a cluster of concerns, which is agreed to have an evaluation. This
evaluation is done through a descriptor of impacts. A descriptor of impacts is intended to measure
(quantitatively or qualitatively) the degree to which the key concern is satisfied. The degree of
satisfaction can be framed within performance levels.
In order to reach a consensual set of concerns, one of the frameworks used in the reviewed
walkability methodologies is the group framework. In this case, a group of experts has one or
several meetings (that could be led by a facilitator as a “post-it” session) in order to find a
consensual family of concerns to be assessed, or, in practice, the built environmental factors that
are believed to have the most relevant role in walking behavior. Such framework is used, for
instance, on the work by the European Cost 358 action – Pedestrian Quality Needs (Cost 358 - B1
2010).
To date, there is still not a consensual family of key concerns related to walkability measurement.
For the most consensual built environment factors that influence walking there is not a consensual
set of judgment values. Such limitation however is being addressed through growing research in
this field. The research work hereby presented does not aim to provide the correct set of built
environment factors that influence walking and a methodology for its measurement. It does however
propose a theoretical process – the augmented model - that could be further elaborated in future
developments.
In the cited augmented model, the panel is composed by multidisciplinary experts – urban planning,
transports, social sciences and public health – providing a consensual answer to the questions
“What built environmental factors contribute to a more pedestrian friendly environment” and “How to
assess these factors”. The experts should have knowledge of the local cultural background and
urban environment in order to address specific issues that may differ from place to place.
The expert panel also agrees on the way the key concerns are operationalized through descriptors
of impacts, that is to say, how to measure them. In some cases, there are various ways of
measuring the same key-concern. As an example, let one of the key-concerns be “street
connectivity”. According to the literature, street connectivity can be measured, for a given area, by
the intersection density (number of street intersections in the area); by the proportion of cul-de-sacs
or by the average number of street segments connected by the intersection, among others (Steiner
et al. 2004). Finding the “right” or the “best suited” descriptor may depend on the urban context to
be analyzed or the analysis scale.
44
Some key-concerns, on the other hand, have little descriptors that can be unambiguously
operationalized, as for instance, “imageability”. Imageability plays a role in the perception of the
walking environment, and it is a perceptual quality of the urban space that evokes a strong image in
an observer. As defined by Kevin Lynch,“It is that shape, color, or arrangement which facilitates the
making of vividly identified, powerfully structured, highly useful mental images of the environment”
(Ewing and Handy 2009)(Lynch 1960).
The next step for the expert panel is to agree on the determination of the performance levels for
each descriptor. Setting the performance levels helps in understanding what is considered to be a
“good” impact and a “neutral” impact (from a measured value). As an example, let one key concern
be the “Sidewalk availability” and its descriptor be “sidewalk width”. According to Portuguese design
handbooks, the minimum accepted width for a sidewalk should be 1 meter (thus, becoming 1 the
“neutral” value) and a sidewalk 3 meters wide is considered to be “good”. Setting “1” and “3” as the
neutral and good performance levels seems consensual, but further questions may arise. For
instance, if a sidewalk that is 6 meters wide should be considered as being twice as “good” as a 3
meters sidewalk, or, if, in practice, it can be considered just as good. And perhaps what is
considered to be a good sidewalk differs if the question is asked in Portugal, or in Switzerland or in
India.
The performance levels can be expressed through elaborated value functions, through verbal
statements or even through pictorial representations, facilitating its interpretation. Moreover, the
definition of plausible impacts for the descriptors of the key-concerns “is often a hard task, but it
contributes decisively to well informed judgments and justified and transparent evaluation.” (Bana e
Costa and Beinat 2005).
With a set and consensual table of key-concerns, descriptors and performance levels the next
discussion stage is the estimation of the relative importance of each key-concern, or, following the
given examples, to estimate if the street connectivity is a more influent factor than the sidewalk
width for walking behavior. This stage is referred to as “weighting” and there are several
methodologies that can be used to aid this process, and specific applications for this purpose, such
as MACBETH and 1000Minds, can be found freely available16
.
Last but not least, taking in consideration that the environmental factors that influence walking may
differ together with the pedestrian group (children, elderly, adults, disabled,…); the purpose of the
trip (walking for recreation or as transportation) and with other factors such as the time of day (day
or night) or the climate zone (if it is winter and it is snowing, if it is summer and it is hot), different
walkability models could be defined by the expert group.
16
www.1000minds.com; www.m-macbeth.com
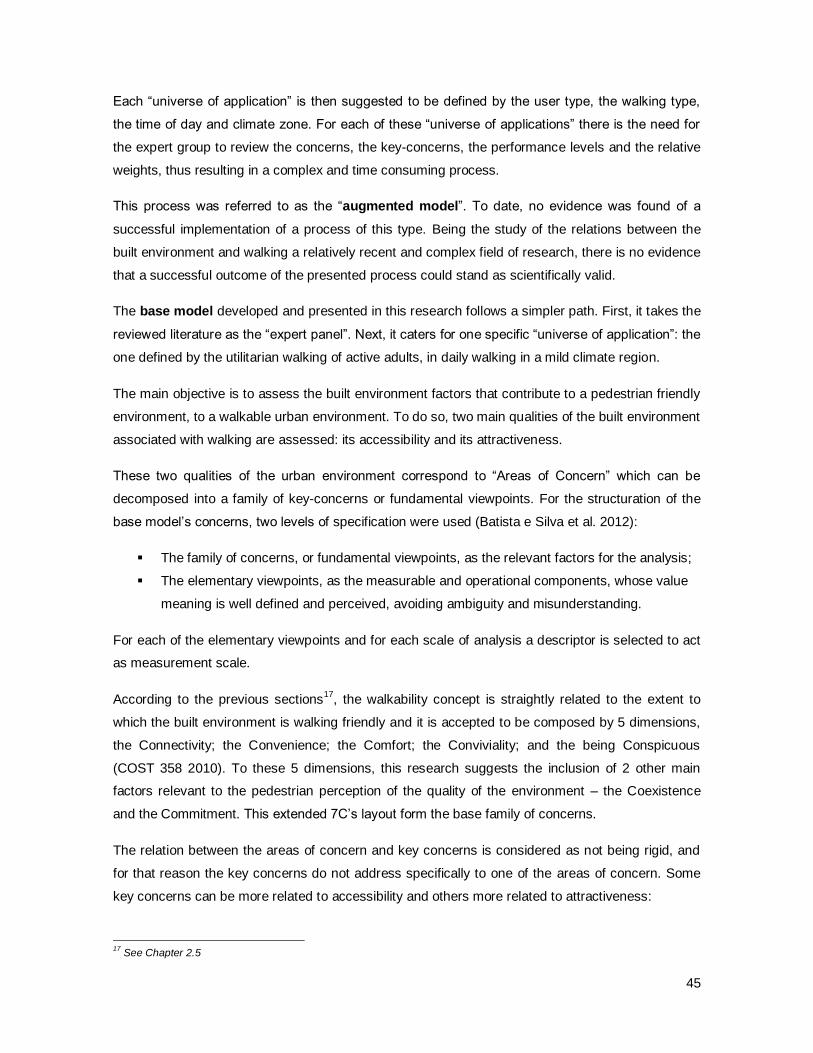
45
Each “universe of application” is then suggested to be defined by the user type, the walking type,
the time of day and climate zone. For each of these “universe of applications” there is the need for
the expert group to review the concerns, the key-concerns, the performance levels and the relative
weights, thus resulting in a complex and time consuming process.
This process was referred to as the “augmented model”. To date, no evidence was found of a
successful implementation of a process of this type. Being the study of the relations between the
built environment and walking a relatively recent and complex field of research, there is no evidence
that a successful outcome of the presented process could stand as scientifically valid.
The base model developed and presented in this research follows a simpler path. First, it takes the
reviewed literature as the “expert panel”. Next, it caters for one specific “universe of application”: the
one defined by the utilitarian walking of active adults, in daily walking in a mild climate region.
The main objective is to assess the built environment factors that contribute to a pedestrian friendly
environment, to a walkable urban environment. To do so, two main qualities of the built environment
associated with walking are assessed: its accessibility and its attractiveness.
These two qualities of the urban environment correspond to “Areas of Concern” which can be
decomposed into a family of key-concerns or fundamental viewpoints. For the structuration of the
base model’s concerns, two levels of specification were used (Batista e Silva et al. 2012):
The family of concerns, or fundamental viewpoints, as the relevant factors for the analysis;
The elementary viewpoints, as the measurable and operational components, whose value
meaning is well defined and perceived, avoiding ambiguity and misunderstanding.
For each of the elementary viewpoints and for each scale of analysis a descriptor is selected to act
as measurement scale.
According to the previous sections17
, the walkability concept is straightly related to the extent to
which the built environment is walking friendly and it is accepted to be composed by 5 dimensions,
the Connectivity; the Convenience; the Comfort; the Conviviality; and the being Conspicuous
(COST 358 2010). To these 5 dimensions, this research suggests the inclusion of 2 other main
factors relevant to the pedestrian perception of the quality of the environment – the Coexistence
and the Commitment. This extended 7C’s layout form the base family of concerns.
The relation between the areas of concern and key concerns is considered as not being rigid, and
for that reason the key concerns do not address specifically to one of the areas of concern. Some
key concerns can be more related to accessibility and others more related to attractiveness:
17
See Chapter 2.5
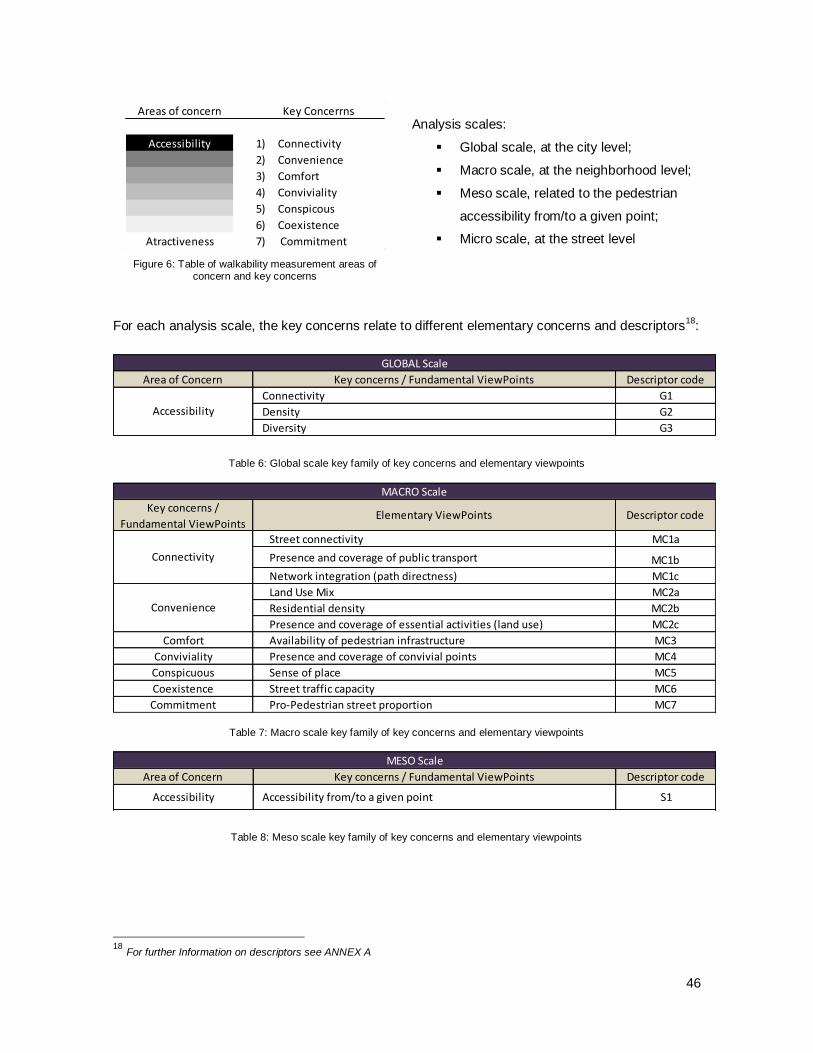
46
Figure 6: Table of walkability measurement areas of concern and key concerns
Analysis scales:
Global scale, at the city level;
Macro scale, at the neighborhood level;
Meso scale, related to the pedestrian
accessibility from/to a given point;
Micro scale, at the street level
For each analysis scale, the key concerns relate to different elementary concerns and descriptors18
:
Table 6: Global scale key family of key concerns and elementary viewpoints
Table 7: Macro scale key family of key concerns and elementary viewpoints
Table 8: Meso scale key family of key concerns and elementary viewpoints
18
For further Information on descriptors see ANNEX A
Areas of concern Key Concerrns
Accessibility 1) Connectivity
2) Convenience
3) Comfort
4) Conviviality
5) Conspicous
6) Coexistence
Atractiveness 7) Commitment
Area of Concern Key concerns / Fundamental ViewPoints Descriptor code
Connectivity G1
Density G2
Diversity G3
Accessibility
GLOBAL Scale
Key concerns /
Fundamental ViewPointsElementary ViewPoints Descriptor code
Street connectivity MC1a
Presence and coverage of public transport MC1b
Network integration (path directness) MC1c
Land Use Mix MC2a
Residential density MC2b
Presence and coverage of essential activities (land use) MC2c
Comfort Availability of pedestrian infrastructure MC3
Conviviality Presence and coverage of convivial points MC4
Conspicuous Sense of place MC5
Coexistence Street traffic capacity MC6
Commitment Pro-Pedestrian street proportion MC7
MACRO Scale
Connectivity
Convenience
Area of Concern Key concerns / Fundamental ViewPoints Descriptor code
Accessibility Accessibility from/to a given point S1
MESO Scale
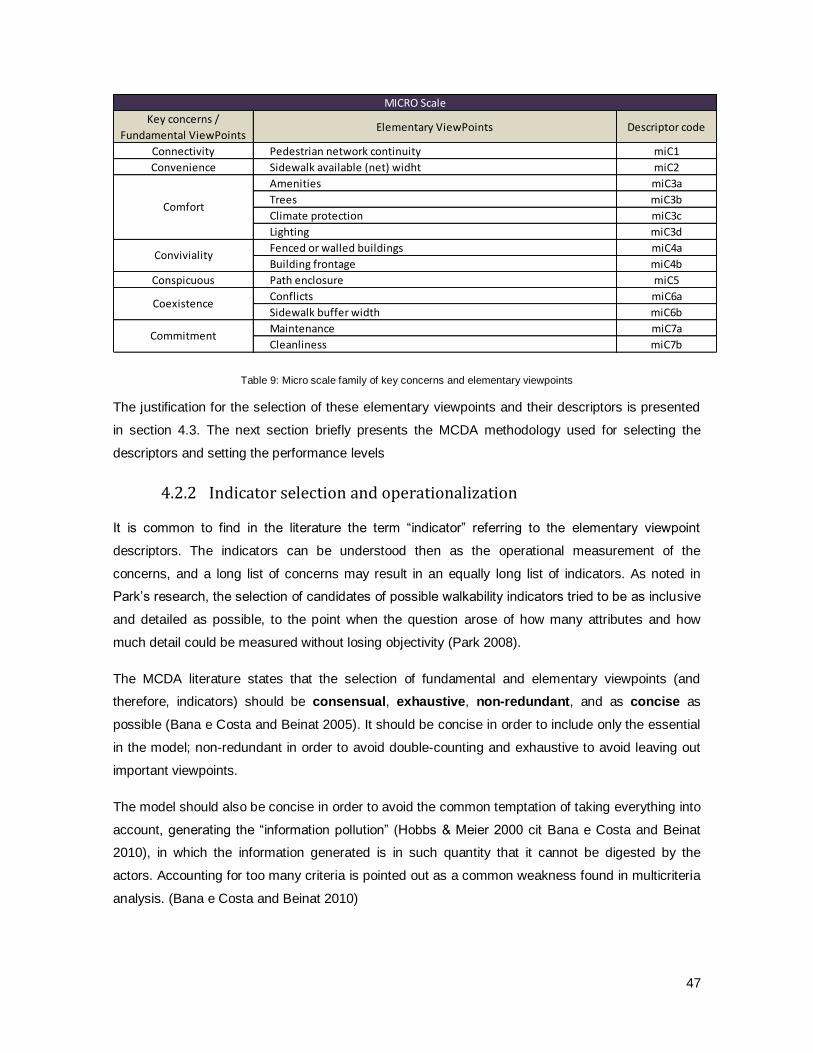
47
Table 9: Micro scale family of key concerns and elementary viewpoints
The justification for the selection of these elementary viewpoints and their descriptors is presented
in section 4.3. The next section briefly presents the MCDA methodology used for selecting the
descriptors and setting the performance levels
4.2.2 Indicator selection and operationalization
It is common to find in the literature the term “indicator” referring to the elementary viewpoint
descriptors. The indicators can be understood then as the operational measurement of the
concerns, and a long list of concerns may result in an equally long list of indicators. As noted in
Park’s research, the selection of candidates of possible walkability indicators tried to be as inclusive
and detailed as possible, to the point when the question arose of how many attributes and how
much detail could be measured without losing objectivity (Park 2008).
The MCDA literature states that the selection of fundamental and elementary viewpoints (and
therefore, indicators) should be consensual, exhaustive, non-redundant, and as concise as
possible (Bana e Costa and Beinat 2005). It should be concise in order to include only the essential
in the model; non-redundant in order to avoid double-counting and exhaustive to avoid leaving out
important viewpoints.
The model should also be concise in order to avoid the common temptation of taking everything into
account, generating the “information pollution” (Hobbs & Meier 2000 cit Bana e Costa and Beinat
2010), in which the information generated is in such quantity that it cannot be digested by the
actors. Accounting for too many criteria is pointed out as a common weakness found in multicriteria
analysis. (Bana e Costa and Beinat 2010)
Key concerns /
Fundamental ViewPointsElementary ViewPoints Descriptor code
Connectivity Pedestrian network continuity miC1
Convenience Sidewalk available (net) widht miC2
Amenities miC3a
Trees miC3b
Climate protection miC3c
Lighting miC3d
Fenced or walled buildings miC4a
Building frontage miC4b
Conspicuous Path enclosure miC5
Conflicts miC6a
Sidewalk buffer width miC6b
Maintenance miC7a
Cleanliness miC7b
MICRO Scale
Comfort
Conviviality
Commitment
Coexistence
48
In the scope of this research, the walkability indicators were drawn from the literature19
, forming a
table of several dozens of possible indicators. A screening process was applied in order to achieve
a group of viewpoints that fulfilled the above conditions.
Having a consensual, exhaustive, non-redundant and concise table of elementary viewpoints and
their descriptors, the next step is to operationalize its measurement, or better, the measurement of
the impact levels. This can be done through performance levels, which consist in an ordinal set of
impacts, given by ordinal value functions or ordered scales.
The ordered scales can be quantitative, qualitative, discrete, continuous, direct, indirect or pictorial,
being the most important issue that the value scales used should describe unambiguously an
ordered set of impact levels according to a given viewpoint (Batista e Silva et al. 2012),(Bana e
Costa and Beinat 2010).
A continuous scale of impacts means that the observed variable can assume any value within a
variable scale, such in measuring the width of a sidewalk. A discrete scale of impacts means that
the observed variables can only take predefined values as part of the scale definition. In this case,
the same variable “sidewalk width” could have the value 0 if the width is, for instance, under 1 meter
wide; the value 1 if the sidewalk is wider than 1 meter but under 3 meters and the value 2 if the
sidewalk is wider than 3 meters (Abley and Turner 2011).
Discrete scales are often found in walkability methodologies, describing a qualitative judgment that
vary from -3 (worst situation) to +3 (best situation). When dealing with such qualitative judgements
the description of impacts should be as detailed as possible. This is not always the case in the
reviewed literature, as discrete impact scales of “good”, “average” and “bad” conditions do not
describe what is meant by “good”, “bad” and “average”. The lack of objective definitions does not
contribute to the transparency of the assessment and leads to ambiguity (Bana e Costa and Beinat
2010).
One alternative to overcome the difficulty in describing the performance levels is the use of pictorial
scales. These scales are often found in walkability methodologies, describing a qualitative judgment
by the means of pictures. For instance, in describing pavement quality it might be easier to use a
set of pictures indicating what is understood by “good”, “average” or “bad” conditions rather than
describing verbally each case. Other pictorial scales include drawings, videos, computer simulation,
etc (Ewing and Handy 2009).
The use of quantitative scales is more objective but it may reveal itself insufficient to capture the
pedestrian environment to a satisfatory degree. In a recent research aiming the estimation of
pedestrian level of service, it was found that the inclusion of both quantitative and qualitative
19
See Chapter 3
49
parameters gave a more satisfatory result than using only quantitative or qualitative parameters.
The use of only quantitative parameters resulted frequently in overestimation or underestimation of
the level of service, whilst the use of qualitative parameters only increased the risk of biased result
(Christopoulou and Pitsiava-Lationopolou 2012).
In this research both quantitative and qualitative analysis are used. Each one is given at least two
performance levels – the “base” or “neutral” value and the “good” or “goal” value. These values
work in practice as anchors for the value scales and are given the standard values of 0 and 100
respectively. In the case of qualitative analysis other impact levels are created, corresponding to
plausible performances.
The definition of the levels of reference “neutral” and “good” is considered very important in building
descriptors and their analysis (Bana e Costa 2002 cit Batista e Silva et al. 2012), but most of the
reviewed walkability methodologies does not define levels of reference.
4.3 Score it
This section presents the selected elementary viewpoints and respective descriptors. The selection
was made from an exhaustive list of potential walkability indicators found in the literature review. A
screening process allowed gathering a set of elementary viewpoints and descriptors (indicators)
believed to be consensual, exhaustive, non-redundant, concise, independent and operational:
Consensual – the family of key concerns selected (see Table 9) consist, as much as
possible, in the built environmental correlates whose relation to walking has been
scientifically validated;
Exhaustive – the different dimensions of the walkability concept are considered, meaning
the fundamental perspectives are represented;
Non redundant – redundant descriptors were eliminated by the screening process;
Concise – the number of elementary viewpoints taken into analysis was limited by the
screening process, both for implementation ease and to avoid the “information pollution”;
Independent – the various environmental factors are all somewhat linked but all the
selected indicators were tested for cardinal independence. This means that any of them can
have an observed behavior that does not depend on the behavior of other;
Operational – all of the descriptors selected are operational in the Portuguese municipal
context.
The selected viewpoints and descriptors reflect the researcher’s point of view. The whole process,
from the selection of the walkability dimensions (the 7C layout) as fundamental viewpoints to the
50
filing of a certain elementary viewpoint under a certain dimension, can be a source for discussion
and further development. Such discussion is positive and can result in clearer, consensual results.
For a more detailed description of the selected indicators, see Annexes A and B.
4.3.1 Global SCALE
The Global scale walkability assessment consists in the application of a composite walkability
indicator developed by Frank (Frank et al. 2005) and adapted by Schmid (Schmid 2006). This
indicator has been applied to a single neighborhood in the original version and to a whole city (all its
neighborhoods) in the adapted version.
Its calculation expression (in the original version) is as follows
( ) ( )
( )
Where,
z-score: means a normalized value has been used
Land use mix: it is an expression of entropy, given by: ∑ ( )
Where p = proportion of land use i (measured in terms of floor area)
and k = quantity of different uses (3 different land uses have been considered: residential, commercial
and offices)
Net residential density: given by the number of households divided by the total area of
residential land use.
Intersection density: given by the number of street intersections by km2
This same indicator can be read, according to this research’s notation as follows:
For the walkability classification of Zurich neighborhood (Schmid 2006), the indicator has been
adapted, being changed:
in Land use mix – the quantity k of land uses was set to 4, being the 4 land uses the
residential, commercial, offices and productive functions.
Walkability index, Frank et al 2005
Area of Concern Fundamental ViewPoints Descriptor
Accessibility
Connectivity Intersection Density
Density Net residential density
Diversity Land Use Mix
Table 10 : Walkability index
51
in Intersection density - only intersections connecting 4 or more segments were taken in
calculation
The calculation expression was also changed, to an equal weighting expression:
( ) ( )
( )
The same indicator has been used in practice in two different contexts with small but notorious
changes. This means that the same concept was measured in two different ways, changing the
descriptors and the weightings but keeping the key concerns (or fundamental viewpoints).
The straight application of this indicator within our study context reveals to be not an easy task:
For the calculation of the land use mix, there is no statistical data available regarding land
uses’ floor area occupation or proportion;
For the calculation of the net residential area, there is no statistical data available regarding
allocated areas for residential land use;
For the calculation of the intersection density, there is no statistical or geographic data
available suitable for counting the existing street intersections.
The index is again adapted in terms of its descriptors, allowing to perform a coarse grain analysis to
the Lisbon’s parishes21
,:
Potential Walkability indicator
Area of Concern Fundamental ViewPoints Descriptor
Accessibility
Connectivity Street Density
Density Gross residential density
Diversity Land Use Mix
Table 11: Potential walkability indicator
With the descriptors being:
Street density: street density has been described has being an alternative connectivity
indicator (Steiner et al. 2004), being calculated by the total length of street segments
divided by the study area surface;
Gross residential density: given by the number of households divided by the total surface
of the study area (the parish area, in this case);
21
In portuguese, “freguesias”
52
Land use mix: the floor area was substituted by the number of buildings with residential
use, mixed use and non-residential use. The objective of the LUM descriptor is to assess if
there is a proportional distribution of the various land uses. If all land uses are equally
represented, then LUM=1. If only one land use is represented, then LUM=0. In this case,
the buildings may be fully residential, mixed (residential + commerce, services or offices) or
fully non-residential (commerce, services, offices or even productive activities), becoming
an alternative descriptor for the viewpoint “diversity”.
The resulting expression is then:
( ) ( )
( )
4.3.2 MACRO SCALE
The descriptors of the macro scale are further detailed in Annex A. All the descriptors used for the
macro scale are quantitative.
Table 12: Macro scale descriptors, thresholds and normalization
In order to convert the observation values to the threshold scale, or in other words, to generate a
value function, a linear transformation is used. For simplification reasons it is admitted that the
values for each descriptor vary in a linear way. To the base value is assigned the standard value of
0 (no impact or satisfaction) and to the goal value is assigned the standard value of 100 (biggest
impact or satisfaction). This means that all measured values will be scored in a 0 to 100 scale.
Descriptor
codeDescriptor
Base
value
Goal
valuemx b
MC1a Link to Node ratio 1 2,5 66,67 -66,67
MC1b Coverage of public transport 0 100 1 0
MC1c Network Intergration 2 1 -100 200
MC2a Land use entropy indicator 0 1 100 0
MC2b Residential density 40 200 1 -25
MC2c Coverage of essential activities 0 100 1 0
MC3 Coverage of sidewalk 50 100 2 -100
MC4 Coverage of convivial points 0 100 1 0
MC5 Building age entropy indicator 1 0 -100 100
MC6 Average number of traffic lanes 4 0 -25 100
MC7 Proportion of pedestrian friendly streets 0 100 1 0
Thresholds Normalization Macro Scale
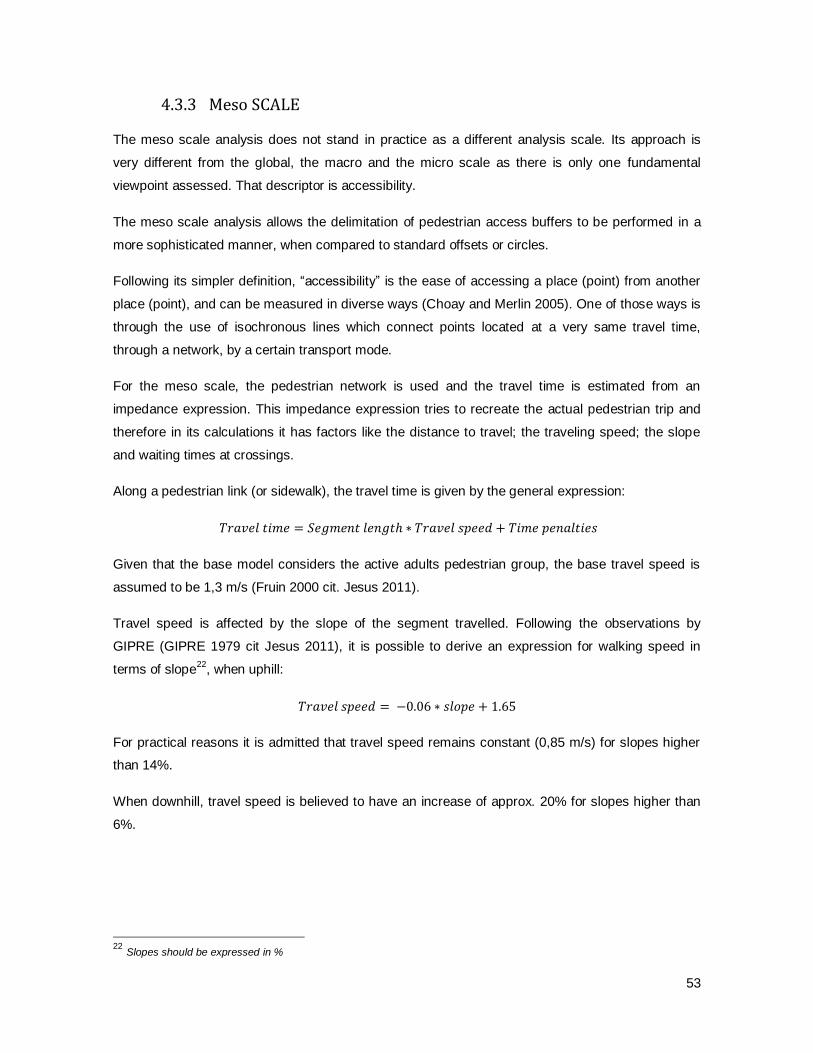
53
4.3.3 Meso SCALE
The meso scale analysis does not stand in practice as a different analysis scale. Its approach is
very different from the global, the macro and the micro scale as there is only one fundamental
viewpoint assessed. That descriptor is accessibility.
The meso scale analysis allows the delimitation of pedestrian access buffers to be performed in a
more sophisticated manner, when compared to standard offsets or circles.
Following its simpler definition, “accessibility” is the ease of accessing a place (point) from another
place (point), and can be measured in diverse ways (Choay and Merlin 2005). One of those ways is
through the use of isochronous lines which connect points located at a very same travel time,
through a network, by a certain transport mode.
For the meso scale, the pedestrian network is used and the travel time is estimated from an
impedance expression. This impedance expression tries to recreate the actual pedestrian trip and
therefore in its calculations it has factors like the distance to travel; the traveling speed; the slope
and waiting times at crossings.
Along a pedestrian link (or sidewalk), the travel time is given by the general expression:
Given that the base model considers the active adults pedestrian group, the base travel speed is
assumed to be 1,3 m/s (Fruin 2000 cit. Jesus 2011).
Travel speed is affected by the slope of the segment travelled. Following the observations by
GIPRE (GIPRE 1979 cit Jesus 2011), it is possible to derive an expression for walking speed in
terms of slope22
, when uphill:
For practical reasons it is admitted that travel speed remains constant (0,85 m/s) for slopes higher
than 14%.
When downhill, travel speed is believed to have an increase of approx. 20% for slopes higher than
6%.
22
Slopes should be expressed in %
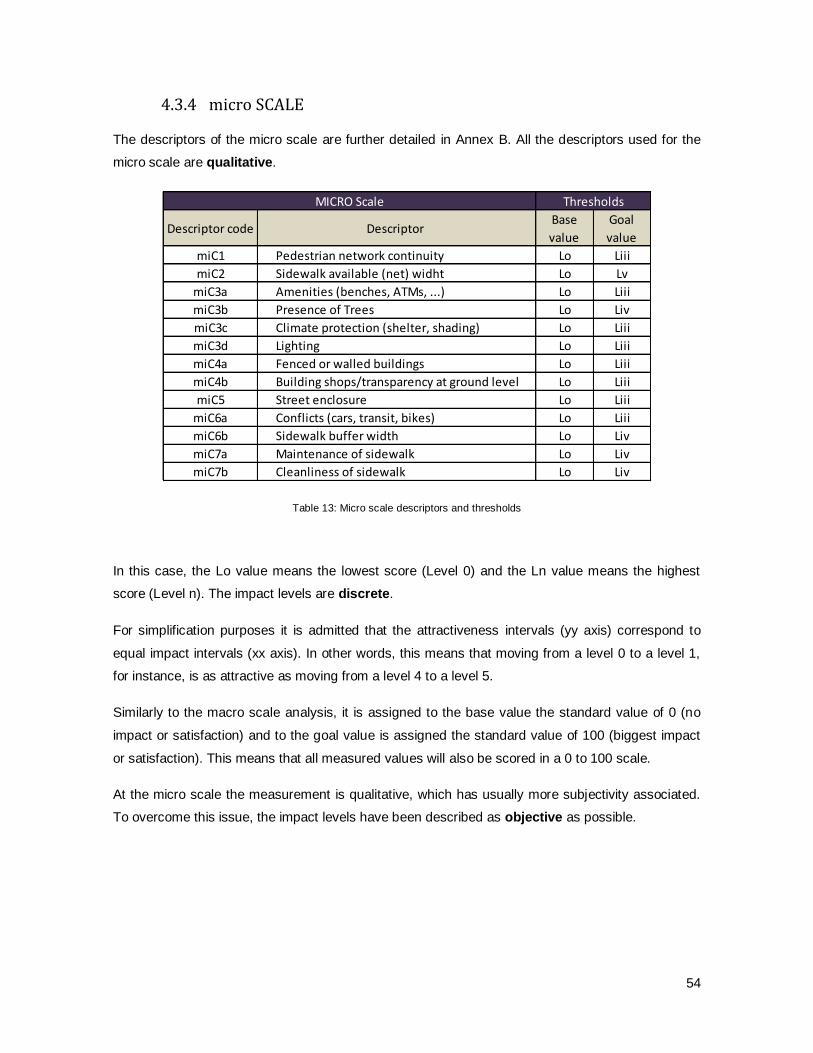
54
4.3.4 micro SCALE
The descriptors of the micro scale are further detailed in Annex B. All the descriptors used for the
micro scale are qualitative.
Table 13: Micro scale descriptors and thresholds
In this case, the Lo value means the lowest score (Level 0) and the Ln value means the highest
score (Level n). The impact levels are discrete.
For simplification purposes it is admitted that the attractiveness intervals (yy axis) correspond to
equal impact intervals (xx axis). In other words, this means that moving from a level 0 to a level 1,
for instance, is as attractive as moving from a level 4 to a level 5.
Similarly to the macro scale analysis, it is assigned to the base value the standard value of 0 (no
impact or satisfaction) and to the goal value is assigned the standard value of 100 (biggest impact
or satisfaction). This means that all measured values will also be scored in a 0 to 100 scale.
At the micro scale the measurement is qualitative, which has usually more subjectivity associated.
To overcome this issue, the impact levels have been described as objective as possible.
Descriptor code Descriptor Base
value
Goal
value
miC1 Pedestrian network continuity Lo Liii
miC2 Sidewalk available (net) widht Lo Lv
miC3a Amenities (benches, ATMs, ...) Lo Liii
miC3b Presence of Trees Lo Liv
miC3c Climate protection (shelter, shading) Lo Liii
miC3d Lighting Lo Liii
miC4a Fenced or walled buildings Lo Liii
miC4b Building shops/transparency at ground level Lo Liii
miC5 Street enclosure Lo Liii
miC6a Conflicts (cars, transit, bikes) Lo Liii
miC6b Sidewalk buffer width Lo Liv
miC7a Maintenance of sidewalk Lo Liv
miC7b Cleanliness of sidewalk Lo Liv
ThresholdsMICRO Scale
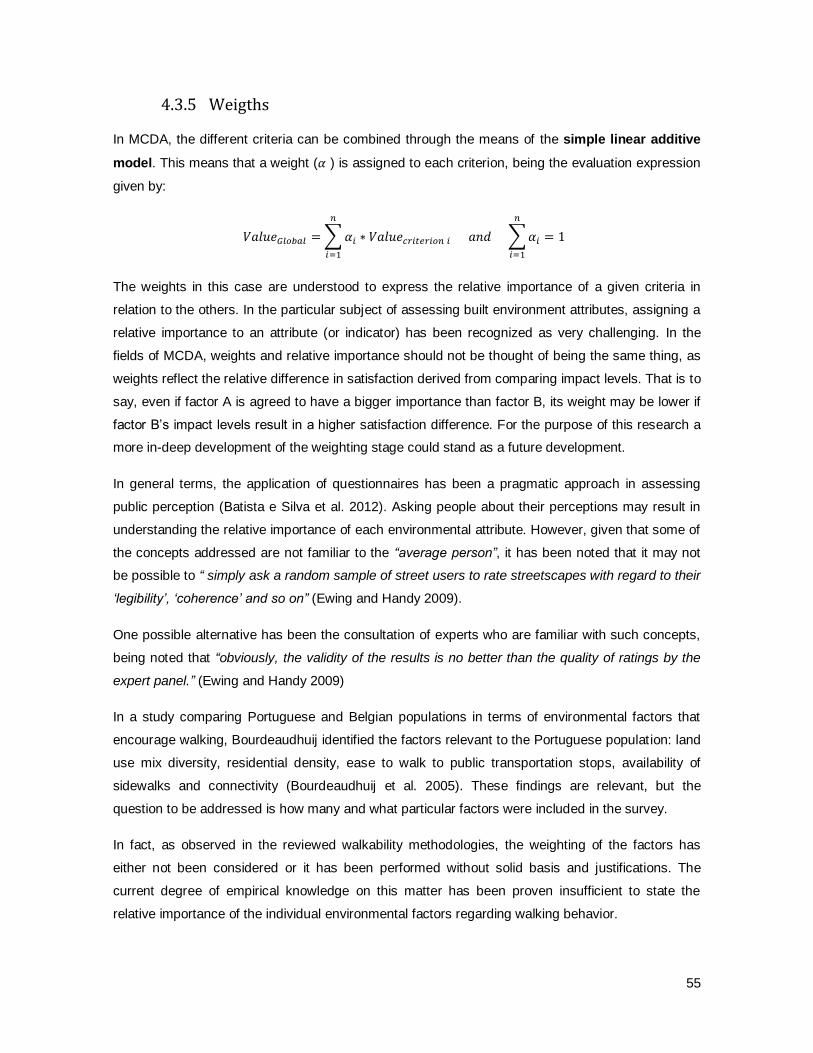
55
4.3.5 Weigths
In MCDA, the different criteria can be combined through the means of the simple linear additive
model. This means that a weight ( ) is assigned to each criterion, being the evaluation expression
given by:
∑ ∑
The weights in this case are understood to express the relative importance of a given criteria in
relation to the others. In the particular subject of assessing built environment attributes, assigning a
relative importance to an attribute (or indicator) has been recognized as very challenging. In the
fields of MCDA, weights and relative importance should not be thought of being the same thing, as
weights reflect the relative difference in satisfaction derived from comparing impact levels. That is to
say, even if factor A is agreed to have a bigger importance than factor B, its weight may be lower if
factor B’s impact levels result in a higher satisfaction difference. For the purpose of this research a
more in-deep development of the weighting stage could stand as a future development.
In general terms, the application of questionnaires has been a pragmatic approach in assessing
public perception (Batista e Silva et al. 2012). Asking people about their perceptions may result in
understanding the relative importance of each environmental attribute. However, given that some of
the concepts addressed are not familiar to the “average person”, it has been noted that it may not
be possible to “ simply ask a random sample of street users to rate streetscapes with regard to their
‘legibility’, ‘coherence’ and so on” (Ewing and Handy 2009).
One possible alternative has been the consultation of experts who are familiar with such concepts,
being noted that “obviously, the validity of the results is no better than the quality of ratings by the
expert panel.” (Ewing and Handy 2009)
In a study comparing Portuguese and Belgian populations in terms of environmental factors that
encourage walking, Bourdeaudhuij identified the factors relevant to the Portuguese population: land
use mix diversity, residential density, ease to walk to public transportation stops, availability of
sidewalks and connectivity (Bourdeaudhuij et al. 2005). These findings are relevant, but the
question to be addressed is how many and what particular factors were included in the survey.
In fact, as observed in the reviewed walkability methodologies, the weighting of the factors has
either not been considered or it has been performed without solid basis and justifications. The
current degree of empirical knowledge on this matter has been proven insufficient to state the
relative importance of the individual environmental factors regarding walking behavior.
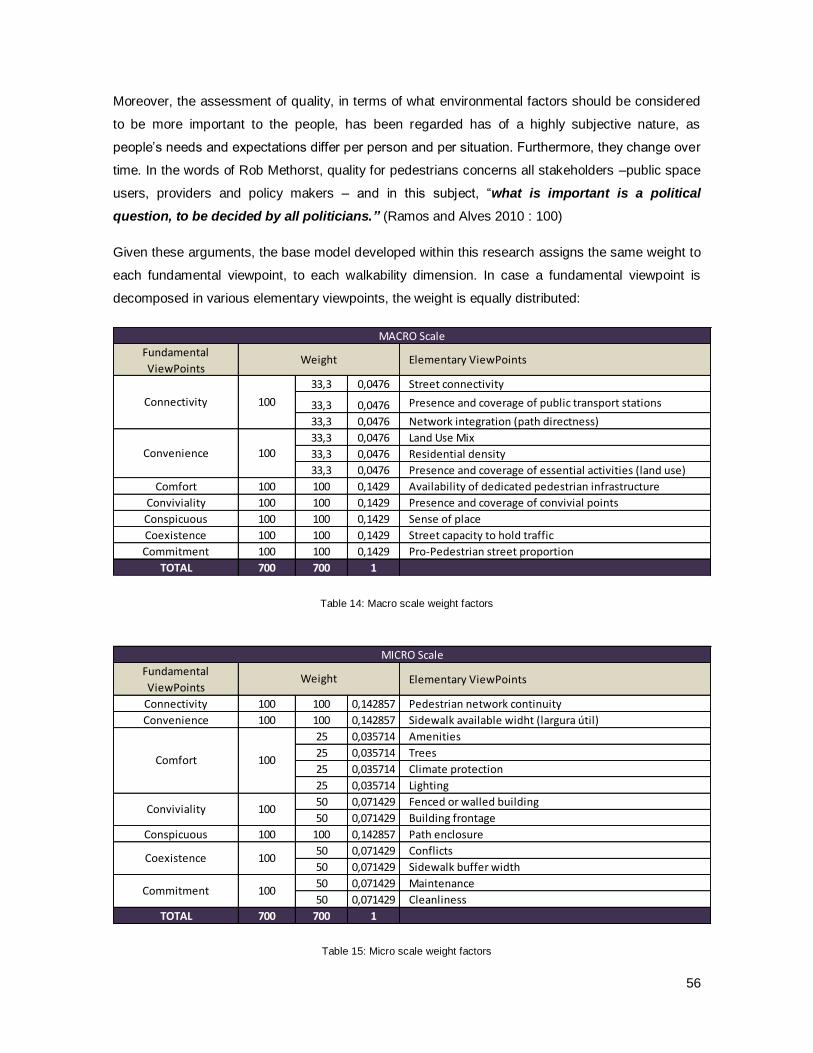
56
Moreover, the assessment of quality, in terms of what environmental factors should be considered
to be more important to the people, has been regarded has of a highly subjective nature, as
people’s needs and expectations differ per person and per situation. Furthermore, they change over
time. In the words of Rob Methorst, quality for pedestrians concerns all stakeholders –public space
users, providers and policy makers – and in this subject, “what is important is a political
question, to be decided by all politicians.” (Ramos and Alves 2010 : 100)
Given these arguments, the base model developed within this research assigns the same weight to
each fundamental viewpoint, to each walkability dimension. In case a fundamental viewpoint is
decomposed in various elementary viewpoints, the weight is equally distributed:
Table 14: Macro scale weight factors
Table 15: Micro scale weight factors
Fundamental
ViewPointsElementary ViewPoints
33,3 0,0476 Street connectivity
33,3 0,0476 Presence and coverage of public transport stations
33,3 0,0476 Network integration (path directness)
33,3 0,0476 Land Use Mix
33,3 0,0476 Residential density
33,3 0,0476 Presence and coverage of essential activities (land use)
Comfort 100 100 0,1429 Availability of dedicated pedestrian infrastructure
Conviviality 100 100 0,1429 Presence and coverage of convivial points
Conspicuous 100 100 0,1429 Sense of place
Coexistence 100 100 0,1429 Street capacity to hold traffic
Commitment 100 100 0,1429 Pro-Pedestrian street proportion
TOTAL 700 700 1
Connectivity
Convenience
100
100
Weight
MACRO Scale
Fundamental
ViewPointsElementary ViewPoints
Connectivity 100 100 0,142857 Pedestrian network continuity
Convenience 100 100 0,142857 Sidewalk available widht (largura útil)
25 0,035714 Amenities
25 0,035714 Trees
25 0,035714 Climate protection
25 0,035714 Lighting
50 0,071429 Fenced or walled building
50 0,071429 Building frontage
Conspicuous 100 100 0,142857 Path enclosure
50 0,071429 Conflicts
50 0,071429 Sidewalk buffer width
50 0,071429 Maintenance
50 0,071429 Cleanliness
TOTAL 700 700 1
100
100
Comfort
Conviviality
Coexistence
100
100
MICRO Scale
Commitment
Weight
57
An alternative approach would be to assign equal weights to each elementary viewpoint. Different
weights can also be assigned according to the analysis context, for instance in case of assessing
the micro scale environment of a school surrounding. As children are more vulnerable pedestrians,
more importance (in terms of weight value) could be given to the coexistence dimension.
With the established weights, the macro walkability calculation expression is:
Being assessed 11 environmental factors and the result being given in a 0 to 100 interval.
And the micro walkability calculation expression is:
Being assessed 13 environmental factors and the result being given in a 0 to 100 interval
4.4 Assemble it
This section presents the operational stage of the base model. It briefly describes the data to be
collected and particular GIS implementation concerns.
GIS frameworks have been widely adopted in walkability measurement methodologies. One of the
reasons is its ability to work at all geographic scales, from a city to a street segment, to a single
point in that street. Another reason has to do with its ability to perform complex network analysis.
This research uses the Esri ArcGis 9.3 student package with the Network Analyst extension.
58
Data collection
The data used in this research has different sources:
Statistical data: regarding population, housing, buildings and travel patterns were obtained
from the Portuguese statistical institute (INE), and unless noted, belong to the Census
collection of 2001;
Geographical data: regarding street network, urban layout (buildings) and administrative
limits were obtained from CESUR, the research centre for urban and system studies of the
IST, and has no date associated;
Field data: regarding land uses and observation of environmental attributes was obtained
by own field sessions during June 2012.
Delimitation of the study area
For the global scale of analysis, the study area is the city of Lisbon. Its boundaries are well defined
as they are coincident with the administrative limits of its parishes.
For the macro scale of analysis, the delimitation of the study area encompasses several issues.
First, there is the concept of “neighborhood”, as in Portugal neighborhoods are not defined by
administrative boundaries. This issue has been addressed by Frank (Frank et al. 2005),
operationalizing a neighborhood as the area within walking limits of each person’s home, to the
extent of a 1km buffer limit. In this research the delimitation of the study area is made in accordance
to the limits suggested in Lisbon’s Urban Atlas (Salgado and Lourenço 2006).
Second, and probably more significant, there is the issue of the interaction of people with their local
environment, aas studies have shown that movement patterns are globally, and not locally,
defined(Hillier et al. 1993). Neighborhoods are not isolated entities, they from part of the city’s
whole body. In order to address travel patterns within a site, it is suggested to analyze the
surrounding environment as well, at the “cathment area”, what may displace any “edge effect” in the
spatial analysis. (Hillier et al. 1993) In this research, the catchment area was limited to the visual
extent of the neighborhood boundaries. That is to say, certain features located outside the study
area were included in the analysis (namely essential land uses and convivial points). The public
transport stops located outside the study area were also included in the analysis, being visible or
not from the boundaries of the neighborhood.
The meso scale area delimitation poses no concern. Being a network analysis, it is naturally limited
by the extent to which the network is built in ArcGIS. At the micro scale, there is also no study area
delimitation as the analysis is made for each single segment.
59
Street network and Pedestrian network
To perform the network analysis, two separate networks are designed. One is the street network,
concerns the streets and is based on the collected geographic data.23
The other is the pedestrian
network, concerns the sidewalks and crossings, and is based on the collected geographic data24
and field observation. Each network has specific attributes. The street network attributes are mainly
analyzed at macro scale (type of street, number of lanes, etc.) while the pedestrian network
attributes are analyzed at micro level (sidewalk width, obstacles, maintenance, etc.). The pedestrian
network elements are the sidewalk links, street crossings or links to buildings (dummy links),
existing in different layers and connected by nodes25
.
The pedestrian network is used to perform the meso scale accessibility analysis and therefore each
segment has an associated impedance factor, expressed in terms of travel time26
. The Network
Analyst extension of ArcGis allows to distinguish the direction of the movement (being referrered as
a To-From movement or a From-To movement) allowing the determination of distinct impedances. It
is then possible to consider uphill or downhill movements, which, for the same traveled length, may
have different travel times. Another Network Analyst feature is the possibility of performing multi-
layer analysis, meaning that crossing’s penalty time (waiting time) is combined with the sidewalk
segments travel time. Dummy links have a travel time equal to 0.
4.4.1 Model calibration and validation
For the most objective scale of analysis – the meso scale – a calibration factor is included for each
impedance expression, allowing to change the users base speed (thus simulating younger or older
pedestrian) or waiting time at street crossings.
In the case of macro and micro scales, calibration is be done by tinkering with the value functions,
the thresholds and the impact levels. It is also possible to calibrate the model through the weighting
of the criteria.
The validation of the results is an issue27
. In the developed practical applications, model validation
is only done, to some extent, at the global scale. For the macro scale model validation, a larger set
of observations is needed and it stands as a further development of this research.
For the meso scale, validation is done by comparison of the estimated travel times with actual (on
site) travel times. For the micro scale model validation can be done by means of questionnaire
queries, public session meetings or group rating. These methods are considered to be the most
23
Road axis, or Eixos de via 24
Building layout or Planimetria 25
See ANNEX D 26
See chapter 4.3.1 27
See chapter 3.3
60
reliable in addressing people’s perception of the environment. They are however, time and resource
consuming. One alternative would be to use pedestrian flow measurement. This type of validation is
not done without limitations, as people do not necessarily walk in the most walkable streets, they
walk where they consider their needs, abilities and opportunities are satisfied, and many factors,
other than urban environment influence their choices and travel patterns.
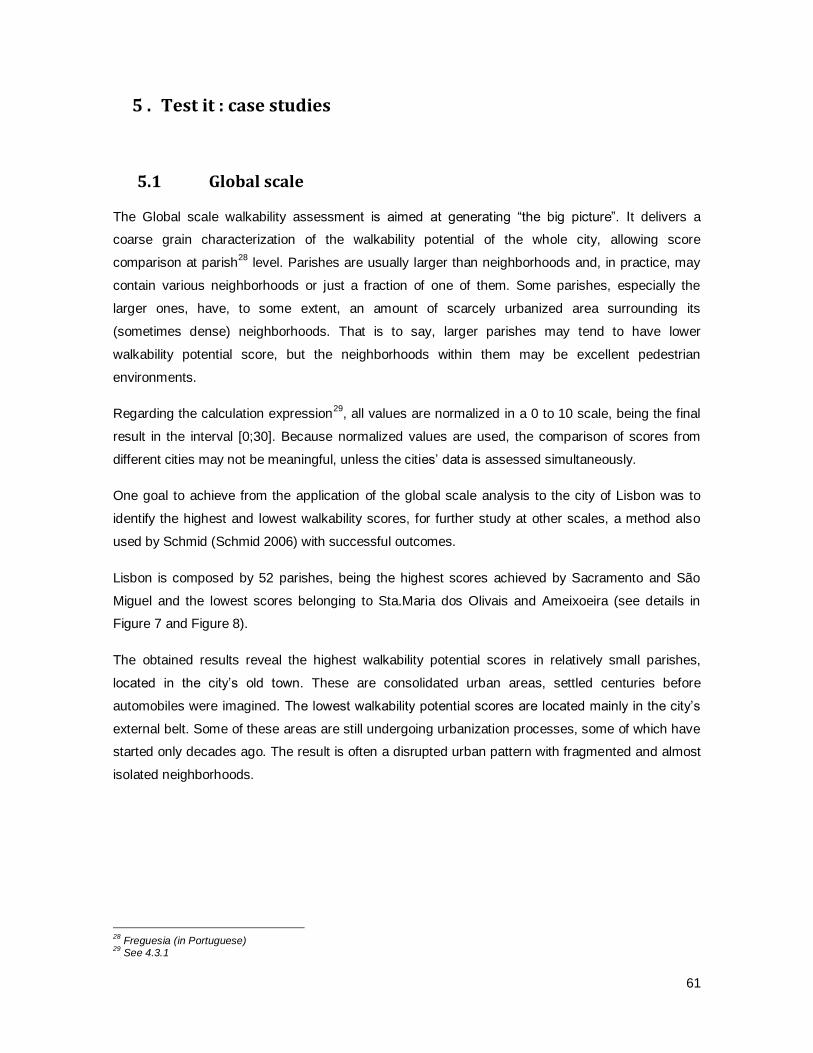
61
5 . Test it : case studies
5.1 Global scale
The Global scale walkability assessment is aimed at generating “the big picture”. It delivers a
coarse grain characterization of the walkability potential of the whole city, allowing score
comparison at parish28
level. Parishes are usually larger than neighborhoods and, in practice, may
contain various neighborhoods or just a fraction of one of them. Some parishes, especially the
larger ones, have, to some extent, an amount of scarcely urbanized area surrounding its
(sometimes dense) neighborhoods. That is to say, larger parishes may tend to have lower
walkability potential score, but the neighborhoods within them may be excellent pedestrian
environments.
Regarding the calculation expression29
, all values are normalized in a 0 to 10 scale, being the final
result in the interval [0;30]. Because normalized values are used, the comparison of scores from
different cities may not be meaningful, unless the cities’ data is assessed simultaneously.
One goal to achieve from the application of the global scale analysis to the city of Lisbon was to
identify the highest and lowest walkability scores, for further study at other scales, a method also
used by Schmid (Schmid 2006) with successful outcomes.
Lisbon is composed by 52 parishes, being the highest scores achieved by Sacramento and São
Miguel and the lowest scores belonging to Sta.Maria dos Olivais and Ameixoeira (see details in
Figure 7 and Figure 8).
The obtained results reveal the highest walkability potential scores in relatively small parishes,
located in the city’s old town. These are consolidated urban areas, settled centuries before
automobiles were imagined. The lowest walkability potential scores are located mainly in the city’s
external belt. Some of these areas are still undergoing urbanization processes, some of which have
started only decades ago. The result is often a disrupted urban pattern with fragmented and almost
isolated neighborhoods.
28
Freguesia (in Portuguese) 29
See 4.3.1
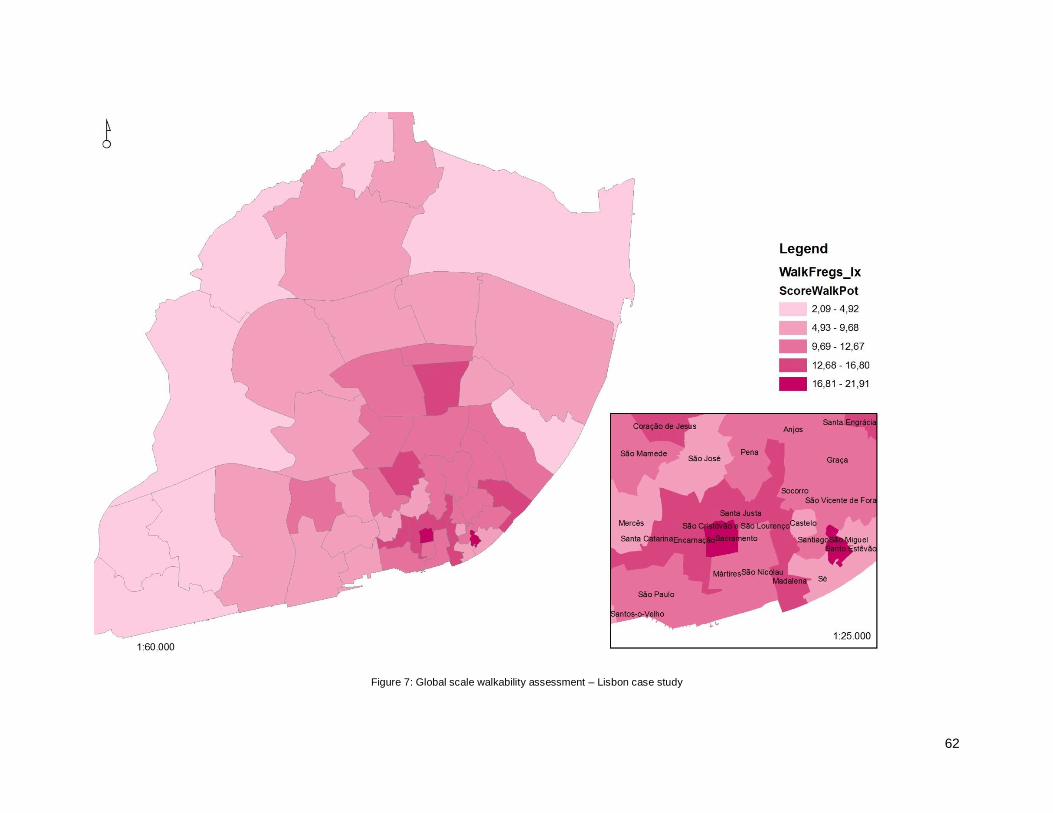
62
Figure 7: Global scale walkability assessment – Lisbon case study
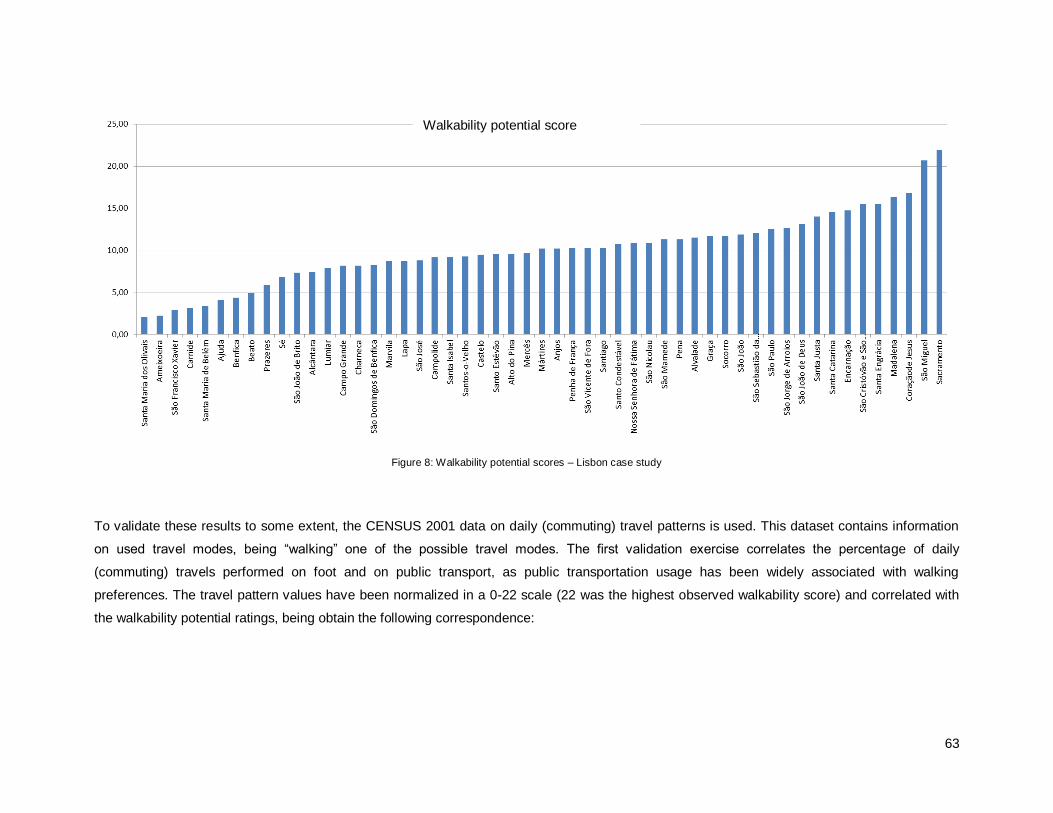
63
Figure 8: Walkability potential scores – Lisbon case study
To validate these results to some extent, the CENSUS 2001 data on daily (commuting) travel patterns is used. This dataset contains information
on used travel modes, being “walking” one of the possible travel modes. The first validation exercise correlates the percentage of daily
(commuting) travels performed on foot and on public transport, as public transportation usage has been widely associated with walking
preferences. The travel pattern values have been normalized in a 0-22 scale (22 was the highest observed walkability score) and correlated with
the walkability potential ratings, being obtain the following correspondence:
Walkability potential score
64
Figure 9: Correlation between walkability potential scores and commuter trips done on foot and by public transport
A positive relation is observed, although moderate (R2 = 0.34).A second validation exercise considers only the proportion of commuting trips
declared to be done on foot, or in other words, the pedestrian commuters.
The correlation between the walkability potential and the percentage of pedestrian commuters is again positive yet higher, with a correlation
factor equal to 0,73 (Pearson’s r= 0,73; R2= 0.58) (Figure 10)
The obtained correlation factor suggests that, even at a coarse grain analysis as this one, certain built environment features are associated with
travelling behavior, namely with walking.
One of the parishes with the highest percentage of pedestrian commuters and with a relatively high walkability potential is Encarnação. (see Figure
11). This parish is the next case study, presented in the next section.
Walkability potential score
Proportion transit+pedestrian commuters
Linear correlation
65
Figure 10 : Correlation between walkability potential scores and pedestrian commuter trips
Figure 11: Correlation between walkability potential scores and commuter trips done on foot – highest and lowest 10 walkability potential ranks :
Walkability potential score
Proportion pedestrian commuters
Walkability potential score
Proportion pedestrian commuters
5.2 Macro scale
From the previous analysis it has been seen that Encarnação parish is ranked among the top potential
walkability scores and, at the same time, has one of the highest proportions of pedestrian commuters.
This area was selected for the macro scale test. The Encarnação parish is located in the centre of Lisbon
and it holds one of the most popular neighborhoods of Lisbon: the Bairro Alto.
Its urbanization period goes back to the XVI century, and, according to Lisbon’s Urban Atlas(Salgado and
Lourenço 2006), “the quarter is an orthogonal grid system of narrow streets (approx.5m wide), most of
which finish in a dead end. The main streets run north-south, perpendicular to the river, some of them
being redesigned (aligned and widened) in the Renaissance period. It is a quarter of dense urbanization,
with an absence of wide open spaces and streets of identical width irrespective of their importance.”
The study area was delimited according to the boundaries proposed in the Atlas. It resulted in the
following 18,5 ha area, here shown with the field collected data: convivial points, public transport stops
and essential activities (groceries, bakeries, cafes, etc.):
Figure 12: Bairro Alto study area
The GIS analysis (detailed in ANNEX E) provided the following results and outputs:
67
Table 16: Bairro Alto Macro Walkability assessment
With WalkabilityMACRO = 75
The obtained result, 75, could be accepted as a relatively good score in terms of it being 75 out 100 and
could be accepted as excellent if no value higher than 75 in observed in Lisbon. On its own and without
having an extensive sample collection for comparison, the sole value does not provide much information.
It is also possible to assess the neighborhood ratings by environmental feature (elementary viewpoint)
and by dimension (fundamental viewpoint). It can be seen, on the radar graph, that Bairro Alto scores the
less in terms of street connectivity and pro-pedestrian street proportion. The former can be explained by
the street pattern, which, albeit forming an orthogonal grid, has many of its streets finishing in a dead end.
The latter means that Bairro Alto has 40% of pro-pedestrian streets (pedestrian streets; zone 30 and
conditioned access streets). This value may seem low but within Lisbon’s context it may prove to be quite
fair.
Fundamental
ViewPointsElementary ViewPoints SCORE Weight Weight * Score
Weight *
Score
Street connectivity 40,0 0,0476 1,9
Presence and coverage of public transport
stations 100,0
0,0476 4,8
Network integration (path directness) 73,1 0,0476 3,5
Land Use Mix 61,4 0,0476 2,9
Residential density 68,3 0,0476 3,3
Presence and coverage of essential
activities (land use) 100,0 0,0476 4,8
ComfortAvailability of dedicated pedestrian
infrastructure 72,7 0,1429 10,410,4
Conviviality Presence and coverage of convivial points 100,0 0,1429 14,3 14,3
Conspicuous Sense of place 87,1 0,1429 12,4 12,4
CoexistenceStreet capacity to hold traffic (avg. Number
of lanes) 75,2 0,1429 10,710,7
Commitment Pro-Pedestrian street proportion 42,7 0,1429 6,1 6,1
TOTAL 820,5 1,0 75,0 75,0
MACRO Scale - Bairro Alto
Connectivity 10,1
Convenience 10,9
68
The same value is actually responsible for the only “negative” score in terms of walkability dimension, with
Commitment scoring 40%. In practical terms, it would be feasible for Lisbon’s municipality to convert a few
more local access streets into zone 30 or pedestrian streets. This way all walkability dimensions would
score above 50.
5.3 Micro scale
The micro scale assessment was also performed in Bairro Alto30
, in a path that represents a short trip
(approx. 220m) from a house to a near café. The path is formed by 10 sidewalk segments in 5 street
segments of 3 different streets:
Figure 13:Micro scale path case study
Each segment is scored according to the 13 indicators, being this result multiplied by the segment length.
For the scoring of the travelled route, each side is evaluated in separate: Along one of the sides, the score
was 69.6 (in 100). The other side scored 72.3. Combining them, it would add up to an average walkability
score of (69,6 + 72,3) / 2 = 71.
Apart exquisite spatial analysis, GIS allows managing a spatial database, meaning all performed street
auditing can be introduced in the GIS database, making it is possible to address particular features.
30
The segments were audited following the table and results of ANNEX F.
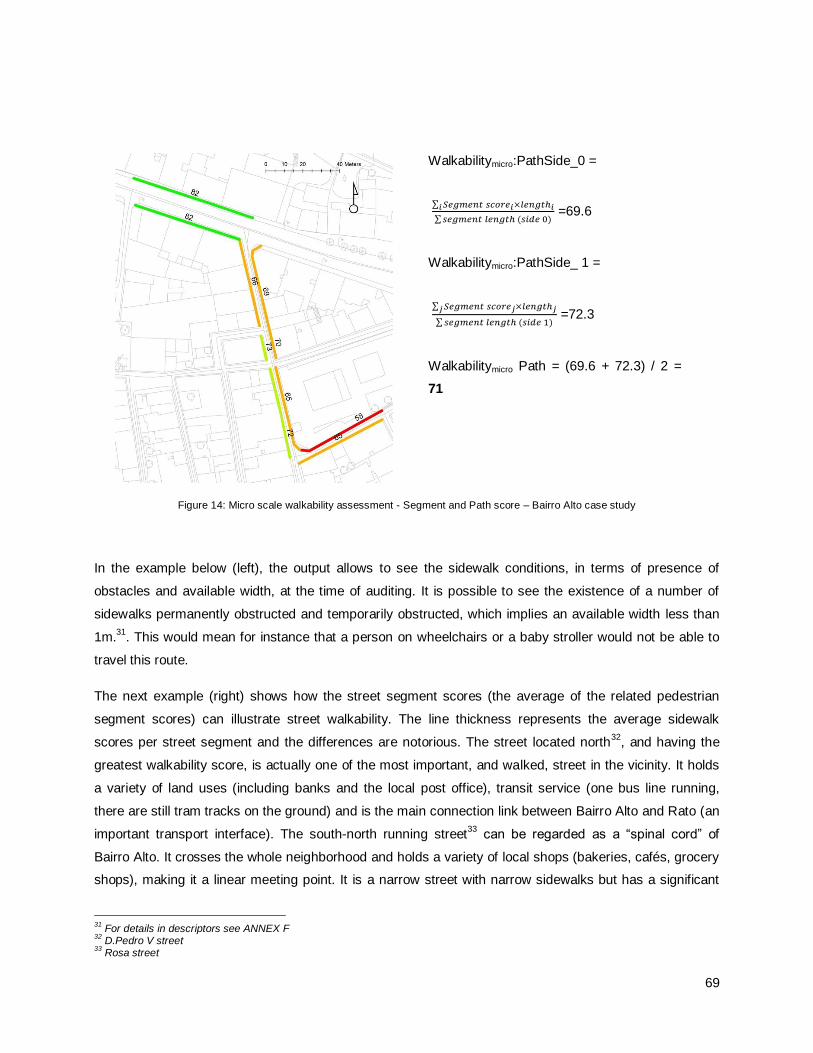
69
Walkabilitymicro:PathSide_0 =
∑
∑ ( ) =69.6
Walkabilitymicro:PathSide_ 1 =
∑
∑ ( ) =72.3
Walkabilitymicro Path = (69.6 + 72.3) / 2 =
71
Figure 14: Micro scale walkability assessment - Segment and Path score – Bairro Alto case study
In the example below (left), the output allows to see the sidewalk conditions, in terms of presence of
obstacles and available width, at the time of auditing. It is possible to see the existence of a number of
sidewalks permanently obstructed and temporarily obstructed, which implies an available width less than
1m.31
. This would mean for instance that a person on wheelchairs or a baby stroller would not be able to
travel this route.
The next example (right) shows how the street segment scores (the average of the related pedestrian
segment scores) can illustrate street walkability. The line thickness represents the average sidewalk
scores per street segment and the differences are notorious. The street located north32
, and having the
greatest walkability score, is actually one of the most important, and walked, street in the vicinity. It holds
a variety of land uses (including banks and the local post office), transit service (one bus line running,
there are still tram tracks on the ground) and is the main connection link between Bairro Alto and Rato (an
important transport interface). The south-north running street33
can be regarded as a “spinal cord” of
Bairro Alto. It crosses the whole neighborhood and holds a variety of local shops (bakeries, cafés, grocery
shops), making it a linear meeting point. It is a narrow street with narrow sidewalks but has a significant
31
For details in descriptors see ANNEX F 32
D.Pedro V street 33
Rosa street
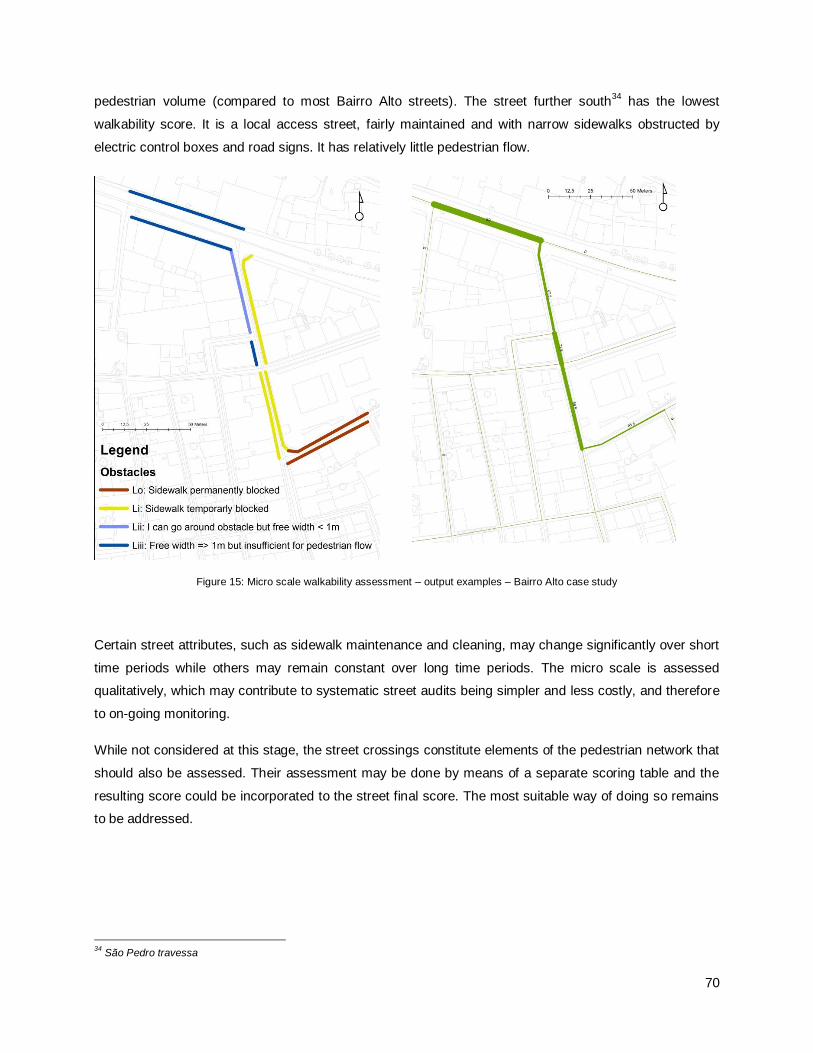
70
pedestrian volume (compared to most Bairro Alto streets). The street further south34
has the lowest
walkability score. It is a local access street, fairly maintained and with narrow sidewalks obstructed by
electric control boxes and road signs. It has relatively little pedestrian flow.
Figure 15: Micro scale walkability assessment – output examples – Bairro Alto case study
Certain street attributes, such as sidewalk maintenance and cleaning, may change significantly over short
time periods while others may remain constant over long time periods. The micro scale is assessed
qualitatively, which may contribute to systematic street audits being simpler and less costly, and therefore
to on-going monitoring.
While not considered at this stage, the street crossings constitute elements of the pedestrian network that
should also be assessed. Their assessment may be done by means of a separate scoring table and the
resulting score could be incorporated to the street final score. The most suitable way of doing so remains
to be addressed.
34
São Pedro travessa
71
6 . Discussion and conclusions
In this final chapter, the obtained results are discussed in terms of their validity, limitations and
applicability; future developments for this research are suggested and a set of concluding remarks is
presented.
6.1 Result discussion
Validation and Validity
The proposed base model was developed for application in 4 different work scales: the global scale;, the
macro scale; the meso scale and the micro scale. The model was tested in three of them: the city of
Lisbon (global scale); the Bairro Alto neighborhood (macro scale) and along a path composed by 3 street
portions in Bairro Alto (micro scale).
At global scale, the availability of statistical information regarding commuting travel patterns allowed to
confront the model’s results with the resident’s transportation modal choices. A positive correlation (R2=
0,34) was found between the “potential walkability” of Lisbon’s 53 parishes and the proportion of residents
who reported travelling by foot and/or public transportation in their daily commuting. A positive and more
significant correlation (r=0,73; R2= 0.58 ) was found between the “potential walkability” and the proportion
of residents who reported walking as a sole commuting means of transport. These were found to be
encouraging results.
The parish with the highest proportion of pedestrian commuting residents (39%) was selected for macro
scale analysis (Encarnação parish) and within this parish; the Bairro Alto neighborhood was analyzed.
The application of the macro scale base model reported a walkability score of 75.,0 (max 100), being the
individual contribution of each of the 7 walkability dimensions addressed in the output.
By applying the model to other urban areas it would be possible to compare results and to draw more
comprehensive conclusions on the validity of the walkability scores from the macro area model. Additional
measurements and evaluations need to be done in future research developments.
A short path (220m) was audited for the micro scale walkability model. The path was formed by 10
sidewalk segments in 5 street segments of 3 different streets. Along one of the sides of the path the score
was 69.6 (in 100) and the other side scored 72.3. Combining them, it would add up to an average
walkability score of 71.
A model validation exercise, other than field observation, has not been undertaken for this analysis scale.
Follow-on research could focus on more objective validation methods.
72
On the meaning, or interpretation, of the results, a higher walkability score in one area or in one street
does not necessarily mean more people walk there or will walk there. It means that the area, or the street,
meet a certain set of requirements to a certain extent. In other words, it means that certain built
environment attributes which are believed to promote a pedestrian friendly environment are more present
or more evident in one area/street than in other.
Limitations
The major internal limitations of the model are believed to be related to the lack of scientific evidence
supporting the choice of the indicators and their threshold. Other limitation is believed to be the
generalized use of the “average”, what may result, at the end, in obtaining the “average of the average of
the average”.
In terms of limitations external to the model, the most relevant was found to be the lack of information
regarding travel behavior and travel patterns. The Census collections happen at 10 years intervals and
are available up to the parish level. For obtaining information at the neighborhood level or for smaller time
intervals, specific (and costly) mobility surveys need to be done. Without travel behavior data the
validation of the model is fairly limited (although still possible by other means).
Information on land uses and employment is also, to date, very limited. Having statistical data available on
land uses (location, types, floor area used) and employment (number, location) could mean more
sophisticated data analysis, especially at the macro and meso scales.
Applicability
At a practical level, the model is believed to be easily implemented in the Portuguese municipal context.
By using 4 different and independent analysis scales, the degree of implementation (and therefore of
resources needed) can be tailored to suit the analysis objectives. Data requirements are fairly simple and
available.
The outputs from the global scale may be useful in characterizing whole urban areas in terms of their
potential walkability, and in comparing urban settings. In terms of planning, they may be useful at master
plan level35
studies
The outputs from the macro scale may be useful in classifying existing or proposed neighborhoods in
terms of their walkability. In terms of planning, this may be useful for identifying critical intervention areas,
for assessment of urbanization impacts and for benchmarking/monitoring purposes.
35
In portuguese, Plano Director Municipal
73
The outputs from the meso scale may be useful in addressing the pedestrian accessibility of public
services and facilities (schools, health centers, sport and recreation) or for real estate prospection. They
may also be useful for transportation planning.
The outputs from the micro scale may be useful in identifying intervention needs and in providing a
reference for benchmarking. In terms of urban design it may be useful in rating intervention alternatives.
6.2 Further developments
A number of future developments for this research can be pointed, some being related to the model
development, some to the validation and some as parallel follow-ons.
Regarding model development and validation:
The collection of samples, at the different model scales, for a more comprehensive
understanding of the score meaning. This can be together with the identifications of the best and
worst performances in order to calibrate the model’s thresholds;
The comparison with other walkability models, for international practice exchange and to
understand the extent to which the particular techniques may or may not be suitable for different
urban contexts;
Research on overcoming the validation issues, finding ways of putting in practice (particularly in
the Portuguese context) questionnaires, surveys, pedestrian counting, community sessions and
group ratings;
Gather stakeholder feedback by promoting the discussion and collecting experts, practitioners,
policymakers and people’s perspectives on what should be considered relevant in walkability
assessment, in order to find of a consensual set of indicators to be used in the analysis.
Research in international literature recommended values for the indicator’s thresholds.
Develop the operationalization of objective urban legibility indicators and other urban space
qualities drawn from the urban theories.
The development of a proxy indicator for security. As personal security is considered to be a
very influential factor in walking behavior. It is not a built environment feature on its own but some
built environment factors are believed to be related to security perception.
The incorporation of a micro2 scale, regarding pedestrian crossing/intersection assessment
and its combination with the street scale scoring.
The development of the augmented model, especially in terms of different pedestrian groups.
The base model was developed for the segment of Active Adults users. The most vulnerable
groups remain to be addressed – children, elderly, handicapped (universal access norms)
74
Regarding parallel follow-ons:
The optimization of GIS procedures in terms of dealing with large quantities of data and in
building automated processes (for instance in dummy link creation for the meso scale analysis)
The incorporation of Space syntax methods, as a more holistic approach to walkability. These
methods allow very interesting and sophisticated analysis in terms of integration and visibility,
factors that should be considered because neither the neighborhoods nor the streets exist on their
own. The pedestrians flow through and in function of the spatial interrelations of the different
elements.
The research on more suitable models for combining the criteria. The simple additive model is a
compensatory model meaning that a low score on a variable can be compensated by a high score
on other variable. Further reflection is needed in order to figure if compensatory models are
suitable for use within the walkability assessment context or if other type of models, like factorial
analysis, could prove to be more suited. Also it should be also further discussed the role of the
variables thresholds when using the simple additive model, especially the effect of below-neutral
observed values in the walkability resulting score.
There is also the need to draw practical insights from the results that can be useful for urbanism
practitioners. More research has to be done in interpreting, understanding and converting the
results into urban intervention guidelines.
The reflection on the Scale mix issue. Walkability models address different scales, from large
areas (cities) to points (street intersections). But usually they do so at one scale only, or, in the
case of the proposed model, at one scale at a time. It is possible to picture situations where an
area with an excellent urban fabric in terms of pedestrian conductive features (land use diversity,
connectivity, permeability, etc) can have streets with terrible conditions for walking (uncomfortable
sidewalks, dull/confusing urban image, no trees, etc). Similarly, it is possible to idealize an area
whose streets have good conditions for walking (wide and clean sidewalks, quality public spaces,
etc.) but poor urban features (single land use, poor connectivity, low density). In such cases, a
walkability assessment would give a good score to one scale (area) and a bad score for the other
(street). The suggested reflection is if it would make sense to mix somehow the analysis scale in
order to overcome this issue. Or if the separate results should just be somehow combined.
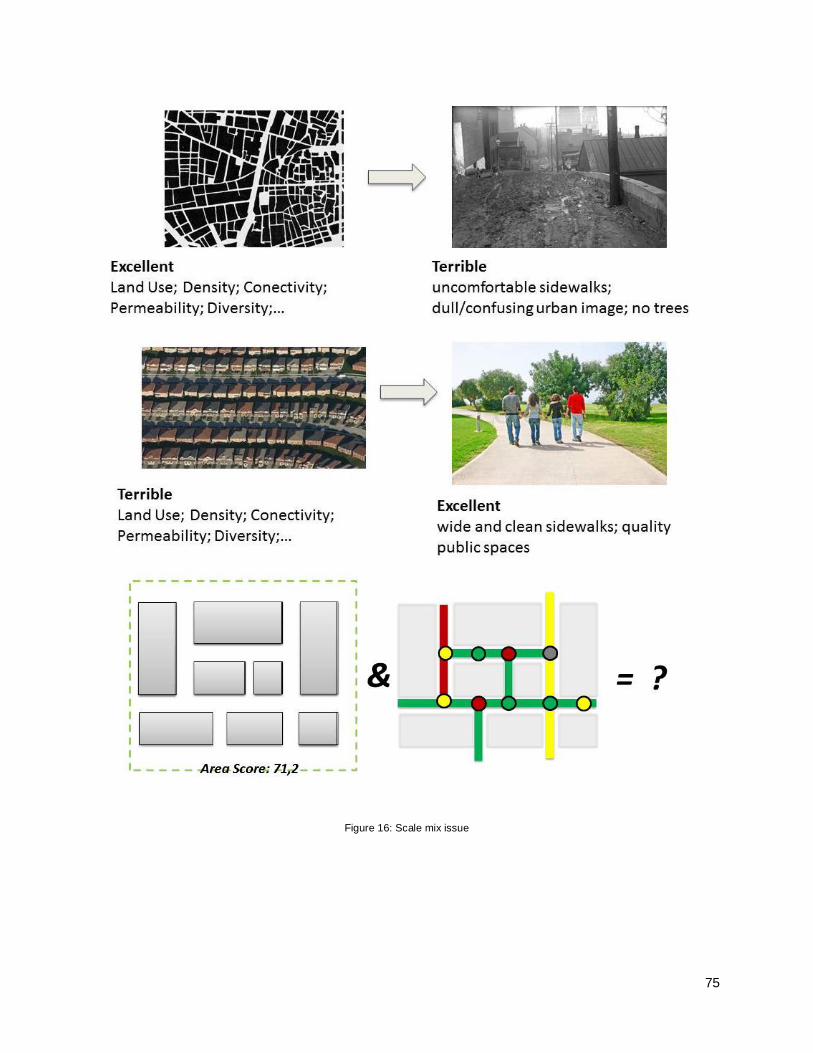
75
Figure 16: Scale mix issue
76
6.3 Concluding Remarks
Today walking matters.
From the urban sustainability perspective, walking matters for the environment because it is a clean
transport mode, it matters for the economy because it consumes little energy and resources, it matters for
the society because it creates more sociable, more livable cities and because it is a cheap easy way to
exercise. Walking for 20 to 30 minutes per day could help fight the sedentary lifestyle (with related obesity
and diabetes conditions) that has been declared as the scourge of the XXI century. However pedestrian
travelling has been declining in almost every city.
The solution could be in designing, promoting and maintaining “walking friendly” environments. Such
environments could be supportive and inducers of more pedestrian travelling. The study of the link
between the influence of the built environment and walking behavior is quite recent but it has attracted the
attentions of different research fields – transportation, urban planning and public health – and researchers
are still struggling to understand that link. A tenuous link whose existence was proven and whose
research “is more imperative now than ever” (Cervero and Kockelman 1997)(Handy 2005).
To the question of “which factors of the built environment affect which type of walking, which of them are
more important and to what degree” there is still the lack of empirical evidence to provide the answer. The
major answer still is “that we know too little” about the relations of the built environment and walking
behavior (Soltani and Allan 2005)(Forsyth and Southworth 2008)(Evans 2009). From the multiplicity of
urban attributes that may influence walking, accessibility and attractiveness of the pedestrian environment
seem to play a major role.
Despite the agreement on the important factors contributing to “walkability” being very much in contention
(Clifton 2007), several walkability assessment methodologies have been developed in different countries.
These make use of a variety of techniques, not without limitations and methodological issues.
Perceptions, for instance, play a major role in influencing people’s walking behavior but are difficult to
address objectively, while built environment attributes can be assessed in a more objective way. Further
improvement of walkability assessment could pass by the combination of comprehensive, objective, GIS
data, with observational urban environment analysis, combined with user consultation on needs,
aspirations and perceptions. (Evans 2009). As noted by Batista e Silva, “Objectivity and subjectivity are
complementary issues that planning practice should deal with, for better and for worse” (Batista e Silva et
al. 2012).
Walkability measurement is relevant as it provides factual data for decision aid, benchmarking and
monitoring processes. Walkability and its measurement should not be seen as a “one fits all” concept. It is
necessary to understand what type of walking is going to be assessed (if walking for transportation if
77
walking for recreation or exercise), what pedestrian group (adult, enfant, elderly, less able), where and
when.
A model for walkability assessment was development, conceptually designed to fit the Portuguese
municipal context. It made use of GIS analysis features in combination with MCDA techniques. The
MCDA techniques allowed a clearer comprehension of what was to be assessed and by which means.
The model was applied to the city of Lisbon, to the Bairro Alto neighborhood some of its streets. Results
were encouraging, as a positive correlation was found between estimated walkability and pedestrian travel
patterns. Further developments will undoubtedly contribute to the understanding and validation of
walkability scores.
All results in this field should be, however, interpreted cautiously. Research has shown that some features
and characteristics of the urban environment that form a “pedestrian friendly” environment are usually
associated with higher pedestrian travelling, but on the other hand, in line with the existent methodological
limitations of this field of research, “the results must be interpreted as being associative rather than
causal” (Cervero and Kockelman 1997)(Handy 2005).
“Probably it is scientifically impossible to get to know the particular importance of the distinct variables
(psychological, social, economic, urban,…) that influence walking.
Nevertheless, the sole evidence of the many ways by which urban features constraint pedestrian
mobility, in the sense that one’s encourage it and others discourage it, at different levels, is one enough
reason for further research on the relation between the built environment and walking.”
Adapted from “La Ciudad Paseable” pp.
78
7 . References
Abley, S., and S. Turner. 2011. “Predicting Walkability: Technical Report”. New Zealand Transport Agency.
Albers, P. N, C. Wright, and J. Olwoch. 2010. “Developing a South African Pedestrian Environment Assessment Tool: Tshwane Case Study.” South African Journal of Science 106 (9-10): 1–8.
Allan, Andrew. 2001. “Walking as a Local Transport Modal Choice in Adelaide.” World Transport Policy & Practice 7 (2): 44-51. Pag 43.
Bana e Costa, C., and E. Beinat. 2005. “Model-Structuring in Public Decision-Aiding.” WP LSEOR 05.79. ———. 2010. “Estruturação De Modelos De Análise Multicritério De Problemas De Decisão Pública.” WP
CEG-IST 3/2010. Bassett Jr, D. R, J. Pucher, R. Buehler, D. L Thompson, S. E Crouter, and others. 2008. “Walking,
Cycling, and Obesity Rates in Europe, North America, and Australia.” Journal of Physical Activity and Health 5 (6): 795–814.
Batista e Silva, Jorge, Maria da Graça Saraiva, Isabel Loupa Ramos, and Fátima Bernardo. 2012. “Improving Visual Attractiveness to Enhance City–River Integration—A Methodological Approach for Ongoing Evaluation.” Planning Practice and Research (August 8): 1-23. doi:10.1080/02697459.2012.704734.
Bourdeaudhuij, I.D., P.J. Teixeira, G. Cardon, and B. Deforche. 2005. “Environmental and Psychosocial Correlates of Physical Activity in Portuguese and Belgian Adults.” Public Health Nutrition 8 (07): 886–895.
Bradshaw, Chris. 1993. “Creating -- And Using -- A Rating System For Neighborhood Walkability Towards An Agenda For ‘Local Heroes’.” In 14th International Pedestrian Conference, Boulder CO.
Cervero, R., and K. Kockelman. 1997. “Travel Demand and the 3Ds: Density, Diversity and Design.” Transportation Research Part D: Transport and Environment 2 (3): 199-219.
Choay, F., and P. Merlin. 2005. Dictionnaire De L’urbanisme Et De L’aménagement. Presses Universitaires de Paris.
Christopoulou, P., and M. Pitsiava-Lationopolou. 2012. “Development of a Model for the Estimation of Pedestrian Level of Service in Greek Urban Areas.” Procedia - Social and Behavioral Sciences (48): 1691-1701.
Clifton, K. 2007. “The Development and Testing of an Audit for the Pedestrian Environment.” Correia, P., M. Costa Lobo, and S. Pardal. Normas Urbanísticas. Vol. III. DGOTDU. COST 358. 2010. PQN Final Report Part B1 - Functional Needs. Walk 21. Dauden, F., J. Echavarri, and M. Schettino. 2009. La Ciudad Paseable. Ministerio de Fomento - España. Dixon, L.B. 1996. “Bicycle and Pedestrian Level-of-service Performance Measures and Standards for
Congestion Management Systems.” Transportation Research Record: Journal of the Transportation Research Board 1538 (-1): 1–9.
Emery, J., and C. Crump. 2003. The WABSA Project: Assessing and Improving Your Community’s Walkability and Bikeability. University of North Carolina at Chapel Hill.
Evans, G. 2009. “Accessibility, Urban Design and the Whole Journey Environment.” Built Environment 35 (3): 366–385.
Ewing, Reid, and Susan Handy. 2009. “Measuring the Unmeasurable: Urban Design Qualities Related to Walkability.” Journal of Urban Design 14 (1) (February): 65-84. doi:10.1080/13574800802451155.
Forsyth, Ann, and Michael Southworth. 2008. “Cities Afoot—Pedestrians, Walkability and Urban Design.” Journal of Urban Design 13 (1) (February): 1-3. doi:10.1080/13574800701816896.
Frank, L.D., and G. Pivo. 1994. “Impacts of Mixed Use and Density on Utilization of Three Modes of Travel: Single-occupant Vehicle, Transit, and Walking.” Transportation Research Record: 44–44.
Frank, L.D., T.L. Schmid, J.F. Sallis, J. Chapman, and B.E. Saelens. 2005. “Linking Objectively Measured Physical Activity with Objectively Measured Urban Form:: Findings from SMARTRAQ.” American Journal of Preventive Medicine 28 (2): 117–125.
Ghidini. 2011. “A Caminhabilidade: Medida Urbana Sustentável.” Revista Dos Transportes Públicos-ANTP-Ano 33.
Handy, S. 2005. “Critical Assessment of the Literature on the Relationships Among Transportation, Land Use, and Physical Activity.” Transportation Research Board and the Institute of Medicine Committee on Physical Activity, Health, Transportation, and Land Use. Resource Paper for TRB
79
Special Report 282. http://onlinepubs.trb.org/onlinepubs/archive/downloads/sr282papers/sr282handy.pdf.
Hillier, B., A. Penn, J. Hanson, and J. Xu. 1993. “Natural Movement: Or, Configuration and Attraction in Urban Pedestrian Environment.” Environment and Planning B: Planning and Design 20: 29-66.
Jacobs, Jane. 1961. The Death and Life of Great American Cities. 1992nd ed. Vintage. Jesus, Lina. 2011. “Mobilidade Em Topografia Acentuada (in Portuguese)”. Instituto Superior Técnico,
Universidade Técnica de Lisboa. Krambeck, H., and J.J. Shah. 2006. “The Global Walkability Index”. Cambridge, USA: Massachusetts
Institute of Technology (MIT). Landis, B.W., V.R. Vattikuti, R.M. Ottenberg, D.S. McLeod, and M. Guttenplan. 2001. “Modeling the
Roadside Walking Environment: Pedestrian Level of Service.” Transportation Research Record: Journal of the Transportation Research Board 1773 (-1): 82–88.
Leslie, E., E. Cerin, L. duToit, N. Owen, and A. Bauman. 2007. “Objectively Assessing’Walkability’of Local Communities: Using GIS to Identify the Relevant Environmental Attributes.” GIS for Health and the Environment: 91–104.
Lo, Ria Hutabarat. 2009. “Walkability: What Is It?” Journal of Urbanism: International Research on Placemaking and Urban Sustainability 2 (2) (July): 145-166. doi:10.1080/17549170903092867.
Lynch, Kevin. 1960. A Imagem Da Cidade (The Image of the City). 1996th ed. Lisboa: Edições 70. Maghelal, P.K. 2010. “Walkability: A Review of Existing Pedestrian Indices.” Journal of Urban and
Regional Information System Association -accepted/in press-. Moudon, A.V., C. Lee, A.D. Cheadle, C. Garvin, D. Johnson, T.L. Schmid, R.D. Weathers, and L. Lin.
2006. “Operational Definitions of Walkable Neighborhood: Theoretical and Empirical Insights.” Journal of Physical Activity & Health 3: 99.
Park, S. 2008. Defining, Measuring, and Evaluating Path Walkability, and Testing Its Impacts on Transit Users’ Mode Choice and Walking Distance to the Station. PhD Dissertation, University of California Transportation Center, Berkeley.
Ramos, A., and Mario J. Alves. 2010. The Walker and the City. Associação de cidadãos auto-mobilizados. Saelens, B.E., J.F. Sallis, J.B. Black, and D. Chen. 2003. “Neighborhood-based Differences in Physical
Activity: An Environment Scale Evaluation.” American Journal of Public Health 93 (9): 1552. Salgado, R, and N. Lourenço. 2006. Lisbon Urban Atlas. Argumentum. Schmid, Jonas. 2006. “La Relation Entre L’environment Construit Et L’activité Physique Sous Forme De
Déplacements à Pied”. Mémoire de licence, Faculté des géosciences et de l'environment, Université de Lausanne.
Sdokopoulos, Lefteris. 2010. “Methods for Assessing the Pedestrian Level of Service: International Experience and Adjustment to the Greek Walking Environment - The Case of Thessaloniki”. Centre for Research and Technology Hellas / Hellenic Institute of Transport (CERT/HIT).
e Silva, J. A, T. F Golob, and K. G Goulias. 2006. “Effects of Land Use Characteristics on Residence and Employment Location and Travel Behavior of Urban Adult Workers.” Transportation Research Record: Journal of the Transportation Research Board 1977 (-1): 121–131.
Soltani, A., and A. Allan. 2005. “A Computer Methodology for Evaluating Urban Areas for Walking, Cycling and Transit Suitability: Four Case Studies from Suburban Adelaide, Australia.” Working Paper 271, University of South Australia.
Space Syntax Limited. 2003. “Towards a ‘Walkability Index’.” In Strasbourg, France: Space Syntax Limited.
Steiner, Bond, Miller, and Shad. 2004. Future Directions for Multimodel Areawide Level of Service Handbook. Technical report. Florida Department of Transportation.
Weil, Marcus. 2009. Urbanisme Et Santé. Geneve: Urbaplan.
80
8 . Web references
http://www.ine.pt
http://www.wikipedia.com
http://www.thesaurus.com
http://www.walk21.com
http://www.activelivingresearch.org/
http://www.walkeurope.org/
http://www.pedestrians-int.org
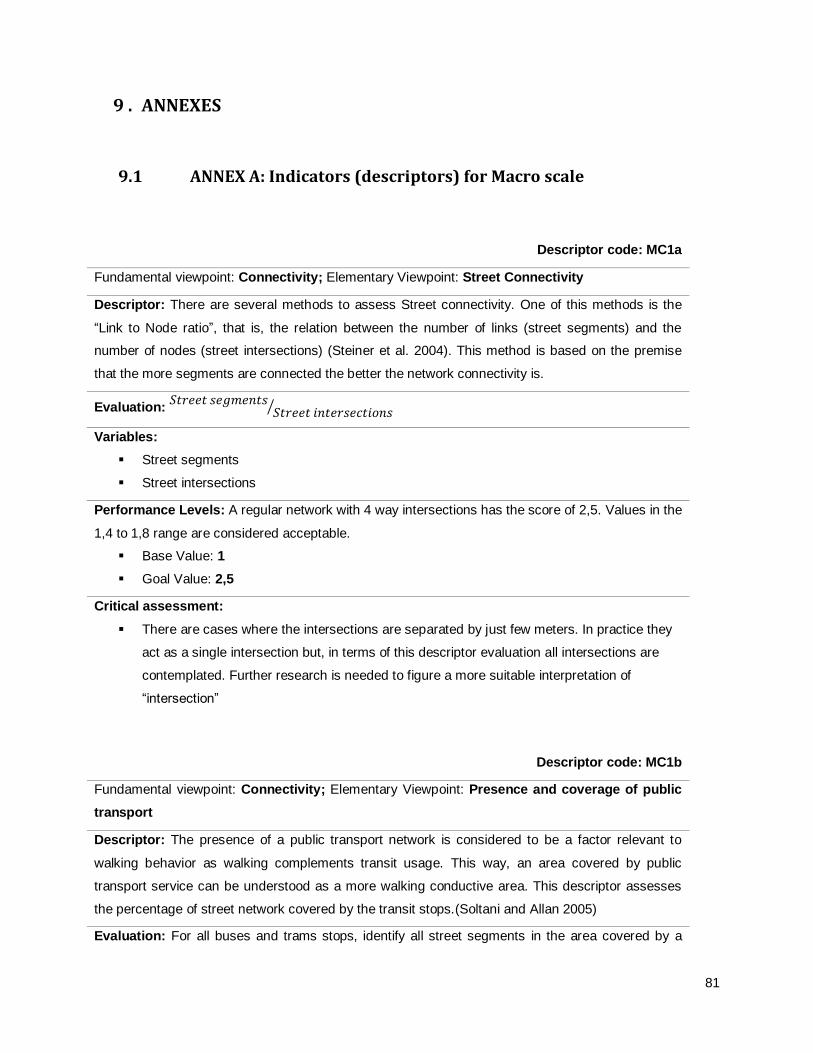
81
9 . ANNEXES
9.1 ANNEX A: Indicators (descriptors) for Macro scale
Descriptor code: MC1a
Fundamental viewpoint: Connectivity; Elementary Viewpoint: Street Connectivity
Descriptor: There are several methods to assess Street connectivity. One of this methods is the
“Link to Node ratio”, that is, the relation between the number of links (street segments) and the
number of nodes (street intersections) (Steiner et al. 2004). This method is based on the premise
that the more segments are connected the better the network connectivity is.
Evaluation:
⁄
Variables:
Street segments
Street intersections
Performance Levels: A regular network with 4 way intersections has the score of 2,5. Values in the
1,4 to 1,8 range are considered acceptable.
Base Value: 1
Goal Value: 2,5
Critical assessment:
There are cases where the intersections are separated by just few meters. In practice they
act as a single intersection but, in terms of this descriptor evaluation all intersections are
contemplated. Further research is needed to figure a more suitable interpretation of
“intersection”
Descriptor code: MC1b
Fundamental viewpoint: Connectivity; Elementary Viewpoint: Presence and coverage of public
transport
Descriptor: The presence of a public transport network is considered to be a factor relevant to
walking behavior as walking complements transit usage. This way, an area covered by public
transport service can be understood as a more walking conductive area. This descriptor assesses
the percentage of street network covered by the transit stops.(Soltani and Allan 2005)
Evaluation: For all buses and trams stops, identify all street segments in the area covered by a
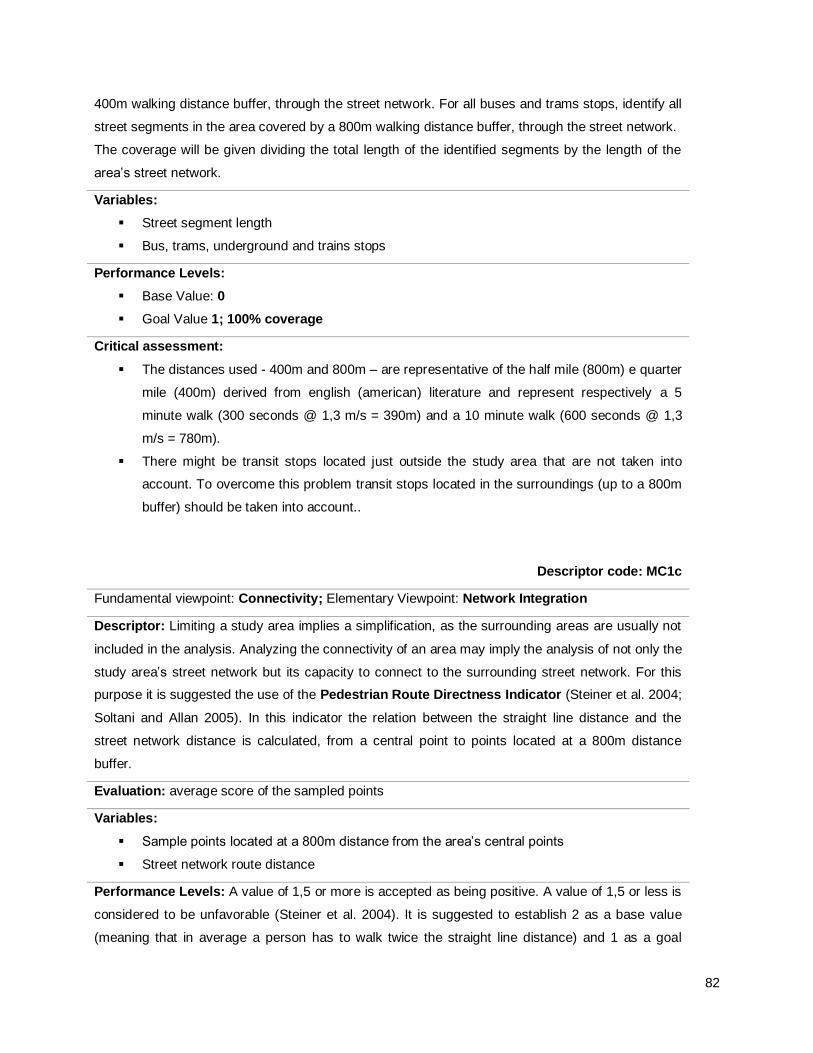
82
400m walking distance buffer, through the street network. For all buses and trams stops, identify all
street segments in the area covered by a 800m walking distance buffer, through the street network.
The coverage will be given dividing the total length of the identified segments by the length of the
area’s street network.
Variables:
Street segment length
Bus, trams, underground and trains stops
Performance Levels:
Base Value: 0
Goal Value 1; 100% coverage
Critical assessment:
The distances used - 400m and 800m – are representative of the half mile (800m) e quarter
mile (400m) derived from english (american) literature and represent respectively a 5
minute walk (300 seconds @ 1,3 m/s = 390m) and a 10 minute walk (600 seconds @ 1,3
m/s = 780m).
There might be transit stops located just outside the study area that are not taken into
account. To overcome this problem transit stops located in the surroundings (up to a 800m
buffer) should be taken into account..
Descriptor code: MC1c
Fundamental viewpoint: Connectivity; Elementary Viewpoint: Network Integration
Descriptor: Limiting a study area implies a simplification, as the surrounding areas are usually not
included in the analysis. Analyzing the connectivity of an area may imply the analysis of not only the
study area’s street network but its capacity to connect to the surrounding street network. For this
purpose it is suggested the use of the Pedestrian Route Directness Indicator (Steiner et al. 2004;
Soltani and Allan 2005). In this indicator the relation between the straight line distance and the
street network distance is calculated, from a central point to points located at a 800m distance
buffer.
Evaluation: average score of the sampled points
Variables:
Sample points located at a 800m distance from the area’s central points
Street network route distance
Performance Levels: A value of 1,5 or more is accepted as being positive. A value of 1,5 or less is
considered to be unfavorable (Steiner et al. 2004). It is suggested to establish 2 as a base value
(meaning that in average a person has to walk twice the straight line distance) and 1 as a goal
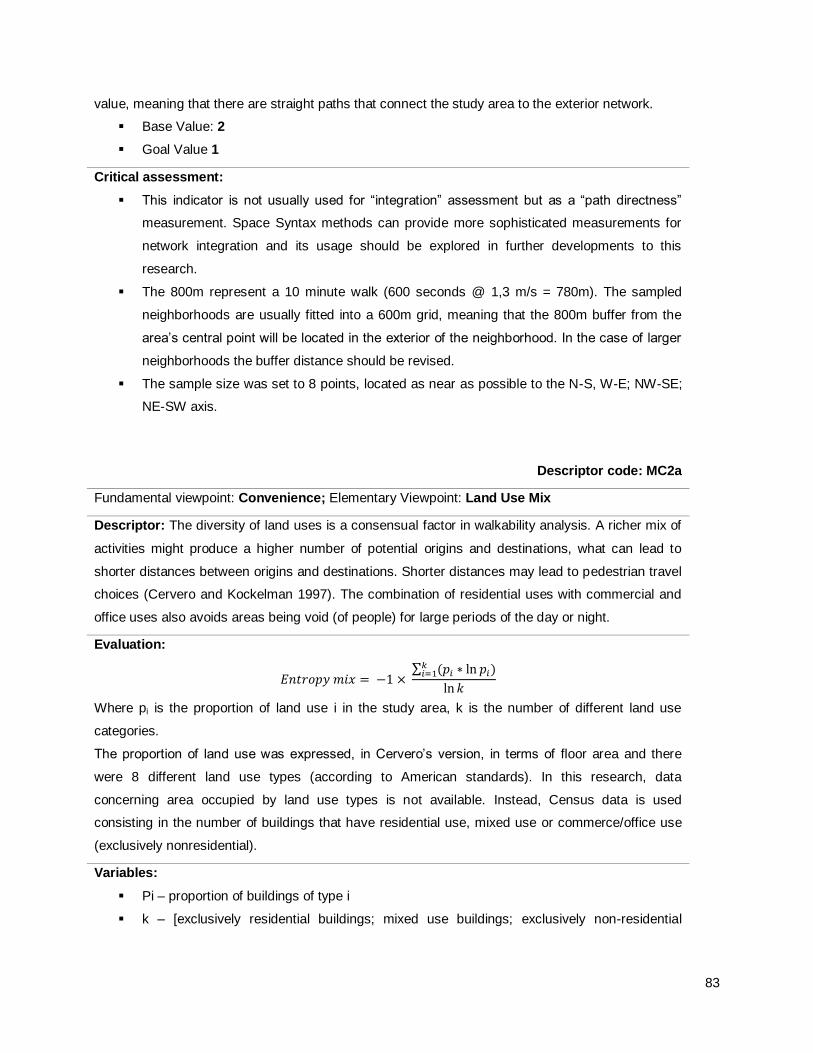
83
value, meaning that there are straight paths that connect the study area to the exterior network.
Base Value: 2
Goal Value 1
Critical assessment:
This indicator is not usually used for “integration” assessment but as a “path directness”
measurement. Space Syntax methods can provide more sophisticated measurements for
network integration and its usage should be explored in further developments to this
research.
The 800m represent a 10 minute walk (600 seconds @ 1,3 m/s = 780m). The sampled
neighborhoods are usually fitted into a 600m grid, meaning that the 800m buffer from the
area’s central point will be located in the exterior of the neighborhood. In the case of larger
neighborhoods the buffer distance should be revised.
The sample size was set to 8 points, located as near as possible to the N-S, W-E; NW-SE;
NE-SW axis.
Descriptor code: MC2a
Fundamental viewpoint: Convenience; Elementary Viewpoint: Land Use Mix
Descriptor: The diversity of land uses is a consensual factor in walkability analysis. A richer mix of
activities might produce a higher number of potential origins and destinations, what can lead to
shorter distances between origins and destinations. Shorter distances may lead to pedestrian travel
choices (Cervero and Kockelman 1997). The combination of residential uses with commercial and
office uses also avoids areas being void (of people) for large periods of the day or night.
Evaluation:
∑ ( )
Where pi is the proportion of land use i in the study area, k is the number of different land use
categories.
The proportion of land use was expressed, in Cervero’s version, in terms of floor area and there
were 8 different land use types (according to American standards). In this research, data
concerning area occupied by land use types is not available. Instead, Census data is used
consisting in the number of buildings that have residential use, mixed use or commerce/office use
(exclusively nonresidential).
Variables:
Pi – proportion of buildings of type i
k – [exclusively residential buildings; mixed use buildings; exclusively non-residential
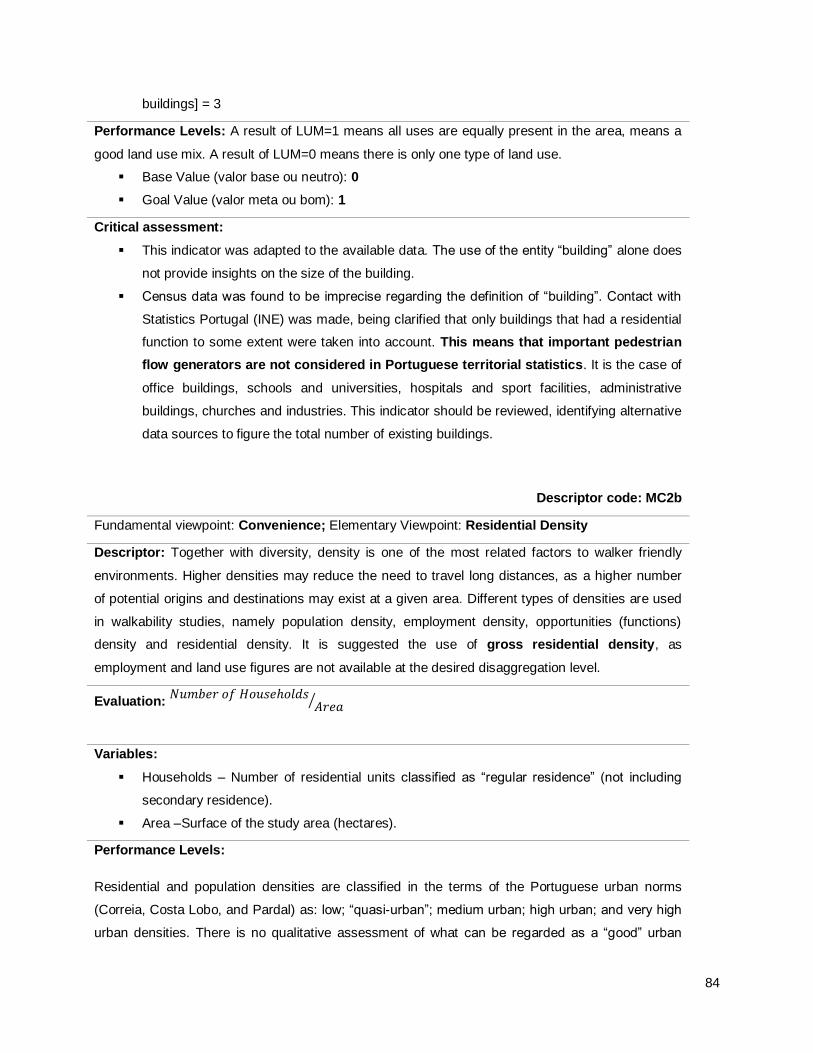
84
buildings] = 3
Performance Levels: A result of LUM=1 means all uses are equally present in the area, means a
good land use mix. A result of LUM=0 means there is only one type of land use.
Base Value (valor base ou neutro): 0
Goal Value (valor meta ou bom): 1
Critical assessment:
This indicator was adapted to the available data. The use of the entity “building” alone does
not provide insights on the size of the building.
Census data was found to be imprecise regarding the definition of “building”. Contact with
Statistics Portugal (INE) was made, being clarified that only buildings that had a residential
function to some extent were taken into account. This means that important pedestrian
flow generators are not considered in Portuguese territorial statistics. It is the case of
office buildings, schools and universities, hospitals and sport facilities, administrative
buildings, churches and industries. This indicator should be reviewed, identifying alternative
data sources to figure the total number of existing buildings.
Descriptor code: MC2b
Fundamental viewpoint: Convenience; Elementary Viewpoint: Residential Density
Descriptor: Together with diversity, density is one of the most related factors to walker friendly
environments. Higher densities may reduce the need to travel long distances, as a higher number
of potential origins and destinations may exist at a given area. Different types of densities are used
in walkability studies, namely population density, employment density, opportunities (functions)
density and residential density. It is suggested the use of gross residential density, as
employment and land use figures are not available at the desired disaggregation level.
Evaluation:
⁄
Variables:
Households – Number of residential units classified as “regular residence” (not including
secondary residence).
Area –Surface of the study area (hectares).
Performance Levels:
Residential and population densities are classified in the terms of the Portuguese urban norms
(Correia, Costa Lobo, and Pardal) as: low; “quasi-urban”; medium urban; high urban; and very high
urban densities. There is no qualitative assessment of what can be regarded as a “good” urban
85
density, as the most appropriate values for the density thresholds may differ according to the urban
context. This research focus in urban areas and therefore it is suggested the use of “quasi-urban”
density as base value and high urban density as goal value.
Base Value: 40
Goal Value: 200
Critical assessment:
The use of residential density instead of population density is related to the understanding
of the “built environment” concept, as buildings and dwellings are “built” features while
people are users of the built and natural features of the urban environment. The use of
residential density as a descriptor may also allow to better customize the analysis, by using
for instance secondary residence/hotel bed figures or occupied/free dwelling statistics
A high residential density may contribute to shorter walking distances by increasing the
quantity and variety of functions at a given area, but increasing the residential density may
result in overloading the pedestrian infrastructure. In this case, the residential density value
function (in terms of its impacts) may not be linear, as very high residential densities may
result in lower pedestrian satisfaction levels.
Descriptor code: MC2c
Fundamental viewpoint: Convenience; Elementary Viewpoint: Essential activities
Descriptor: The most usual trips done by walking as a transport are for commuting (work/school);
shopping (daily or occasional) or for accessing services (post office, bank, health, etc.). Research
has shown that the presence of certain activities near the residence or working place contributes to
a higher pedestrian activity, being such activities designated as “essential” activities. The set of
activities understood as “essential” ones is likely to change according to the social and cultural
environment, but food related activities (grocery shops, cafes and restaurants) have been indicated
in several studies as being the main driver of non-commuting utility walking. For the local context,
the set of “essential activities” is suggested to include: grocery shops; neighborhood markets; mini
markets; bakeries; patisseries; cafés; snack-bars and restaurants.
Evaluation: As with descriptor MC1b, the evaluation is done by identifying in the study area the
location of essential activities and their spatial coverage. The spatial coverage is given by the
street segments in the area covered by a 400m walking distance buffer, from the activities and
through the street network divided by the length of the area’s street network.
Variables:
Street segment length,
86
Essential activities location
Performance Levels:
Base Value: 0
Goal Value : 1; 100% coverage
Critical assessment:
The identification of the street segments covered by a 400m buffer does not provide
information on the population actually served. In order to do so, street segments could be
connected to the building polygons but a field survey would be necessary to collect
information regarding number of households or residents.
By using a large variety of essential activities chances are that a large coverage area can
be obtained with the presence of only a few types of activities.
As with public transport coverage, by identifying only the activities located within the study
area there might be a “border effect”, where essential activities located just outside the
study area are not considered. . To overcome this problem essential activities located in the
borders (to a visible range) should be taken into account..
Descriptor code: MC3
Fundamental viewpoint: Comfort; Elementary Viewpoint: Availability of pedestrian infrastructure
Descriptor: The existence of a dedicated pedestrian infrastructure can be understood as a comfort
descriptor in the way it provides an identifiable and sheltered space for the pedestrian. The building-
street connection is eased and thus more comfortable. At this analysis scale only the
presence/absence of a pedestrian infrastructure is assessed and not its quality. The pedestrian
infrastructure is composed by standard sidewalks –with different paving materials and elevated in
relation to the road.- and “nonstandard” sidewalks –that may not have a different paving nor being
elevated but that are easily differentiated from the road environment.
Evaluation: ∑
∑
Variables:
Pedestrian network segment length,
Pedestrian network sidewalk type
Performance Levels:
Base Value: 0,5 ;50%coverage
Goal Value: 1; 100% coverage
87
Critical assessment:
The existence of a dedicated pedestrian infrastructure (sidewalks) may also be understood
as a “convenience” factor.
The base value of 50% is taken as a base value for an urban area meaning that in average
each street should possess a sidewalk at least in one of its sides.
Descriptor code: MC4
Fundamental viewpoint: Conviviality; Elementary Viewpoint: Convivial Points
Descriptor: The presence of people in the streets enhances the social dimension of the public
space and contributes to the perception of a safer environment, with sojourning playing a major role
in public space usage. In terms of walkability, the presence of convivial points, more or less formal,
may function as flow generators for diverse pedestrian groups and purposes (children, elderly,
recreation, etc.), adding diversity and animation to the street network and increasing the
community’s social interaction. In this sense the presence and coverage of convivial points is
analyzed, being considered as convivial points the following elements: benches, tables, terraces,
children playgrounds and kiosks (squares and parks were not considered as elements on their
own).
Evaluation: The evaluation is similar to the one of descriptor MC2c, being the various convivial
points identified and located within the study area. From the collected points a 400m buffer is
defined in order to estimate the pedestrian coverage of each point. The length of the covered street
segments is added together and divided by the total length of the street network.
Variables:
Street segment length
Convivial points
Performance Levels:
Base Value: 0
Goal Value: 1; 100% coverage
Critical assessment:
One alternative to using the coverage area could be to analyze the density and distribution
of convivial points, but in operational terms, the definition of both the base and goal value
would be more challenging.
The 400m buffer coverage is used as a proxy for a 5 minute walk, assuming that residents
or workers are more motivated to make use of convivial points if these are located nearby.
The usage of this descriptor for the macro scale (neighborhood) and not for the micro scale
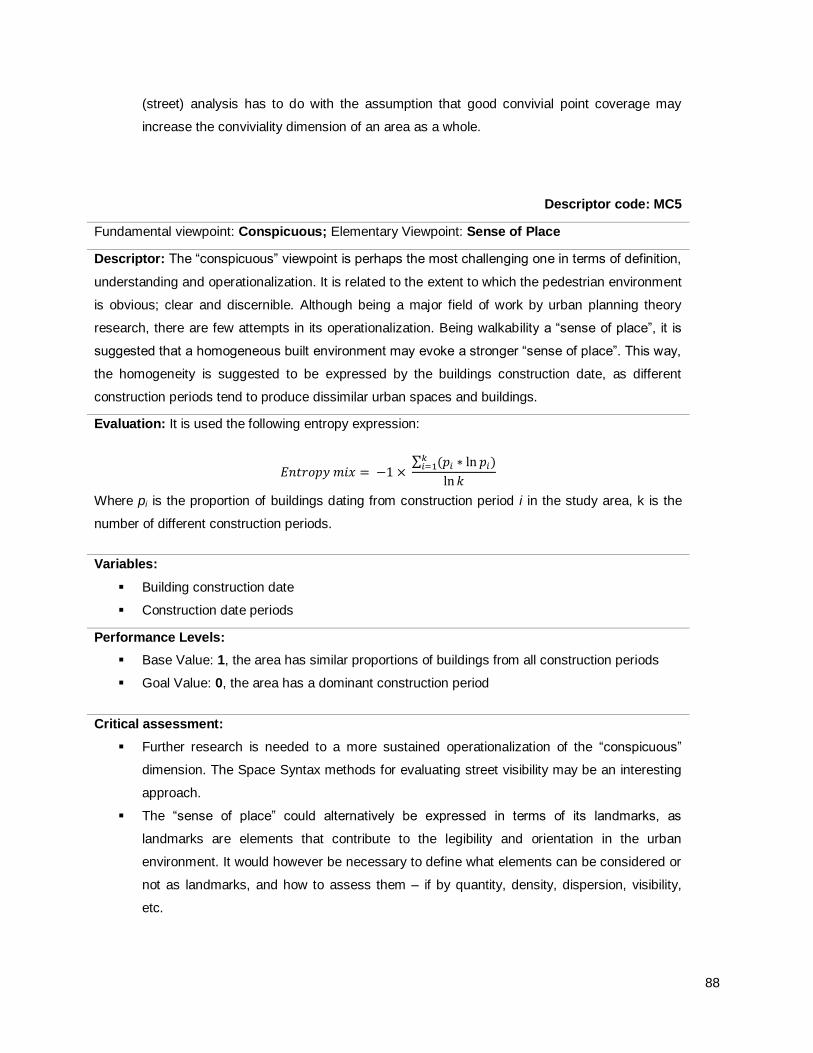
88
(street) analysis has to do with the assumption that good convivial point coverage may
increase the conviviality dimension of an area as a whole.
Descriptor code: MC5
Fundamental viewpoint: Conspicuous; Elementary Viewpoint: Sense of Place
Descriptor: The “conspicuous” viewpoint is perhaps the most challenging one in terms of definition,
understanding and operationalization. It is related to the extent to which the pedestrian environment
is obvious; clear and discernible. Although being a major field of work by urban planning theory
research, there are few attempts in its operationalization. Being walkability a “sense of place”, it is
suggested that a homogeneous built environment may evoke a stronger “sense of place”. This way,
the homogeneity is suggested to be expressed by the buildings construction date, as different
construction periods tend to produce dissimilar urban spaces and buildings.
Evaluation: It is used the following entropy expression:
∑ ( )
Where pi is the proportion of buildings dating from construction period i in the study area, k is the
number of different construction periods.
Variables:
Building construction date
Construction date periods
Performance Levels:
Base Value: 1, the area has similar proportions of buildings from all construction periods
Goal Value: 0, the area has a dominant construction period
Critical assessment:
Further research is needed to a more sustained operationalization of the “conspicuous”
dimension. The Space Syntax methods for evaluating street visibility may be an interesting
approach.
The “sense of place” could alternatively be expressed in terms of its landmarks, as
landmarks are elements that contribute to the legibility and orientation in the urban
environment. It would however be necessary to define what elements can be considered or
not as landmarks, and how to assess them – if by quantity, density, dispersion, visibility,
etc.
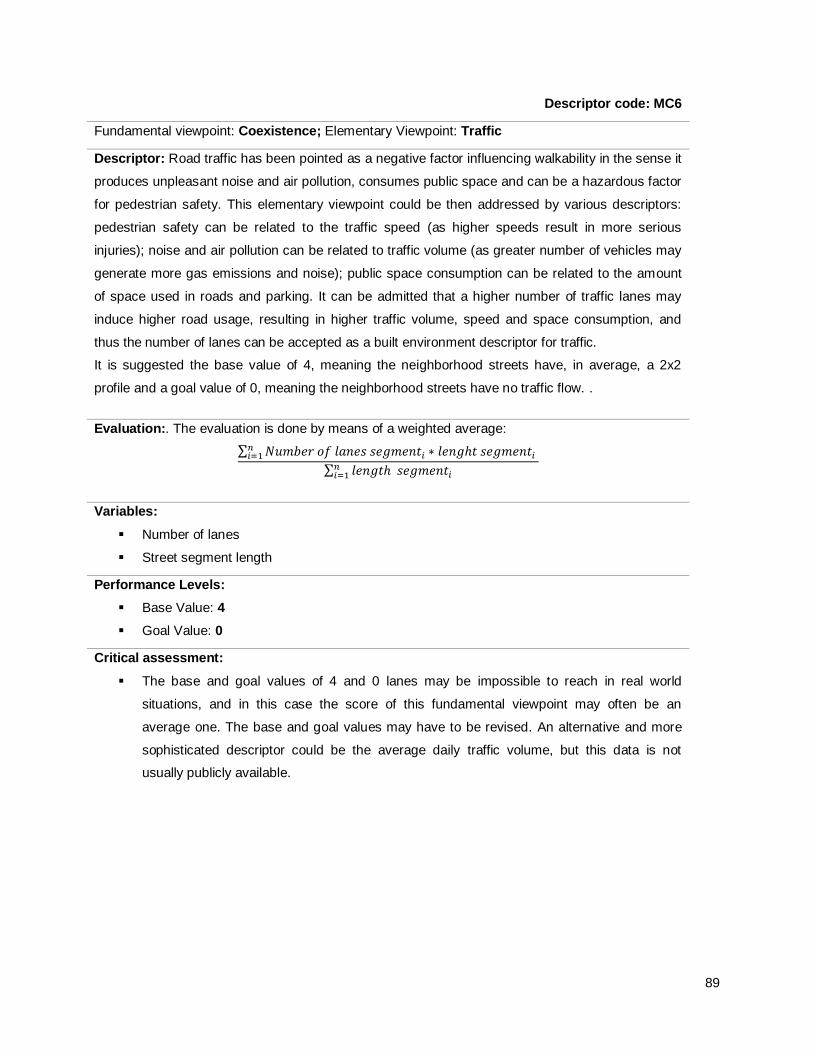
89
Descriptor code: MC6
Fundamental viewpoint: Coexistence; Elementary Viewpoint: Traffic
Descriptor: Road traffic has been pointed as a negative factor influencing walkability in the sense it
produces unpleasant noise and air pollution, consumes public space and can be a hazardous factor
for pedestrian safety. This elementary viewpoint could be then addressed by various descriptors:
pedestrian safety can be related to the traffic speed (as higher speeds result in more serious
injuries); noise and air pollution can be related to traffic volume (as greater number of vehicles may
generate more gas emissions and noise); public space consumption can be related to the amount
of space used in roads and parking. It can be admitted that a higher number of traffic lanes may
induce higher road usage, resulting in higher traffic volume, speed and space consumption, and
thus the number of lanes can be accepted as a built environment descriptor for traffic.
It is suggested the base value of 4, meaning the neighborhood streets have, in average, a 2x2
profile and a goal value of 0, meaning the neighborhood streets have no traffic flow. .
Evaluation:. The evaluation is done by means of a weighted average:
∑
∑
Variables:
Number of lanes
Street segment length
Performance Levels:
Base Value: 4
Goal Value: 0
Critical assessment:
The base and goal values of 4 and 0 lanes may be impossible to reach in real world
situations, and in this case the score of this fundamental viewpoint may often be an
average one. The base and goal values may have to be revised. An alternative and more
sophisticated descriptor could be the average daily traffic volume, but this data is not
usually publicly available.
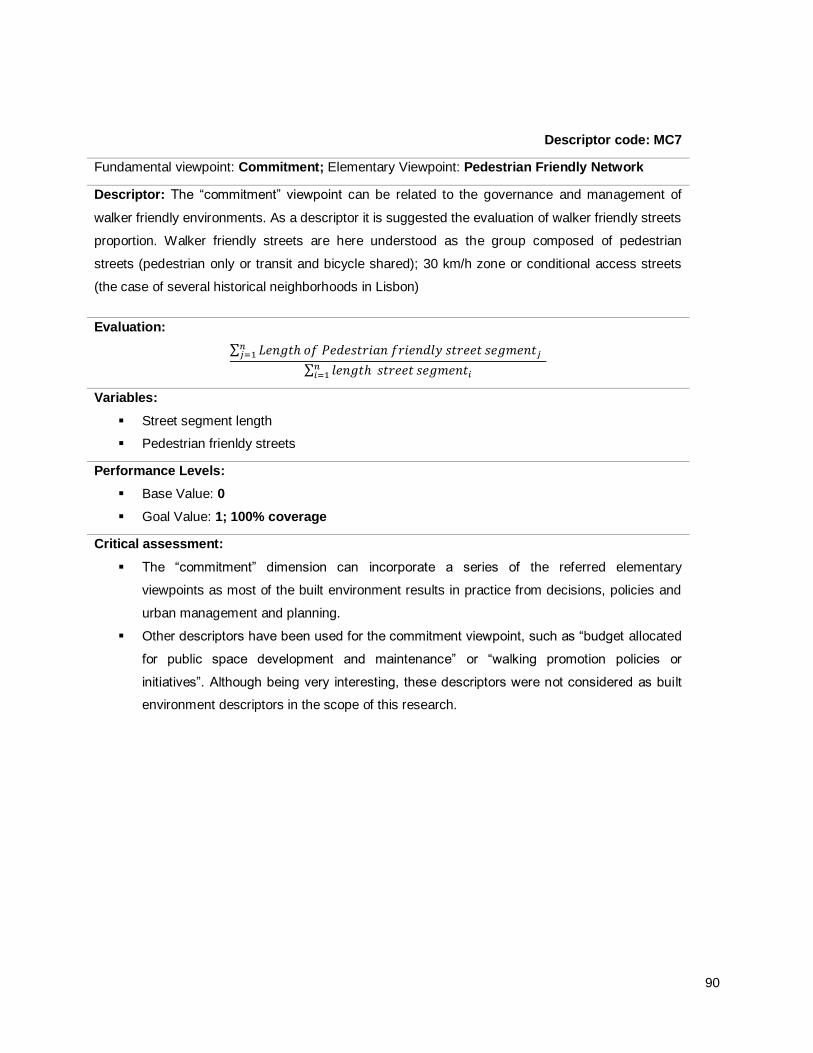
90
Descriptor code: MC7
Fundamental viewpoint: Commitment; Elementary Viewpoint: Pedestrian Friendly Network
Descriptor: The “commitment” viewpoint can be related to the governance and management of
walker friendly environments. As a descriptor it is suggested the evaluation of walker friendly streets
proportion. Walker friendly streets are here understood as the group composed of pedestrian
streets (pedestrian only or transit and bicycle shared); 30 km/h zone or conditional access streets
(the case of several historical neighborhoods in Lisbon)
Evaluation:
∑
∑
Variables:
Street segment length
Pedestrian frienldy streets
Performance Levels:
Base Value: 0
Goal Value: 1; 100% coverage
Critical assessment:
The “commitment” dimension can incorporate a series of the referred elementary
viewpoints as most of the built environment results in practice from decisions, policies and
urban management and planning.
Other descriptors have been used for the commitment viewpoint, such as “budget allocated
for public space development and maintenance” or “walking promotion policies or
initiatives”. Although being very interesting, these descriptors were not considered as built
environment descriptors in the scope of this research.
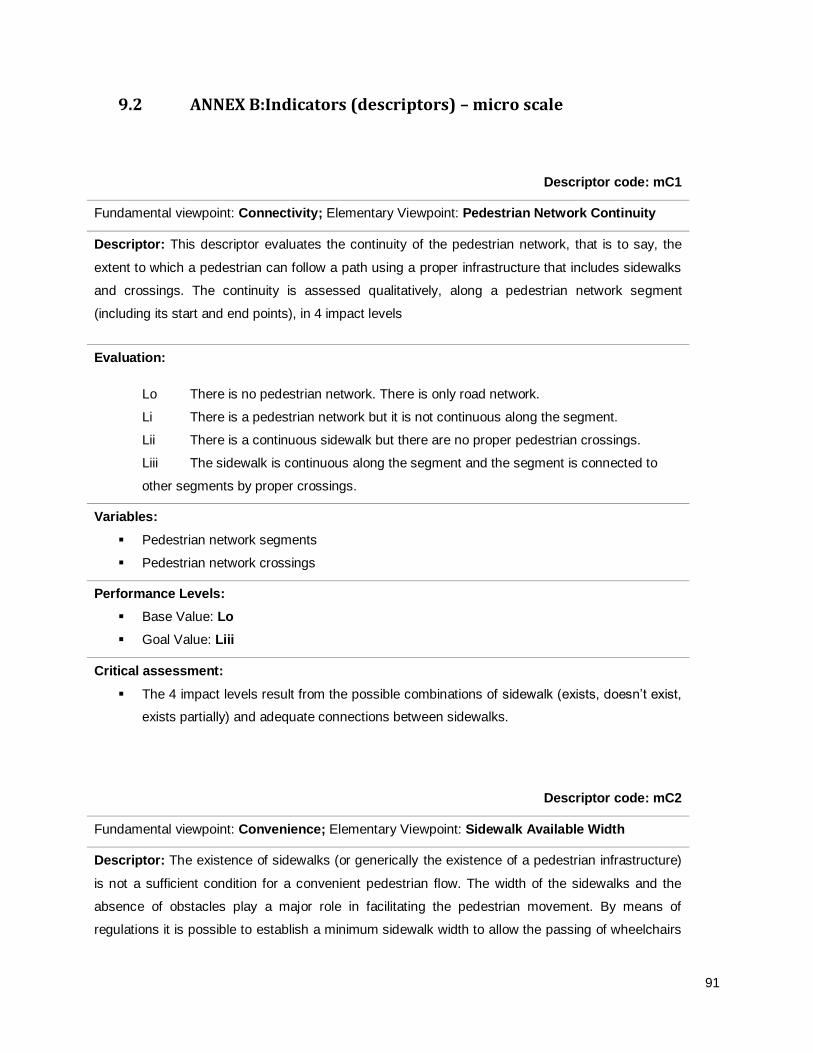
91
9.2 ANNEX B:Indicators (descriptors) – micro scale
Descriptor code: mC1
Fundamental viewpoint: Connectivity; Elementary Viewpoint: Pedestrian Network Continuity
Descriptor: This descriptor evaluates the continuity of the pedestrian network, that is to say, the
extent to which a pedestrian can follow a path using a proper infrastructure that includes sidewalks
and crossings. The continuity is assessed qualitatively, along a pedestrian network segment
(including its start and end points), in 4 impact levels
Evaluation:
Lo There is no pedestrian network. There is only road network.
Li There is a pedestrian network but it is not continuous along the segment.
Lii There is a continuous sidewalk but there are no proper pedestrian crossings.
Liii The sidewalk is continuous along the segment and the segment is connected to
other segments by proper crossings.
Variables:
Pedestrian network segments
Pedestrian network crossings
Performance Levels:
Base Value: Lo
Goal Value: Liii
Critical assessment:
The 4 impact levels result from the possible combinations of sidewalk (exists, doesn’t exist,
exists partially) and adequate connections between sidewalks.
Descriptor code: mC2
Fundamental viewpoint: Convenience; Elementary Viewpoint: Sidewalk Available Width
Descriptor: The existence of sidewalks (or generically the existence of a pedestrian infrastructure)
is not a sufficient condition for a convenient pedestrian flow. The width of the sidewalks and the
absence of obstacles play a major role in facilitating the pedestrian movement. By means of
regulations it is possible to establish a minimum sidewalk width to allow the passing of wheelchairs
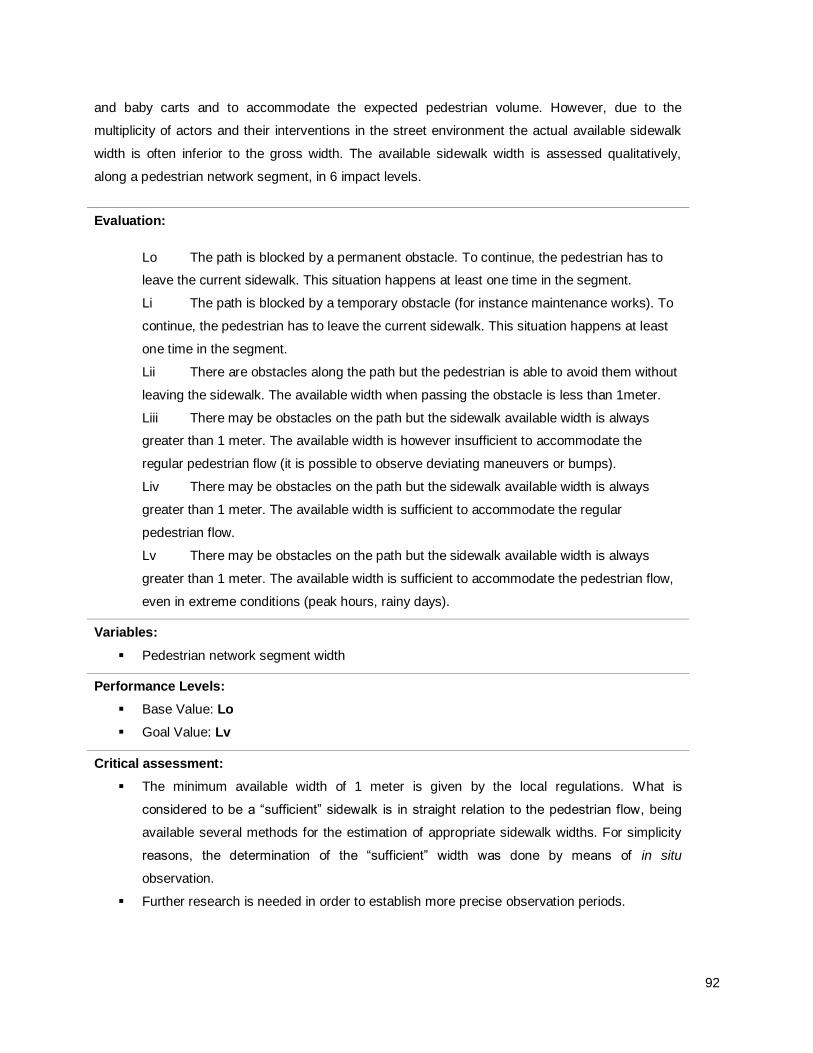
92
and baby carts and to accommodate the expected pedestrian volume. However, due to the
multiplicity of actors and their interventions in the street environment the actual available sidewalk
width is often inferior to the gross width. The available sidewalk width is assessed qualitatively,
along a pedestrian network segment, in 6 impact levels.
Evaluation:
Lo The path is blocked by a permanent obstacle. To continue, the pedestrian has to
leave the current sidewalk. This situation happens at least one time in the segment.
Li The path is blocked by a temporary obstacle (for instance maintenance works). To
continue, the pedestrian has to leave the current sidewalk. This situation happens at least
one time in the segment.
Lii There are obstacles along the path but the pedestrian is able to avoid them without
leaving the sidewalk. The available width when passing the obstacle is less than 1meter.
Liii There may be obstacles on the path but the sidewalk available width is always
greater than 1 meter. The available width is however insufficient to accommodate the
regular pedestrian flow (it is possible to observe deviating maneuvers or bumps).
Liv There may be obstacles on the path but the sidewalk available width is always
greater than 1 meter. The available width is sufficient to accommodate the regular
pedestrian flow.
Lv There may be obstacles on the path but the sidewalk available width is always
greater than 1 meter. The available width is sufficient to accommodate the pedestrian flow,
even in extreme conditions (peak hours, rainy days).
Variables:
Pedestrian network segment width
Performance Levels:
Base Value: Lo
Goal Value: Lv
Critical assessment:
The minimum available width of 1 meter is given by the local regulations. What is
considered to be a “sufficient” sidewalk is in straight relation to the pedestrian flow, being
available several methods for the estimation of appropriate sidewalk widths. For simplicity
reasons, the determination of the “sufficient” width was done by means of in situ
observation.
Further research is needed in order to establish more precise observation periods.
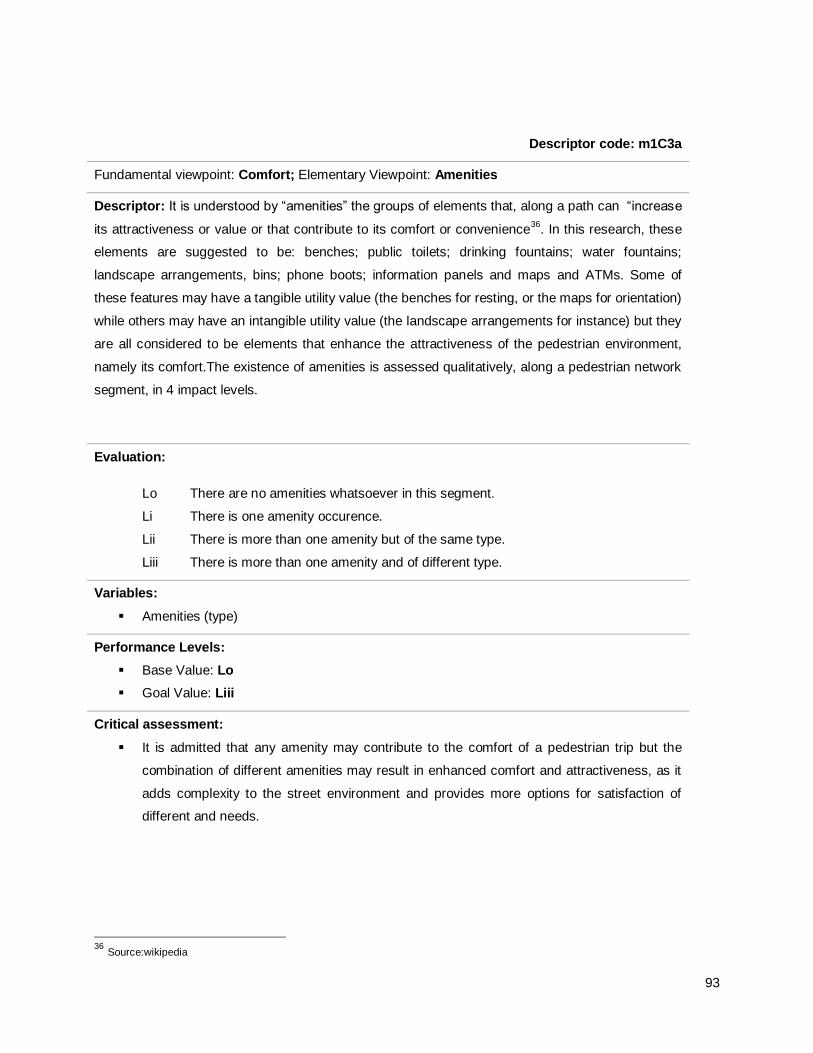
93
Descriptor code: m1C3a
Fundamental viewpoint: Comfort; Elementary Viewpoint: Amenities
Descriptor: It is understood by “amenities” the groups of elements that, along a path can “increase
its attractiveness or value or that contribute to its comfort or convenience36
. In this research, these
elements are suggested to be: benches; public toilets; drinking fountains; water fountains;
landscape arrangements, bins; phone boots; information panels and maps and ATMs. Some of
these features may have a tangible utility value (the benches for resting, or the maps for orientation)
while others may have an intangible utility value (the landscape arrangements for instance) but they
are all considered to be elements that enhance the attractiveness of the pedestrian environment,
namely its comfort.The existence of amenities is assessed qualitatively, along a pedestrian network
segment, in 4 impact levels.
Evaluation:
Lo There are no amenities whatsoever in this segment.
Li There is one amenity occurence.
Lii There is more than one amenity but of the same type.
Liii There is more than one amenity and of different type.
Variables:
Amenities (type)
Performance Levels:
Base Value: Lo
Goal Value: Liii
Critical assessment:
It is admitted that any amenity may contribute to the comfort of a pedestrian trip but the
combination of different amenities may result in enhanced comfort and attractiveness, as it
adds complexity to the street environment and provides more options for satisfaction of
different and needs.
36
Source:wikipedia
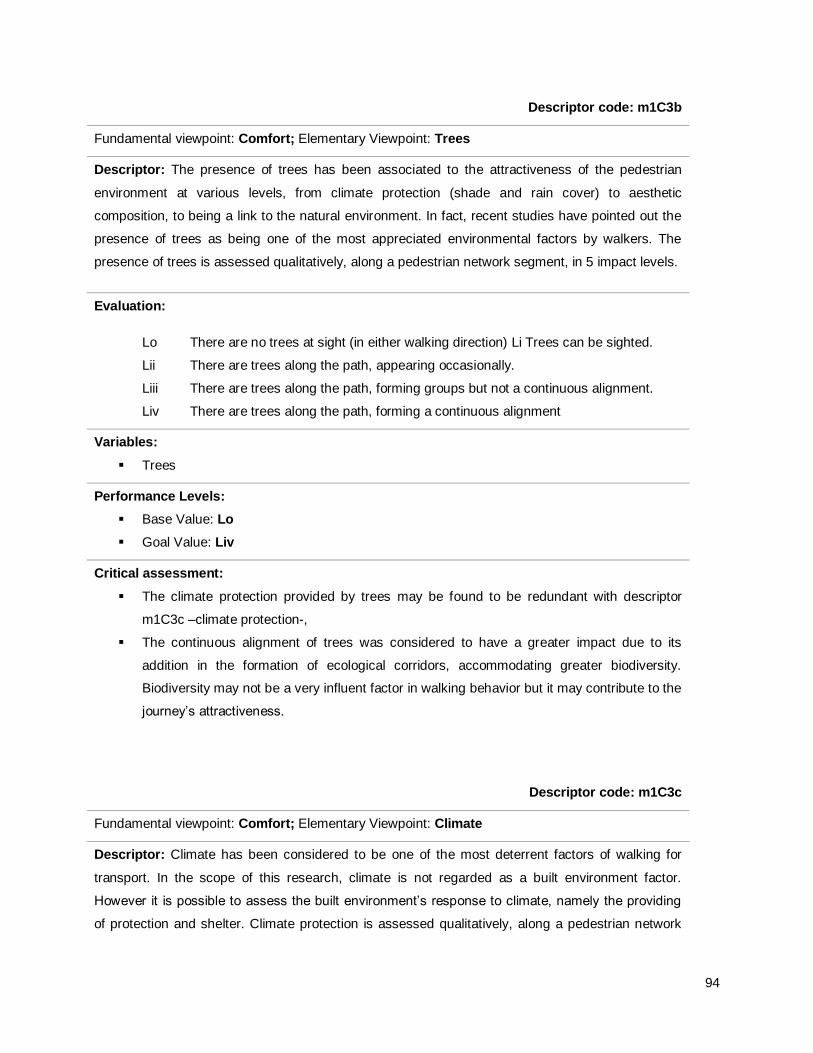
94
Descriptor code: m1C3b
Fundamental viewpoint: Comfort; Elementary Viewpoint: Trees
Descriptor: The presence of trees has been associated to the attractiveness of the pedestrian
environment at various levels, from climate protection (shade and rain cover) to aesthetic
composition, to being a link to the natural environment. In fact, recent studies have pointed out the
presence of trees as being one of the most appreciated environmental factors by walkers. The
presence of trees is assessed qualitatively, along a pedestrian network segment, in 5 impact levels.
Evaluation:
Lo There are no trees at sight (in either walking direction) Li Trees can be sighted.
Lii There are trees along the path, appearing occasionally.
Liii There are trees along the path, forming groups but not a continuous alignment.
Liv There are trees along the path, forming a continuous alignment
Variables:
Trees
Performance Levels:
Base Value: Lo
Goal Value: Liv
Critical assessment:
The climate protection provided by trees may be found to be redundant with descriptor
m1C3c –climate protection-,
The continuous alignment of trees was considered to have a greater impact due to its
addition in the formation of ecological corridors, accommodating greater biodiversity.
Biodiversity may not be a very influent factor in walking behavior but it may contribute to the
journey’s attractiveness.
Descriptor code: m1C3c
Fundamental viewpoint: Comfort; Elementary Viewpoint: Climate
Descriptor: Climate has been considered to be one of the most deterrent factors of walking for
transport. In the scope of this research, climate is not regarded as a built environment factor.
However it is possible to assess the built environment’s response to climate, namely the providing
of protection and shelter. Climate protection is assessed qualitatively, along a pedestrian network
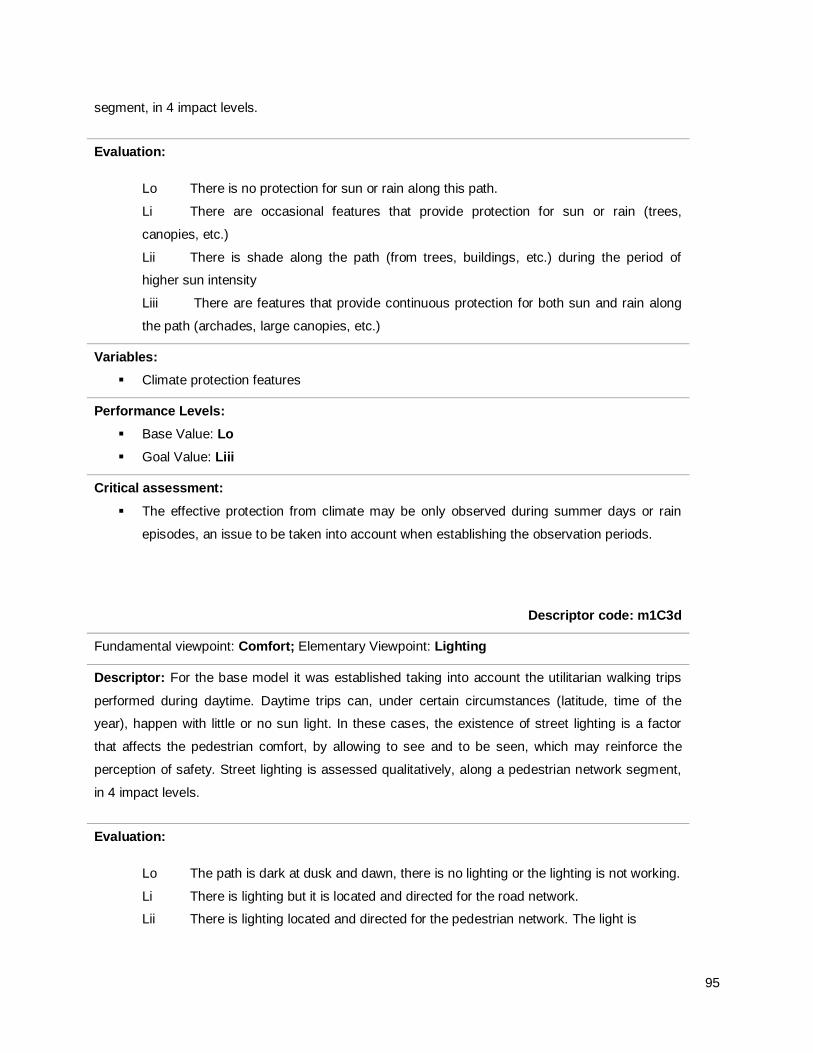
95
segment, in 4 impact levels.
Evaluation:
Lo There is no protection for sun or rain along this path.
Li There are occasional features that provide protection for sun or rain (trees,
canopies, etc.)
Lii There is shade along the path (from trees, buildings, etc.) during the period of
higher sun intensity
Liii There are features that provide continuous protection for both sun and rain along
the path (archades, large canopies, etc.)
Variables:
Climate protection features
Performance Levels:
Base Value: Lo
Goal Value: Liii
Critical assessment:
The effective protection from climate may be only observed during summer days or rain
episodes, an issue to be taken into account when establishing the observation periods.
Descriptor code: m1C3d
Fundamental viewpoint: Comfort; Elementary Viewpoint: Lighting
Descriptor: For the base model it was established taking into account the utilitarian walking trips
performed during daytime. Daytime trips can, under certain circumstances (latitude, time of the
year), happen with little or no sun light. In these cases, the existence of street lighting is a factor
that affects the pedestrian comfort, by allowing to see and to be seen, which may reinforce the
perception of safety. Street lighting is assessed qualitatively, along a pedestrian network segment,
in 4 impact levels.
Evaluation:
Lo The path is dark at dusk and dawn, there is no lighting or the lighting is not working.
Li There is lighting but it is located and directed for the road network.
Lii There is lighting located and directed for the pedestrian network. The light is
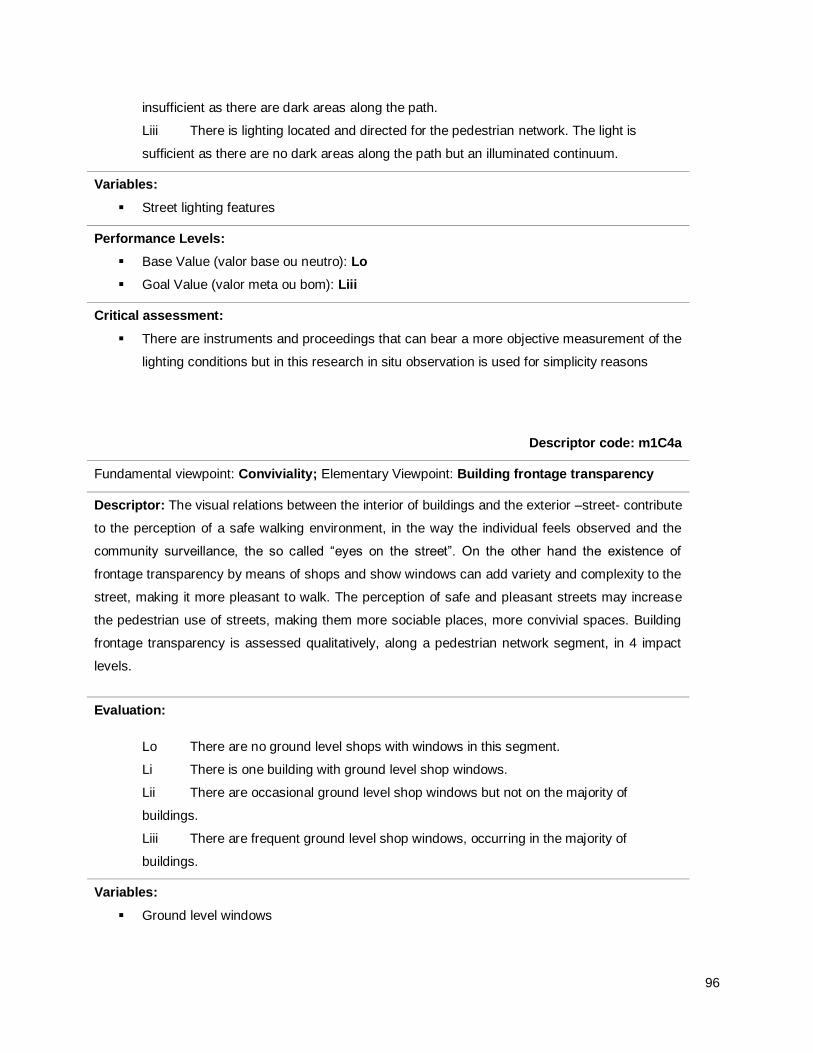
96
insufficient as there are dark areas along the path.
Liii There is lighting located and directed for the pedestrian network. The light is
sufficient as there are no dark areas along the path but an illuminated continuum.
Variables:
Street lighting features
Performance Levels:
Base Value (valor base ou neutro): Lo
Goal Value (valor meta ou bom): Liii
Critical assessment:
There are instruments and proceedings that can bear a more objective measurement of the
lighting conditions but in this research in situ observation is used for simplicity reasons
Descriptor code: m1C4a
Fundamental viewpoint: Conviviality; Elementary Viewpoint: Building frontage transparency
Descriptor: The visual relations between the interior of buildings and the exterior –street- contribute
to the perception of a safe walking environment, in the way the individual feels observed and the
community surveillance, the so called “eyes on the street”. On the other hand the existence of
frontage transparency by means of shops and show windows can add variety and complexity to the
street, making it more pleasant to walk. The perception of safe and pleasant streets may increase
the pedestrian use of streets, making them more sociable places, more convivial spaces. Building
frontage transparency is assessed qualitatively, along a pedestrian network segment, in 4 impact
levels.
Evaluation:
Lo There are no ground level shops with windows in this segment.
Li There is one building with ground level shop windows.
Lii There are occasional ground level shop windows but not on the majority of
buildings.
Liii There are frequent ground level shop windows, occurring in the majority of
buildings.
Variables:
Ground level windows
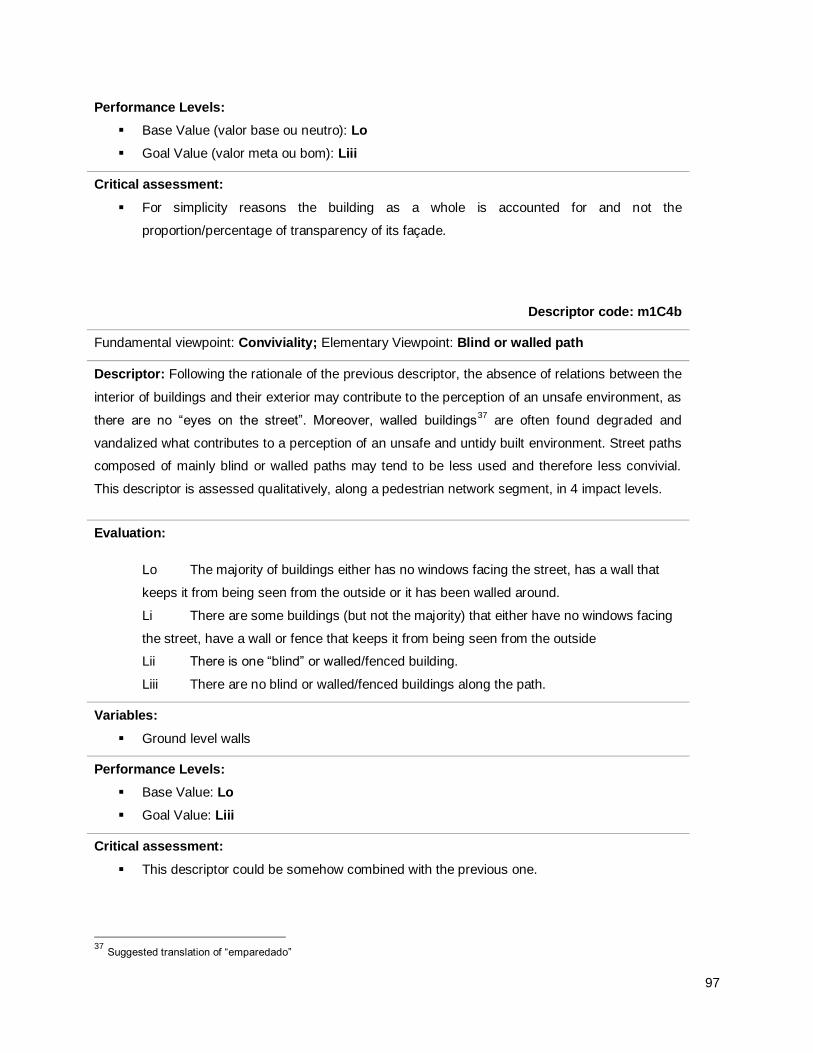
97
Performance Levels:
Base Value (valor base ou neutro): Lo
Goal Value (valor meta ou bom): Liii
Critical assessment:
For simplicity reasons the building as a whole is accounted for and not the
proportion/percentage of transparency of its façade.
Descriptor code: m1C4b
Fundamental viewpoint: Conviviality; Elementary Viewpoint: Blind or walled path
Descriptor: Following the rationale of the previous descriptor, the absence of relations between the
interior of buildings and their exterior may contribute to the perception of an unsafe environment, as
there are no “eyes on the street”. Moreover, walled buildings37
are often found degraded and
vandalized what contributes to a perception of an unsafe and untidy built environment. Street paths
composed of mainly blind or walled paths may tend to be less used and therefore less convivial.
This descriptor is assessed qualitatively, along a pedestrian network segment, in 4 impact levels.
Evaluation:
Lo The majority of buildings either has no windows facing the street, has a wall that
keeps it from being seen from the outside or it has been walled around.
Li There are some buildings (but not the majority) that either have no windows facing
the street, have a wall or fence that keeps it from being seen from the outside
Lii There is one “blind” or walled/fenced building.
Liii There are no blind or walled/fenced buildings along the path.
Variables:
Ground level walls
Performance Levels:
Base Value: Lo
Goal Value: Liii
Critical assessment:
This descriptor could be somehow combined with the previous one.
37
Suggested translation of “emparedado”
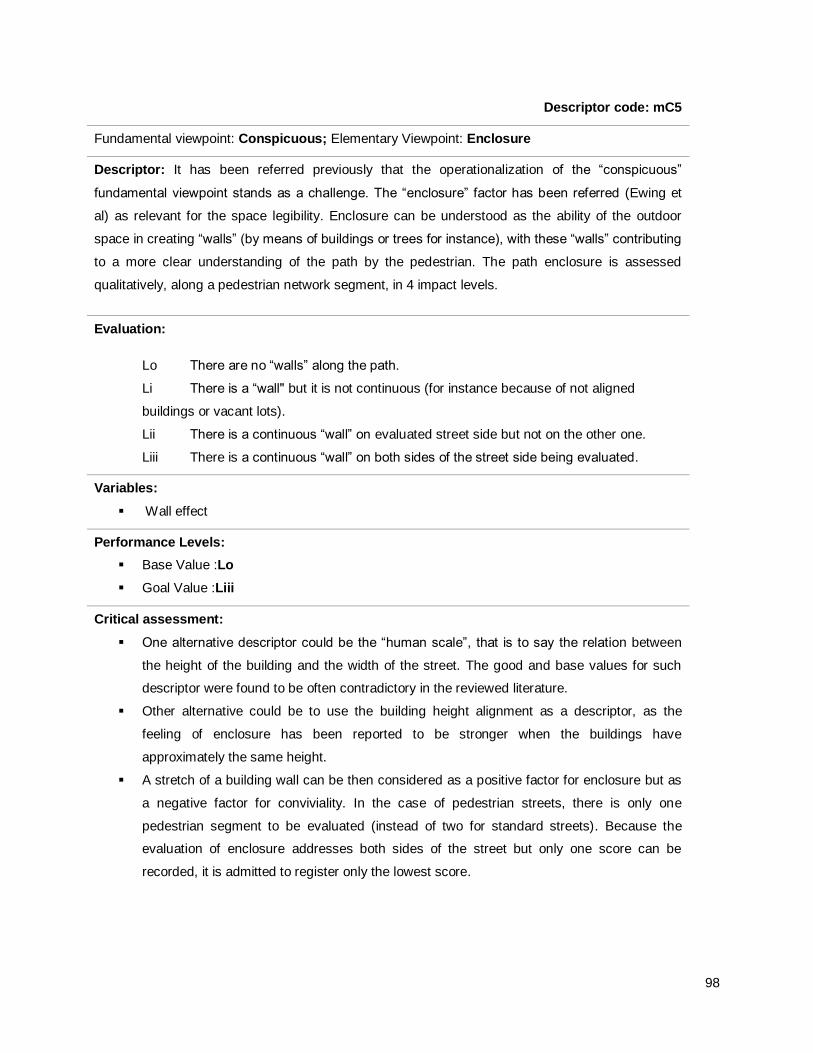
98
Descriptor code: mC5
Fundamental viewpoint: Conspicuous; Elementary Viewpoint: Enclosure
Descriptor: It has been referred previously that the operationalization of the “conspicuous”
fundamental viewpoint stands as a challenge. The “enclosure” factor has been referred (Ewing et
al) as relevant for the space legibility. Enclosure can be understood as the ability of the outdoor
space in creating “walls” (by means of buildings or trees for instance), with these “walls” contributing
to a more clear understanding of the path by the pedestrian. The path enclosure is assessed
qualitatively, along a pedestrian network segment, in 4 impact levels.
Evaluation:
Lo There are no “walls” along the path.
Li There is a “wall" but it is not continuous (for instance because of not aligned
buildings or vacant lots).
Lii There is a continuous “wall” on evaluated street side but not on the other one.
Liii There is a continuous “wall” on both sides of the street side being evaluated.
Variables:
Wall effect
Performance Levels:
Base Value :Lo
Goal Value :Liii
Critical assessment:
One alternative descriptor could be the “human scale”, that is to say the relation between
the height of the building and the width of the street. The good and base values for such
descriptor were found to be often contradictory in the reviewed literature.
Other alternative could be to use the building height alignment as a descriptor, as the
feeling of enclosure has been reported to be stronger when the buildings have
approximately the same height.
A stretch of a building wall can be then considered as a positive factor for enclosure but as
a negative factor for conviviality. In the case of pedestrian streets, there is only one
pedestrian segment to be evaluated (instead of two for standard streets). Because the
evaluation of enclosure addresses both sides of the street but only one score can be
recorded, it is admitted to register only the lowest score.
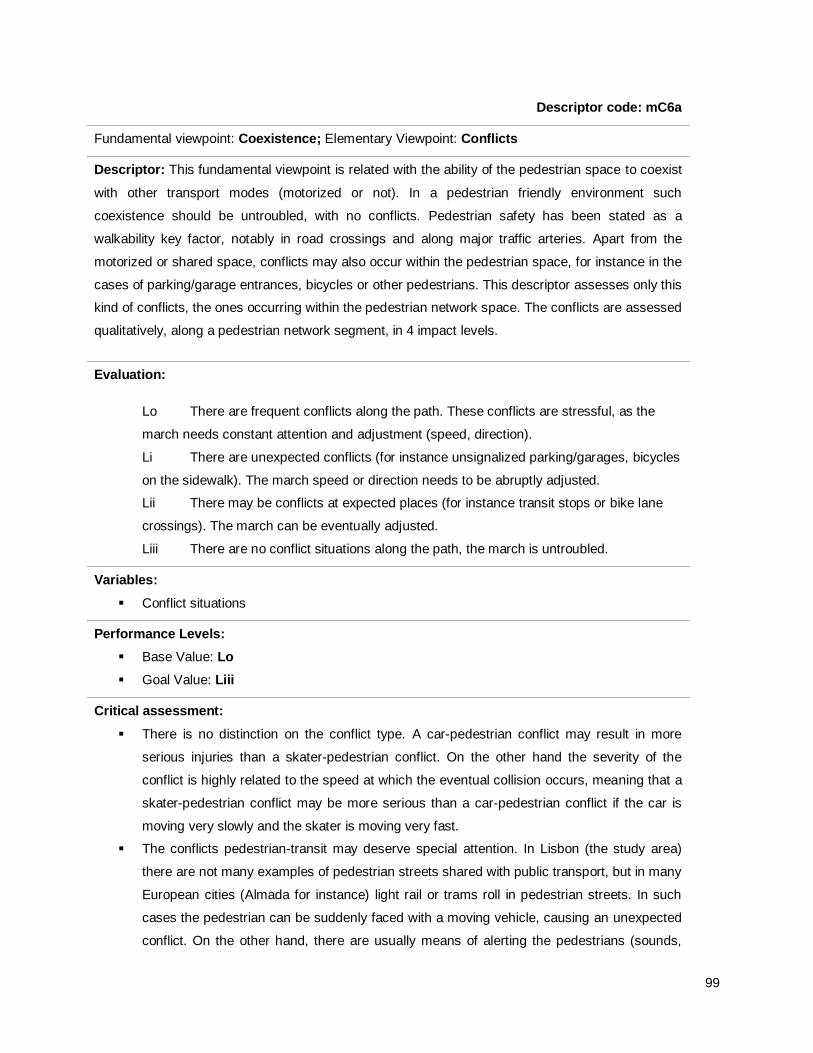
99
Descriptor code: mC6a
Fundamental viewpoint: Coexistence; Elementary Viewpoint: Conflicts
Descriptor: This fundamental viewpoint is related with the ability of the pedestrian space to coexist
with other transport modes (motorized or not). In a pedestrian friendly environment such
coexistence should be untroubled, with no conflicts. Pedestrian safety has been stated as a
walkability key factor, notably in road crossings and along major traffic arteries. Apart from the
motorized or shared space, conflicts may also occur within the pedestrian space, for instance in the
cases of parking/garage entrances, bicycles or other pedestrians. This descriptor assesses only this
kind of conflicts, the ones occurring within the pedestrian network space. The conflicts are assessed
qualitatively, along a pedestrian network segment, in 4 impact levels.
Evaluation:
Lo There are frequent conflicts along the path. These conflicts are stressful, as the
march needs constant attention and adjustment (speed, direction).
Li There are unexpected conflicts (for instance unsignalized parking/garages, bicycles
on the sidewalk). The march speed or direction needs to be abruptly adjusted.
Lii There may be conflicts at expected places (for instance transit stops or bike lane
crossings). The march can be eventually adjusted.
Liii There are no conflict situations along the path, the march is untroubled.
Variables:
Conflict situations
Performance Levels:
Base Value: Lo
Goal Value: Liii
Critical assessment:
There is no distinction on the conflict type. A car-pedestrian conflict may result in more
serious injuries than a skater-pedestrian conflict. On the other hand the severity of the
conflict is highly related to the speed at which the eventual collision occurs, meaning that a
skater-pedestrian conflict may be more serious than a car-pedestrian conflict if the car is
moving very slowly and the skater is moving very fast.
The conflicts pedestrian-transit may deserve special attention. In Lisbon (the study area)
there are not many examples of pedestrian streets shared with public transport, but in many
European cities (Almada for instance) light rail or trams roll in pedestrian streets. In such
cases the pedestrian can be suddenly faced with a moving vehicle, causing an unexpected
conflict. On the other hand, there are usually means of alerting the pedestrians (sounds,
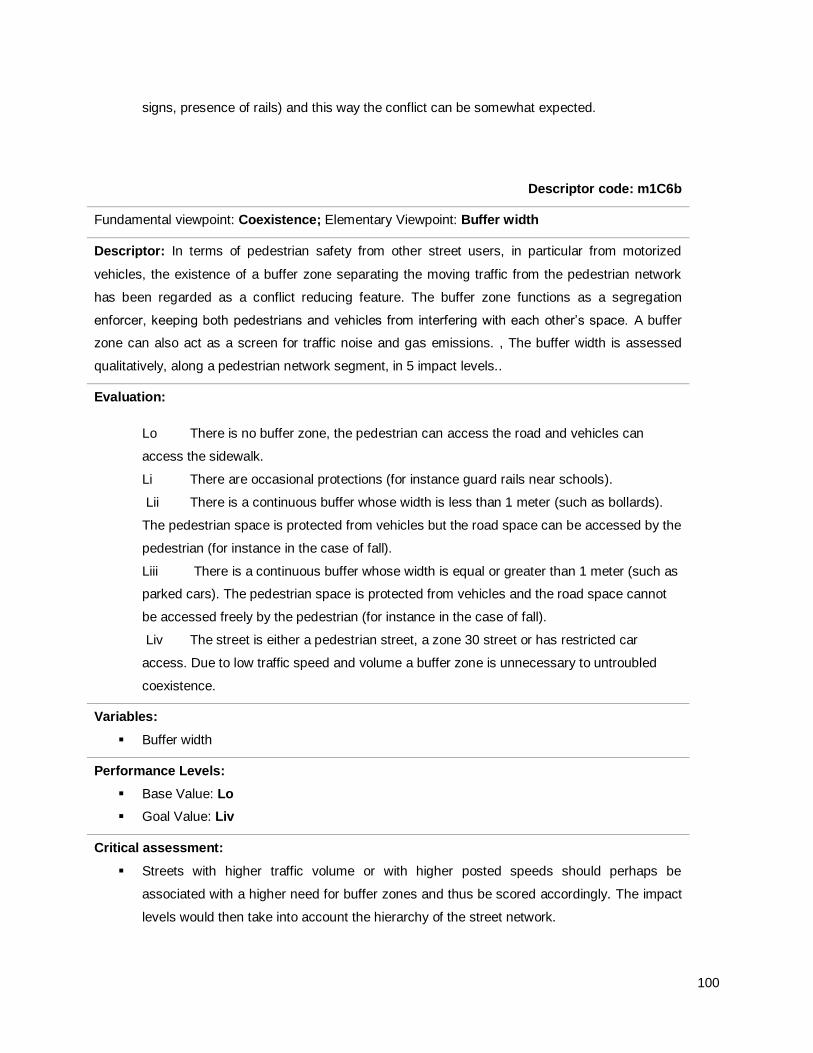
100
signs, presence of rails) and this way the conflict can be somewhat expected.
Descriptor code: m1C6b
Fundamental viewpoint: Coexistence; Elementary Viewpoint: Buffer width
Descriptor: In terms of pedestrian safety from other street users, in particular from motorized
vehicles, the existence of a buffer zone separating the moving traffic from the pedestrian network
has been regarded as a conflict reducing feature. The buffer zone functions as a segregation
enforcer, keeping both pedestrians and vehicles from interfering with each other’s space. A buffer
zone can also act as a screen for traffic noise and gas emissions. , The buffer width is assessed
qualitatively, along a pedestrian network segment, in 5 impact levels..
Evaluation:
Lo There is no buffer zone, the pedestrian can access the road and vehicles can
access the sidewalk.
Li There are occasional protections (for instance guard rails near schools).
Lii There is a continuous buffer whose width is less than 1 meter (such as bollards).
The pedestrian space is protected from vehicles but the road space can be accessed by the
pedestrian (for instance in the case of fall).
Liii There is a continuous buffer whose width is equal or greater than 1 meter (such as
parked cars). The pedestrian space is protected from vehicles and the road space cannot
be accessed freely by the pedestrian (for instance in the case of fall).
Liv The street is either a pedestrian street, a zone 30 street or has restricted car
access. Due to low traffic speed and volume a buffer zone is unnecessary to untroubled
coexistence.
Variables:
Buffer width
Performance Levels:
Base Value: Lo
Goal Value: Liv
Critical assessment:
Streets with higher traffic volume or with higher posted speeds should perhaps be
associated with a higher need for buffer zones and thus be scored accordingly. The impact
levels would then take into account the hierarchy of the street network.
101
Descriptor code: m1C7a
Fundamental viewpoint: Commitment; Elementary Viewpoint: Maintenance
Descriptor: A proper and well-kept sidewalk, apart from being apprehended as a comfortable or as
a convenient sidewalk, is primarily apprehended as a more attractive sidewalk than a poor-kept
sidewalk. The effort of keeping the pedestrian infrastructure under good conditions and
maintenance can hereby be understood as a “commitment” from the urban management board.
The maintenance is assessed qualitatively, along a pedestrian network segment, in 5 impact levels.
Evaluation:
Lo There is no sidewalk.
Li Some parts of the sidewalk are missing paving. There are potholes or puddles
difficult to avoid. There is tripping hazard.
Lii There are potholes or puddles in the sidewalk but they can be bypassed. There
are visible signs of lack of maintenance (weeds, worn out paving).
Liii The sidewalk has no potholes or puddles and it is well maintained. However it has
an irregular surface.
Liv The sidewalk has no potholes or puddles and it is well maintained. It has a regular
and smooth walking surface.
Variables:
Sidewalk condition.
Performance Levels:
Base Value: Lo
Goal Value: Liv
Critical assessment:
The quality of the paving is not appraised. In the case of Lisbon, the sidewalk paving is
usually made of cobblestones and the question should be made primarily if such material is
actually a good choice for a pedestrian infrastructure and only after the quality of the
pavement surface should be assessed.
The conditions of adherence and tripping hazards should perhaps be included in this
evaluation.
102
Descriptor code: m1C7b
Fundamental viewpoint: Commitment; Elementary Viewpoint: Cleanliness
Descriptor: Following the same principle of the previous descriptor, a clean sidewalk Apart from
being apprehended as a comfortable or as a convenient sidewalk is primarily apprehended as a
more attractive sidewalk than a dirty sidewalk. The effort of keeping the pedestrian infrastructure
under good cleanliness conditions can hereby be understood as a “commitment” from the
population. It is assessed qualitatively, along a pedestrian network segment, in 5 impact levels.
Evaluation:
Lo The sidewalk is dirty. There is a great amount of litter and odor. Changing street
side is advisable.
Li There are piles of litter in the sidewalk that obstruct and interfere with the march.
Lii There is litter on the ground. The pedestrian has to be cautious not to trip or step
on it (broken glass, debris, droppings).
Liii There is litter on the ground. It is noticeable but it doesn’t affect the march (papers,
cigarette filters).
Liv The sidewalk is clean. There is no noticeable litter.
Variables:
Sidewalk condition
Performance Levels:
Base Value: Lo
Goal Value: Liv
Critical assessment:
The street hygiene conditions may depend greatly on the time of the day or on the day of
the week. If there are city cleaning services that follow a certain schedule, the street
evaluation will bear a very different score if it is made just before the passage of the
cleaning squad or just after it. The study area of this research –Bairro Alto in Lisbon- is a
good example. It hosts a series of popular bars and nightclubs. Every morning, until
approx.10 am, the streets are filled with refused plastic glasses, papers and broken glass
from beer bottles. At 11 am the cleaning squads finish tidying the neighborhood. From then
onwards the streets get untidy again from animal droppings and from restaurants and
grocery shops waste. As the nights falls the residents put out the day’s garbage (sometimes
furniture and rubbish). According to this real life example, the same street could have a Lo
score at 10 am; Liv at 11 am; Lii during the day and Li at the end of the day. Further
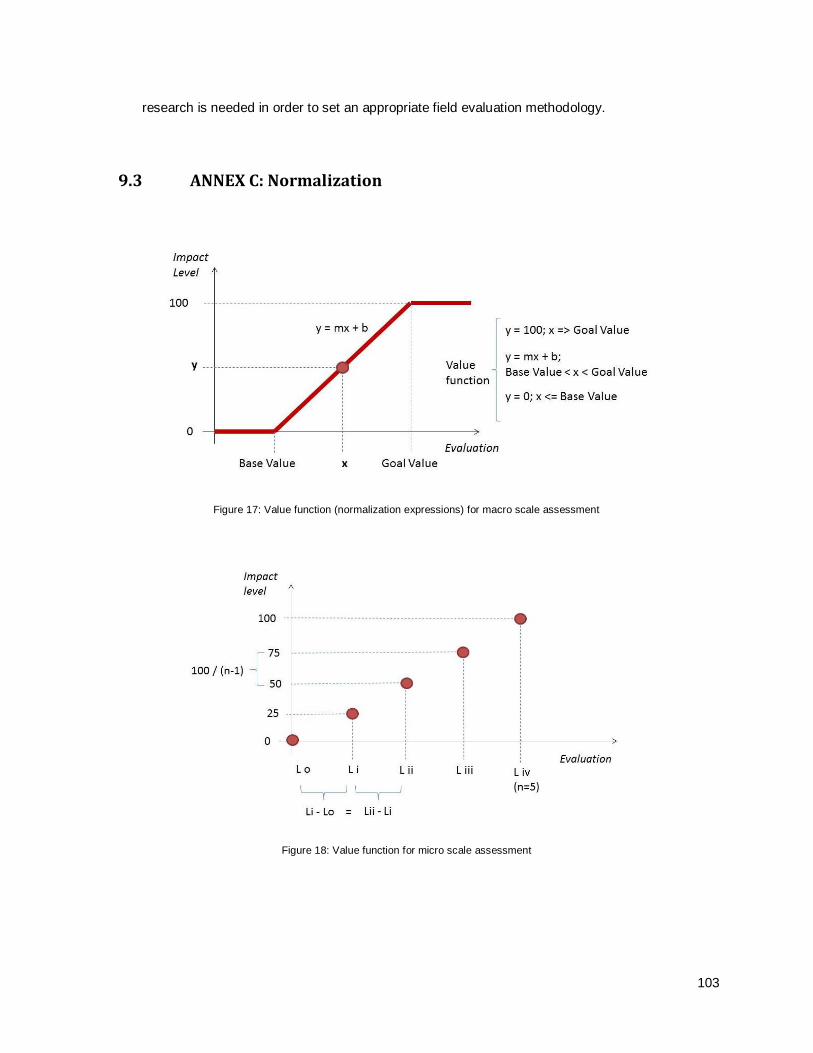
103
research is needed in order to set an appropriate field evaluation methodology.
9.3 ANNEX C: Normalization
Figure 17: Value function (normalization expressions) for macro scale assessment
Figure 18: Value function for micro scale assessment
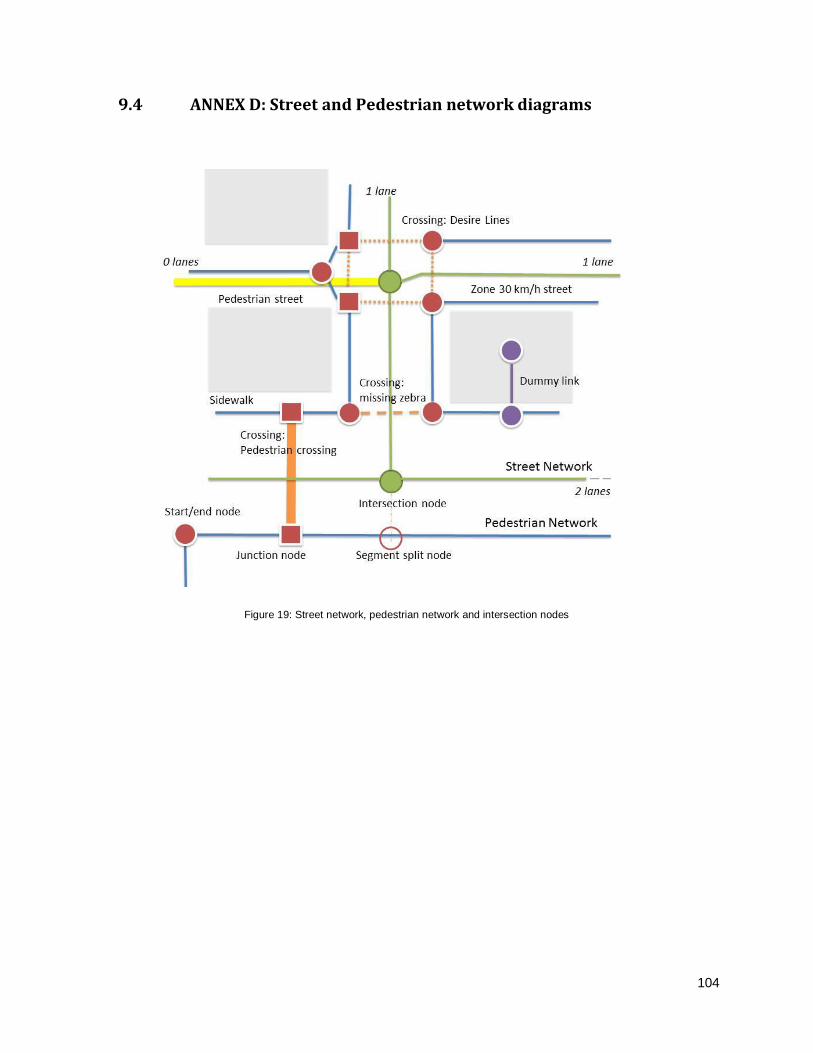
104
9.4 ANNEX D: Street and Pedestrian network diagrams
Figure 19: Street network, pedestrian network and intersection nodes
105
9.5 ANNEX E: Macro Scale GIS analysis and evaluation
MC1a:Street Connectivity
MC1b:Public Transport
MC1c: Integration
MC2c: Essential Land Use
Figure 20: GIS analysis outputs for descriptors MC1a; MC1b; MC1c; MC2c
106
MC3: Sidewalk Availability
MC4: Convivial Points
MC6: Traffic Lanes
MC7: Pedestrian Friendly Streets
Figure 21: GIS analysis outputs for descriptors MC3; MC4; MC6; MC7
107
Calculations
MC1a: Street Connectivity (source: GIS analysis)
original corrected
Number of street segments (a) 186 186 Number of outbound street segments (b) 22 21 Number of intersections (c) 113 95 Number of borderline intersections (d) 17 21
Link to node ratio (a+b)/(c+d) 1,60 1,78
MC1b: Public transport coverage (source: GIS analysis)
[m]
Length of streets covered by Tram;Bus;Metro;Train (a) 8339 Length of street network (b)
8339
[%]
Public transport coverage (a)/(b) 100
MC1c: Integration (source: GIS analysis)
Actual Distance
Path Directness
[m] (a..h)/(i)
N intersection point (a) 1018,6 1,27 NE intersection point (b) 1094,8 1,37 E intersection point (c) 981,4 1,23 SE intersection point (d) 1073,8 1,34 S intersection point (e) 958,9 1,20 SW intersection point (f) 1046,4 1,31 W intersection point (g) 1056 1,32 NW intersection point (h) 893,7 1,12
Straight Line distance from center point (i) 800
Average path directness (a+b+...+h)/8
1,27
Integration index 1,27
C2a: Land Use Mix (source: Portuguese Statistics – INE, Census data
2001)
[buildings]
Existing buildings (a) 685 Buildings with exclusive residential use (b) 424 Mainly residential buildings (c) 245 Mainly non-residential buildings (d) 16 Buildings with exclusive non-residential use (e) 0
Mixed Use buildings (f)=(c)+(d) 261
Land use Entropy index
Proportion Ln (Proportion)
Proportion* Ln(Proportion)
[buildings] [%]
Land Use 1: Exclusive residential use 424 61,8% -0,4811 -0,2974 Land Use 2: Mixed use 261 38,0% -0,9664 -0,3677
108
* Land Use 3: Exclusive non-residential use 1 0,1% -6,5309 -0,0095 Total buildings 686
Number of land use classes 3
Land Use Mix index 0,61 * data on non-residential buildings was not available
MC2b: Residential density (source:INE, Census data 2001)
Study area surface [hectares] (a)
18,51
Existing homesteads (b)
2787 * Homesteads for family permanent residence (c)
2028
** Homesteads with standard living conditions (d)
2765
Gross residential density (b)/(a)
150,5 Gross residential density, permanent residence (c)/(a) 109,5 Gross residential density, standard homes (d)/(a) 149,3 * excludes vacant or holiday houses
** excludes improvised homes, tents and mobile homes
MC2c: Essential Land Use coverage (source: GIS analysis)
[m]
Length of streets covered by essential land uses (a) 8339 Length of street network (b)
8339
[%]
Essential land use coverage (a)/(b) 100
MC3: Pedestrian network availability (source: GIS analysis)
[m]
Length of streets without proper pedestrian infrastructure (a) 1138 Length of streets with proper pedestrian infrastructure (b) 7201 Length of street network (c)
8339
[%] Proportion of streets with proper pedestrian infrastructure (b)/(c) 86,4
MC4: Convivial points coverage (source: GIS analysis)
[m]
Length of streets covered by convivial points (a) 8339 Length of street network (b)
8339
[%]
Proportion of streets with proper pedestrian infrastructure (a)/(b) 100
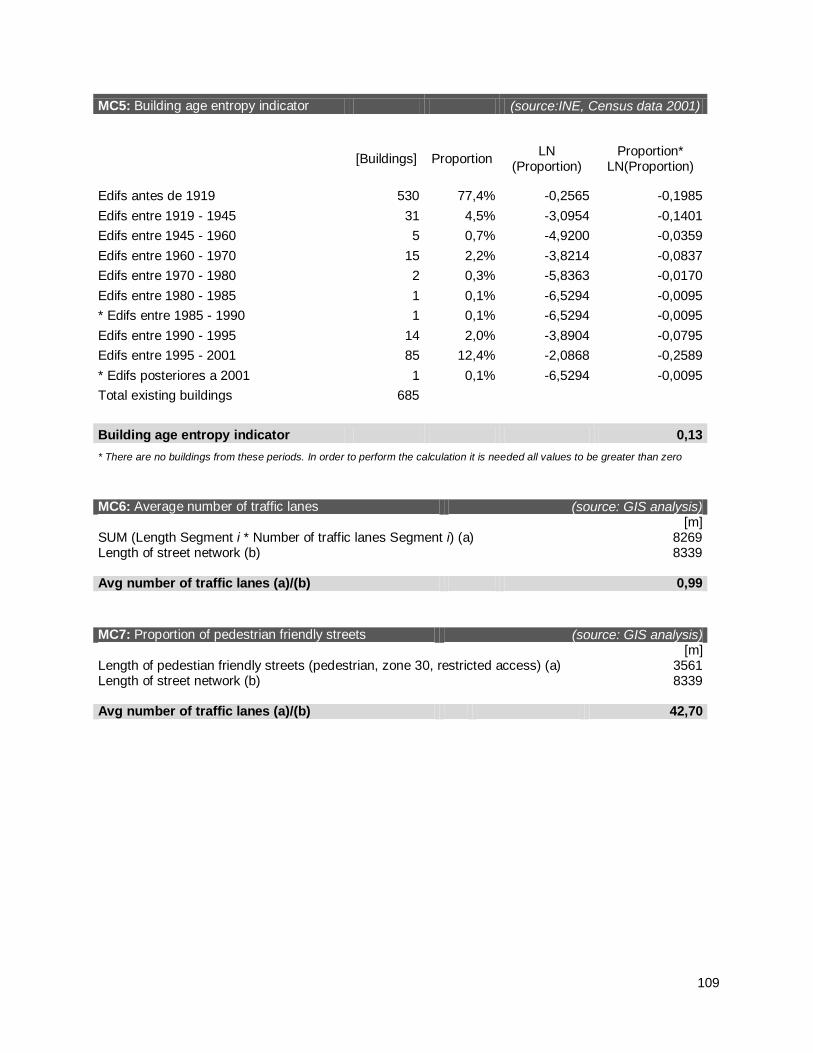
109
MC5: Building age entropy indicator (source:INE, Census data 2001)
[Buildings] Proportion LN
(Proportion) Proportion*
LN(Proportion)
Edifs antes de 1919 530 77,4% -0,2565 -0,1985
Edifs entre 1919 - 1945 31 4,5% -3,0954 -0,1401
Edifs entre 1945 - 1960 5 0,7% -4,9200 -0,0359
Edifs entre 1960 - 1970 15 2,2% -3,8214 -0,0837
Edifs entre 1970 - 1980 2 0,3% -5,8363 -0,0170
Edifs entre 1980 - 1985 1 0,1% -6,5294 -0,0095
* Edifs entre 1985 - 1990 1 0,1% -6,5294 -0,0095
Edifs entre 1990 - 1995 14 2,0% -3,8904 -0,0795
Edifs entre 1995 - 2001 85 12,4% -2,0868 -0,2589
* Edifs posteriores a 2001 1 0,1% -6,5294 -0,0095
Total existing buildings 685
Building age entropy indicator 0,13
* There are no buildings from these periods. In order to perform the calculation it is needed all values to be greater than zero
MC6: Average number of traffic lanes (source: GIS analysis)
[m]
SUM (Length Segment i * Number of traffic lanes Segment i) (a) 8269 Length of street network (b)
8339
Avg number of traffic lanes (a)/(b) 0,99
MC7: Proportion of pedestrian friendly streets (source: GIS analysis)
[m]
Length of pedestian friendly streets (pedestrian, zone 30, restricted access) (a) 3561 Length of street network (b)
8339
Avg number of traffic lanes (a)/(b) 42,70
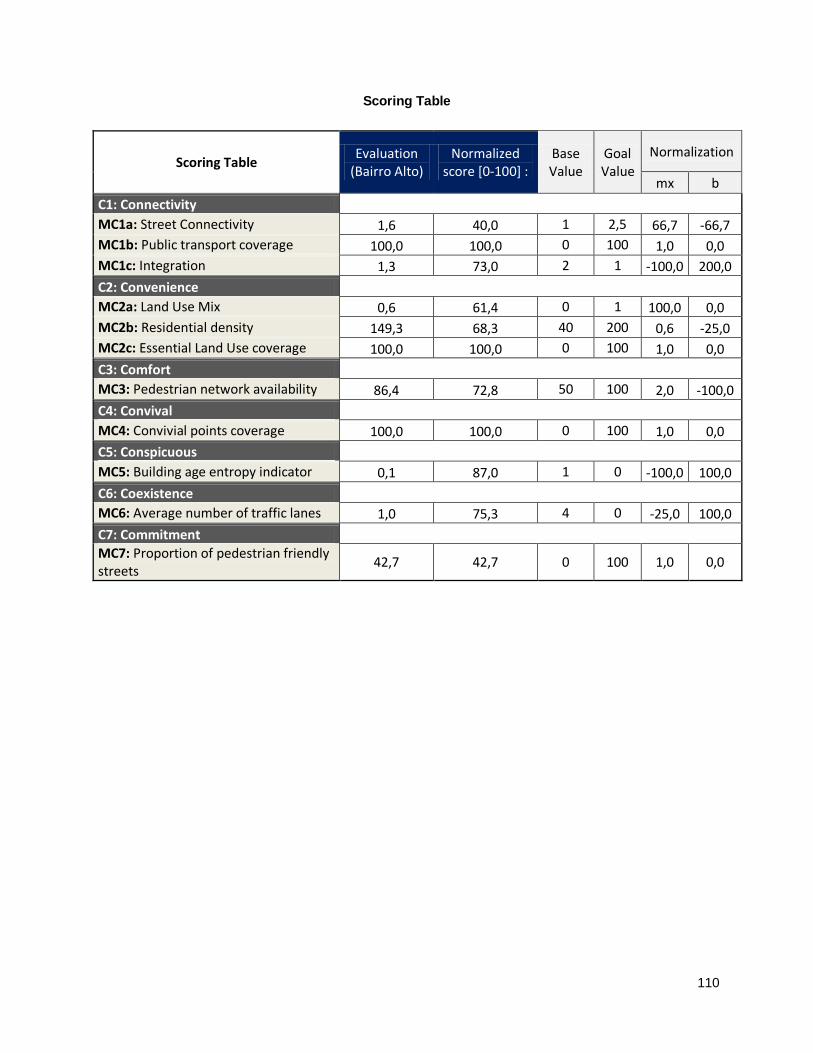
110
Scoring Table
Scoring Table Evaluation
(Bairro Alto) Normalized
score [0-100] : Base Value
Goal Value
Normalization
mx b
C1: Connectivity
MC1a: Street Connectivity 1,6 40,0 1 2,5 66,7 -66,7
MC1b: Public transport coverage 100,0 100,0 0 100 1,0 0,0
MC1c: Integration 1,3 73,0 2 1 -100,0 200,0
C2: Convenience
MC2a: Land Use Mix 0,6 61,4 0 1 100,0 0,0
MC2b: Residential density 149,3 68,3 40 200 0,6 -25,0
MC2c: Essential Land Use coverage 100,0 100,0 0 100 1,0 0,0
C3: Comfort
MC3: Pedestrian network availability 86,4 72,8 50 100 2,0 -100,0
C4: Convival
MC4: Convivial points coverage 100,0 100,0 0 100 1,0 0,0
C5: Conspicuous
MC5: Building age entropy indicator 0,1 87,0 1 0 -100,0 100,0
C6: Coexistence
MC6: Average number of traffic lanes 1,0 75,3 4 0 -25,0 100,0
C7: Commitment
MC7: Proportion of pedestrian friendly streets
42,7 42,7 0 100 1,0 0,0
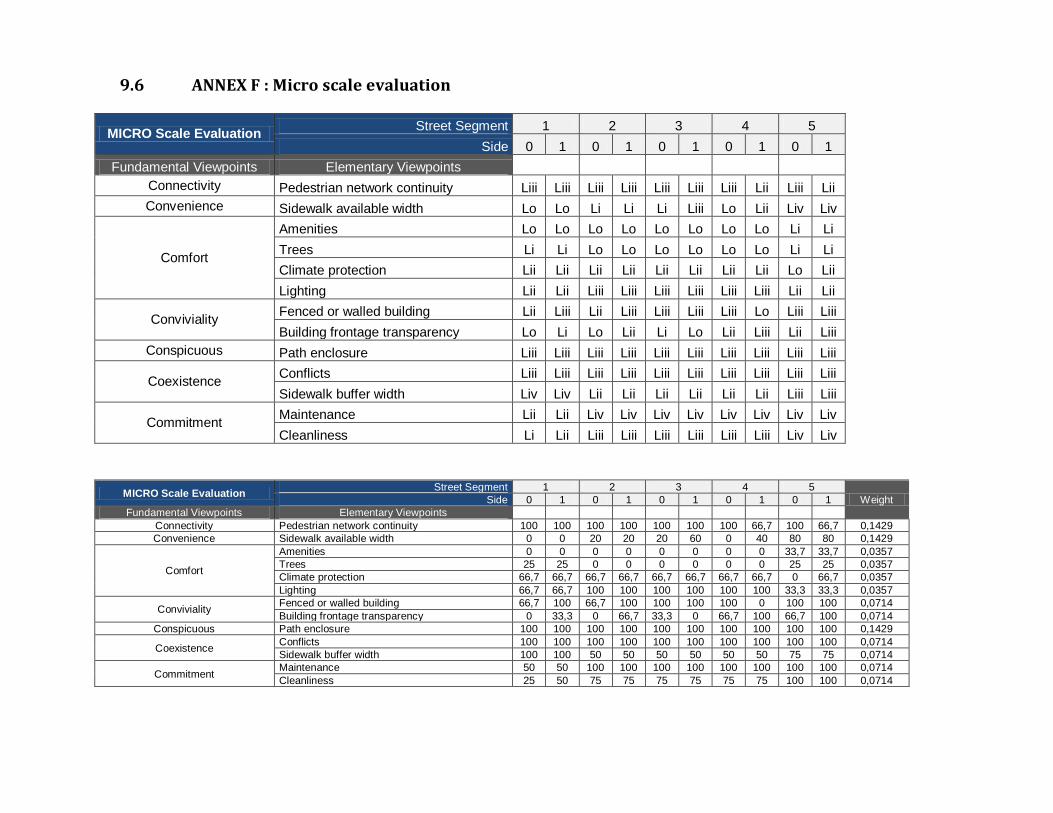
9.6 ANNEX F : Micro scale evaluation
MICRO Scale Evaluation Street Segment 1 2 3 4 5
Side 0 1 0 1 0 1 0 1 0 1
Fundamental Viewpoints Elementary Viewpoints
Connectivity Pedestrian network continuity Liii Liii Liii Liii Liii Liii Liii Lii Liii Lii
Convenience Sidewalk available width Lo Lo Li Li Li Liii Lo Lii Liv Liv
Comfort
Amenities Lo Lo Lo Lo Lo Lo Lo Lo Li Li
Trees Li Li Lo Lo Lo Lo Lo Lo Li Li
Climate protection Lii Lii Lii Lii Lii Lii Lii Lii Lo Lii
Lighting Lii Lii Liii Liii Liii Liii Liii Liii Lii Lii
Conviviality Fenced or walled building Lii Liii Lii Liii Liii Liii Liii Lo Liii Liii
Building frontage transparency Lo Li Lo Lii Li Lo Lii Liii Lii Liii
Conspicuous Path enclosure Liii Liii Liii Liii Liii Liii Liii Liii Liii Liii
Coexistence Conflicts Liii Liii Liii Liii Liii Liii Liii Liii Liii Liii
Sidewalk buffer width Liv Liv Lii Lii Lii Lii Lii Lii Liii Liii
Commitment Maintenance Lii Lii Liv Liv Liv Liv Liv Liv Liv Liv
Cleanliness Li Lii Liii Liii Liii Liii Liii Liii Liv Liv
MICRO Scale Evaluation Street Segment 1 2 3 4 5
Weight Side 0 1 0 1 0 1 0 1 0 1
Fundamental Viewpoints Elementary Viewpoints
Connectivity Pedestrian network continuity 100 100 100 100 100 100 100 66,7 100 66,7 0,1429
Convenience Sidewalk available width 0 0 20 20 20 60 0 40 80 80 0,1429
Comfort
Amenities 0 0 0 0 0 0 0 0 33,7 33,7 0,0357
Trees 25 25 0 0 0 0 0 0 25 25 0,0357
Climate protection 66,7 66,7 66,7 66,7 66,7 66,7 66,7 66,7 0 66,7 0,0357
Lighting 66,7 66,7 100 100 100 100 100 100 33,3 33,3 0,0357
Conviviality Fenced or walled building 66,7 100 66,7 100 100 100 100 0 100 100 0,0714
Building frontage transparency 0 33,3 0 66,7 33,3 0 66,7 100 66,7 100 0,0714
Conspicuous Path enclosure 100 100 100 100 100 100 100 100 100 100 0,1429
Coexistence Conflicts 100 100 100 100 100 100 100 100 100 100 0,0714
Sidewalk buffer width 100 100 50 50 50 50 50 50 75 75 0,0714
Commitment Maintenance 50 50 100 100 100 100 100 100 100 100 0,0714
Cleanliness 25 50 75 75 75 75 75 75 100 100 0,0714
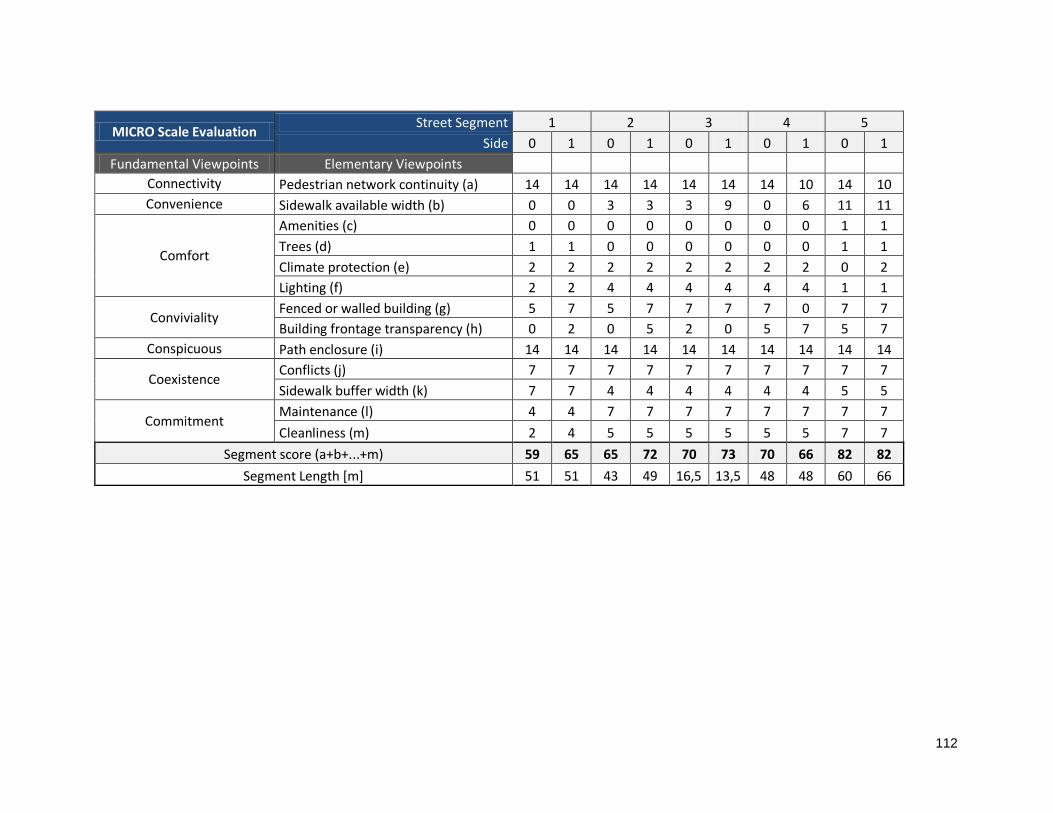
112
MICRO Scale Evaluation Street Segment 1 2 3 4 5
Side 0 1 0 1 0 1 0 1 0 1
Fundamental Viewpoints Elementary Viewpoints
Connectivity Pedestrian network continuity (a) 14 14 14 14 14 14 14 10 14 10
Convenience Sidewalk available width (b) 0 0 3 3 3 9 0 6 11 11
Comfort
Amenities (c) 0 0 0 0 0 0 0 0 1 1
Trees (d) 1 1 0 0 0 0 0 0 1 1
Climate protection (e) 2 2 2 2 2 2 2 2 0 2
Lighting (f) 2 2 4 4 4 4 4 4 1 1
Conviviality Fenced or walled building (g) 5 7 5 7 7 7 7 0 7 7
Building frontage transparency (h) 0 2 0 5 2 0 5 7 5 7
Conspicuous Path enclosure (i) 14 14 14 14 14 14 14 14 14 14
Coexistence Conflicts (j) 7 7 7 7 7 7 7 7 7 7
Sidewalk buffer width (k) 7 7 4 4 4 4 4 4 5 5
Commitment Maintenance (l) 4 4 7 7 7 7 7 7 7 7
Cleanliness (m) 2 4 5 5 5 5 5 5 7 7
Segment score (a+b+...+m) 59 65 65 72 70 73 70 66 82 82
Segment Length [m] 51 51 43 49 16,5 13,5 48 48 60 66