Embed Size (px)
Citation preview
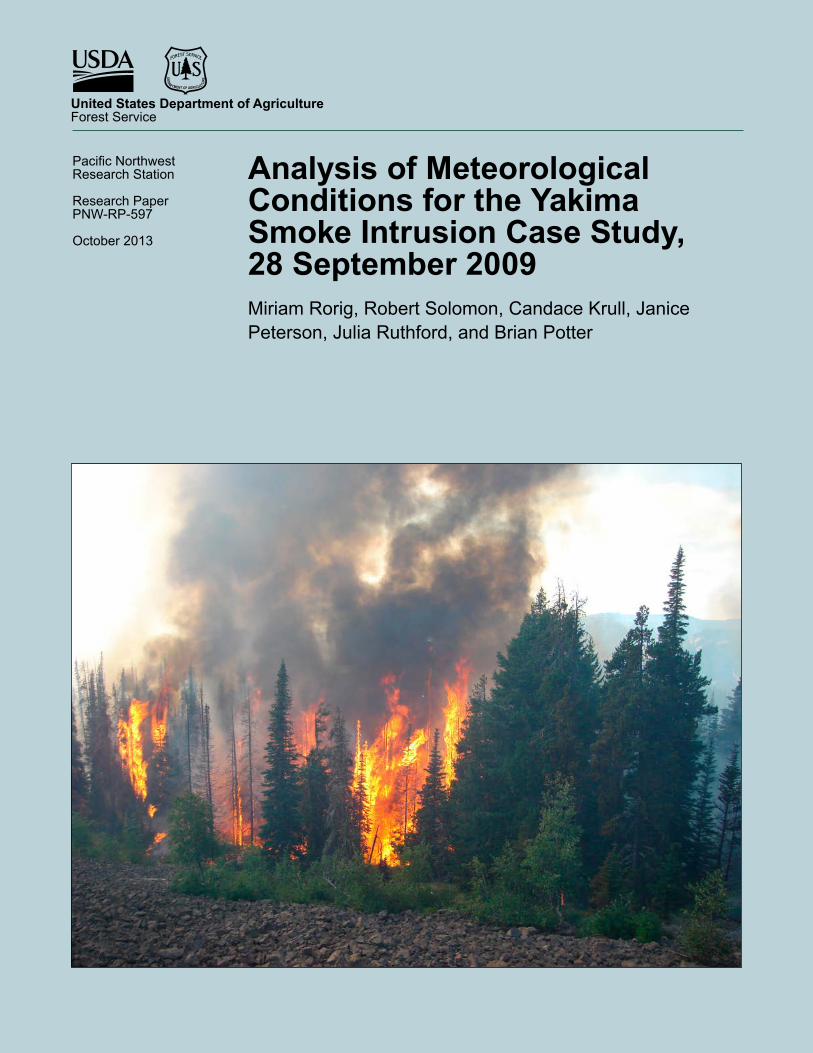
Analysis of Meteorological Conditions for the Yakima Smoke Intrusion Case Study, 28 September 2009Miriam Rorig, Robert Solomon, Candace Krull, Janice Peterson, Julia Ruthford, and Brian Potter
Pacific Northwest Research Station
Research PaperPNW-RP-597
October 2013
United States Department of AgricultureForest Service
DEPAR TMENT OF AGRICULT URE
AuthorsMiriam Rorig, Robert Solomon, and Brian Potter are research meteorologists and Candace Krull is a meteorologist, U.S. Department of Agriculture, Forest Service, Pacific Northwest Research Station, Pacific Wildland Fire Sciences Laboratory, 400 34th Street, Suite 201, Seattle, WA 98103; Janice Peterson is an air quality specialist, U.S. Department of Agriculture, Forest Service, Mount Baker-Snoqualmie National Forest, Everett, WA 98201; Julia Ruthford is a meteorologist, U.S. Department of Commerce, National Oceanic and Atmospheric Administration, National Weather Service, 4241 NE 122nd Ave., Portland, OR 97230.
Cover photograph by James Bailey, Naches Ranger District, USDA Forest Service.
The U.S. Department of Agriculture (USDA) prohibits discrimination against its customers, employees, and applicants for employment on the bases of race, color, national origin, age, disability, sex, gender identity, religion, reprisal, and where applicable, political beliefs, marital status, familial or parental status, sexual orientation, or all or part of an individual’s income is derived from any public assistance program, or protected genetic information in employment or in any program or activity conducted or funded by the Department. (Not all prohibited bases will apply to all programs and/or employment activities.)
If you wish to file an employment complaint, you must contact your agency’s EEO Counselor (PDF) within 45 days of the date of the alleged discriminatory act, event, or in the case of a personnel action. Additional information can be found online at http://www.ascr.usda.gov/complaint_filing_file.html.
If you wish to file a Civil Rights program complaint of discrimination, complete the USDA Program Discrimination Complaint Form (PDF), found online at http://www.ascr.usda.gov/complaint_filing_cust.html, or at any USDA office, or call (866) 632-9992 to request the form. You may also write a letter containing all of the information requested in the form. Send your completed complaint form or letter to us by mail at U.S. Department of Agriculture, Director, Office of Adjudication, 1400 Independence Avenue, S.W., Washington, D.C. 20250-9410, by fax (202) 690-7442 or email at [email protected].
Individuals who are deaf, hard of hearing or have speech disabilities and you wish to file either an EEO or program complaint please contact USDA through the Federal Relay Service at (800) 877-8339 or (800) 845-6136 (in Spanish).
Persons with disabilities who wish to file a program complaint, please see information above on how to contact us by mail directly or by email. If you require alternative means of communication for program information (e.g., Braille, large print, audiotape, etc.) please contact USDA’s TARGET Center at (202) 720-2600 (voice and TDD).
For any other information dealing with Supplemental Nutrition Assistance Program (SNAP) issues, persons should either contact the USDA SNAP Hotline Number at (800) 221-5689, which is also in Spanish or call the State Information/Hotline Numbers.
For any other information not pertaining to civil rights, please refer to the listing of the USDA Agencies and Offices for specific agency information.

AbstractRorig, Miriam; Solomon, Robert; Krull, Candace; Peterson, Janice; Ruth-
ford, Julia; Potter, Brian. 2013. Analysis of meteorological conditions for the Yakima Smoke Intrusion Case Study, 28 September 2009. Res. Pap. PNW-RP-597. Portland, OR: U.S. Department of Agriculture, Forest Service, Pacific Northwest Research Station. 30 p.
On 28 September 2009, the Naches Ranger District on the Okanogan-Wenatchee National Forest in south-central Washington state ignited an 800-ha prescribed fire. Later that afternoon, elevated PM2.5 concentrations and visible smoke were reported in Yakima, Washington, about 40 km east of the burn unit. The U.S. National Weather Service forecast for the day had predicted good dispersion conditions and winds that would carry the smoke to the less populated area north of Yakima. We undertook a case study of this event to determine whether condi-tions leading to the intrusion of the smoke plume into Yakima could have been predicted before the burn was ignited, either from forecasts and model output available on the day of the burn or from higher resolution model output made available only after the event. We evaluated three different meteorological model predictions: (1) 4-km resolution hourly weather predictions from the Weather Research and Forecasting (WRF) model that were available to forecasters on the day of the burn; (2) 4-km resolution WRF predictions at 10-minute intervals; and (3) 1.33-km resolution WRF predictions at 10-minute intervals. We found that predicted winds from the 4- and 1.33-km model resolutions compared well with each other, whereas there were some differences in the predicted planetary boundary layer height over Yakima. We also used the high-resolution 1.33-km WRF output to generate smoke dispersion predictions using the BlueSky Smoke Modeling Framework. Results showed that forecasters and regulators using either the model output available on the day of the burn or the higher-resolution model output generated afterward, would not have anticipated the meteorological condi-tions that resulted in the smoke intrusion that day.
Keywords: Smoke dispersion, smoke modeling, fire weather, decision support.
ii
SummaryPrescribed fire is one of many techniques used by federal, state, and private landowners to manage forest and range lands. Although prescribed burning is an effective method for reducing hazardous fuels and restoring ecosystems, prob-lems arise when smoke affects nearby communities. Such effects occurred when managers on the Naches Ranger District on the Okanogan-Wenatchee National Forest, located on the eastern slopes of the Cascade Mountains in Washington state, ignited a prescribed underburn in late September 2009.
Weather forecasts obtained the day of the burn, including a spot weather forecast specifically requested for the burn location, indicated both surface and transport winds would be from the southwest, and an approaching cold front would ensure mixing heights would be sufficient to allow for good smoke disper-sion. Based on these forecasts, state regulators approved the burn. Ignition com-menced at approximately noon local time and continued for several hours. During active burning and shortly after ignition was completed, smoke was observed to disperse to the northeast, rising to 600 to 1200 m above ground level over mostly unpopulated or sparsely populated areas. At approximately 16:00 local time (4:00 pm), smoke was evident in the city of Yakima, Washington, located about 40-km east of the burn unit. Visibility was significantly reduced, and at the same time, an air quality monitor in downtown Yakima recorded elevated hourly average PM2.5 concentrations for several hours, with the maximum 1-hour reading above 100 µg/m3.
The purpose of this study was to analyze the forecasts and observational data that were available on the day of the burn, and to determine if, in hindsight, there was evidence that would have prompted the burners or regulators to cancel the burn that day or stop ignition earlier. We analyzed the meteorological model output that was available to the decisionmakers in real time, and also obtained higher resolution (both spatial and temporal) model output that became available only after the fact. We also used the higher resolution meteorological model output as input to smoke dispersion models. There was no indication, either in the low- or high-resolution model output, that smoke from this prescribed burn would affect Yakima. More observations (both meteorological and air quality) are needed to understand the meteorological conditions that could cause a smoke intrusion into Yakima, so that burning under similar conditions can be avoided in the future.

iii
Contents 1 Introduction 3 Methods 3 Meteorological and Air Quality Observations 7 Meteorological Model Predictions 8 Results 8 Surface and Upper Air Observations 10 WRF Model Predictions 14 BlueSky Smoke Concentrations and Trajectories 25 Discussion 27 Conclusions 28 Acknowledgments 28 English Equivalents 29 Literature Cited


1
Analysis of Meteorological Conditions for the Yakima Smoke Intrusion Case Study, 28 September 2009
IntroductionPrescribed burning is an important tool used by land managers to mitigate potential future impacts from destructive wildfires, and to restore the natural role of fire in ecosystems. There are several potential barriers to obtaining approval for pre-scribed burning, including negative perceptions of fire and smoke by the general public, air quality regulations, and risk of smoke intrusions (Haines et al. 2001). When smoke from a prescribed burn affects local communities, it can become even more difficult to obtain approval for future burning. In this study, we undertook a detailed case study of a prescribed underburn to determine whether we could, from model output or observations, identify the meteorological conditions that resulted in a smoke intrusion in a nearby community.
Located on the eastern slopes of the Cascade Range in south-central Wash-ington state, the Naches Ranger District marks the southernmost extent of land managed by the Okanogan-Wenatchee National Forest. The Naches Ranger District is bordered on the north and west primarily by public forest lands, and to the south by the Yakama Indian Reservation. To the east is the greater Yakima Valley area, a region characterized by fertile agricultural lands and containing the city of Yakima, which had a 2010 population of 91,067 and a metropolitan population of 243,231. The forest lands of the Naches Ranger District are highly fire-dependent, and the Okanogan-Wenatchee Forest, through its Forest Restoration Strategy, uses prescribed fires as a tool to help reduce the threat of uncharacteristically severe wildfires and to increase the resiliency of unhealthy forest ecosystems.
On 28 September 2009, the Naches Ranger District received approval from the Washington Department of Natural Resources (DNR) to ignite an 800-ha pre-scribed underburn on Bethel Ridge (the “Kaboom” Unit), located about 40 km west of Yakima, Washington. The spot weather forecast for the day, obtained from the National Weather Service (NWS), predicted winds from the southwest, with surface windspeeds of 1 to 2 m/s, increasing to 3 to 4 m/s, gusting to 6 m/s, and transport windspeeds of 4 to 6 m/s. Mixing heights were predicted to be 1400 m during the day, lowering to 450 m overnight. These predictions indicated a good day for dispersion with little chance that smoke would affect the public.
Ignition of the underburn began at approximately 12:30 Pacific Daylight Time (PDT ) through a combination of hand and helicopter methods. Initially, the smoke plume was observed to travel to the north-northeast (NNE), rising to 600 to 1200 m above ground level (AGL), consistent with forecasts. Then, at approximately 16:30, the plume was observed at ground level, and smoke impacts were reported through-out upper Yakima County. The air quality monitor in downtown Yakima recorded

2
RESEARCH PAPER PNW-RP-597
elevated hourly average PM2.5 concentrations (particulate matter < 2.5 µm) for about 7 hours, from approximately 16:00 to 23:00, with a maximum 1-hour average just above 110 µg/m3 reported at 18:00 PDT. The meteorological conditions that resulted in the smoke intrusion in Yakima had not been predicted by the standard NWS zone forecast, or by the spot weather forecast obtained the morning of the burn.
The objective of this case study was to determine whether, with the benefit of hindsight, the conditions leading to the drainage of smoke into the Yakima area could have been predicted from the Weather Research and Forecasting (WRF) meteorological model predictions available to forecasters on the day of the burn, and if not, whether higher resolution model output (not available on the day of the burn), using the same configuration and parameterizations as the real-time low-resolution simulation, could have predicted the conditions that led to the smoke intrusion. In addition, we compared observed surface meteorological data with the model output to determine the quality of both the forecast that was provided in real time, and the higher-resolution model predictions. The purpose of this study was not to determine why the mesoscale models did not accurately capture bound-ary layer effects or how those models could be improved. Rather, our goal was to determine what meteorological conditions led to the smoke intrusion, and if there was anything in the operational models run at the time, or afterward (using a higher resolution model output that was not available at the time), that could have been useful in the decisionmaking process by indicating the possibility of a smoke intru-sion event, so as to prevent future similar events.
In addition to evaluating the outputs from the meteorological models, we used the high-resolution WRF output to simulate smoke dispersion from the burn using the BlueSky Smoke Modeling Framework (BlueSky) (Larkin et al. 2009). BlueSky was originally developed as a tool to facilitate prescribed burn activities by provid-ing simulated smoke dispersion impacts for land managers and regulators; however, BlueSky is now used nationwide as a smoke prediction tool for both wildfire and prescribed fire. BlueSky is not a single model; rather it is a framework that allows several different models (meteorological, fuel consumption, emission, plume rise, and dispersion) to run seamlessly, in series, to produce predicted surface concentra-tions of PM2.5 and trajectories aloft. BlueSky is currently run in real time regionally and nationally with estimated fire sizes and fuel loadings; however, for this case study, we were able to run BlueSky with the actual number of acres (hectares) burned and measured fuel loadings.
On the evening of September 28, 2009, elevated levels of PM2.5 were recorded at the particulate monitor in downtown Yakima.

3
Analysis of Meteorological Conditions for the Yakima Smoke Intrusion Case Study, 28 September 2009
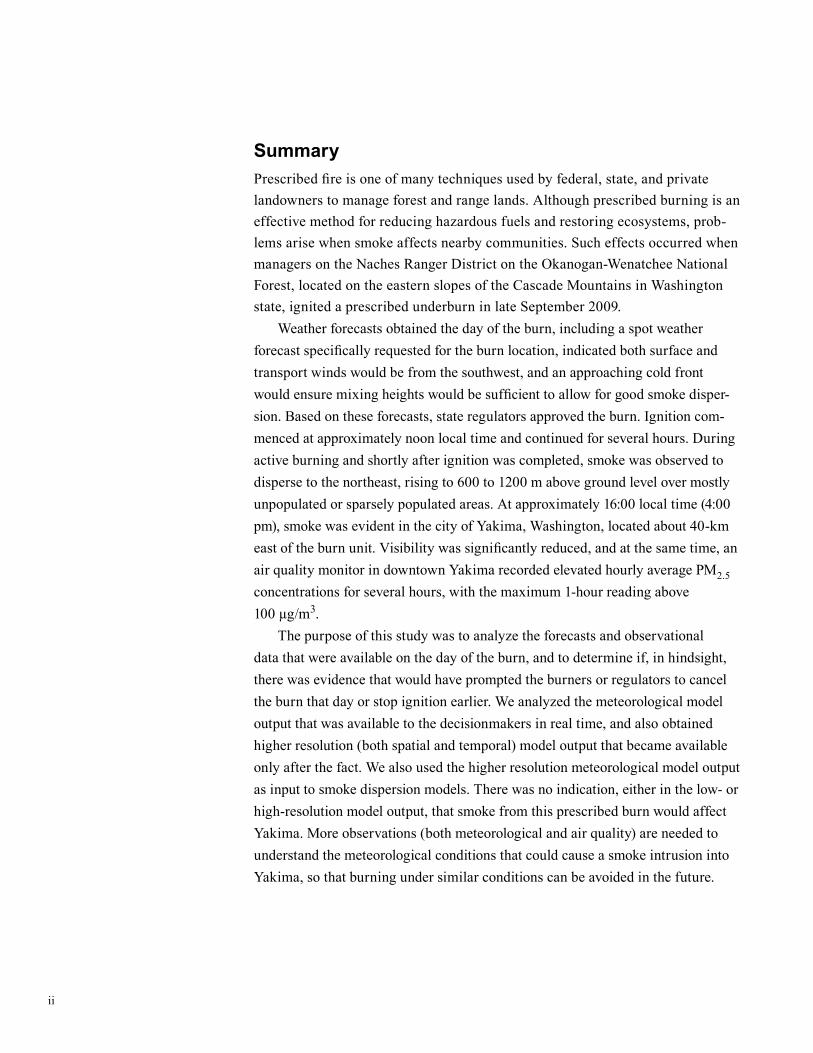
MethodsMeteorological and Air Quality ObservationsMeteorological observations were compiled from four nearby surface weather stations: two Northwest Weather and Avalanche Center (NWAC) weather stations at Chinook Pass and White Pass, one Remote Automated Weather Station (RAWS) site at Sawmill Flats, and the National Weather Service station at Yakima Air Terminal, located in Yakima (table 1 and figs. 1 and 2). We used the surface obser-vations (locations shown in figs. 3 and 4) to assess the accuracy of the real-time weather forecasts provided by the NWS, and to compare with model output (model domain boundaries are shown in fig. 2). The NWS forecast for the area called for a cold front to move across the Cascades late in the afternoon of the 28th with breezy winds shifting to the southwest and west, and little chance for precipitation (Grant1). The spot weather forecast for Bethel Ridge, obtained by the Forest Service the morning of the 28th, called for southwest surface (6-m above ground) winds of 1 to 2 m/s increasing to 3 to 4 m/s with gusts to 6 m/s. Winds aloft were also predicted to be from the southwest at 4 to 6 m/s, with a mixing height of 1370 m (Bailey2). No available local upper air data were available; therefore, we used sounding data from the nearest and most representative upper air station in Spokane, Washington, approximately 250 km northeast of Yakima.
Table 1—Locations of the burn unit on Bethel Ridge, Cascade Range, United States, nearby surface weather stations used in this study, and the air quality monitoring site in Yakima, Washington state, United States
Site Latitude Longitude Elevation
MetersBethel Ridge Underburn 46.687° N 121.086° W 1065Chinook Pass (NWAC) 46.882° N 121.518° W 1900Sawmill Flats (RAWS) 46.967° N 121.084° W 915White Pass (NWAC) 46.624° N 121.388° W 1830Yakima Air Terminal (NWS) 46.567° N 120.533° W 325Yakima Air Quality Monitor 46.595° N 120.512° W 100NWAC = Northwest Weather and Avalanche Center.RAWS = Remote Automated Weather Station.NWS = National Weather Service.
1 Grant, Dave. Personal communication. Smoke and fuels management specialist, Washington Department of Natural Resources, P.O. Box 47037, Olympia, Washington 98504-7037.2 Bailey, Jim. 2009. Documentation for Kaboom underburn. On file with: USDA Forest Service Naches Ranger District, 10237 Highway 12, Naches, Washington 98937.
4
RESEARCH PAPER PNW-RP-597
Figure 1—Location of the burn unit (Bethel Ridge), surface meteorological observation stations (Chinook Pass Northwest Weather and Avalanche Center [NWAC], White Pass NWAC, Sawmill Flats Remote Automated Weather Station, and Yakima Air Terminal), and surface PM2.5 monitors (Naches, Yakima).
5
Analysis of Meteorological Conditions for the Yakima Smoke Intrusion Case Study, 28 September 2009
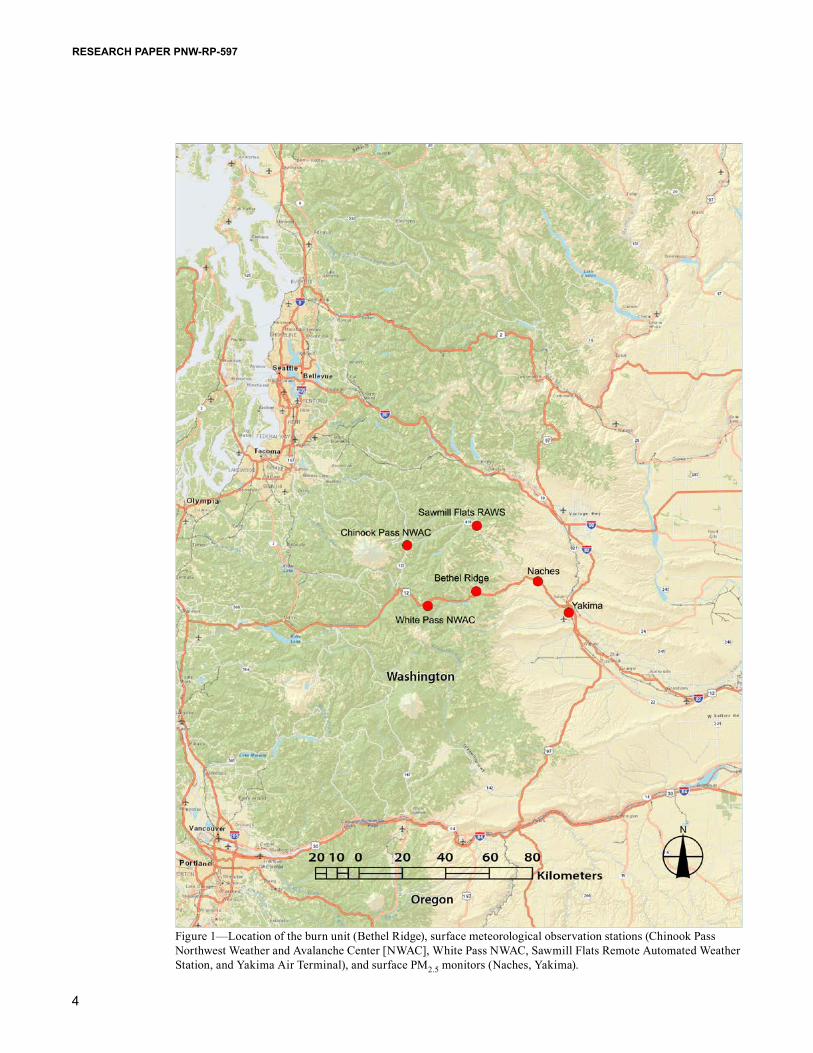
Figure 2—Map of the Pacific Northwest showing the extent of the 4-km (outer box) and the 1.33-km (inner box) Northwest Regional Modeling Consortium Weather Research and Forecasting model domains.
6
RESEARCH PAPER PNW-RP-597
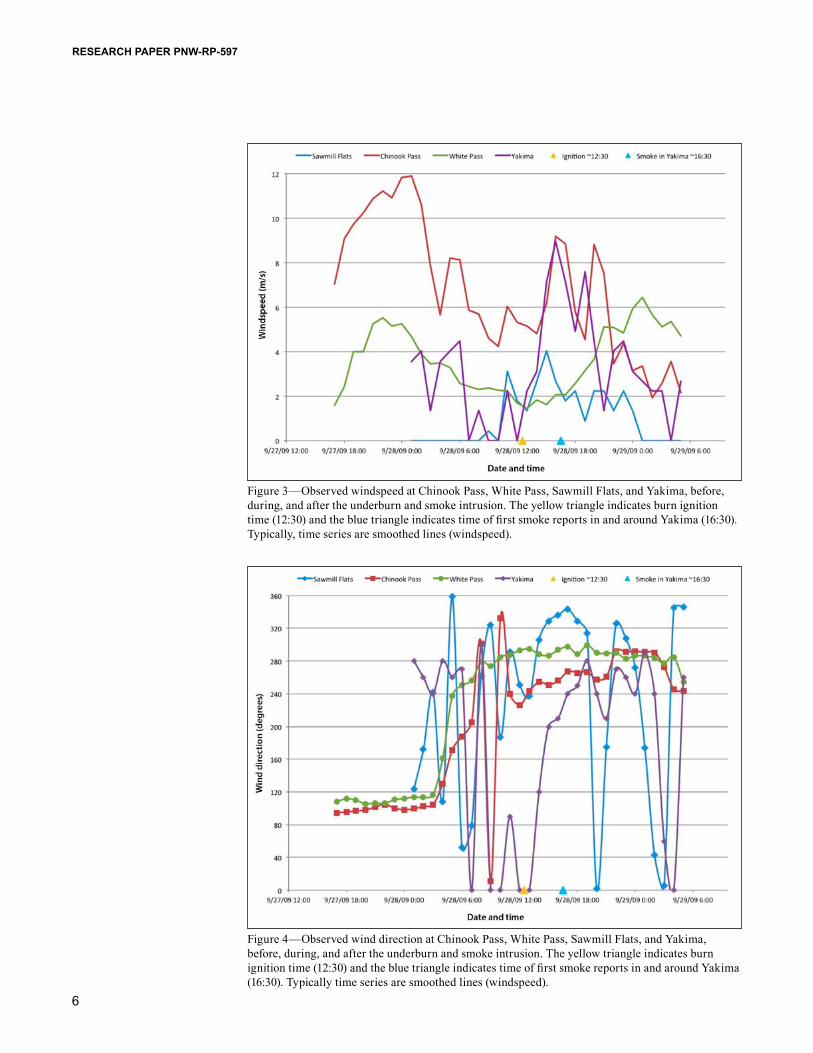
Figure 4—Observed wind direction at Chinook Pass, White Pass, Sawmill Flats, and Yakima, before, during, and after the underburn and smoke intrusion. The yellow triangle indicates burn ignition time (12:30) and the blue triangle indicates time of first smoke reports in and around Yakima (16:30). Typically time series are smoothed lines (windspeed).
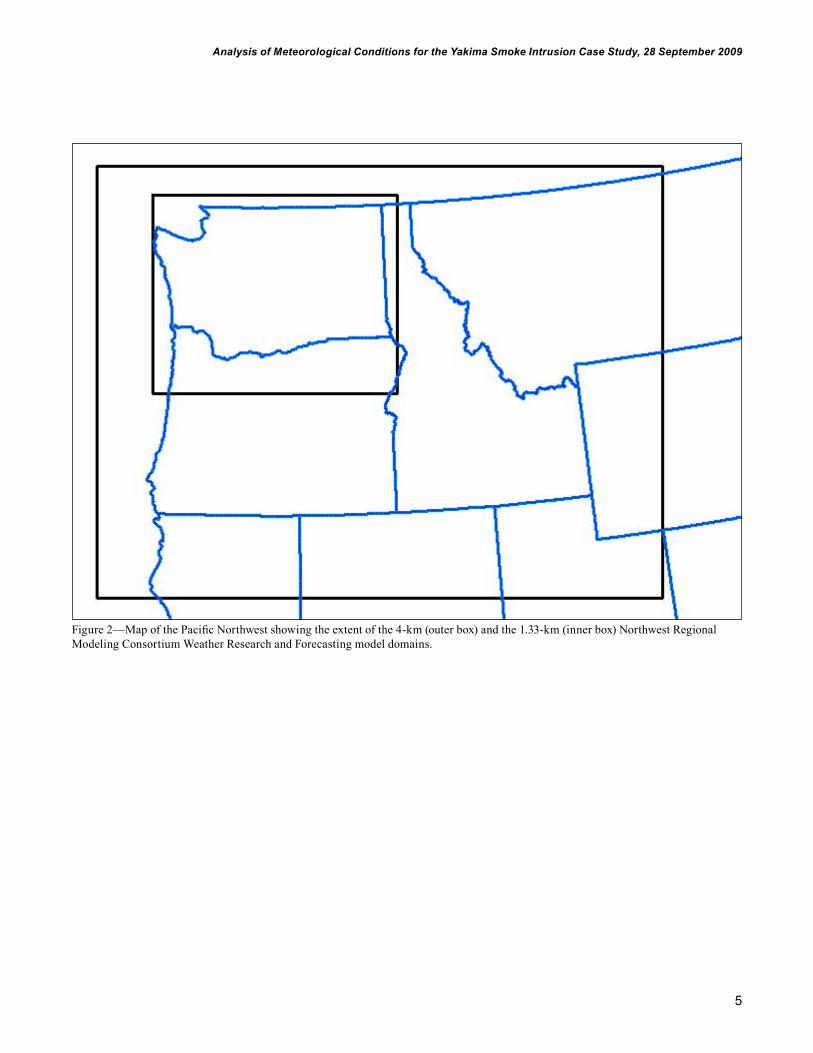
Figure 3—Observed windspeed at Chinook Pass, White Pass, Sawmill Flats, and Yakima, before, during, and after the underburn and smoke intrusion. The yellow triangle indicates burn ignition time (12:30) and the blue triangle indicates time of first smoke reports in and around Yakima (16:30). Typically, time series are smoothed lines (windspeed).
7
Analysis of Meteorological Conditions for the Yakima Smoke Intrusion Case Study, 28 September 2009
Meteorological Model PredictionsThe Northwest Regional Modeling Consortium (NRMC) based at the University of Washington, Seattle, provided model runs for this study from the Advanced Research WRF (WRF-ARW) core of the WRF model (Klemp et al. 2007, Michal-akes et al. 2001, 2005; Skamarock et al. 2005; Wicker and Skamarock 2002), initial-ized at 00Z on 28 September 2009 (17:00 PDT on 27 September 2009) at a 4-km spatial resolution and hourly temporal resolution. (Although this model prediction was nearly 24 hours old by the time of smoke intrusion, the smoke dispersion prediction from this 00Z model run would have been the latest available at the time of the go/no-go decision.) The 4-km domain encompasses all of Washington and Oregon, and parts of the surrounding states. For this analysis, we used the
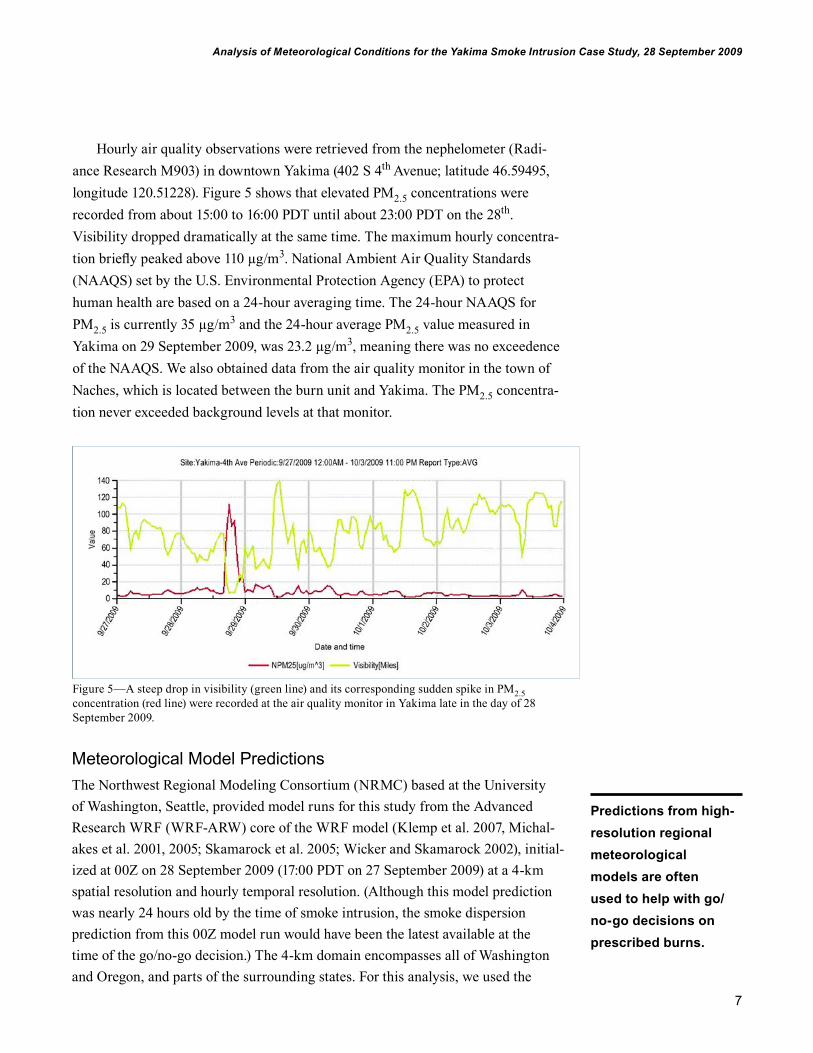
Figure 5—A steep drop in visibility (green line) and its corresponding sudden spike in PM2.5 concentration (red line) were recorded at the air quality monitor in Yakima late in the day of 28 September 2009.
Hourly air quality observations were retrieved from the nephelometer (Radi-ance Research M903) in downtown Yakima (402 S 4th Avenue; latitude 46.59495, longitude 120.51228). Figure 5 shows that elevated PM2.5 concentrations were recorded from about 15:00 to 16:00 PDT until about 23:00 PDT on the 28th. Visibility dropped dramatically at the same time. The maximum hourly concentra-tion briefly peaked above 110 µg/m3. National Ambient Air Quality Standards (NAAQS) set by the U.S. Environmental Protection Agency (EPA) to protect human health are based on a 24-hour averaging time. The 24-hour NAAQS for PM2.5 is currently 35 µg/m3 and the 24-hour average PM2.5 value measured in Yakima on 29 September 2009, was 23.2 µg/m3, meaning there was no exceedence of the NAAQS. We also obtained data from the air quality monitor in the town of Naches, which is located between the burn unit and Yakima. The PM2.5 concentra-tion never exceeded background levels at that monitor.
Predictions from high-resolution regional meteorological models are often used to help with go/no-go decisions on prescribed burns.
8
RESEARCH PAPER PNW-RP-597
WRF mesoscale model because the meteorological conditions that resulted in the smoke intrusion were on a spatial and temporal scale finer than would be resolved by global models such as the Global Forecast System, which provided initial and boundary conditions for the WRF model runs. The NRMC WRF model also has the advantage of being optimized for the Northwestern United States. These fore-cast products were available to the public, including weather forecasters and regula-tors on the morning of the burn. The NRMC also provided us with two WRF model runs not available on the day of the prescribed burn—one at 4-km spatial resolution with output every 10 minutes (which is the same as the 4-km hourly output with additional output every 10 minutes between the hour), and one at 1.33-km spatial resolution with output every 10 minutes. The 1.33-km domain is nested within and initialized by the 4-km domain. We extracted the winds and planetary boundary layer (PBL) heights for the model grid cells corresponding to the locations of the underburn, and downtown Yakima, where the air quality monitor that recorded the elevated PM2.5 readings is located. All model runs were initiated at 17:00 PDT on 27 September 2009, with the simulation period lasting 36 hours (1.33-km domain) to 72 hours (4-km domain).
ResultsSurface and Upper Air ObservationsThe time series of windspeed and direction from the surface observation stations are shown in figures 6 and 7. The surface wind direction at the three mountain stations (Sawmill Flats, Chinook Pass, and White Pass) was generally from the east-southeast (ESE) to southeast (SE) (from about 100 to 140 degrees) in the early morning hours of September 28. Between about 03:00 and 06:00 the wind direction shifted to the northwest (NW) (280 to 320 degrees), which is indicative of a frontal passage. The NW winds persisted for the remainder of the day. Figures 3 and 4 also show windspeed and direction at Yakima Air Terminal (located on the south side of Yakima, approximately 3 to 4 km from the air quality monitor downtown). At this location, early morning winds were less than 5 m/s from the west (270 degrees), then from about 07:00 PDT to 12:00 generally light and variable (less than or equal to 2 m/s and from the north [N] to northeast [NE]). After about 13:00, the winds veered to the west-southwest (WSW) (between 200 and 240 degrees) and speeds increased to 8 to 10 m/s with higher gusts (not shown in the figure). Windspeed decreased to 5 m/s or less after 20:00. The changes in windspeed and direction suggest a frontal passage at approximately 13:00, which is later than indicated at the mountain stations. There are two possible explanations. First, the mountain stations are west of Yakima, so it is reasonable to assume that a front approaching from the west would be evident there earlier than at Yakima. Second, because the remote
9
Analysis of Meteorological Conditions for the Yakima Smoke Intrusion Case Study, 28 September 2009
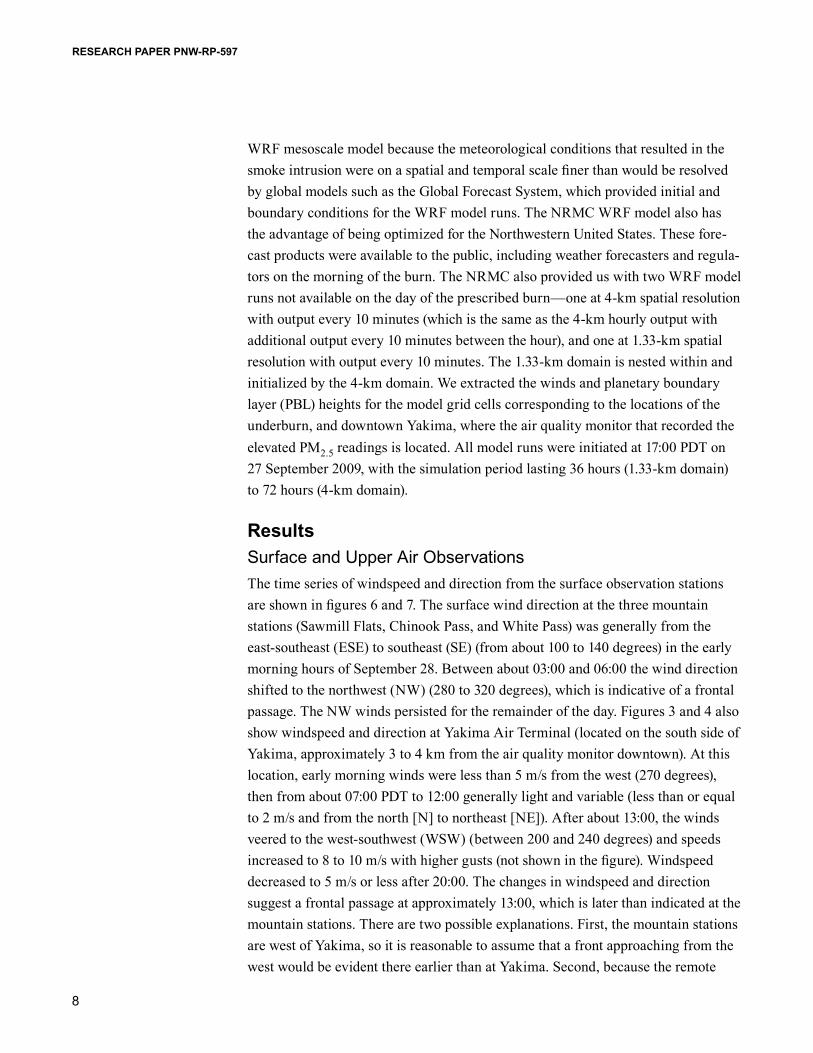
Figure 6—Weather Research Forecasting modeled windspeed at the Bethel Ridge burn location 40 km west of Yakima for the 10-minute interval 4- and 1.33-km domains. “I” indicates burn ignition time (12:30); “S” indicates time of first smoke reports in and around Yakima (16:30).
Figure 7—Weather Research Forecasting modeled wind direction at the Bethel Ridge burn location 40 km west of Yakima for the 10-minute interval 4- and 1.33-km domains. “I” indicates burn ignition time (12:30); “S” indicates time of first smoke reports in and around Yakima (16:30).

10
RESEARCH PAPER PNW-RP-597
sites are located in complex terrain, the winds are likely affected to some degree by the surrounding terrain (e.g., upslope/downslope flows, channeling of winds, etc.). The weather observation station at the Yakima Air Terminal is on relatively unob-structed flat terrain, and therefore more likely to reflect regional (synoptic) rather than local conditions.
WRF Model PredictionsPredicted windspeeds (10 m AGL) were similar (but not identical) in the 10-minute output from both the 4- and 1.33-km WRF model runs at the location of the under-burn (figs. 6 and 7). Modeled windspeeds were approximately 2 to 4 m/s until 06:00 on the 28th, when they decreased briefly to less than 1 m/s. Between 07:00 to 11:00, speed increased to greater than 6 m/s, with the increase occurring about 2 hours earlier in the 4-km model simulation. It is not clear why there is a difference in timing of the increased windspeed between the 1.33- and 4-km model simulations. After about 13:00, windspeed remained at about 6 m/s in the 4-km simulation, but decreased to between 2 and 4 m/s in the 1.33-km simulation. The modeled wind-speeds were 2 to 5 m/s higher than the spot weather forecast in the 4-km simula-tion, but closer to forecast in the 1.33-km simulation. This may be due to the finer resolution domain better capturing the rough terrain and its effect on surface winds. Wind direction was also similar between the two model resolutions at the under-burn location (figs. 6 and 7). Both simulations predicted wind direction from the northeast (NE) (50 to 100 degrees) until about 05:00, followed by a gradual clock-wise wind shift over 3 to 5 hours to the WSW (about 250 degrees). This predicted wind shift occurred about 2 hours later than what was observed in the mountain weather stations; however, both simulations agreed reasonably well with the general NWS forecast of southwest (SW) to west (W) surface winds.
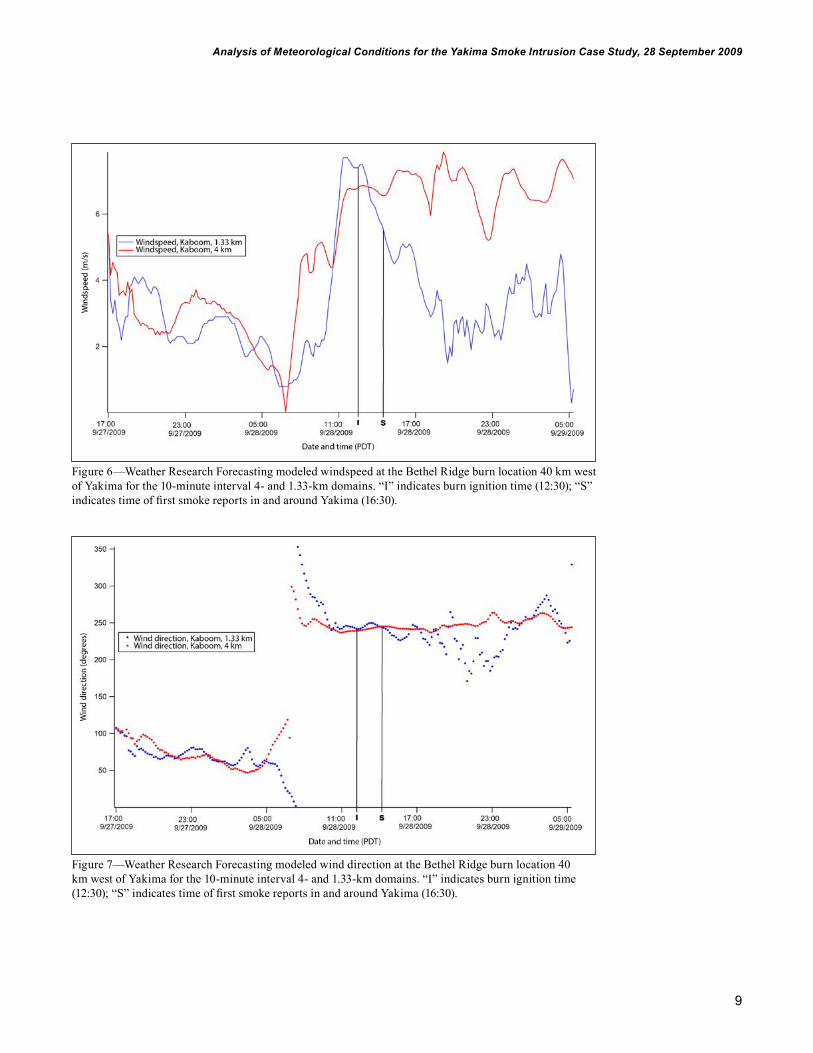
At Yakima, (figs. 8 and 9), both simulations predicted windspeeds between about 1 and 4 m/s overnight prior to the burn, although the time series did not vary together (fig. 8). Shortly before 05:00, speed decreased below 1 m/s in the 1.33-km domain, with the decrease coming about 2 hours later in the 4-km domain. Both then predicted windspeeds increasing between 10:00 and 13:00 to greater than 4 m/s, with the 1.33-km simulation predicting a higher peak speed at 8 m/s compared to a peak of about 5 m/s from the 4-km domain. The 1.33-km simulation agreed well with observations, which also indicated windspeeds of about 8 m/s. Although the agreement is encouraging, the relatively high windspeeds in Yakima at the time of the smoke intrusion confound the scenario of drainage flows carrying smoke into Yakima. After 17:00, the 1.33-km speed varied between less than 1 m/s and 4 m/s, while the 4-km speed was somewhat higher, varying between 3 and 5 m/s until midnight, when speeds decreased to less than 2 m/s.
The weather forecast for a cold front passage was verified by the observations.
11
Analysis of Meteorological Conditions for the Yakima Smoke Intrusion Case Study, 28 September 2009
Figure 8—Weather Research Forecasting modeled windspeed for Yakima, for the 10-minute interval 4- and 1.33-km domains. “I” indicates burn ignition time (12:30); “S” indicates time of first smoke reports in and around Yakima (16:30).
Figure 9—Weather Research Forecasting modeled wind direction for Yakima, for the 10-minute interval 4- and 1.33-km domains. “I” indicates burn ignition time (12:30); “S” indicates time of first smoke reports in and around Yakima (16:30).
12
RESEARCH PAPER PNW-RP-597
The 1.33-km simulation wind direction at Yakima (fig. 9) was from the north-northwest (NNW) (300 to 350 degrees) until about 05:00 PDT on the 28th, gradually shifting to south-southeast (SSE) (150 to 180 degrees) until after noon, then veering to the south-southwest (SSW) (200 to 230 degrees) until about midnight when it became variable, consistent with light windspeed. The 4-km modeled wind direc-tion was from the east-northeast (ENE) until about 7:00 PDT, when it shifted to northerly for 2 to 3 hours before switching to SW for the remainder of the day (in rough agreement with the observed winds at Yakima Air Terminal, figs. 3 and 4). Despite the differences in details between the two model simulations, the broad patterns were the same, with a morning wind shift from the N or NE to WSW, and an increase in afternoon windspeeds.
The time series of PBL height for both model resolutions at the underburn loca-tion and Yakima are shown in figures 10 and 11. The PBL is the layer of the atmo-sphere that is closest to the ground, and is directly influenced by surface friction and surface heating. It is not the mixed layer, nor is the PBL height the same as the mixing height, but the two are related, in that the PBL height is less than the mixing height, and the higher the PBL, the higher the mixing height. Therefore, one would expect better ventilation with a higher PBL height. The Yonsei University PBL scheme (Hong et al. 2006) was used for both the 1.33- and 4-km simulations. The model-generated PBL height at the underburn location for both resolutions was near 500 m at the start of the simulation (17:00 on the 27th), then gradually decreased to less than 100 m in the early morning hours of the 28th. After about 10:00, both markedly increased (fig. 10). The PBL heights were similar until about 17:00, when the 4-km simulation PBL height increased while the 1.33-km simulation height decreased significantly.
The predicted PBL heights at Yakima from the 4- and 1.33-km model simula-tions also showed some differences (fig. 11) between the two model resolutions. Heights from both resolutions remained below 500 m from the start of the simula-tion until about 11:00, when both increased. The 4-km PBL height increased to 1800 to 2000 m, before decreasing below 500 m after 18:00 to 19:00. The 1.33-km PBL height increased only to about 1000 m, and started decreasing earlier than in the 4-km simulation. The decrease in the 1.33-km run occurred about the same time (just before) smoke was first detected in the Yakima Valley. It stayed below 500 m for the rest of the night, except for a few short-lived spikes (which may reflect issues with the model rather than real-world fluctuations). The Spokane upper air soundings from 05:00 and 17:00 on the 29th (not shown) did not show any indica-tion of a surface-based inversion or an inversion layer aloft. Without having nearby upper air data, it is not possible to know which simulation of PBL height was closer

13
Analysis of Meteorological Conditions for the Yakima Smoke Intrusion Case Study, 28 September 2009
Figure 10—Weather Research Forecasting modeled planetary boundary layer (PBL) height at the Bethel Ridge burn site 40 km west of Yakima, at 10-minute intervals for 4- and 1.33-km spatial resolution. “I” indicates burn ignition time (12:30); “S” indicates time of first smoke reports in and around Yakima (16:30).
Figure 11—Weather Research Forecasting modeled planetary boundary layer height at Yakima, at 10-min-ute intervals for the 4- and 1.33-km resolution. “I” indicates burn ignition time (12:30); “S” indicates time of first smoke reports in and around Yakima (16:30).

14
RESEARCH PAPER PNW-RP-597
Table 2—Fuel loadings used in the BlueSky simulation of the Bethel Ridge underburn
1-hour 0.53 tons/acre10-hour 0.78 tons/acre100-hour 1.75 tons/acre1000-hour 2.33 tons/acre10000-hour 2.54 tons/acre10000-hour+ 0 tons/acreLitter 0.3 tons/acreGrass/herb 0.2 tons/acreShrub 1.0 tons/acreDuff depth 1.2 inches
Table 3—The BlueSky Smoke Modeling Framework configuration used for modeling smoke production and transport from the underburn
BlueSky Framework Version 3.1.4Meteorological model WRF 3.1.1 (1.33 km, 10-minute intervals)Fuel loadings Measured (see table 2)Consumption model CONSUME version3Emissions model FEPS version 2Dispersion model HYSPLIT version 4.8 (March 2007)
to “reality.” Mesoscale models such as WRF have known biases in temperature, winds, and humidity in the PBL, and a finer resolution does not necessarily indicate that the biases will be less than in coarser resolution simulations (Hoadley et al. 2004, Mass et al. 2002). Whether the height of the boundary layer did actually start decreasing in the mid-afternoon hours as seen in the 1.33-km simulation, it was not predicted by the 4-km model output that was available on the day of the burn.
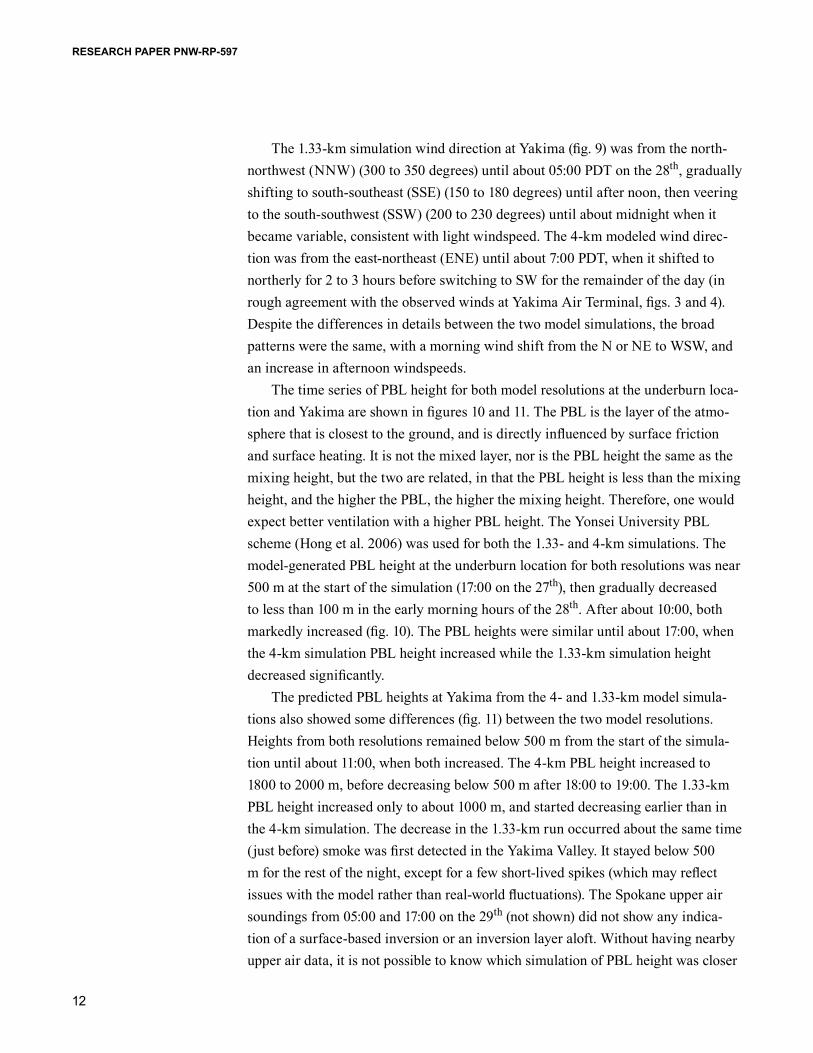
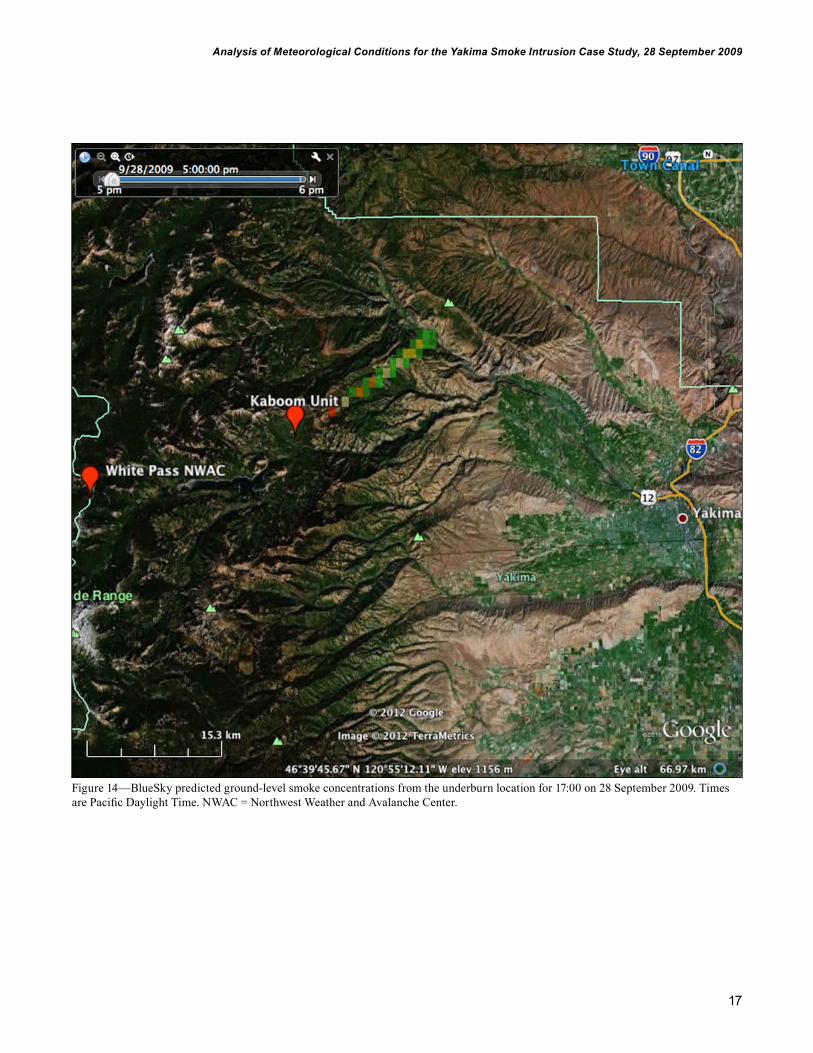
BlueSky Smoke Concentrations and TrajectoriesTo obtain predictions of smoke concentrations from the underburn, we ran the BlueSky Framework using the 1.33-km WRF model output at 10-minute intervals. The fuel loadings used in the simulation (table 2) were obtained from the burn plan prepared by the Naches Ranger District. The models used at each step of the Frame-work are listed in table 3. We used 730 ha as the size of the burn (which was the reported estimate of blackened acres [hectares] after the burn), with ignition starting at 12:40 and ending at 15:40. Forty hectares were ignited every 10 minutes for a total ignition time of 3 hours. Figures 12 through 17 show predicted surface PM2.5 concentration every 2 hours from 13:00 to 23:00 on the 28th. This simulation shows all of the surface-based PM2.5 dispersing to the northeast of the burn unit, with no measureable PM2.5 reaching Yakima (note the yellowish rectangle in the figures over Yakima is an artifact of Google Earth and not PM2.5 from the BlueSky output).
The BlueSky Smoke Modeling Framework simulates smoke dispersion from prescribed burns and wildfires. Results are improved when more accurate data (fuels and fire information) are input to the models.

15
Analysis of Meteorological Conditions for the Yakima Smoke Intrusion Case Study, 28 September 2009
Figure 12—BlueSky predicted ground-level smoke concentrations from the underburn location for 13:00 on 28 September 2009. Times are Pacific Daylight Time. NWAC = Northwest Weather and Avalanche Center.

16
RESEARCH PAPER PNW-RP-597
Figure 13—BlueSky predicted ground-level smoke concentrations from the underburn location for 15:00 on 28 September 2009. Times are Pacific Daylight Time. NWAC = Northwest Weather and Avalanche Center.
17
Analysis of Meteorological Conditions for the Yakima Smoke Intrusion Case Study, 28 September 2009
Figure 14—BlueSky predicted ground-level smoke concentrations from the underburn location for 17:00 on 28 September 2009. Times are Pacific Daylight Time. NWAC = Northwest Weather and Avalanche Center.

18
RESEARCH PAPER PNW-RP-597
Figure 15—BlueSky predicted ground-level smoke concentrations from the underburn location for 19:00 on 28 September 2009. Times are Pacific Daylight Time. NWAC = Northwest Weather and Avalanche Center.
19
Analysis of Meteorological Conditions for the Yakima Smoke Intrusion Case Study, 28 September 2009
Figure 16—BlueSky predicted ground-level smoke concentrations from the underburn location for 21:00 on 28 September 2009. Times are Pacific Daylight Time. NWAC = Northwest Weather and Avalanche Center.

20
RESEARCH PAPER PNW-RP-597
Figure 17—BlueSky predicted ground-level smoke concentrations from the underburn location for 23:00 on 28 September 2009. Times are Pacific Daylight Time. NWAC = Northwest Weather and Avalanche Center.

21
Analysis of Meteorological Conditions for the Yakima Smoke Intrusion Case Study, 28 September 2009
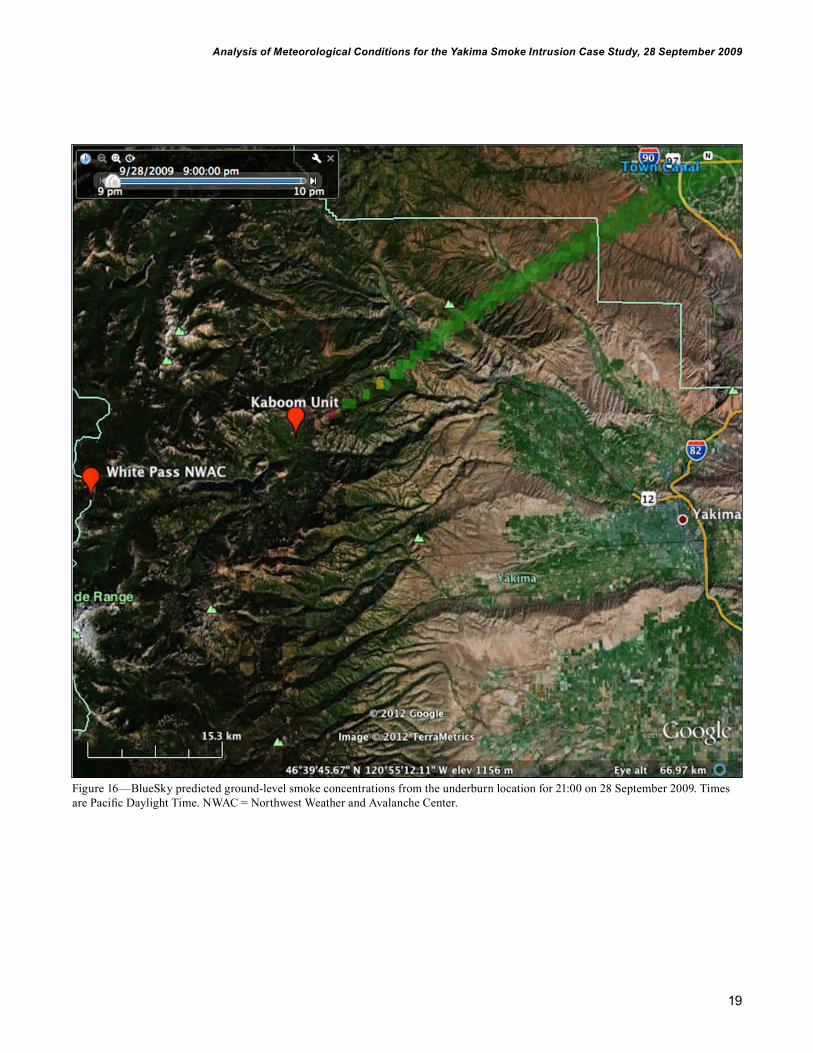
We then ran forward trajectories (using the 1.33-km WRF output and Hysplit [Draxler and Hess 1997]) originating from the underburn (figs. 18 and 19). Regard-less of the beginning hour for the trajectories, all indicated that smoke from the fire would be carried to the ENE, and not affect Yakima. Figure 18 shows forward trajectories starting at 13:00 and 15:00 from an elevation of 1000 m (we used 1000 m because the smoke plume was observed by Forest Service personnel at between about 600 m and 1200 m AGL [2,000 to 4,000 feet]). Both cases are very similar (indicating no significant change in predicted transport winds during that time period) and show the smoke plume dipping below 1000 m before rising again to above 1000 m AGL.
By 16:00 (fig. 19) the trajectory released from 1000 m immediately lowered to between 500 m and 1000 m AGL, then got closer to the ground than 500 m (with a minimum height of about 300 m AGL), before increasing again to above 500 m. This decrease in trajectory heights AGL could reflect the smoke plume being trans-ported over higher terrain rather than the plume descending closer to the ground. Nevertheless, the plume was not predicted to reach ground level, or be transported over Yakima.
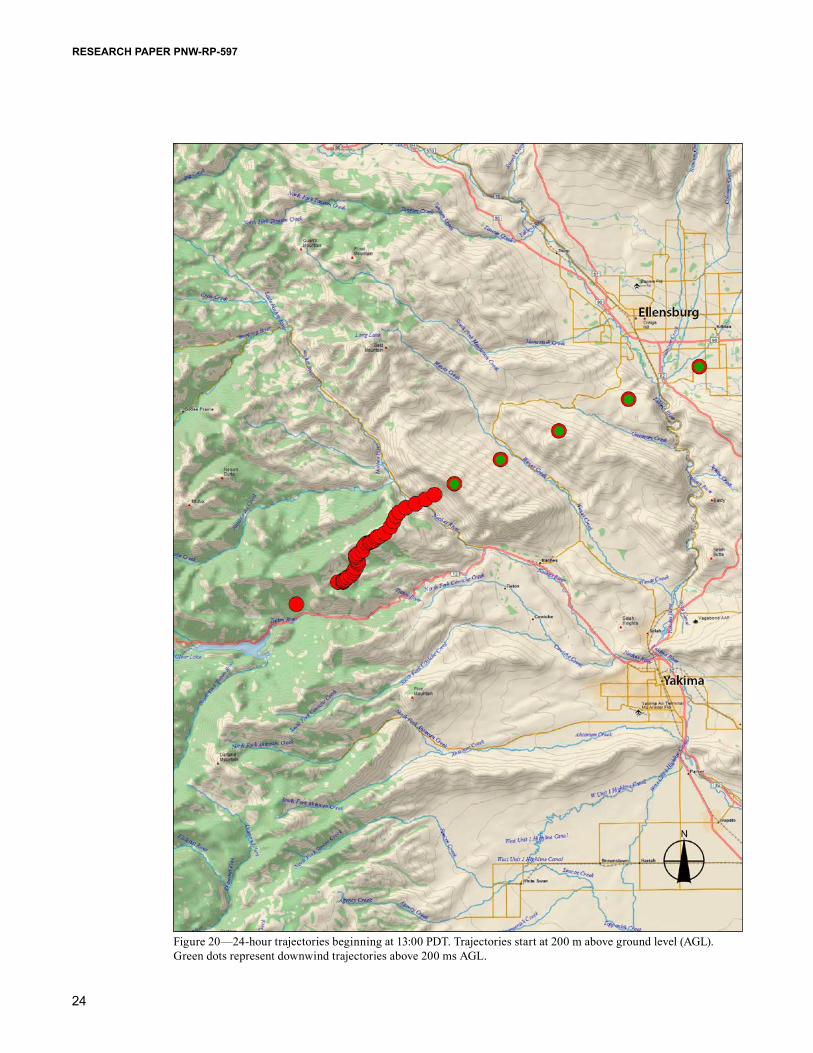
To explore a more conservative scenario where smoke would not be lofted as high above the fire as was observed, we generated trajectories starting at 200 m AGL (fig. 20). The 13:00 trajectory is shown, but the subsequent hours revealed a very similar pattern. Once again, the predicted plume initially dropped below the release height (200 m), only to rise again to above 200 m AGL for the duration of the simulation.
Simulated forecast trajectories predicted smoke lofted above the fire would be carried to the ENE, and would not affect Yakima.

22
RESEARCH PAPER PNW-RP-597
Figure 18—24-hour trajectories beginning at 13:00 Pacific Daylight Time (PDT) (red dots) and 15:00 PDT (orange dots). Trajectories start at 1000 m above ground level (AGL). Green dots represent downwind trajectories (for both hours) above 1000 m AGL.
23
Analysis of Meteorological Conditions for the Yakima Smoke Intrusion Case Study, 28 September 2009
Figure 19—24-hour trajectories beginning at 16:00 PDT. Trajectories start at 1000 m above ground level (AGL). Green dots represent downwind trajectories above 500 m AGL.
24
RESEARCH PAPER PNW-RP-597
Figure 20—24-hour trajectories beginning at 13:00 PDT. Trajectories start at 200 m above ground level (AGL). Green dots represent downwind trajectories above 200 ms AGL.

25
Analysis of Meteorological Conditions for the Yakima Smoke Intrusion Case Study, 28 September 2009
DiscussionOn 28 September 2009, air quality monitor data and public reports indicated a sig-nificant smoke intrusion in and around Yakima, Washington. On that same day, the Naches Ranger District was conducting a large underburn about 40 km to the west. The smoke in and around Yakima was believed to be from the underburn. Although the NAAQS for PM2.5 was not exceeded during this event, high PM2.5 concentra-tions persisted for several hours. The NWS spot weather forecast predicted good mixing during the day, with S to SW winds to carry the smoke away from Yakima. The burn was carried out by Forest Service personnel in accordance with the plan they registered with the Washington DNR, which approved the burn based on the current weather and forecast information available on the morning of the 28th. For the duration of the burn, smoke was indeed lofted and carried to the NE, away from the populated areas in and around Yakima. It was only after ignition was completed that the smoke plume was observed to veer to the east and affect ground level.
We studied this event to answer two questions. First, could this smoke intrusion have been anticipated with the tools available to the decisionmakers on the day of the burn, and second, if not, could this event have been predicted with higher reso-lution meteorological models that became available subsequent to the burn event? These higher resolution models are soon expected to be available operationally. We analyzed the 4-km hourly WRF output that was available on the day of the burn, 4-km WRF output at 10-minute intervals, and also 1.33-km WRF output at 10-min-ute intervals, which was not available to forecasters in real time. We also used the 1.33-WRF output in BlueSky smoke dispersion and trajectory simulations of the underburn. The finer resolution was used because it further resolved the features of the terrain and their effect on the wind regime.
Our results indicate model predictions available on the day of the burn would not have indicated that smoke from the underburn would affect Yakima late in the afternoon and into the evening of 28 September 2009. Winds were forecast to be from the SW, and the PBL height near the burn unit was forecast to be about 1000 m (about 3,300 feet) throughout the afternoon and evening. In fact, at the time of the smoke intrusion, observed winds in Yakima were strong (> 8 m/s) and from the SW.
Additionally, with the possible exception of the PBL height, we found no evidence in the high-resolution WRF model run to indicate that the meteorological conditions leading to the smoke intrusion could have been predicted. The winds were predicted to be from the SW, and PBL height at the burn unit was predicted to remain high throughout the night following the burn in the 4-km simulation, but
The higher resolution meteorological and smoke dispersion models not available at the time of the burn did not predict smoke from the prescribed burn would affect Yakima.

26
RESEARCH PAPER PNW-RP-597
decrease overnight in the 1.33-km simulation. The results from BlueSky runs using the high-resolution WRF output reinforced the prediction that smoke (PM2.5) from the burn would be transported to the NE of the burn unit, not ESE toward Yakima. Trajectories showed the upper air transport flow was also from the SW, in agree-ment with NWS forecasts.
The PBL height at Yakima was predicted to decrease earlier in the 1.33-km simulation than in the 4-km simulation. This is the only indication that the higher resolution model might have suggested the possibility of smoke getting trapped close to the ground on the night following the burn. The 4-km simulation kept the PBL height high at the burn unit compared to the 1.33-km simulation, and at Yakima, the 1.33-km PBL height decreased hours earlier than that in the 4-km simulation. Because there is no upper air data from the day of the burn in Yakima or near the burn site, we cannot know which simulation more accurately repre-sented the PBL heights. Predicted conditions in the boundary layer (including the PBL height) depend on which boundary layer parameterization scheme and initial conditions are used in the model, so it is possible that neither model run accurately represented actual PBL heights in the hours following the burn. This model config-uration was used for this study because it is used for the NRMC operational runs, and is what is currently available to forecasters and regulators for their decision-making process. Nevertheless, land managers and regulators typically do not use PBL heights (or other variables) from individual grid cells in the model domain for prescribed burn planning, so a close scrutiny such as was undertaken here would not have been done prior to the burn. In addition, models do not always adequately characterize conditions in the boundary layer, which is important for accurately predicting vertical mixing of smoke and other pollutants (Hu et al. 2010).
Despite this study, it remains unclear what meteorological conditions resulted in smoke transport from the underburn to Yakima. One possible explanation is that, as daytime heating waned, stability increased and terrain-induced downslope flow increasingly dominated the synoptic-scale southwesterly flow, such that the smoke that had been advected to the northeast of the burn unit settled into the lower eleva-tion areas in and around Yakima. The strong SW winds recorded in Yakima late in the afternoon do not support this. Another possibility is that downward flow set up as a thermal or lee-side trough moved east of the Cascade Range. Observational data are unavailable to verify or dispute this possible scenario. On the scale of 1.33- and 4-km the model simulations do not show smoke advecting into Yakima. To better predict smoke dispersion from burns in this area, knowledge of the specific local drainage flows, and timing of the shift from synoptic flows to drainage flows, is required. Collecting additional observational data of both smoke and meteoro-
27
Analysis of Meteorological Conditions for the Yakima Smoke Intrusion Case Study, 28 September 2009
logical variables would increase this local knowledge and help to better anticipate smoke-dispersion patterns from complex burns.
ConclusionsWe carried out a detailed meteorological and smoke dispersion analysis of a smoke intrusion event in Yakima, Washington, that occurred after an 800-ha prescribed burn 40 km to the west, on the Naches Ranger District. We found that the smoke intrusion could not have been easily predicted using the forecasts and models available on the day of the burn, nor could it have been foreseen from enhanced, higher-resolution meteorological models that were not widely available at the time. In fact, after doing a careful “hindsight” analysis, we found that there is not adequate observational data (surface or upper air) to definitively explain exactly what occurred meteorologically on 28 September 2009 that caused the high PM2.5 concentrations at the monitoring site in Yakima. The 1.33- and 4-km meteorologi-cal modeled wind data are similar and while their boundary layer predictions vary, neither explains the occurrence of smoke at the ground in Yakima.
As computing capability increases with faster, more cost-effective computers, weather forecasts are also improving. We now have available higher-resolution fore-casts than were available just a few years ago, and the quality of those forecasts is also improving. Nevertheless, there are limitations in the models, and the forecasts are not always accurate. It is hoped that in the not-too-distant future, meteorological models will improve to the point where the event that caused the smoke intrusion can be predicted.
28
RESEARCH PAPER PNW-RP-597
AcknowledgmentsWe thank David Ovens and Cliff Mass of the Department of Atmospheric Sciences at the University of Washington for providing all the WRF model output. Mark Moore of the NWAC and the AirFire Team provided surface weather data from White Pass and Chinook Pass. Tim Brown of the Desert Research Institute, Reno, Nevada, provided surface weather data from Yakima Air Terminal. Janice Peterson, Air Quality Specialist for the Mount Baker-Snoqualmie National Forest, provided documentation for the burn and subsequent intrusion, as well as weather data from Sawmill Flats RAWS and air quality data from Yakima. Dave Grant of the Washington DNR provided additional documentation of the weather forecast, and regulatory decisionmaking process from the day of the burn. We thank Tara Strand and Mark Moore for assistance with the manuscript. This investigation was sup-ported with funds from the U.S. Department of Agriculture Forest Service National Fire Plan, the State Office/Regional Offices of the Bureau of Land Management and National Forest System, and the Joint Fire Science Program Smoke and Emissions Model Intercomparison Project (SEMIP, #08-1-7-10). Financial support for the work done at University of Washington was primarily through the American Recovery and Reinvestment Act.
English EquivalentsWhen you know: Multiply by: To find:Meters (m) 3.28 FeetKilometers (km) 0.6215 MilesHectares (ha) 2.47 Acres
29
Analysis of Meteorological Conditions for the Yakima Smoke Intrusion Case Study, 28 September 2009
Literature CitedDraxler, R.R.; Hess, G.D. 1997. Description of the HYSPLIT-4 modeling
system. NOAA Technical Memorandum ERL ARL-224. Silver Spring, MD: U.S. Department of Commerce, National Oceanic and Atmospheric Administration. 24 p.
Haines, T.K.; Busby, R.L.; Cleaves, D.A. 2001. Prescribed burning in the South: trends, purpose and barriers. Southern Journal of Applied Forestry. 25: 149–153.
Hoadley, J.L.; Westrick, K.; Ferguson, S.A.; Goodrick, S.L.; Bradshaw, L.; Werth, P. 2004. The effect of model resolution in predicting meteorological parameters used in fire danger rating. Journal of Applied Meteorology. 43: 1333–1347.
Hong, S-Y.; Noh, Y.; Dudhia, J. 2006. A new vertical diffusion package with an explicit treatment of entrainment processes. Monthly Weather Review. 134: 2318–2341.
Hu, X-M.; Nielsen-Gammon, J.W.; Zhang, F. 2010. Evaluation of three planetary boundary layer schemes in the WRF model. Journal of Applied Meteorology and Climatology. 49: 1831–1844.
Klemp, J.B.; Skamarock, W.C.; Dudhia, J. 2007. Conservative split-explicit time integration methods for the compressible nonhydrostatic equations. Monthly Weather Review. 135: 2897–2913.
Larkin, N.K.; O’Neill, S.M.; Solomon, R.; Raffuse, S.; Strand, T.; Sullivan, D.; Krull, C.; Rorig, M.; Peterson, J.; Ferguson, S.A. 2009. The BlueSky smoke modeling framework. International Journal of Wildland Fire. 18: 906–920.
Mass, C.F.; Ovens, D.; Westrick, K.; Colle, B.A.; 2002. Does increasing horizontal resolution produce more skillful forecasts? Bulletin of the American Meteorological Society. 83: 407–430.
Michalakes, J.; Chen, S.; Dudhia, J.; Hart, L.; Klemp, J.; Middlecoff, J.; Skamarock, W. 2001. Development of a next generation regional Weather Research and Forecast model: developments in teracomputing. In: Zweiflhofer, W.; Kreitz, N., eds. Proceedings of the Ninth European Center for Medium-Range Weather Forecasting workshop on the use of high performance computing in meteorology. Singapore: World Scientific: 269–276.

30
RESEARCH PAPER PNW-RP-597
Michalakes, J.; Dudhia, J.; Gill, D.; Henderson, T.; Klemp, J.; Skamarock, W.; Wang, W. 2005. The Weather Research and Forecast Model: Software Architecture and Performance. In: Zweiflhofer, W.; Kreitz, N., eds. Proceedings of the 11th European Center for Medium-Range Weather Forecasting workshop on the use of high performance computing in meteorology. Singapore: World Scientific: 156–168.
Skamarock, W.C.; Klemp, J.B.; Dudhia, J.; Gill, D.O.; Barker, D.M.; Wang, W.; Powers, J.G. 2005. A description of the Advanced Research WRF version 2. NCAR Tech. Note NCAR/TN-468+STR. Boulder, CO: National Center for Atmospheric Research. 88 p.
Wicker, L.J.; Skamarock, W.C. 2002. Time-splitting methods for elastic models using forward time schemes. Monthly Weather Review. 130: 2088–2097.
Pacific Northwest Research Station
Web site http://www.fs.fed.us/pnw/Telephone (503) 808–2592Publication requests (503) 808–2138FAX (503) 808–2130E-mail [email protected] address Publications Distribution Pacific Northwest Research Station P.O. Box 3890 Portland, OR 97208–3890

U.S. Department of Agriculture Pacific Northwest Research Station 333 SW First Avenue P.O. Box 3890 Portland, OR 97208–3890
Official Business Penalty for Private Use, $300