Embed Size (px)
Citation preview
Package ‘CASdatasets’November 13, 2019
Type Package
Title Insurance Datasets
Version 1.0-10
Author Christophe Dutang [aut, cre], Arthur Charpentier [ctb]
Maintainer Christophe Dutang <[email protected]>
Description A collection of datasets, originally for the book 'Computational Actuarial Sci-ence with R' edited by Arthur Charpentier. Now, the package contains a large variety of actuar-ial datasets.
Depends R (>= 3.0.0), xts, sp
Imports lattice
License GPL (>= 2)
NeedsCompilation no
URL http://dutangc.free.fr/pub/RRepos/web/CASdatasets-index.html
BuildResaveData best
LazyData no
R topics documented:asiacomrisk . . . . . . . . . . . . . . . . . . . . . . . . . . . . . . . . . . . . . . . . . 3ausautoBI8999 . . . . . . . . . . . . . . . . . . . . . . . . . . . . . . . . . . . . . . . 4auscathist . . . . . . . . . . . . . . . . . . . . . . . . . . . . . . . . . . . . . . . . . . 5ausNLHYby . . . . . . . . . . . . . . . . . . . . . . . . . . . . . . . . . . . . . . . . . 6ausNLHYglossary . . . . . . . . . . . . . . . . . . . . . . . . . . . . . . . . . . . . . . 10ausNLHYlloyd . . . . . . . . . . . . . . . . . . . . . . . . . . . . . . . . . . . . . . . 12ausNLHYtotal . . . . . . . . . . . . . . . . . . . . . . . . . . . . . . . . . . . . . . . . 14ausNSW . . . . . . . . . . . . . . . . . . . . . . . . . . . . . . . . . . . . . . . . . . . 16ausprivauto . . . . . . . . . . . . . . . . . . . . . . . . . . . . . . . . . . . . . . . . . 17austriLoB . . . . . . . . . . . . . . . . . . . . . . . . . . . . . . . . . . . . . . . . . . 19beaonre . . . . . . . . . . . . . . . . . . . . . . . . . . . . . . . . . . . . . . . . . . . 21besecura . . . . . . . . . . . . . . . . . . . . . . . . . . . . . . . . . . . . . . . . . . . 22bragg . . . . . . . . . . . . . . . . . . . . . . . . . . . . . . . . . . . . . . . . . . . . 23brautocoll . . . . . . . . . . . . . . . . . . . . . . . . . . . . . . . . . . . . . . . . . . 24brgeomunic . . . . . . . . . . . . . . . . . . . . . . . . . . . . . . . . . . . . . . . . . 25brvehins . . . . . . . . . . . . . . . . . . . . . . . . . . . . . . . . . . . . . . . . . . . 27canlifins . . . . . . . . . . . . . . . . . . . . . . . . . . . . . . . . . . . . . . . . . . . 29
1

2 R topics documented:
CASdatasets . . . . . . . . . . . . . . . . . . . . . . . . . . . . . . . . . . . . . . . . . 30credit . . . . . . . . . . . . . . . . . . . . . . . . . . . . . . . . . . . . . . . . . . . . 33danish . . . . . . . . . . . . . . . . . . . . . . . . . . . . . . . . . . . . . . . . . . . . 35Davis . . . . . . . . . . . . . . . . . . . . . . . . . . . . . . . . . . . . . . . . . . . . 36ECBYieldCurve . . . . . . . . . . . . . . . . . . . . . . . . . . . . . . . . . . . . . . . 37eqlist . . . . . . . . . . . . . . . . . . . . . . . . . . . . . . . . . . . . . . . . . . . . . 37eudirectlapse . . . . . . . . . . . . . . . . . . . . . . . . . . . . . . . . . . . . . . . . 39FedYieldCurve . . . . . . . . . . . . . . . . . . . . . . . . . . . . . . . . . . . . . . . 40forexUSUK . . . . . . . . . . . . . . . . . . . . . . . . . . . . . . . . . . . . . . . . . 40fre4LoBtriangles . . . . . . . . . . . . . . . . . . . . . . . . . . . . . . . . . . . . . . 41freaggnumber . . . . . . . . . . . . . . . . . . . . . . . . . . . . . . . . . . . . . . . . 42frebiloss . . . . . . . . . . . . . . . . . . . . . . . . . . . . . . . . . . . . . . . . . . . 43freclaimset . . . . . . . . . . . . . . . . . . . . . . . . . . . . . . . . . . . . . . . . . . 44freclaimset2 . . . . . . . . . . . . . . . . . . . . . . . . . . . . . . . . . . . . . . . . . 45frecomfire . . . . . . . . . . . . . . . . . . . . . . . . . . . . . . . . . . . . . . . . . . 46freDisTables . . . . . . . . . . . . . . . . . . . . . . . . . . . . . . . . . . . . . . . . . 47fredpt17 . . . . . . . . . . . . . . . . . . . . . . . . . . . . . . . . . . . . . . . . . . . 50fremarine . . . . . . . . . . . . . . . . . . . . . . . . . . . . . . . . . . . . . . . . . . 51freMortTables . . . . . . . . . . . . . . . . . . . . . . . . . . . . . . . . . . . . . . . . 52fremotorclaim . . . . . . . . . . . . . . . . . . . . . . . . . . . . . . . . . . . . . . . . 55freMPL . . . . . . . . . . . . . . . . . . . . . . . . . . . . . . . . . . . . . . . . . . . 58freMTPL . . . . . . . . . . . . . . . . . . . . . . . . . . . . . . . . . . . . . . . . . . 61freportfolio . . . . . . . . . . . . . . . . . . . . . . . . . . . . . . . . . . . . . . . . . 63hurricanehist . . . . . . . . . . . . . . . . . . . . . . . . . . . . . . . . . . . . . . . . 66ICB . . . . . . . . . . . . . . . . . . . . . . . . . . . . . . . . . . . . . . . . . . . . . 67itamtplcost . . . . . . . . . . . . . . . . . . . . . . . . . . . . . . . . . . . . . . . . . . 71linearmodelfactor . . . . . . . . . . . . . . . . . . . . . . . . . . . . . . . . . . . . . . 71lossalae . . . . . . . . . . . . . . . . . . . . . . . . . . . . . . . . . . . . . . . . . . . 72norauto . . . . . . . . . . . . . . . . . . . . . . . . . . . . . . . . . . . . . . . . . . . 73Norberg . . . . . . . . . . . . . . . . . . . . . . . . . . . . . . . . . . . . . . . . . . . 74norfire . . . . . . . . . . . . . . . . . . . . . . . . . . . . . . . . . . . . . . . . . . . . 75nortritpl8800 . . . . . . . . . . . . . . . . . . . . . . . . . . . . . . . . . . . . . . . . 76nzcathist . . . . . . . . . . . . . . . . . . . . . . . . . . . . . . . . . . . . . . . . . . . 77PnCdemand . . . . . . . . . . . . . . . . . . . . . . . . . . . . . . . . . . . . . . . . . 78pricingame . . . . . . . . . . . . . . . . . . . . . . . . . . . . . . . . . . . . . . . . . 79sgautonb . . . . . . . . . . . . . . . . . . . . . . . . . . . . . . . . . . . . . . . . . . . 84sgtriangles . . . . . . . . . . . . . . . . . . . . . . . . . . . . . . . . . . . . . . . . . . 85SOAGMI . . . . . . . . . . . . . . . . . . . . . . . . . . . . . . . . . . . . . . . . . . 86spacedata . . . . . . . . . . . . . . . . . . . . . . . . . . . . . . . . . . . . . . . . . . 87swautoins . . . . . . . . . . . . . . . . . . . . . . . . . . . . . . . . . . . . . . . . . . 89swbusscase . . . . . . . . . . . . . . . . . . . . . . . . . . . . . . . . . . . . . . . . . 90swmotorcycle . . . . . . . . . . . . . . . . . . . . . . . . . . . . . . . . . . . . . . . . 91swtriangles . . . . . . . . . . . . . . . . . . . . . . . . . . . . . . . . . . . . . . . . . 93tplclaimnumber . . . . . . . . . . . . . . . . . . . . . . . . . . . . . . . . . . . . . . . 93ukaggclaim . . . . . . . . . . . . . . . . . . . . . . . . . . . . . . . . . . . . . . . . . 94ukautocoll . . . . . . . . . . . . . . . . . . . . . . . . . . . . . . . . . . . . . . . . . . 95usautoBI . . . . . . . . . . . . . . . . . . . . . . . . . . . . . . . . . . . . . . . . . . . 96usautotriangles . . . . . . . . . . . . . . . . . . . . . . . . . . . . . . . . . . . . . . . 97usexpense . . . . . . . . . . . . . . . . . . . . . . . . . . . . . . . . . . . . . . . . . . 98usGLtriangles . . . . . . . . . . . . . . . . . . . . . . . . . . . . . . . . . . . . . . . . 99ushurricane . . . . . . . . . . . . . . . . . . . . . . . . . . . . . . . . . . . . . . . . . 100ushustormloss4980 . . . . . . . . . . . . . . . . . . . . . . . . . . . . . . . . . . . . . 102
asiacomrisk 3
uslapseagent . . . . . . . . . . . . . . . . . . . . . . . . . . . . . . . . . . . . . . . . . 103usmassBI . . . . . . . . . . . . . . . . . . . . . . . . . . . . . . . . . . . . . . . . . . 104usmedclaim . . . . . . . . . . . . . . . . . . . . . . . . . . . . . . . . . . . . . . . . . 105usprivautoclaim . . . . . . . . . . . . . . . . . . . . . . . . . . . . . . . . . . . . . . . 106usquakeLR . . . . . . . . . . . . . . . . . . . . . . . . . . . . . . . . . . . . . . . . . 107ustermlife . . . . . . . . . . . . . . . . . . . . . . . . . . . . . . . . . . . . . . . . . . 108uswarrantaggnum . . . . . . . . . . . . . . . . . . . . . . . . . . . . . . . . . . . . . . 109usworkcomp . . . . . . . . . . . . . . . . . . . . . . . . . . . . . . . . . . . . . . . . . 110
Index 112
asiacomrisk Large commercial risks in Asia-Pacific
Description
A completed project by the Insurance Risk and Finance Research Centre (www.IRFRC.com) hasassembled a unique dataset from Large Commercial Risk losses in Asia-Pacific (APAC) coveringthe period 2000-2013. The data was generously contributed by one global reinsurance companyand two large Lloyd’s syndicates in London. This dataset is the result of the project co-lead by DrMilidonis (IRFRC and University of Cyprus) and Enrico Biffis (Imperial College Business School),which can be referred to as the IRFRC LCR Dataset.
As expected, the dataset is fully anonymised, as the LCR losses are aggregated along a few dimen-sions. First, data is categorised based on the World Bank’s economic development classification.This means that losses either come from developed or developing countries. The second dimen-sion used to aggregate the data is the time period covered. Data is grouped into (at least) twotime-periods: the period before and after the 2008 crisis.
A large commercial risk (LCR) is defined as a loss caused by man-made risks (e.g. fire, explosion,etc.). We exclude natural catastrophe events, and started by focusing on claims that made thedata provider incur a loss amount of at least EUR 1 million. We then extended our dataset toinclude claims leading to loss amounts smaller that EUR 1 million. Given time constraints, weonly partially extended loss data by obtaining FGU losses larger than EUR 140k. One should notethat any selection bias arising from the data collection exercise is driven by both data quality andreliability. Based on our experience, the latter two attributes are homogeneous across developedand developing countries APAC claims.
For further details, see the technical report: Benedetti, Biffis and Milidonis (2015a).
Usage
data(asiacomrisk)
Format
asiacomrisk contains 7 columns:
Period A character string for the period: "2000-2003", "2004-2008", "2009-2010", "2011-2013".
FGU From the Ground Up Loss (USD).
TIV Total Insurable Value (TIV) replaced with Total Sum Insured (TSI) when the TIV is not avail-able (USD).
CountryStatus A character string for the country status: "Developped", "Emerging".
4 ausautoBI8999
Usage A character string for the type of exposure hit by the loss: "Commercial", "Energy","Manufacturing", "Misc.", "Residential".
SubUsage A character string for a precised type of exposure hit by the loss: "Commercial","Energy", "General industry", "Metals/Mines/Chemicals", "Misc.", "Residential","Utility".
DR A numeric for the destruction rate (FGU divided TIV capped to 1).
Source
IRFRC
References
Benedetti, D., Biffis, E., and Milidonis, A. (2015a). Large Commercial Risks (LCR) in Insurance:Focus on Asia-Pacific, Insurance Risk and Finance Research Centre Technical report.
Benedetti, D., Biffis, E., and Milidonis, A. (2015b). Large Commercial Exposures and Tail Risk:Evidence from the Asia-Pacific Property and Casualty Insurance Market, Working paper.
Chavez-Demoulin, V., Embrechts, P., and Hofert, M. (2015). An extreme value approach for mod-eling operational risk losses depending on covariates. The Journal of Risk and Insurance.
Examples
# (1) load of data#data(asiacomrisk)dim(asiacomrisk)
# (2) basic boxplots#
asiacomriskboxplot(DR ~ Usage, data=asiacomrisk)boxplot(DR ~ SubUsage, data=asiacomrisk)boxplot(DR ~ Period, data=asiacomrisk)boxplot(DR ~ CountryStatus, data=asiacomrisk)
ausautoBI8999 Automobile bodily injury claim dataset in Australia
Description
This data set contains information on 22036 settled personal injury insurance claims in Australia.These claims arose from accidents occurring from July 1989 through to January 1999. Claimssettled with zero payment are not included.
Usage
data(ausautoBI8999)
auscathist 5
Format
ausautoBI8999 is a data frame of 8 columns and 1,340 rows:
AccDate, ReportDate, FinDate The accident date, the reporting date, the finalization date, notethat the day is always set to the first day of the month.
AccMth, ReportMth, FinMth The accident month, the reporting month, the finalization month: 1 =July 1989, ..., 120 = June 1999).
OpTime The operational time.
InjType1, InjType2, InjType3, InjType4, InjType5 The injury code for the people injured (upto five).
InjNb Number of injured people.
Legal A character string for: Has the policyholder a legal representation?
AggClaim Aggregate settled amount of claims.
Source
DeJongHellerBook
References
P. De Jong and G.Z. Heller (2008), Generalized linear models for insurance data, Cambridge Uni-versity Press.
Examples
# (1) load of data#data(ausautoBI8999)dim(ausautoBI8999)head(ausautoBI8999)
auscathist Australian catastrophe historic
Description
Historical disaster statistics in Australia from 1967 to 2014.
Usage
data(auscathist)
6 ausNLHYby
Format
auscathist is a data frame of 9 columns:
Year a numeric for the Year.
Quarter a numeric for the quarter of the year.
Date a character string for the date.
FirstDay a Date object for the first day of natural catastrophe.
LastDay a Date object for the last day of natural catastrophe, when available.
Event a character string describing the event.
Type a factor describing the event type among the list: "Cyclone", "Earthquake", "Flood","Flood,Storm", "Hailstorm", "Other", "Power outage", "Storm", "Tornado", "Weather","Bushfire".
Location a character string describing the location.
OriginalCost Original cost in million of Australian dollars (AUD).
NormCost2011 Normed cost in million of 2011 Australian dollars (AUD) taking into account in-flation, change in wealth and population.
NormCost2014 Normed cost in million of 2014 Australian dollars (AUD) computed as the inflatedcost NormCost2011 using CPI.
Source
http://www.insurancecouncil.com.au/
Examples
# (1) load of data#data(auscathist)
# (2) plot of data#plot(ecdf(auscathist$NormCost2014))
ausNLHYby Australian Market - non-life insurance (company, state, public level)
Description
Financial performance and financial position of insurers operating in Australia between 2005 and2010 (company, state, public level).
ausNLHYby 7
Usage
data(ausNLHYClaimByState)data(ausNLHYPremByState)
data(ausNLHYCapAdeqByComp)data(ausNLHYFinPerfByComp)data(ausNLHYFinPosByComp)data(ausNLHYPrivInsur)
data(ausNLHYFinPerfPublic)data(ausNLHYFinPosPublic)data(ausNLHYOpIncExpPublic)data(ausNLHYPremClaimPublic)data(ausNLHYPubInsur)
Format
ausNLHYPremByState (Table 10) and ausNLHYClaimByState (Table 11) are data frames of 6 columns(values are in million of Australian dollars (AUD)):
• Class: Class of business.
• NSWACTYYYYMM: New South Wales / Australian Capital Territory for year YYYY.
• VICYYYYMM: Victoria in year YYYY reported on DateYYYYMM.
• QLDYYYMM: Queensland in year YYYY reported on DateYYYYMM.
• SAYYYYMM: South Australia in year YYYY reported on DateYYYYMM.
• WAYYYYMM: Western Australia in year YYYY reported on DateYYYYMM.
• TAYYYYMM: Tasmania in year YYYY reported on DateYYYYMM.
• NTYYYYMM: Northern Territory in year YYYY reported on DateYYYYMM.
• TotalYYYYMM: Total in year YYYY reported on DateYYYYMM.
where YYYYMM is the concatenation of the year YYYY and month MM, e.g. 200506.
ausNLHYPrivInsur (Classficiation private) is a data frame of 6 columns (values are in thousand ofAustralian dollars (AUD)):
• Company: Company short name.
• FullNameYYYYMM: FUll name of the company for year YYYY.
• DateYYYYMM: Date in year YYYY reported on DateYYYYMM.
• ClassficiationYYYMM: Classficiation in year YYYY reported on DateYYYYMM either Director Reinsurer.
• BranchYYYYMM: non empty when branch insurer in year YYYY reported on DateYYYYMM.
• RestrictionYYYYMM: Restriction on underwriting in year YYYY reported on DateYYYYMM.
where YYYYMM is the concatenation of the year YYYY and month MM, e.g. 200506.
ausNLHYCapAdeqByComp (Table 14) is a data frame of 6 columns (values are in thousand of Aus-tralian dollars (AUD)):
• Company: Company short name.
• DateYYYYMM: Balance Date for year YYYY.
8 ausNLHYby
• MCRYYYYMM: Minimum capital requirement in year YYYY reported on DateYYYYMM.
• CapitalYYYMM: Capital base in year YYYY reported on DateYYYYMM.
• SurplusYYYYMM: Capital surplus in year YYYY reported on DateYYYYMM.
• SolRatioYYYYMM: Solvency coverage ratio in year YYYY reported on DateYYYYMM.
where YYYYMM is the concatenation of the year YYYY and month MM, e.g. 200506.
ausNLHYFinPerfByComp (Table 12) is a data frame of 9 columns (values are in thousand of Aus-tralian dollars (AUD)):
• Company: Company short name.
• DateYYYYMM: Balance Date for year YYYY.
• GWPYYYYMM: Gross written premium revenue in year YYYY reported on DateYYYYMM.
• REYYYYMM: Outwards reinsurance expense in year YYYY reported on DateYYYYMM.
• NWPYYYYMM: Net written premium revenue in year YYYY reported on DateYYYYMM.
• GICYYYYMM: Gross incurred claims in year YYYY reported on DateYYYYMM.
• NRRYYYYMM: Non-reinsurance recoveries revenue in year YYYY reported on DateYYYYMM.
• RRYYYYMM: Reinsurance recoveries revenue in year YYYY reported on DateYYYYMM.
• NICYYYYMM: Net incurred claims in year YYYY reported on DateYYYYMM.
• UWEYYYYMM: Underwriting expenses in year YYYY reported on DateYYYYMM.
• UWRYYYYMM: Underwriting result in year YYYY reported on DateYYYYMM.
• IIYYYYMM: Investment income in year YYYY reported on DateYYYYMM.
• OIYYYYMM: Other items in year YYYY reported on DateYYYYMM.
• NPATYYYYMM: Net profit-loss after tax in year YYYY reported on DateYYYYMM.
where YYYYMM is the concatenation of the year YYYY and month MM, e.g. 200506.
ausNLHYFinPosByComp (Table 13) is a data frame of 7 columns (values are in thousand of Australiandollars (AUD)):
• Company: Company short name.
• InvestYYYYMM: Investments for year YYYY.
• TotalAssetYYYYMM: Total assets in year YYYY reported on DateYYYYMM.
• ClaimReservYYYMM: Outstanding claims provision in year YYYY reported on DateYYYYMM.
• PremLiabYYYYMM: Premium liabilities in year YYYY reported on DateYYYYMM.
• ClaimReservYYYYMM: Total liabilities in year YYYY reported on DateYYYYMM.
• TotalLiabYYYYMM: Shareholders equity in year YYYY reported on DateYYYYMM.
• EquityYYYYMM: Shareholders equity in year YYYY reported on DateYYYYMM.
where YYYYMM is the concatenation of the year YYYY and month MM, e.g. 200506.
ausNLHYPubInsur (Classification public) is a data frame of 1 column:
• CompanyYYYYMM: Company name for year YYYY.
ausNLHYFinPerfPublic (Table 15), ausNLHYOpIncExpPublic (Table 16), are data frames of 2columns (values are in million of Australian dollars (AUD)):
• Content: Content.
• TotalYYYYMM: Total for year YYYY.
ausNLHYby 9
ausNLHYFinPosPublic (Table 17) is a data frame of 3 columns (values are in million of Australiandollars (AUD)):
• Content: Content.
• TotalYYYYMM: Total for year YYYY.
• InsideAustraliaOnlyYYYYMM: Inside Australia Only for year YYYY.
ausNLHYPremClaimPublic (Table 18) is a data frame of 6 columns (values are in million of Aus-tralian dollars (AUD)):
• Class: Class of business.
• GWPYYYYMM: Gross written premium revenue in year YYYY reported on DateYYYYMM.
• PEYYYYMM: Premium revenue in year YYYY reported on DateYYYYMM.
• REYYYYMM: Reinsurance expense in year YYYY reported on DateYYYYMM.
• GICYYYYMM: Gross incurred claims in year YYYY reported on DateYYYYMM.
• RORYYYYMM: Reinsurance recoveries revenue in year YYYY reported on DateYYYYMM.
where YYYYMM is the concatenation of the year YYYY and month MM, e.g. 200506.
Source
Data is copyrighted by Australian Prudential Regulation Authority (APRA) and is under the Cre-ative Commons - By licence. Please refer to http://www.apra.gov.au/
See Also
ausNLHYtotal for aggregate level, ausNLHYlloyd for LLoyds and ausNLHYglossary for glossarynotes.
Examples
# (1) by company data#data(ausNLHYCapAdeqByComp)data(ausNLHYFinPerfByComp)data(ausNLHYFinPosByComp)
# (2) by state data#data(ausNLHYClaimByState)data(ausNLHYPremByState)
# (3) public sector data#data(ausNLHYFinPerfPublic)data(ausNLHYFinPosPublic)data(ausNLHYOpIncExpPublic)data(ausNLHYPremClaimPublic)
10 ausNLHYglossary
ausNLHYglossary Australian Market - non-life insurance (Glossary)
Description
Financial performance and financial position of insurers operating in Australia between 2005 and2010 (Glossary).
Details
Glossary notes:
• Capital base is the amount of eligible capital held by an insurer to provide a buffer againstlosses that have not been anticipated and, in the event of problems, enable the insurer tocontinue operating while those problems are addressed or resolved. For locally incorporatedinsurers it is the sum of tier 1 capital (net of deductions) and tier 2 capital . Capital base forbranch insurers is derived from net assets inside Australia.
• Captive insurer is a company within a group of related companies performing the function ofinsurer to that group.
• Classes of business in tables 7-11 are shown in order of risk capital factors as described inguidance note GGN 110.3.
• Direct insurers are those insurers who, excluding intra-group arrangements, predominantlyundertake liability by way of direct insurance business.
• Earned premium (as defined in AASB 1023 ) is the amount of premium earned during thefinancial year and includes movements in the unearned premium provision.
• Gross claims expense (as per table 11) relates to: claims that are paid during a financial period;and recognised claims liabilities (i.e. movement in outstanding claims provision).
• Gross incurred claims comprises claims paid during the period, movements in the outstandingclaims provision and movements in premium liabilities .
• Gross premium revenue is recognised fully when the business is written. The accounting con-cepts of earned and unearned premium are no longer recognised under the APRA prudentialframework, hence this item is not consistent with AASB 1023 requirements. Instead, thepotential claims liabilities arising from the uncovered term of written insurance business arerecognised through the creation of premium liabilities .
• LMI (Lenders mortgage insurers) provide cover to protect lenders from default by borrowerson loans secured by mortgage. Mortgage insurers are substantially different to other insurersand are subject to special condition of authority.
• Lower tier 2 ratio is lower tier 2 capital divided by tier 1 capital (net of deductions) . Theregulatory maximum for this ratio is 50 percent.
• Lloyd’s is a London based insurance market in which business is underwritten by both indi-viduals and corporate members who form syndicates to accept risk.
• Minimum capital requirement is the amount of risk-based capital APRA requires general in-surers to hold to meet its insurance obligations under a wide range of circumstances.
• Net incurred claims is gross incurred claims net of reinsurance recoveries revenue and non-reinsurance recoveries revenue.
• Net loss ratio is net incurred claims divided by net premium revenue. Net premium revenue isgross premium revenue net of outwards reinsurance expense.
ausNLHYglossary 11
• Net profit/loss refers to profit or loss from ordinary activities after income tax, before extraor-dinary items.
• Non-reinsurance recoverables comprise recoverables from subrogation, salvage, sharing ar-rangements etc, net of provision for doubtful debts.
• Non-reinsurance recoveries revenue comprises amounts the insurer has recovered or is entitledto recover from subrogation, salvage and other non-reinsurance recoveries.
• Other assets comprises investment income receivable, other reinsurance assets receivable fromreinsurers (i.e. other than reinsurance recoveries), GST receivable, other receivables, tax as-sets, plant and equipment (net of depreciation) and other assets.
• Other investments are strategic investments/acquisitions and other investments that do notconstitute investments integral to insurance operations.
• Other items comprises other operating income, goodwill amortisation and income tax expenseor benefit. Other liabilities comprises creditors and accruals, other provisions and other liabil-ities. Other operating expenses are all operating expenses not related to underwriting.
• Outstanding claims provision is the insurer’s liability for outstanding claims. It recognisesthe potential cost to the insurer of settling claims which it has incurred at the reporting date(including estimates of claims that have not yet been notified to the insurer), but which have notbeen paid. The amount reported is after taking account of inflation and discounting, withoutdeducting reinsurance and non- reinsurance recoverables .
• Outwards reinsurance expense is premium ceded to reinsurers, recognised as an expense fullywhen incurred or contracted.
• Payables on reinsurance contracts comprise amounts payable to reinsurers. This includes pre-miums payable but not yet due for payment, deposits withheld from reinsurers, commissionsdue to reinsurers and the reinsurers’ portion of recoveries and salvage.
• Premium liabilities relate to the future claims arising from future events insured under ex-isting policies accepted. This fully prospective determination is a more effective means ofrecognising potential risk than the accounting concept of unearned premium. The amount re-ported is after taking ‘account of inflation and discounting, without deducting reinsurance andnon-reinsurance recoveries.
• Premium receivables are premiums due, net of provision for doubtful debts, including un-closed business written close to the reporting date.
• Reinsurance recoverables comprise amounts recoverable under reinsurance contracts. Rein-surance and other recoverables is the aggregate of reinsurance recoverables and non-reinsurancerecoverables.
• Reinsurance recoveries revenue comprises amounts the insurer has recovered or is entitled torecover from reinsurers on incurred claims during the reporting period.
• Reinsurers are those insurers who, excluding intra-group arrangements, predominantly under-take liability by way of reinsurance business.
• Return on assets is net profit/loss divided by the average on-balance sheet total assets for theperiod. Return on equity is net profit/loss divided by the average shareholders’ equity for theperiod.
• Run-off insurers are restricted by APRA from writing new or renewal insurance business.However, the company may still be acting as an insurance agent, broker or underwriting agentfor other general insurers.
• Solvency coverage is capital base divided by minimum capital requirement.• Tier 1 capital (net of deductions) comprises the highest quality capital elements, including:
paid-up ordinary shares, general reserves, retained earnings, current year earnings net of ex-pected dividends and tax expenses, technical provisions in excess of those required by GPS210 , non-cumulative irredeemable preference shares and other "innovative" capital instru-ments. This amount is net of goodwill, other intangible assets and future income tax benefits.
12 ausNLHYlloyd
Source
Data is copyrighted by Australian Prudential Regulation Authority (APRA) and is under the Cre-ative Commons - By licence. Please refer to http://www.apra.gov.au/
See Also
ausNLHYby for company, state, public level, ausNLHYlloyd for LLoyds and ausNLHYtotal foraggregate level.
ausNLHYlloyd Australian Market - non-life insurance (LLoyds insurance business)
Description
Financial performance and financial position of insurers operating in Australia between 2005 and2010 (LLoyds insurance business).
Usage
data(ausNLHYLloydAsset)data(ausNLHYLloydGPI)data(ausNLHYLloydUWAcc)data(ausNLHYLloydUWRes)
Format
ausNLHYLloydUWAcc (Table 15) and ausNLHYLloydUWAcc (Table 16) are data frames of 4 columns(values are in thousand of Australian dollars (AUD)):
• Content: Content.
• AccYear2YrAgoYYYYMM: value in the 2-year-ago accounting year in year YYYY reported inDecember.
• AccYear1YrAgoYYYYMM: value in the 1-year-ago accounting year in year YYYY reported inDecember.
• AccYear0YrAgoYYYYMM: value in the current accounting year in year YYYY reported in Decem-ber.
where YYYYMM is the concatenation of the year YYYY and month MM=12, e.g. 200512.
ausNLHYLloydGPI (Table 17) is a data frame of 4 columns (values are in thousand of Australiandollars (AUD)):
• Content: Content.
• DirectYYYYMM: Direct premiums (gross) including inward faculative reinsurance in year YYYYreported in December.
• InwardYYYYMM: Inward treaty reinsurance premiums (gross) in year YYYY reported in Decem-ber.
• TotalYYYYMM: Total premium income (gross) in year YYYY reported in December.

ausNLHYlloyd 13
where YYYYMM is the concatenation of the year YYYY and month MM=12, e.g. 200512.
ausNLHYLloydAsset (Table 18) is a data frame of 4 columns (values are in thousand of Australiandollars (AUD)):
• Content: Content.
• TrustFundYYYYMM: Lloyds Australia trust fund in year YYYY reported in December.
• AssetFund1.YYYYMM: Lloyds Australia joint asset fund No.1 in year YYYY reported in Decem-ber.
• AssetFund2.YYYYMM: Lloyds Australia joint asset fund No.2 in year YYYY reported in Decem-ber.
where YYYYMM is the concatenation of the year YYYY and month MM=12, e.g. 200512.
Details
It is not possible to compare Lloyd’s with authorised companies. Lloyd’s operates a unique threeyear accounting system that differs substantially from normal practices. Different classes of busi-ness are also used.
The individual syndicates, which are members of the Lloyd’s market, are independent entities whichare supervised by the Financial Services Authority (FSA) in the UK not by APRA. However, forthe protection of policy holders in Australia, Lloyd’s is required to maintain trust funds in Australia(refer to Lloyd’s Assets Table 18).
Source
Data is copyrighted by Australian Prudential Regulation Authority (APRA) and is under the Cre-ative Commons - By licence. Please refer to http://www.apra.gov.au/
See Also
ausNLHYby for company, state, public level, ausNLHYtotal for aggregate level and ausNLHYglossaryfor glossary notes.
Examples
# (1) lloyds data#data(ausNLHYLloydAsset)data(ausNLHYLloydGPI)data(ausNLHYLloydUWAcc)data(ausNLHYLloydUWRes)
14 ausNLHYtotal
ausNLHYtotal Australian Market - non-life insurance (aggregate level)
Description
Financial performance and financial position of insurers operating in Australia between 2005 and2010 (aggregate level).
Usage
data(ausNLHYCapAdeq)data(ausNLHYFinPerf)data(ausNLHYFinPos)data(ausNLHYLiability)data(ausNLHYOffProf)data(ausNLHYOpIncExp)data(ausNLHYPremClaim)data(ausNLHYPrivInsur)data(ausNLHYPubInsur)data(ausNLHYRecAASB)data(ausNLHYReserve)
Format
All values are in million of Australian dollars (AUD).
ausNLHYFinPerf (Table 1), ausNLHYCapAdeq (Table 5), ausNLHYOpIncExp (Table 2) are data framesof 4 columns:
• Content: Content.
• InsurersYYYYMM: Insurers for year YYYY.
• ReinsurersYYYYMM: Reinsurers in year YYYY reported on DateYYYYMM.
• TotalYYYMM: Total in year YYYY reported on DateYYYYMM.
where YYYYMM is the concatenation of the year YYYY and month MM, e.g. 200506.
ausNLHYRecAASB (Table 6) is data frames of 4 columns:
• Content: Content.
• NBInsurersYYYYMM: Non-branch Insurers for year YYYY.
• NBReinsurersYYYYMM: Non-branch Reinsurers in year YYYY reported on DateYYYYMM.
• NBTotalYYYMM: Non-branch Total in year YYYY reported on DateYYYYMM.
where YYYYMM is the concatenation of the year YYYY and month MM, e.g. 200506.
ausNLHYFinPos (Table 3) is a data frame of 5 columns:
• Content: Content.
• InsurersYYYYMM: Insurers for year YYYY.
ausNLHYtotal 15
• ReinsurersYYYYMM: Reinsurers in year YYYY reported on DateYYYYMM.
• TotalYYYMM: Total in year YYYY reported on DateYYYYMM.
• InsideAustraliaOnlyYYYMM: InsideAustraliaOnly in year YYYY reported on DateYYYYMM.
where YYYYMM is the concatenation of the year YYYY and month MM, e.g. 200506.
ausNLHYPremClaim (Table 7) is a data frame of 6 columns:
• Class: Class of business.
• GWPYYYYMM: Gross written premium revenue in year YYYY reported on DateYYYYMM.
• REYYYYMM: Outwards reinsurance expense in year YYYY reported on DateYYYYMM.
• NWPYYYYMM: Net written premium revenue in year YYYY reported on DateYYYYMM.
• GICYYYYMM: Gross incurred claims in year YYYY reported on DateYYYYMM.
• RRYYYYMM: Reinsurance recoveries revenue in year YYYY reported on DateYYYYMM.
where YYYYMM is the concatenation of the year YYYY and month MM, e.g. 200506.
ausNLHYReserve (Table 8) is a data frame of 5 columns:
• Class: Class of business.
• GORYYYYMM: Gross Outstanding Reserve in year YYYY reported on DateYYYYMM.
• RRYYYYMM: Reinsurance Recoverables in year YYYY reported on DateYYYYMM.
• NRRYYYYMM: Non Reinsurance Recoverables in year YYYY reported on DateYYYYMM.
• NORYYYYMM: Net Outstanding Reserve in year YYYY reported on DateYYYYMM.
where YYYYMM is the concatenation of the year YYYY and month MM, e.g. 200506.
ausNLHYLiability (Table 9) is a data frame of 5 columns:
• Content: Content.
• GPLYYYYMM: Gross Premium Liability in year YYYY reported on DateYYYYMM.
• RRYYYYMM: Reinsurance Recoverables in year YYYY reported on DateYYYYMM.
• NRRYYYYMM: Non Reinsurance Recoverables in year YYYY reported on DateYYYYMM.
• NPLYYYYMM: Net Premium Liability in year YYYY reported on DateYYYYMM.
where YYYYMM is the concatenation of the year YYYY and month MM, e.g. 200506.
ausNLHYOffProf (Table 4) is a data frame of 7 columns:
• Content: Content.
• AusInsurersYYYYMM: Australian Insurers for year YYYY.
• AusReinsurersYYYYMM: Australian Reinsurers in year YYYY reported on DateYYYYMM.
• AusTotalYYYMM: Australian Total level in year YYYY reported on DateYYYYMM.
• OffInsurersYYYYMM: Offshore Insurers for year YYYY.
• OffReinsurersYYYYMM: Offshore Reinsurers in year YYYY reported on DateYYYYMM.
• OffTotalYYYMM: Offshore Total level in year YYYY reported on DateYYYYMM.
where YYYYMM is the concatenation of the year YYYY and month MM, e.g. 200506.
Source
Data is copyrighted by Australian Prudential Regulation Authority (APRA) and is under the Cre-ative Commons - By licence. Please refer to http://www.apra.gov.au/
16 ausNSW
See Also
ausNLHYby for company, state, public level, ausNLHYlloyd for LLoyds and ausNLHYglossary forglossary notes.
Examples
# (1) private sector data#data(ausNLHYCapAdeq)data(ausNLHYFinPerf)data(ausNLHYFinPos)data(ausNLHYLiability)data(ausNLHYOffProf)data(ausNLHYOpIncExp)data(ausNLHYPremClaim)data(ausNLHYPrivInsur)data(ausNLHYPubInsur)data(ausNLHYRecAASB)data(ausNLHYReserve)
ausNSW Australian Statistics - New South Wales in 2004
Description
General statistics of Australian drivers in New South Wales in 2004.
Usage
data(ausNSWdriver04)data(ausNSWdeath02)
Format
ausNSWdriver04 is 2-element list containing the following dataframes.
ausNSWdriver04$injury consists of all drivers involved in a crash in 2004 in New South Wales,Australia. There are a total of 82659 drivers in the data set. Drivers with unknown age, age lessthan 17 years, or road user class “Other" are omitted, leaving 76341 cases. ausNSWdriver04$injurycontains the driver age, the gender, the vehicle class, the crash degree, and the observed num-ber of crashes.
ausNSWdriver04$alcohol consists of drivers involved in a crash in 2004 in New South Wales,Australia, in which the involvement of blood alcohol concentration (BAC) was known. Driverswith unknown age, age less than 17 years, or unknown BAC are omitted, leaving 58890 cases.ausNSWdriver04$alcohol contains the driver age, the gender, the blood alcohol concentra-tion, the crash degree, and the observed number of crashes.
ausNSWdeath02 is 2-element list containing the following dataframes.
ausprivauto 17
ausNSWdeath02$allcause contains all-cause mortality data for New South Wales, Australia in2002, by age band and gender.
ausNSWdeath02$diabete contains the number of deaths due to diabetes in New South Wales,Australia in 2002, provided by the Australian Institute of Health and Welfare, from their mor-tality database.
Source
DeJongHellerBook
References
P. De Jong and G.Z. Heller (2008), Generalized linear models for insurance data, Cambridge Uni-versity Press.
Examples
# (1) data#data(ausNSWdriver04)data(ausNSWdeath02)
ausprivauto Automobile claim datasets in Australia
Description
Third party insurance is a compulsory insurance for vehicle owners in Australia. It insures vehicleowners against injury caused to other drivers, passengers or pedestrians, as a result of an accident.
The ausprivauto0405 dataset is based on one-year vehicle insurance policies taken out in 2004 or2005. There are 67856 policies, of which 4624 had at least one claim.
The ausMTPL8486 dataset records the number of third party claims in a twelve-month period be-tween 1984 and 1986 in each of 176 geographical areas (local government areas) in New SouthWales, Australia.
The ausprivautolong is a simulated dataset containing counts of claims for 40 000 policies, forthree periods (years). The simulation is based on a true non-life portfolio. The risk factors aredriver’s age and vehicle value. Each policy is regarded as a cluster, and hence there are 3 x 40 000= 120 000 records.
Usage
data(ausprivautolong)data(ausMTPL8486)data(ausprivauto0405)
18 ausprivauto
Format
ausprivauto0405 is a data frame of 9 columns and 67,856 rows:
Exposure The number of policy years.
VehValue The vehicle value in thousand of AUD.
VehAge The vehicle age group.
VehBody The vehicle body group.
Gender The gender of the policyholder.
DrivAge The age of the policyholder.
ClaimOcc Indicates occurence of a claim.
ClaimNb The number of claims.
ClaimAmount The sum of claim payments.
ausMTPL8486 is a data frame of 7 columns and 176 rows:
LocalGov The local government area.
StatDiv The vehicle value in thousand of AUD.
ClaimNb The number of third-party claims.
AccNb The number of accidents.
KillInjNb The number of killed or injured.
Pop The population size.
PopDens The population density.
ausprivauto0405 is a data frame of 6 columns and 120,000 rows:
IDpol The policy identification number.
DrivAge The age of the policyholder.
VehValue The vehicle value in thousand of AUD.
Periode The period number.
ClaimNb The number of claims.
ClaimOcc Indicates occurence of a claim.
Source
DeJongHellerBook
References
P. De Jong and G.Z. Heller (2008), Generalized linear models for insurance data, Cambridge Uni-versity Press.
austriLoB 19
Examples
# (1) load of data#data(ausprivautolong)data(ausMTPL8486)data(ausprivauto0405)
austriLoB Australian private motor triangles
Description
Dataset austri1autoBI7895 contains claim triangles from an Australian non-life insurer between1978 and 1995 for bodily injuries. austri1autoBI7895 is a list of 5 elements : a triangle of paidamounts, a triangle of incurred amounts, a traingle of notified claim number, a vector of exposure(in number of vehicle) and a vector of claim inflation indices. This corresponds respectively toTables 3.3 (incr) and 3.2 (cumul); Table 3.12 (cumul); Tables 2.2 (incr) and 2.6 (cumul); Table B.1;Table B.2 of Taylor (2000). Note that claim amounts of austri1autoBI7895 are incremental.
Dataset austri2auto contains claim triangles from an Australian non-life insurer in run-off. Notethat claim amounts are incremental.
Usage
#1st Line of Businessdata(austri1autoBI7895)
#2nd Line of Businessdata(austri2auto)
Format
austri1autoBI7895$paid, austri1autoBI7895$incur, austri1autoBI7895$nb contain the in-surance triangle, respectively for paid, incurred claims and claim number. austri1autoBI7895$expocontains the vector of exposure, austri1autoBI7895$infl contains the vector of inflation indexes.
austri2auto contains the run-off insurance triangle.
Source
DeJongHellerBook
20 austriLoB
References
G. Taylor (2000), Loss reserving: an actuarial perspective, Springer Science + Business Media.
P. De Jong and G.Z. Heller (2008), Generalized linear models for insurance data, Cambridge Uni-versity Press.
Examples
# (1) load of data#
#1st Line of Businessdata(austri1autoBI7895)
#2nd Line of Businessdata(austri2auto)
# (2) graph#i <- 2matplot(cbind(cumsum(austri1autoBI7895$paid[i,]), cumsum(austri1autoBI7895$incur[i,])),type="l", ylab="Claim Amount (orig. USD)", xlab="Development Year",main="Incurred vs. paid claim")
#claim number per 100 000 vehiclesfexpo <- 100000 / austri1autoBI7895$expo[rownames(austri1autoBI7895$nb)]round(austri1autoBI7895$nb * fexpo, 1) #Table 2.1 of Taylor (2000)matplot(apply(austri1autoBI7895$nb * fexpo, 1, cumsum), type="l",main="number of claim notified per 100,000 veh", ylab="Cumulative number",xlab="Development Year")
#paid claim inflatedfclaim <- austri1autoBI7895$infl["1995", "EndYear"] / austri1autoBI7895$infl[, "EndYear"]
g <- function(x, n) c(tail(x, -n), rep(NA, n))infl <- cbind(fclaim, sapply(1:17, function(n) g(fclaim, n)))
matplot(apply(austri1autoBI7895$paid * infl, 1, cumsum), type="l", ylab="Claim Amount (1995 AUD)",xlab="Development Year", main="Paid claim", col=1:10)
legend("bottomright", leg=rownames(austri1autoBI7895$paid), lty=1:5, col=1:10, cex=.5)
#incurred claim inflatedmatplot(apply(austri1autoBI7895$incur * infl, 1, cumsum), type="l", ylab="Claim Amount (1995 AUD)",
xlab="Development Year", main="Incurred claim", col=1:10)legend("bottomright", leg=rownames(austri1autoBI7895$incur), lty=1:5, col=1:10, cex=.5)
beaonre 21
beaonre AON Re Belgian dataset
Description
The dataset was collected by the reinsurance broker AON Re Belgium and comprise 1,823 firelosses for which the building type and the sum insured are available.
Usage
data(beaonre)
Format
beaonre contains three columns and 1823 rows:
BuildType The building type either A, B, C, D, E or F.
ClaimCost The loss amount in thousand of Danish Krone (DKK).
SumInsured The sum insured in thousand of Danish Krone (DKK).
Source
http://lstat.kuleuven.be/Wiley/
References
Dataset used in Beirlant, Dierckx, Goegebeur and Matthys (1999), Tail index estimation and anexponential regression model, Extremes 2, 177-200.
Examples
# (1) load of data#data(beaonre)
# (2) plot and description of data#
boxplot(ClaimCost ~ BuildType, data=beaonre, log="y",xlab="Building type", ylab="Claim size", main="AON Re Belgium data")
22 besecura
besecura Secura Re Belgian dataset
Description
The dataset was collected by the reinsurer Secura Re Belgium and comprises of 371 automobileclaims from 1988 until 2001. The original claim numbers were corrected, among others, for infla-tion to reflect 2002 euros.
Usage
data(besecura)
Format
besecura contains two columns and 371 rows:
Year The year of claim occurence.
Loss The loss amount in euros (EUR).
Source
http://lstat.kuleuven.be/Wiley/
References
Dataset used in Beirlant, Dierckx, Goegebeur and Matthys (2004) Statistics of Extremes, Wiley.
Examples
# (1) load of data#data(besecura)
# (2) plot and description of data#
plot(Loss ~ Year, data= besecura, log="y", xlab="Year",ylab="Claim size", main="Secura Re Belgian dataset")
bragg 23
bragg Descriptive statistics of aggregate claims and premiums for the 41Brazilian regions
Description
The datasets braggclaim and braggprem are descriptive statistics of the premium/claim per regionand type of insurance coverage. Therefore, for each region, there are five rows, one for each type ofinsurance coverage, i.e. 405 row in total.
Usage
data(braggclaim)data(braggprem)
Format
braggprem contains 7 columns:
RegionNb A numeric for the region number.RegionName A character for the region nameGuarantee A character string for the guarantee.ExpoAvg A numeric for the average of total exposures.PremAvg A numeric for the average of gross written premium.SumInsAvg A numeric for the average of sum insured.StateAb A character string for the abbreviated state name.
braggclaim contains 6 columns:
RegionNb A numeric for the region number.RegionName A character for the region nameGuarantee A character string for the guarantee.ClaimNb A numeric for the claim number.AggClaim A numeric for the aggregate claim amount.StateAb A character string for the abbreviated state name.
Source
The original dataset was provided in Chapter 5 of Charpentier (2014).
References
Charpentier, A. (2014). Computational Actuarial Science with R. CRC Press.
Examples
# (1) load of data#data(braggclaim)data(braggprem)
24 brautocoll
brautocoll Brazilian Automobile Collision Claims
Description
Dataset of car traffic collisions that occurred in February 2011, in Belo Horizonte, a Brazilian city.A record consists of date, day, hour, locations (long, lat) and severity for a given collision.
Usage
data(brautocoll)
Format
brautocoll contains 5 columns:
Date The date of the traffic collision, see Date.
Day A character string for the weekday.
Hour Hour on the format hh:mm.
Lat Latitude of the location.
Long Longitude of the location.
Type A character string for the claim type.
Severity A character string for the severity.
Source
The original dataset was provided in Chapter 5 of Charpentier (2014).
References
Charpentier, A. (2014). Computational Actuarial Science with R. CRC Press.
Examples
# (1) load of data#data(brautocoll)dim(brautocoll)
brgeomunic 25
brgeomunic Brazilian geospatial dataset for municipalities
Description
brgeomunic is a spatial database containing geospatial information of Brazilian municipalities pro-vided by IBGE, the Brazilian governmental agency in charge of geographical issues and officialstatistics (ibge.gov.br, accessed in February, 2013). brgeomunic is a geospatial dataframe of classsp based on three files: one containing the geographical coordinates of the polygons, lines or dots(55mu2500gsd.shp); another with attribute data (55mu2500gsd.dbf); a third file with the indexthat allows the connection between the .shp and .dbf files(55mu2500gsd.shx). As it is of class sp,brgeomunic can be easily plotted or summarized.
The final database is restricted to the municipalities from only four Brazilian states (Sao Paulo(SP), Santa Catarina (SC), Parana (PR), and Rio Grande do Sul (RS)). These states are located inthe southern region of Brazil and contain almost 70 million inhabitants (around 36 percent of theBrazilian population) and constitute one of the richest regions of the country (approximately 60percent of the Brazilian gross product).
brgeomunicins is also a geospatial dataframe of class sp combining a subset of brgeomunic (1833cities out of 5566) and insurance statistic information. The insurance information comes from onelarge actuarial database provided by SUSEP, the agency responsible for the regulation and supervi-sion of the Brazilian insurance, private pension, annuity, and reinsurance markets. SUSEP releasesbiannually a car insurance database composed of the aggregation of all insurance companies’ infor-mation. Due to confidentiality concerns, there is no individual-level information, the data being ag-gregated into zip code areas. Originally, both SUSEP and IBGE databases did not present a uniqueidentification column that provides a forward merge of the two databases. The joint information isthe name and the state of each municipality.
Insurance information have been selected to compare premiums, claims, and reported damages fortwo specific groups: popular vehicles and luxury vehicles. The basic difference between the groupsis the power of the engine and the materials and finishing quality. Popular cars have a power of1,000 cc (cylinders), whereas luxury cars usually have a power of 2,000 cc or greater. Popular carsare thus affordable to most customers.
The Pop group contains the following selected popular vehicles: Celta 1.0 (Chevrolet), Corsa 1.0(Chevrolet), Prisma 1.0 (Chevrolet), Uno 1.0 (Fiat), Palio 1.0 (Fiat), Gol 1. (Volkswagen), Fox 1.0(Volkswagen), Fiesta 1.0 (Ford), and Ka 1.0 (Ford).
The Lux group contains the following selected luxury vehicles: Vectra (Chevrolet), Omega (Chevro-let), Linea (Fiat), Bravo (Fiat), Passat (Volkswagen), Polo (Volkswagen), Fusion (Ford), Focus(Ford), Corolla (Toyota), Civic (Honda), and Audi.
In summary, brgeomunicins@data is a dataframe with detailed information of region, city code,yearly exposure, premium, and frequency of claims for the following categories: robbery or theft(Rob), partial collision and total loss (Coll), fire (Fire), or others (Other).
In addition to insurance statistics, the final dataframe brgeomunicins@data also includes the mu-nicipality population (CityDens10) based on the 2010 Census, and the 2000 municipality HumanDevelopment Index (HDIcity00). The Human Development Index (HDI) is a summary measureof long-term progress in three basic dimensions of human development: income, education, andhealth. The HDI provides a counterpoint to another widely used indicator, the Gross DomesticProduct (GDP) per capita, which only considers economic dimensions. Both CityDens10 andHDIcity00 columns were generated from the IBGE site (ibge.gov.br, accessed February 2013).
26 brgeomunic
Usage
data(brgeomunic)data(brgeomunicins)
Format
brgeomunic@data contains 1 column:
CityCode A character string for the severity.
brgeomunicins@data contains 18 columns:
CityCode A character string for the severity.
State, StateAb Character string ("factor") for the full state name and the two-letter abbreviatedstate name.
City A character string ("factor") for the cityname.
PopExpo, LuxExpo The sum of exposure periods for policies in the Pop and the Lux groups, inyears.
PopPrem, LuxPrem Gross written premium for the Pop and the Lux groups, respectively.
PopClaimRob, LuxClaimRob Aggregate robbery claim number for the Pop and the Lux groups,respectively.
PopClaimColl, LuxClaimColl Aggregate collision claim number for the Pop and the Lux groups,respectively.
PopClaimFire, LuxClaimFire Aggregate fire claim number for the Pop and the Lux groups, re-spectively.
PopClaimOther, LuxClaimOther Aggregate other claim number for the Pop and the Lux groups,respectively.
HDIcity00 A numeric for the HDI index of the city.
CityDens10 A numeric for the population density.
Source
The original dataset was provided in Chapter 5 of Charpentier (2014).
References
Charpentier, A. (2014). Computational Actuarial Science with R. CRC Press.
See Also
See the sp class.
Examples
# (1) load of data#data(brgeomunicins)str(brgeomunicins@data)
## Not run:
brvehins 27
# (2) plot of data#cols <- rev(gray(seq(0.1, 0.9, length = 5)))
spplot(brgeomunicins, "HDIcity00", col.regions = cols, cuts = length(cols) - 1)spplot(brgeomunicins, "PopClaimFire", col.regions = cols, cuts = length(cols) - 1)spplot(brgeomunicins, "PopClaimColl", col.regions = cols, cuts = length(cols) - 1)spplot(brgeomunicins, "PopClaimRob", col.regions = cols, cuts = length(cols) - 1)
## End(Not run)
brvehins Two Brazilian datasets for vehicle insurance
Description
brvehins1’s , brvehins2’s are dataframes containing policy data based on the AUTOSEG (anacronym for Statistical System for Automobiles) and can be accessed online (www2.susep.gov.br/menuestatistica/Autoseg, accessed February 2013). Each record includes risk features,claim amount and claim history for year 2011. The dataset brvehins1 of 1,965,355 vehicle in-surance policies has been splitted (randomly) in five datasets of 393,071 policies : brvehins1a,brvehins1b, brvehins1c, brvehins1d, brvehins1e. The dataset brvehins2 of 2,667,752 poli-cies has also been splitted (randomly) in four datasets of 666,938 policies : brvehins2a, brvehins2b,brvehins2c, brvehins2d.
Usage
data(brvehins1a)data(brvehins1b)data(brvehins1c)data(brvehins1d)data(brvehins1e)
data(brvehins2a)data(brvehins2b)data(brvehins2c)data(brvehins2d)
Format
brvehins1’s contains 23 columns:
Gender A character string ("factor") for the gender (also indicate corporate policies).
DrivAge A character string ("factor") for the driver age group.
VehYear A numeric for the vehicle year.
FullVehCode A character string ("factor") for the full vehicle code.
VehCode A character string ("factor") for the vehicle group.
Area Local area name ("factor").
28 brvehins
State A character string for the state name ("factor").
StateAb Abbreviated state name ("factor").
ExposTotal Total exposure
ExposFireRob Exposure for fire and robbery guarantees.
PremTotal Total premium.
PremFireRob Premium for fire and robbery guarantees.
SumInsAvg Average of sum insured.
ClaimNbRob,ClaimNbPartColl,ClaimNbTotColl,ClaimNbFire,ClaimNbOther Number of claimsduring the exposure period, respectively for robbery, partial collision, total collision, fire andother guarantees.
ClaimAmountRob,ClaimAmountPartColl,ClaimAmountTotColl,ClaimAmountFire,ClaimAmountOtherClaim amounts during the exposure period, respectively for robbery, partial collision, totalcollision, fire and other guarantees.
brvehins2’s contains 18 columns:
VehYear A numeric for the vehicle year.
FullVehCode A character string ("factor") for the full vehicle code.
VehCode A character string ("factor") for the vehicle group.
City A character string ("factor") for the city name.
CityCode A numeric for the city code.
Area Local area name ("factor").
State A character string ("factor") for the state name.
StateAb Abbreviated state name ("factor").
ExposTotal Total exposure
PremTotal Total premium.
ClaimNbRob,ClaimNbColl,ClaimNbFire,ClaimNbOther Number of claims during the expo-sure period, respectively for robbery, (partial and total) collision, fire and other guarantees.
ClaimAmountRob,ClaimAmountColl,ClaimAmountFire,ClaimAmountOther Claim amountsduring the exposure period, respectively for robbery, (partial and total) collision, fire and otherguarantees.
Source
www2.susep.gov.br/menuestatistica/Autoseg
Examples
## Not run:
# (1) load of data#data(brvehins1a)dim(brvehins1a)sapply(brvehins1a, class)str(brvehins1a)
data(brvehins2a)

canlifins 29
dim(brvehins2a)sapply(brvehins2a, class)str(brvehins2a)
## End(Not run)
canlifins Canadian life insurance
Description
This dataset contains information of 14,889 contracts in force with a large Canadian insurer over theperiod December 29, 1988 through December 31, 1993. These contracts are joint and last-survivorannuities that were in the payout status over the observation period. For each contract, we have thedate of birth, date of death (if applicable) and sex of each annuitant.
Usage
data(canlifins)
Format
data is a data frame of 5 columns and 14,889 rows:
EntryAgeM Entry age of the male.
EntryAgeF Entry age of the female.
DeathTimeM Time of death of the male (zero if not applicable).
DeathTimeF Time of death of the female (zero if not applicable).
AnnuityExpiredM The date that the annuity guarantee expired (if applicable).
Originally in Frees et al. (1995), the dataset contains 22 contracts where both annuitants are male,36 contracts where both annuitants are female, in addition to 14,889 contracts where one annuitantis male and the other female (so a total of 14,947 contracts).
Source
Unknown private insurer.
References
Dataset used in Frees, Carriere and Valdez (1995), Annuity valuation with dependent mortality,Actuarial Research Clearing House 1995, Vol. 2.
30 CASdatasets
Examples
# (1) load of data#data(canlifins)dim(canlifins)
# (2) Table 1 of Frees et al. (1995)#
table(Age=cut(canlifins$EntryAgeM, c(0, 60, 70, 80, 120)),Status=cut(canlifins$DeathTimeM, c(-1, 0, 10)))table(Age=cut(canlifins$EntryAgeF, c(0, 60, 70, 80, 120)),Status=cut(canlifins$DeathTimeF, c(-1, 0, 10)))
CASdatasets CASdatasets package
Description
Actuarial Datasets (originally for the ’Computational Actuarial Science with R’ book)
Details
This package contains the following datasets
• Australia:
– auscathist: Historical disaster statistics in Australia.– ausNLHYtotal, ausNLHYCapAdeq, ausNLHYFinPerf, ausNLHYFinPos, ausNLHYLiability,ausNLHYOffProf, ausNLHYOpIncExp, ausNLHYPremClaim, ausNLHYPrivInsur, ausNLHYPubInsur,ausNLHYRecAASB, ausNLHYReserve: Australian Market - non-life insurance (aggregatelevel).
– ausNLHYCapAdeqByComp, ausNLHYClaimByState, ausNLHYFinPerfByComp, ausNLHYFinPerfPublic,ausNLHYFinPosByComp, ausNLHYFinPosPublic, ausNLHYOpIncExpPublic, ausNLHYPremByState,ausNLHYPremClaimPublic, ausNLHYPrivInsur, ausNLHYPubInsur: Australian Market- non-life insurance (company, state, public level).
– ausNLHYLloydAsset, ausNLHYLloydGPI ausNLHYLloydUWAcc, ausNLHYLloydUWRes: LloydsMarket in Australia.
– austriLoB: Australian claim triangles.– ausprivauto: Australian private motor datasets (by policy).– ausNSW: New South Wales statistics.
• Belgium:
– beaonre: AON Re Belgium dataset.– besecura: Secura Re Belgium dataset.
• Brazil:
CASdatasets 31
– brgeomunic: a geospatial dataset of Brazilian cities.– brgeomunicins: a geospatial dataset of Brazilian cities with insurance indicators (expo-
sure, claim frequency and premium).– brautocoll: a Brazilian dataset of auto collision in Belo Horizonte during one month
(categorical claim severity).– bragg: aggregate Brazilian dataset per region.– brvehins1: a Brazilian vehicle insurance datasets (by policy) with risk features except
City.– brvehins2: a Brazilian vehicle insurance datasets (by policy) with risk features including
City.
• Canada:
– canlifins: A portfolio of a Canadian life insurer.
• Danemark:
– danishuni, danishmulti: Danish reinsurance claim dataset.
• European Union:
– eudirectlapse: lapse dataset.
• France:
– freaggnumber: a French aggregate claim number dataset.– frebiloss: French business interruption losses.– freclaimset, freclaimset2: French claim settlements.– frecomfire: French commercial fire losses.– freDisTables: French disability tables.– fremarine: French marine claim dataset (by policy).– freMortTables: French mortality tables.– fremotorclaim: French private motor claim datasets (by policy).– freMTPL: two French Motor-TPL claim datasets (by policy).– freMPL: a collection of ten French Motor personal line datasets (by policy).– freportfolio: fictive mortality tables and French nation-wide corresponding tables; two
disability datasets from a French insurer.– fre4LoBtriangles: A collection of triangles for 4 line of business from a private insurer.– pricingame: Datesets of Pricing Games of the French institute of Actuaries.
• Germany:
– credit: A German Credit dataset.
• Italy:
– itamtplcost: Large losses of an Italian Motor-TPL company.
• New Zealand:
– nzcathist: Historical disaster statistics in New Zealand.
• Norway:
– norauto: Norwegian automobile dataset.– norfire: Norwegian fire dataset.– Norberg: Norberg’s credibility dataset.– nortritpl8800: Norwegian claim triangle.
• Singapore:
– sgautonb: Singapore Automobile claim count dataset.
32 CASdatasets
– sgtriangles: Singapore Property and Casualty triangles.• Sweden:
– swautoins: Swedish Motor Insurance dataset– swbusscase: Swedish Buss Insurance dataset– swmotorcycle: Swedish Motorcycle Insurance dataset
• United Kingdom:– ukaggclaim: United Kingdom Car Insurance Claims.– ukautocoll: United Kingdom Car Collision Insurance Claims.
• United States of America:– Davis: Davis height-weight dataset.– ICB1, ICB2: Insurance Company Benchmarks.– lossalae,lossalaefull: General Third Part-liability claims and expenses.– SOAGMI: SOA Group Medical Insurance dataset.– usautoBI: Automobile Bodily Injuries in US.– usautotriangles: US automobile triangles.– usexpense: US expense dataset.– usGLtriangles: US Property and Casualty triangles.– ushurricane, ushustormloss4980: Historical hurricane statistics in United States of
America.– uslapseagent: US lapse dataset from tied-agent channel.– usmassBI: US Massachusetts Automobile bodily injury claim datasets.– usmedclaim: US medical claim triangle.– usprivautoclaim: private automobile claims.– usquakeLR: California earthquake loss ratios.– ustermlife: Term life insurance survey.– uswarrantaggnum: US warranty automobile.– usworkcomp: US workers compensation datasets.
• Misc.:– eqlist: Earthquake list.– hurricanehist: Hurricane history.– PnCdemand: Property and Casualty demand.– spacedata: Space dataset.– ECBYieldCurve, FedYieldCurveYield curve for eurozone and US.– forexUSUKForeign exchange rate between USD and GBP.– Use the HMD website for mortality database http://www.mortality.org/.
Here is a list of datasets whose name has changed compared to the book ’Computational ActuarialScience with R’:’
Chapter 1: extreme2datasince1899 is hurricanehist.Chapter 5: accidents and accidents_data are merged in brautocoll; 55mu2500gsd is brgeomunic;
sul_sp, sul+sp_shape are stored in brgeomunicins;Chapter 9: MyPortfolio is freprojqxINSEE.Chapter 10: DataMortality is freptfpermdis.Chapter 11: DEXUSUK is forexUSUK.Chapter 14: CONTRACTS is freMTPLfreq; CLAIMS is freMTPLsev.Chapter 15: AutoClaimData is usmassBI2.
credit 33
Author(s)
Christophe Dutang
credit German Credit dataset
Description
This dataset contains information of 1,000 credit records. It is a consumer credit files, called theGerman Credit dataset in Tuff’ery (2011) and Nisbet et al. (2011). New applicants for credit andloans can be evaluated as good or bad payers using 21 explanatory variables.
Usage
data(credit)
Format
credit is a data frame of 21 columns and 1,000 rows:
checking_status Status of existing checking account, A11: less than 0, A12: from 0 to 200, A13:more than 200, and A14: no running account (or unknown).
duration credit duration in months.
credit_history credit history: A30: delay in paying off in the past, A31: critical account, A32: nocredits taken or all credits paid back duly, A33: existing credits paid back duly till now, A34:all credits at this bank paid back duly.
purpose purpose of credit: A40: new car, A41: used car, A42: items of furniture/equipment, A43:radio/television, A44: domestic household appliances, A45: repairs, A46: education, A47: va-cation, A48: retraining, A49: business, A410: others.
credit_amount credit amount in Deutsch marks.
savings saving account: A61: less than 100, A62: from 100 to 500, A63: from 500 to 1,000, A64:more than 1,000, A65: no savings account (or unknown).
employment Present employment since: A71: unemployed, A72: less than 1 year, A73: from 1 to 4years, A74: from 4 to 7 years, A75: more than 7 years.
installment_rate Installment rate (in percentage of disposable income) A81: greater than 35,A82: between 25 and 35, A83: between 20 and 25, A84: less than 20.
personal_status Personal status and sex: A91: male: divorced/separated, A92: female: di-vorced/separated/married, A93: male: single, A94: male: married/widowed, A95: female:single.
other_parties Other debtors or guarantors: A101: none, A102: co-applicant, A103: guarantor.
residence_since Present residence since: A71: less than 1 year, A73: from 1 to 4 years, A74:from 4 to 7 years, A75: more than 7 years.
property_magnitude Property (most valuable): A121: real estate (ownership of house or land),A122: savings contract with a building society / Life insurance, A123: car or other, A124:unknown / no property.
age Age (in years).
34 credit
other_payment_plans Other installment plans: A141: at other bank, A142: at department store ormail order house, A143: no further running credits.
housing Housing: A151: rented flat, A152: owner-occupied flat, A153: free apartment.
existing_credits Number of existing credits at this bank (including the running one) A161: one,A162: two or three, A163: four or five, A164: six or more.
job Job: A171: unemployed / unskilled with no permanent residence, A172: unskilled with perma-nent residence, A173: skilled worker / skilled employee / minor civil servant, A174: executive/ self-employed / higher civil servant.
num_dependents Number of people being liable to provide maintenance for A181: zero to two,A182: three and more.
telephone Telephone: A191: none, A192: yes, registered under the customers name.
foreign_worker Foreign worker: A201: yes, A202: no.
class binary variable 0 stands for good and 1 bad (or credit-worthy against not credit-worthy, orno non-payments against existing non-payments).
Source
The original data was provided by:
Professor Dr. Hans Hofmann, Institut fuer Statistik und Oekonometrie,
Universitaet Hamburg, FB Wirtschaftswissenschaften, Von-Melle-Park 5, 2000 Hamburg 13
Professor Dr. Hans Hofmann, Institut fur Statistik und Oekonometrie,
Universitaet Hamburg, FB Wirtschaftswissenschaften, Von-Melle-Park 5, 2000 Hamburg 13
The dataset has been taken from the UCI Repository Of Machine Learning Databases at
http://archive.ics.uci.edu/ml/datasets/Statlog+(German+Credit+Data)
It is also available at
http://www.stat.uni-muenchen.de/service/datenarchiv/kredit/kreditvar_e.html
References
Fahrmeir, L. and Tutz, G. (1994), Multivariate Statistical Modelling Based on Generalized LinearModels, Springer.
Nisbet, R., Elder, J. and Miner, G. (2011), Handbook of Statistical Analysis and Data MiningApplications, Academic Press.
Tuff’ery, S. (2011), Data Mining and Statistics for Decision Making, Wiley.
See Also
For a good variable description, see also http://www.stat.uni-muenchen.de/service/datenarchiv/kredit/kreditvar_e.html and http://archive.ics.uci.edu/ml/datasets/Statlog+(German+Credit+Data).
Examples
# (1) load of data#data(credit)dim(credit)
danish 35
head(credit)
danish Danish reinsurance claim dataset
Description
The univariate dataset was collected at Copenhagen Reinsurance and comprise 2167 fire lossesover the period 1980 to 1990. They have been adjusted for inflation to reflect 1985 values and areexpressed in millions of Danish Krone.
The multivariate dataset is the same data as above but the total claim has been divided into a buildingloss, a loss of contents and a loss of profits.
Usage
data(danishuni)data(danishmulti)
Format
danishuni contains two columns:
Date The day of claim occurence.
Loss The total loss amount in millions of Danish Krone (DKK).
danishmulti contains five columns:
Date The day of claim occurence.
Building The loss amount (mDKK) of the building coverage.
Contents The loss amount (mDKK) of the contents coverage.
Profits The loss amount (mDKK) of the profit coverage.
Total The total loss amount (mDKK).
All columns are numeric except Date columns of class Date.
Source
Embrechts, P., Kluppelberg, C. and Mikosch, T. (1997) Modelling Extremal Events for Insuranceand Finance. Berlin: Springer.
References
Dataset used in McNeil, A. (1996), Estimating the Tails of Loss Severity Distributions using ExtremeValue Theory, ASTIN Bull; and Davison, A. C. (2003) Statistical Models. Cambridge UniversityPress. Page 278.
36 Davis
Examples
# (1) load of data#data(danishuni)
# (2) plot and description of data#plot(danishuni$Loss)
# (3) load of data#data(danishmulti)
# (4) plot and description of data#idx <- sample(1:NROW(danishmulti), 10)barplot(danishmulti$Building[idx], col="grey25",
ylim=c(0, max(danishmulti$Total[idx])), main="Some claims of danish dataset")barplot(danishmulti$Content[idx], add=TRUE, col="grey50", axes=FALSE)barplot(danishmulti$Profits[idx], add=TRUE, col="grey75", axes=FALSE)legend("topleft", legend=c("Building", "Content", "Profits"), fill=c("grey25",
"grey50", "grey75"))
Davis Davis dataset
Description
This dataset contains information of 200 individuals.
Usage
data(Davis)
Format
data is a data frame of 5 columns and 200 rows:
sex a factor: M for male and F for female.
weight a numeric for the weight in Kg.
height a numeric for the height in cm.
reportedWeight a numeric for the weight in Kg.
reportedHeight a numeric for the height in cm.
Source
http://socserv.socsci.mcmaster.ca/jfox/Books/Applied-Regression-2E/datasets/Davis.txt
ECBYieldCurve 37
References
Davis (1990) Body image and weight preoccupation: A comparison between exercising and non-exercising women, Appetite, 15, 13-21.
Examples
# (1) load of data#data(Davis)dim(Davis)head(Davis)
ECBYieldCurve Yield curve data spot rate, AAA-rated bonds, maturities from 3 monthsto 30 years
Description
Government bond, nominal, all triple A issuer companies. The maturities are 3 and 6 months andfrom 1 year to 30 years with frequency business day, provided by European Central Bank. Therange date is from 2006-12-29 to 2009-07-24.
Usage
data(ECBYieldCurve)
Format
It is an xts object with 32 interest rate at different matuirties and 655 obeservations.
Source
ECB: http://www.ecb.europa.eu/stats/money/yc/html/index.en.html.
eqlist Earthquake list
Description
This dataset contains a list of all earthquakes of magnitude greater than 6 between 1900 and 2014.
Usage
data(eqlist)
38 eqlist
Format
eqlist is a data frame of 16 columns and 1,698 rows:
time A factor for the time.
latitude A numeric for the latitude.
longitude A numeric for the longitude.
depth A numeric for the depth.
mag A numeric for the magnitude.
magType A factor for the magnitude type.
nst An integer for nst.
gap A numeric for the gap.
dmin A numeric for dmin.
rms A numeric for rms.
net A factor for the network.
id A factor for the identification number.
updated A factor for the last update.
place A factor for the place.
type A factor for the type.
day A date for the day.
Source
Earthquake worldwide archive : https://earthquake.usgs.gov/earthquakes/search/.
References
Young, J.B., Presgrave, B.W., Aichele, H., Wiens, D.A. and Flinn, E.A. (1996), The Flinn-EngdahlRegionalisation Scheme: the 1995 revision, Physics of the Earth and Planetary Interiors, v. 96, p.223-297.
Flinn, E.A., Engdahl, E.R. and Hill, A.R. (1974), Seismic and geographical regionalization, Bul-letin of the Seismological Society of America, vol. 64, p. 771-993.
Flinn, E.A., and Engdahl, E.R. (1965), A proposed basis for geographical and seismic regionaliza-tion, Reviews of Geophysics, vol. 3, p. 123-149.
See Also
Northern California earthquake archive : http://quake.geo.berkeley.edu/ncedc/catalog-search.html
Examples
# (1) load of data#data(eqlist)dim(eqlist)
plot(eqlist$day[eqlist$mag > 6.5], eqlist$mag[eqlist$mag > 6.5], pch=".",xlab="Year", ylab="Magnitude", main="Earthquake above 6.5 mag (worldwide)")
eudirectlapse 39
eudirectlapse European lapse dataset from the direct channel
Description
The eudirectlapse dataset is based on one-year vehicle insurance renewal quotes for an unknownyear and an unknown insurer. There are 23,060 policies.
Usage
data(eudirectlapse)
Format
eudirectlapse is a data frame of 19 columns and 23,060 rows:
lapse A binary variable indicating the lapse of the customer.
polholder_age The age of the policyholder.
polholder_BMCevol The evolution of bonus/malus coefficient (BMC) of the policyholder: 3 cat-egorical values ("down" when bonus increases, "stable" when coefficient does not change,"up" when malus increases.
polholder_diffdriver The difference status between the policyholder and the driver.
polholder_gender The gender of the policyholder.
polholder_job The job of the policyholder: either "medical" or "normal".
policy_age The age of the policy.
policy_caruse The car usage.
policy_nbcontract The number of policies given policyholder for this insurer.
prem_final The final renewal premium value proposed to policyholder.
prem_freqperyear The premium frequency per year.
prem_last The premium paid by the policyholder for the last insurance coverage.
prem_market A proxy of the market premium.
prem_pure The technical premium value.
vehicl_age The vehicle age.
vehicl_agepurchase The vehicle age at purchase.
vehicl_garage The garage type (categorical values).
vehicl_powerkw The horsepower of the car (categorical values).
vehicl_region The living region of policyholder (unknown category).
Source
Unknown non-life insurers from European Union.

40 forexUSUK
Examples
# (1) load of data#data(eudirectlapse)head(eudirectlapse)
FedYieldCurve Federal Reserve interest rates
Description
The data-set contains the interest rates of the Federal Reserve, from January 1982 to December2012. The interest rates are Market yield on U.S. Treasury securities constant maturity (CMT)(more information on the Treasury yield curve can be found at the following website http://www.treasury.gov/resource-center/data-chart-center/interest-rates/Pages/yieldmethod.aspx) at different maturities (3 months, 6 months, 1 year, 2 years, 3 years, 5 years, 7 years and 10years), quoted on investment basis and have been gathered with monthly frequency.
Usage
data(FedYieldCurve)
Format
An object with class attributes xts.
Source
FED: http://www.federalreserve.gov/datadownload/Build.aspx?rel=H15.
forexUSUK Foreign exchange rate between USD and GBP
Description
The dataset is the daily buying rates in New York City for cable transfers payable in foreign curren-cies from January 4, 1971 to March 1, 2013. The data can be downloaded from the FRED website.Access to this website was done on March 6, 2012.
Usage
data(forexUSUK)
fre4LoBtriangles 41
Format
forexUSUK is a data frame of 2 columns and 10,583 rows:
Date Date.
Value The index value.
Source
FRED, Federal Reserve Economic Data, Federal Reserve Bank of St. Louis: U.S. - U.K. ForeignExchange Rate (DEXUSUK): http://research.stlouisfed.org/fred2/series/DEXUSUK.
References
Bollerslev (1987). Regression Modeling with Actuarial and Financial Applications, CambridgeUniversity Press.
Examples
# (1) load of data#data(forexUSUK)dim(forexUSUK)head(forexUSUK)
# (2) plot of data#
forexUSUK <- forexUSUK[forexUSUK$Date >= "2012-01-01", ]plot(forexUSUK$Date, forexUSUK$Value, main = "US/UK FX Rate",xlab = "Year", ylab = "Index", type = "l")
fre4LoBtriangles French private motor triangles
Description
Datasets fretri1--, fretri2-- and fretri3-- contain claim triangles from a French non-lifeinsurer between 1996 and 2005. Datasets fretri4auto9403 contain claim triangles from a Frenchnon-life insurer between 1994 and 2003. Note that the accident year 1994 corresponds to the sumof years before 1994 (included).
For each dataset, the variable fretri--- is a list of 3 elements for the damage guarantee, the bodyguarantee and the total. Each element is also a list of two elements with paid claims and incurredclaim amounts. Note that claim amounts are cumulated.
42 freaggnumber
Usage
#1st Line of Businessdata(fretri1auto9605)
#2nd Line of Businessdata(fretri2auto9605)
#3rd Line of Businessdata(fretri3auto9605)
#4th Line of Businessdata(fretri4auto9403)
Format
fretriXautoYYZZ contains the insurance triangle for Xth line of business from year YY to year ZZ.
Source
Unknown private insurer
Examples
# (1) load of data#
#1st Line of Businessdata(fretri1auto9605)
#2nd Line of Businessdata(fretri2auto9605)
#3rd Line of Businessdata(fretri3auto9605)
#4th Line of Businessdata(fretri4auto9403)
freaggnumber French aggregate claim numbers
Description
The dataset consists of 12513 classes for which we have the driver age, the age of driving licence,the vehicule age, the exposure and the claim number.
frebiloss 43
Usage
data(freaggnumber)
Format
danishuni contains 5 columns:
DriverAge The driver age.
LicenceAge The age at which the driver gets its driving licence.
VehAge The vehicule age.
Exposure The exposure (in policy-year).
ClaimNumber The claim number for that group.
Examples
# (1) load of data#data(freaggnumber)dim(freaggnumber)
# (2) ecdf plot#summary(freaggnumber$ClaimNumber / freaggnumber$Exposure)
frebiloss French business interruption losses
Description
The univariate dataset was collected at FFSA and comprise 2387 business interruption losses overthe period 1985 to 2000 (for losses above 100,000 French Francs).
Usage
data(frebiloss)
Format
danishuni contains 8 columns:
Year The year of claim occurence.
OccurDate The day of claim occurence.
PolicyID The policy identification number.
ClaimID The claim identification number.
ClaimCost Original claim cost in French Francs (FFR).
TotalCost Original total cost (claim+expense) in French Francs.
ClaimCost2007 Normed claim cost in thousand of 2007 euros (EUR).
TotalCost2007 Normed total cost in thousand of 2007 euros (EUR).
44 freclaimset
Source
FFSA
References
Dataset used in Zajdenweber (1996). Extreme values in business interruption insurance, Journal ofRisk and Insurance, 1, 95-110.
Examples
# (1) load of data#data(frebiloss)dim(frebiloss)
# (2) ecdf plot#plot(ecdf(frebiloss$ClaimCost2007), log="x", xlim=c(10^1, 10^5))
boxplot(ClaimCost2007~Year, data=frebiloss, log="y")
freclaimset French claim settlements
Description
The dataset consists of 2306 claims settlements between 1996 and 2006.
Usage
data(freclaimset)
Format
freclaimset contains 6 columns:
PaymentDate The payment date.
Payment The amount of money paid.
FbFprov The file-by-file provision.
Risk The risk category.
Subrisk The sub-category.
Type The risk type.
Source
Unknown private insurer
freclaimset2 45
Examples
# (1) load of data#data(freclaimset)dim(freclaimset)
freclaimset2 French individual claim settlements
Description
The dataset consists of claims settlements of the damage guarantee of a French insurer for motorinsurance between 1995 and 2014. 1,012,839 records for 735,079 claims are listed in the dataset inconjunction with some aggregated data (exposure, GWP, claim number) per occurence year.
freclaimset3fire9207 and freclaimset3dam9207 consist of randomized claims settlements ofthe fire/damage guarantee of a French insurer for corporate insurance between 1992 and 2007.58,056 claims are listed in the dataset for which both paid and incurred (F/F) amounts (EUR) areavailable.
Usage
data(freclaimset2motor)data(freclaimset3fire9905)data(freclaimset3dam9207)
Format
freclaimset2motor is a list of two components. freclaimset2motor$claimset contains 8 columns:
ClaimID The identification number of the claim, first four characters are the occurence year.
OccurYear The occurence year.
ManagYear The management year.
ClaimStatus A character string for the claim status.
PaidAmount The cumulative paid amount for the claim (euro).
RecourseAmount The cumulative paid recourse for the claim (euro).
ExpectCharge The expected amount for the claim (euro).
ExpectRecourse The expected recourse for the claim (euro).
freclaimset2motor$claimset contains 4 columns:
Year The management year.
Exposure The sum of insurance years of the portfolio.
GWP The gross written premium (in euro).
ClaimNb The Claim Number.
freclaimset3fire9207 and freclaimset3dam9207 are data frames with 37 columns:
NbEmployee The category of employee number.
46 frecomfire
NbSite The category of site number.
Surface The insured surface.
RiskCateg An unknown risk category.
inc_Y15-inc_Y0 inc_Yj is the incurred amount of the claim at the end of year 2007-j, i.e. inc_Y0is the latest estimate and inc_Y15 is the oldest estimate.
paid_Y15-paid_Y0 paid_Yj is the paid amount of the claim at the end of year 2007-j, i.e. paid_Y0is the latest estimate and paid_Y15 is the oldest estimate.
OccurDate The occurence date. Note that paid_Yj/inc_Yj is never empty (i.e. NA) even if theclaim did occur after the year 2007-j.
Source
Unknown private insurers
Examples
# (1) load of data#data(freclaimset2motor)dim(freclaimset2motor)data(freclaimset3fire9207)data(freclaimset3dam9207)
# (2) consistency check (should be the same)#
somerow <- freclaimset2motor$claimset$OccurYear == freclaimset2motor$claimset$ManagYear
cbind(freclaimset2motor$aggdata$ClaimNb,table(freclaimset2motor$claimset[somerow, "OccurYear"]))
# (3) some examples of claims#
subset(freclaimset2motor$claimset, ClaimID == "1995-000127")
subset(freclaimset2motor$claimset, ClaimID == "1996-008979")
head(freclaimset3fire9207)tail(freclaimset3fire9207)
frecomfire French commercial fire losses
Description
The univariate dataset was collected at FFSA and comprise 9613 commercial fire losses over theperiod 1982 to 1996.
freDisTables 47
Usage
data(frecomfire)
Format
frecomfire contains 4 columns:
Year The year of claim occurence.
OccurDate The day of claim occurence.
ClaimCost Original claim cost in French Francs (FFR).
ClaimCost2007 Normed claim cost in thousand of 2007 euros (EUR).
Source
FFSA
Examples
# (1) load of data#data(frecomfire)dim(frecomfire)
freDisTables French Disability Tables and Probabilities
Description
Naming convention: X2Y stands for going from state X to state Y, where possible states are T (tem-porary disability), P (permanent disability), D (death). For instance, T2T stands for temporary totemporary disability.
Tables freP2Pdis10, freT2Tdis10 and freT2Pdis10 have been established by the French mutual(BCAC) under a mission mandated by the French association of insurance companies (FFSA) andimposed by the new retirement reglementation after an agreement of professional federations. Thesetables have been build in 1993 and extended to the age 62 in 2010 by the December 24 act in 2010,cf. JO (2010).
These tables have been entirely rebuilt in 2013 by BCAC: the new imposed tables are TablesfreP2Pdis13, freT2Tdis13 and freT2Pdis13, see Bagui (2013).
freP2Pdis10/freP2Pdis13 contain the continuation table of permanent disability (so-called inva-lidity in France) based on a 10,000-person reference population for all age between 20 and 61 (resp.between 20 and 64). freT2Tdis10/freT2Tdis13 contain the continuation table of temporary dis-ability (so-called incapacity in France) based on a 10,000-person reference population for all agebetween 20 and 66. (resp. between 21 and 65). freT2Pdis10/freT2Pdis13 contain the transitiontable (from temporary to permanent disability) based on a 10,000-person reference population forall age between 20 and 61 (resp. between 21 and 62). Note that in France temporary disability is
48 freDisTables
limited to 36 months (irrespective of the entry age) and permanent disability age is capped at theage of retirement 62 for 2010 tables (resp. 65 for 2013 tables).
freT2Pdisprob10/freT2Pdisprob13, freT2Tdisprob10/freT2Tdisprob13, freP2Pdisprob10/freP2Pdisprob13are the corresponding probabilities deduced from the tables, respectively to go from temporary topermanent disability, to stay temporarily disabled and to stay permanently disabled, given the entryage and the number of month or years already disabled.
Tables freT2Ddis10, freP2Ddis10 have been established by the French mutual (BCAC) under amission mandated by the French association of insurance companies (FFSA) and imposed by thenew retirement reglementation after an agreement of professional federations.
The freP2Ddis10 contains the mortality table of permanent disability (so-called invalidity in France)based on a 10,000-person reference population for all age between 25 and 64. The freT2Ddis10contains the mortality table of temporary disability (so-called incapacity in France) based on a10,000-person reference population for all age between 25 and 65.
freP2Ddisprob10, freT2Ddisprob10 are the corresponding probabilities deduced from the tables,respectively to die from temporary disability, to die from permanent disability, given the entry ageand the number of month or years already disabled.
Usage
data(freP2Pdis10)data(freT2Tdis10)data(freT2Pdis10)
data(freP2Pdisprob10)data(freT2Tdisprob10)data(freT2Pdisprob10)
data(freT2Ddis10)data(freP2Ddis10)
data(freT2Ddisprob10)data(freP2Ddisprob10)
data(freP2Pdis13)data(freT2Tdis13)data(freT2Pdis13)
data(freP2Pdisprob13)data(freT2Tdisprob13)data(freT2Pdisprob13)
Format
freP2Pdis10/freP2Pdis13 contains 44 (resp. 47) columns:
EntryAge The entry age in permanent disability.
NbYrSpent0,...,NbYrSpent42/NbYrSpent45 The number of people (among 10,000) who spent acertain number of years (0 to 42/45) in permanent disability.
freP2Pdisprob10/freP2Pdisprob13 contains the probabilities to stay permanently disabled giventhe number of years spent in such a state.
freDisTables 49
freT2Tdis10/freT2Tdis13 contains 38 columns:
EntryAge The entry age in permanent disability.
NbMthSpent0...NbMthSpent36 The number of people (among 10,000) who spent a certain numberof months (0 to 36) in temporary disability.
freT2Tdisprob10/freT2Tdisprob13 contains in 36 columns from NbMthSpent0 to NbMthSpent35the probabilities to stay temporarily disabled given the number of months spent in such a state.
freT2Pdis10/freT2Pdis13 contains 37 columns:
EntryAge The entry age in permanent disability.
NbMthSpent0...NbMthSpent35 Transition probably from temporary to permanent disability after acertain number of months (0 to 35) spent in temporary disability.
freT2Pdisprob10/freT2Pdisprob13 contains in 36 columns from NbMthSpent0 to NbMthSpent35the probabilities to become permanently disabled given the number of months spent in temporarydisability.
freT2Ddis10 contains 37 columns:
EntryAge The entry age in permanent disability.
NbMthSpent0...NbMthSpent35 The number of people (among 10,000) who spent a certain numberof months (0 to 35) in temporary disability.
freT2Ddisprob10 contains in 36 columns the probabilities to die given the number of months spentin temporary disability.
freP2Ddis10 contains 37 columns:
EntryAge The entry age in permanent disability.
NbYrSpent0...NbYrSpent35 The number of people (among 10,000) who spent a certain number ofyears (0 to 35) in permanent disability.
freP2Ddisprob10 contains in 36 columns the probabilities to die given the number of years spentin permanent disability.
Source
RessourcesActuarielles
References
(all ref. in French)
Bagui (2013), Refonte des loi de maintien en incapacite temporaire de travail, ISFA actuary mem-oir.
JO (2010), Arrete du 24 decembre 2010 fixant les regles de provisionnement des garanties d’incapacitede travail, d’invalidite et de deces, Journal Officiel, Texte 55 sur 138, 30 decembre 2010.
FFSA (2005), Demande de donnees relatives aux populations d’assures, Document de travailFFSA.
Planchet (2005), Tables de mortalite d’experience pour des portefeuilles de rentiers, Note method-ologique de l’Institut des Actuaires.
Planchet (2006), Construction des tables de mortalite d’experience pour les portefeuilles de rentiers- presentation de la methode de construction, Note methodologique de l’Institut des Actuaires.
50 fredpt17
Serant (2005), Construction de tables prospectives de mortalite, Document interne FFSA (confi-dential).
Tassin (2006), Note qualitative sur les tables prospectives IA 2006 masculines et feminines, Docu-ment interne de l’Institut des Actuaires.
Examples
# (1) load of data#data(freP2Pdis10)data(freT2Tdis10)data(freT2Pdis10)
data(freP2Pdisprob10)data(freT2Tdisprob10)data(freT2Pdisprob10)
data(freT2Ddis10)data(freP2Ddis10)
data(freT2Ddisprob10)data(freP2Ddisprob10)
data(freP2Pdis13)data(freT2Tdis13)data(freT2Pdis13)
data(freP2Pdisprob13)data(freT2Tdisprob13)data(freT2Pdisprob13)
fredpt17 French geospatial dataset for departments
Description
fredpt17 is a spatial database containing geospatial information of French departments to be usedwith pricing actuarial games’ files, see pricingame. fredpt17 is a geospatial dataframe of class spbased on six files: DEPARTMENTS.cpg, DEPARTMENTS.dbf, DEPARTMENTS.prj, DEPARTMENTS.qpj,DEPARTMENTS.shp, DEPARTMENTS.shx. As it is of class sp, fredpt17 can be easily plotted orsummarized.
Usage
data(fredpt17)
Format
fredpt17@data contains 1 column:
DEPT A factor for the department number.
fremarine 51
Source
See https://actinfo.hypotheses.org/86 for the third pricing game.
See Also
See the sp class.
Examples
# (1) load of data#data(fredpt17)
names(fredpt17)class(fredpt17)length(fredpt17)summary(fredpt17)dim(fredpt17)
## Not run:# (2) plot of data#
plot(fredpt17)
spplot(fredpt17)
## End(Not run)
fremarine Some French marine losses
Description
The univariate dataset was collected by a French private insurer and comprise 1,274 marine lossesbetween the January 2003 and June 2006. The status of the claim (settled or opened) is determinedat the end of June 2006.
Usage
data(fremarine)
Format
fremarine contains 20 columns:
OccurDate The day of claim occurence.
52 freMortTables
ReporDate The day of claim reporting.
ShipCateg The category of the insured ship (factor).
ShipBrand The brand of the insured ship (factor) (resampled).
ShipPower The power of the insured ship (factor).
ShipEngNb The engine number of the insured ship (factor).
ShipEngYear The engine year of the insured ship (factor) (resampled).
ShipBuildYear The building year of the insured ship (factor) (resampled).
ShipHull The hull of the insured ship (factor) (resampled).
ShipLength The length of the insured ship (factor).
ShipTonnage The tonnage of the insured ship (factor).
InsuredValue The insured value of the insured ship (factor).
ClaimPaid The paid amount (EUR) of the claim (numeric) (rescaled and noisy).
ClaimCharge The charge amount (EUR) of the claim (numeric) (rescaled and noisy).
ClaimRecourse The recourse amount (EUR) of the claim (numeric) (rescaled and noisy).
ClaimStatus The status of the claim (factor) (resampled).
ClaimCateg The category of the claim (unknown factor) (resampled).
Deductible The deductible value (numeric) (rescaled and noisy).
HeadQuarter The city name of the ship headquarter (factor) (resampled).
Departement The corresponding French departement of the cityname (factor).
Source
Unknown private insurer
Examples
# (1) load of data#data(fremarine)dim(fremarine)
freMortTables French Mortality Tables
Description
The frePM6064 (resp. frePF6064) table has been established on INSEE observations collectedbetween 1960 and 1964 in the French male population (resp. the French female population).
The freTD7377 (resp. freTV7377) table has been established on INSEE observations collectedbetween 1973 and 1977 in the French male population (resp. the French female population). Thetable was officially approved by the August 22 act in 1986 and applies to life insurance.
freMortTables 53
The freTD8890 (resp. freTV8890) table has been established on INSEE observations collectedbetween 1988 and 1990 in the French male population (resp. the French female population). Thetable was officially approved by the April 27 act in 1993 and applies to life insurance.
The freTPRV93 table is exctracted from the floor table for pricing life annuities. The table was offi-cially approved by the July 28 act in 1993 and is based on the prospective table tracking mortalitiesfor generations between 1887 and 1993 (full table for generation 1950), JO (1993).
The freTH0002 (resp. freTF0002) table has been established on INSEE observations collected inthe French male population (resp. the French female population). The table was officially approvedby the December 20 act in 2005 and applies to life insurance other than life annuities in conjuctionwith the table of age shifts freAS0002, JO (2005, 2006a, 2006b, 2006c).
The freTGH05 (resp. freTGF05) table has been established based on 19 portfolios (16 from FFSAand 3 from CTIP) in the French male population (resp. the French female population) between1993 and 2005. The underlying prospective INSEE table has been built on the basis of mortalitytables between 1962 and 2000. The table was officially approved by the August 1 act in 2006. ThefreTPG93full table has been built for comparison with TGH05 and TGF05.
Usage
data(frePM6064)data(frePF6064)
data(freTD7377)data(freTV7377)
data(freTD8890)data(freTV8890)
data(freTPRV93)data(freTPG93full)
data(freTF0002)data(freTH0002)data(freAS0002)
data(freTGH05)data(freTGF05)
Format
frePM6064, frePF6064, freTD7377, freTV7377, freTD8890, freTV8890, freTPRV93, freTF0002and freTH0002 contain 2 columns:
x The age x.
lx The number of people still alive at x among the initial 100,000 referenced people.
freAS0002 contains 6 columns:
LowerAgeF, LowerAgeH The lower bound of the age class.
UpperAgeF, UpperAgeH The upper bound of the age class.
ShiftF, ShiftH The value to shift.
freTGH05 and freTGF05 contain 107 columns:
54 freMortTables
x The age x.
lx1900, ..., lx2005 The number of people still alive at x among the referenced people in year 1900(etc.. 2005).
freTPG93full contains 95 columns:
x The age.
lx1900, ..., lx1993 The number of people still alive at x among the referenced people in year 1900(etc.. 1993).
Source
INSEE, JO, RessourcesActuarielles
References
FFSA (2005), Demande de donnees relatives aux populations d’assures, Document de travailFFSA.
IA (2006), Notice d’utilisation des tables de mortalite TH0002 and TF0002, Note methodologiquede l’Institut des Actuaires.
JO (1986), Arrete du 8 aout 1986, Journal Officiel num 174, Texte 30, 22 aout 1986.
JO (1993), Arrete du 28 juillet 1993, Journal Officiel num 174, Texte 30, 30 juillet 1993.
JO (2005), Arrete du 20 decembre 2005, Journal Officiel num 302, Texte 40, 29 decembre 2005.
JO (2006a), Arrete du 1 aout 2006, Journal Officiel num 197, Texte 11, 26 aout 2006.
JO (2006b), Arrete du 8 decembre 2006, Journal Officiel num 302, Texte 93, 30 decembre 2006.
JO (2006c), Arrete du 21 decembre 2006, Journal Officiel num 9, Texte 31, 11 janvier 2007.
Planchet (2005), Tables de mortalite d’experience pour des portefeuilles de rentiers, Note method-ologique de l’Institut des Actuaires.
Planchet (2006), Construction des tables de mortalite d’experience pour les portefeuilles de rentiers- presentation de la methode de construction, Note methodologique de l’Institut des Actuaires.
Serant (2005), Construction de tables prospectives de mortalite, Document interne FFSA (confi-dentiel).
Tassin (2006), Note qualitative sur les tables prospectives IA 2006 masculines et feminines, Docu-ment interne de l’Institut des Actuaires.
Examples
# (1) load of data#data(frePM6064)data(frePF6064)
data(freTD7377)data(freTV7377)
data(freTD8890)head(freTD8890)
data(freTV8890)head(freTV8890)

fremotorclaim 55
data(freTPRV93)head(freTPRV93)
data(freTF0002)head(freTF0002)
data(freTH0002)head(freTH0002)
data(freAS0002)head(freAS0002)
data(freTGH05)head(freTGH05)
data(freTGF05)head(freTGF05)
data(freTPG93full)head(freTPG93full)
fremotorclaim French claims for private motor
Description
Datasets fremotor1freq0304a/b/c, fremotor1sev0304a/b/c, fremotor1prem0304a/b/c are ninedatasets from the same database of an unknown private motor portfolio observed between January2003 and December 2004, respectively claim frequency databases, claim severity databases andpremium databases. The last letter a, b or c distinguishes the random sampling for a given datasetseries. Note that some records are common between resampling versions.
Datasets fremotor1freq0304a/b/c consist of 64,234 records with explanatory variables for poli-cies (possibly with mutiple vehicles insured under the same policy number). Datasets fremotor1prem0304a/b/cconsist of 51,949 records of claim numbers (by policy) in 2003 and 2004. Datasets fremotor1sev0304a/b/cconsist of 9,246 records of ClaimAmount, their occurence date, the corresponding guarantee, in2003 and 2004.
Datasets fremotor2sev9907, fremotor3sev9907, fremotor4sev9907, and fremotor2freq9907u,fremotor3freq9907u, fremotor4freq9907u, fremotor2freq9907b, fremotor3freq9907b, fremotor4freq9907bare claim severities and claim frequencies coming from the same database for a private motor portfo-lio observed between 1999 and 2007. For size reason, the database has been splitted into three partsfremotor2***9907, fremotor3***9907, fremotor4***9907. Furthermore, the claim frequenciesare available on two different formats : longitudinal unbalanced data and longitudinal balanceddata, respectively fremotor2freq9907u and fremotor2freq9907b. The policy number is onlyavailable for claim frequencies: it is impossible to match claim severities and claim frequencies.
Usage
data(fremotor1prem0304a)data(fremotor1prem0304b)data(fremotor1prem0304c)
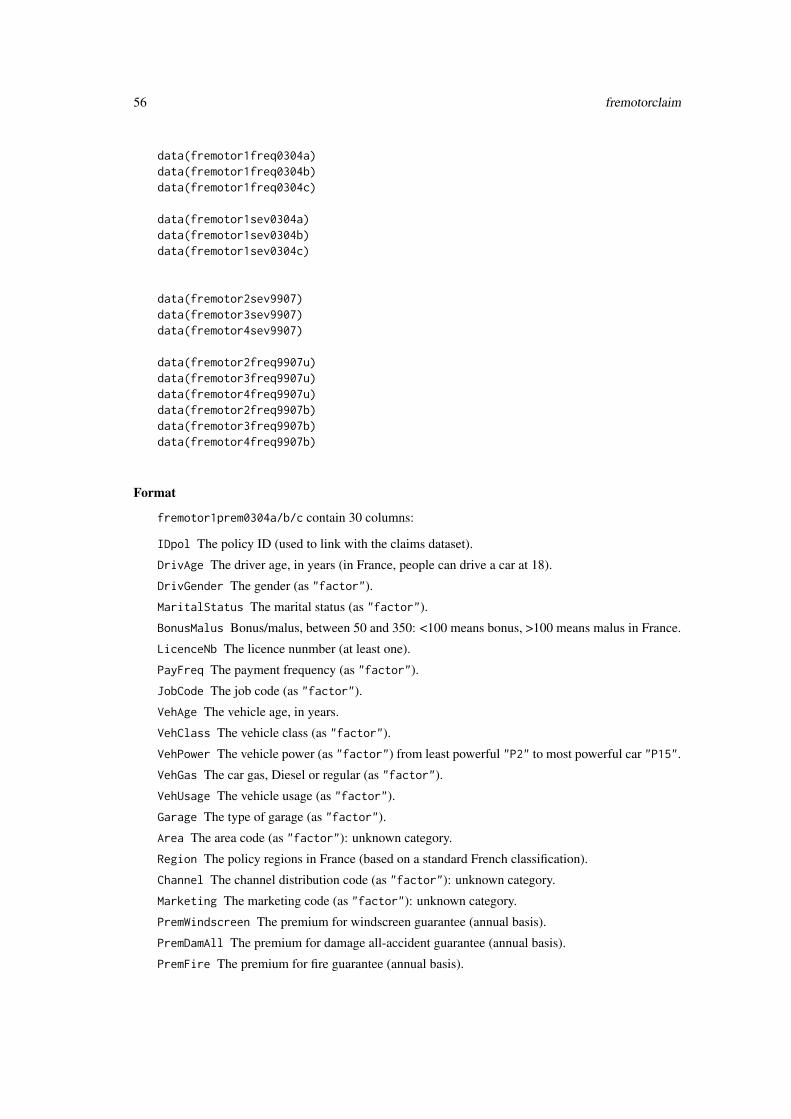
56 fremotorclaim
data(fremotor1freq0304a)data(fremotor1freq0304b)data(fremotor1freq0304c)
data(fremotor1sev0304a)data(fremotor1sev0304b)data(fremotor1sev0304c)
data(fremotor2sev9907)data(fremotor3sev9907)data(fremotor4sev9907)
data(fremotor2freq9907u)data(fremotor3freq9907u)data(fremotor4freq9907u)data(fremotor2freq9907b)data(fremotor3freq9907b)data(fremotor4freq9907b)
Format
fremotor1prem0304a/b/c contain 30 columns:
IDpol The policy ID (used to link with the claims dataset).
DrivAge The driver age, in years (in France, people can drive a car at 18).
DrivGender The gender (as "factor").
MaritalStatus The marital status (as "factor").
BonusMalus Bonus/malus, between 50 and 350: <100 means bonus, >100 means malus in France.
LicenceNb The licence nunmber (at least one).
PayFreq The payment frequency (as "factor").
JobCode The job code (as "factor").
VehAge The vehicle age, in years.
VehClass The vehicle class (as "factor").
VehPower The vehicle power (as "factor") from least powerful "P2" to most powerful car "P15".
VehGas The car gas, Diesel or regular (as "factor").
VehUsage The vehicle usage (as "factor").
Garage The type of garage (as "factor").
Area The area code (as "factor"): unknown category.
Region The policy regions in France (based on a standard French classification).
Channel The channel distribution code (as "factor"): unknown category.
Marketing The marketing code (as "factor"): unknown category.
PremWindscreen The premium for windscreen guarantee (annual basis).
PremDamAll The premium for damage all-accident guarantee (annual basis).
PremFire The premium for fire guarantee (annual basis).
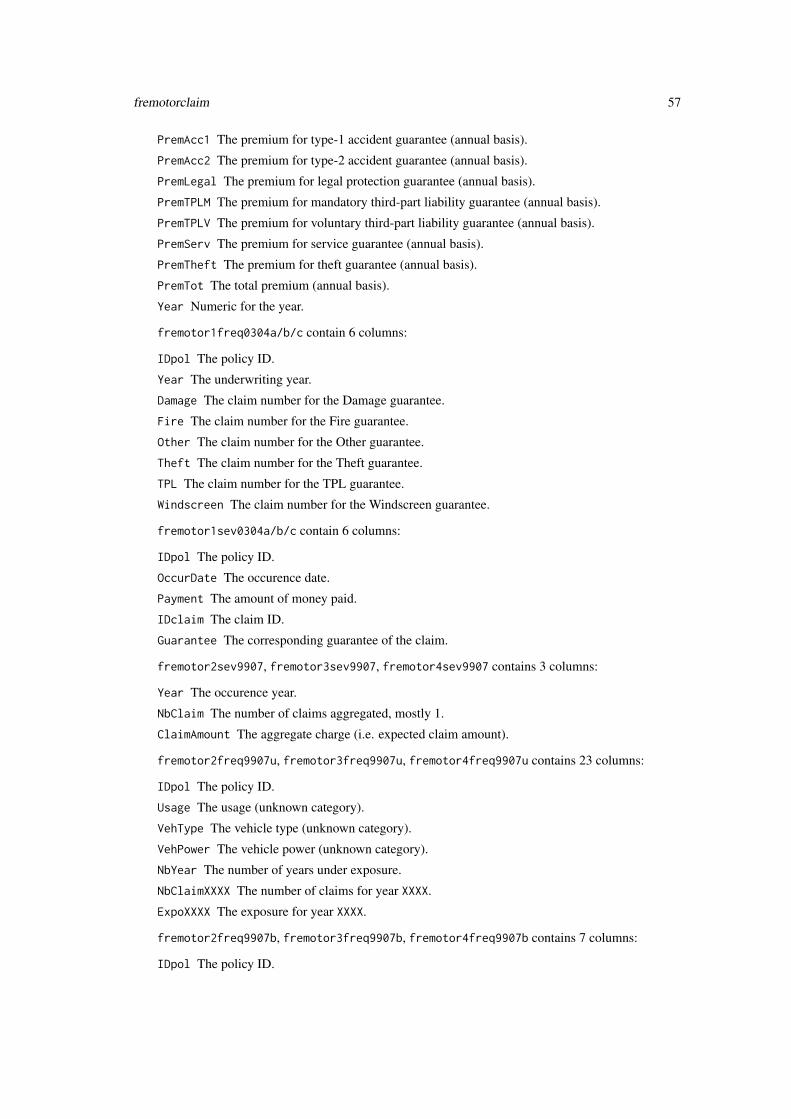
fremotorclaim 57
PremAcc1 The premium for type-1 accident guarantee (annual basis).
PremAcc2 The premium for type-2 accident guarantee (annual basis).
PremLegal The premium for legal protection guarantee (annual basis).
PremTPLM The premium for mandatory third-part liability guarantee (annual basis).
PremTPLV The premium for voluntary third-part liability guarantee (annual basis).
PremServ The premium for service guarantee (annual basis).
PremTheft The premium for theft guarantee (annual basis).
PremTot The total premium (annual basis).
Year Numeric for the year.
fremotor1freq0304a/b/c contain 6 columns:
IDpol The policy ID.
Year The underwriting year.
Damage The claim number for the Damage guarantee.
Fire The claim number for the Fire guarantee.
Other The claim number for the Other guarantee.
Theft The claim number for the Theft guarantee.
TPL The claim number for the TPL guarantee.
Windscreen The claim number for the Windscreen guarantee.
fremotor1sev0304a/b/c contain 6 columns:
IDpol The policy ID.
OccurDate The occurence date.
Payment The amount of money paid.
IDclaim The claim ID.
Guarantee The corresponding guarantee of the claim.
fremotor2sev9907, fremotor3sev9907, fremotor4sev9907 contains 3 columns:
Year The occurence year.
NbClaim The number of claims aggregated, mostly 1.
ClaimAmount The aggregate charge (i.e. expected claim amount).
fremotor2freq9907u, fremotor3freq9907u, fremotor4freq9907u contains 23 columns:
IDpol The policy ID.
Usage The usage (unknown category).
VehType The vehicle type (unknown category).
VehPower The vehicle power (unknown category).
NbYear The number of years under exposure.
NbClaimXXXX The number of claims for year XXXX.
ExpoXXXX The exposure for year XXXX.
fremotor2freq9907b, fremotor3freq9907b, fremotor4freq9907b contains 7 columns:
IDpol The policy ID.
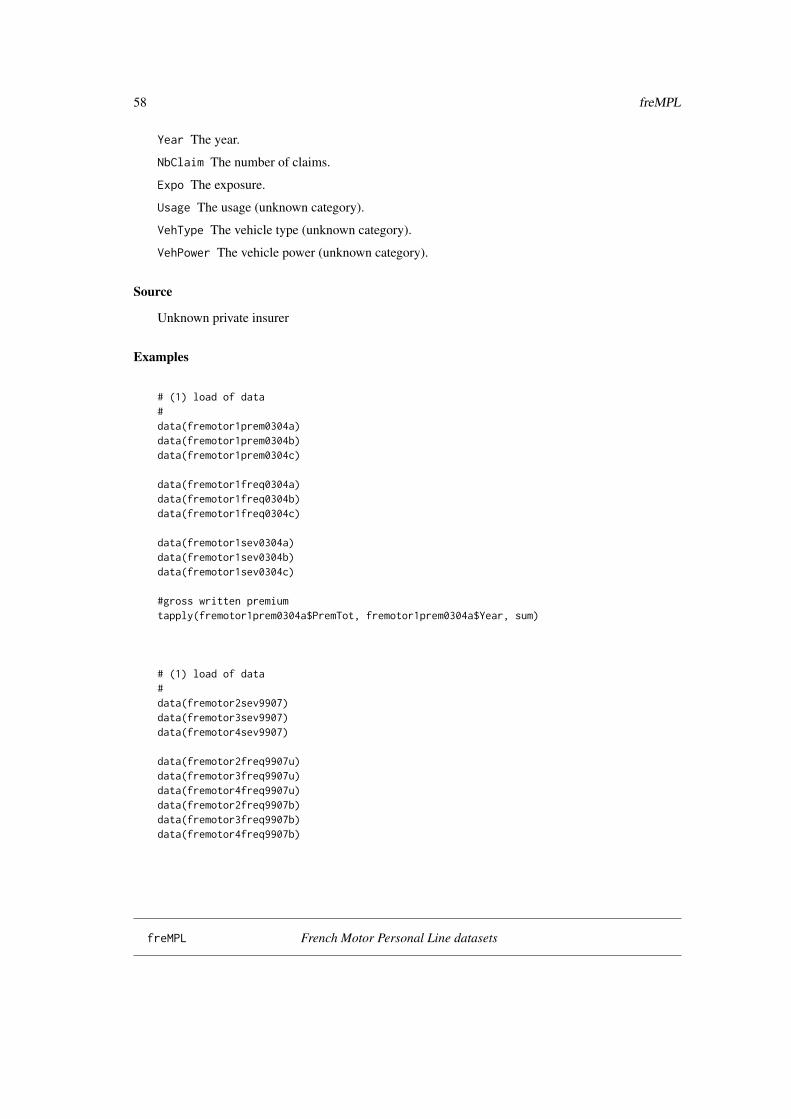
58 freMPL
Year The year.
NbClaim The number of claims.
Expo The exposure.
Usage The usage (unknown category).
VehType The vehicle type (unknown category).
VehPower The vehicle power (unknown category).
Source
Unknown private insurer
Examples
# (1) load of data#data(fremotor1prem0304a)data(fremotor1prem0304b)data(fremotor1prem0304c)
data(fremotor1freq0304a)data(fremotor1freq0304b)data(fremotor1freq0304c)
data(fremotor1sev0304a)data(fremotor1sev0304b)data(fremotor1sev0304c)
#gross written premiumtapply(fremotor1prem0304a$PremTot, fremotor1prem0304a$Year, sum)
# (1) load of data#data(fremotor2sev9907)data(fremotor3sev9907)data(fremotor4sev9907)
data(fremotor2freq9907u)data(fremotor3freq9907u)data(fremotor4freq9907u)data(fremotor2freq9907b)data(fremotor3freq9907b)data(fremotor4freq9907b)
freMPL French Motor Personal Line datasets
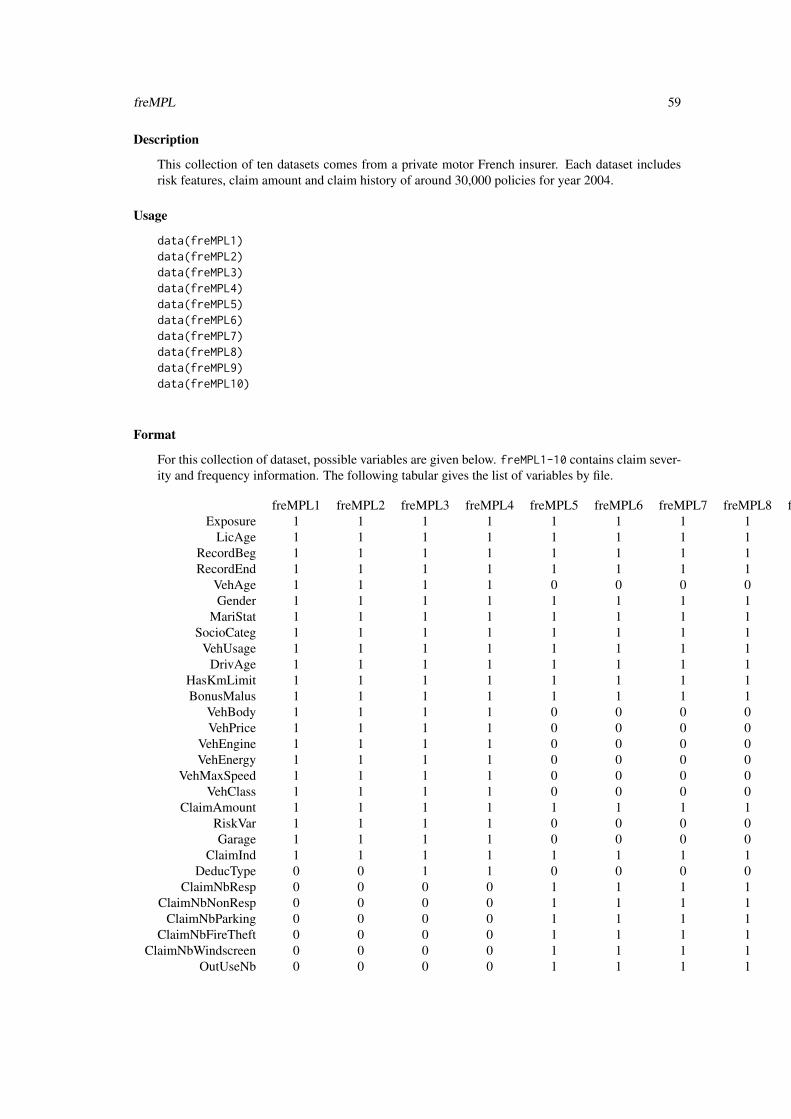
freMPL 59
Description
This collection of ten datasets comes from a private motor French insurer. Each dataset includesrisk features, claim amount and claim history of around 30,000 policies for year 2004.
Usage
data(freMPL1)data(freMPL2)data(freMPL3)data(freMPL4)data(freMPL5)data(freMPL6)data(freMPL7)data(freMPL8)data(freMPL9)data(freMPL10)
Format
For this collection of dataset, possible variables are given below. freMPL1-10 contains claim sever-ity and frequency information. The following tabular gives the list of variables by file.
freMPL1 freMPL2 freMPL3 freMPL4 freMPL5 freMPL6 freMPL7 freMPL8 freMPL9 freMPL10Exposure 1 1 1 1 1 1 1 1 1 1
LicAge 1 1 1 1 1 1 1 1 1 1RecordBeg 1 1 1 1 1 1 1 1 1 1RecordEnd 1 1 1 1 1 1 1 1 1 1
VehAge 1 1 1 1 0 0 0 0 0 1Gender 1 1 1 1 1 1 1 1 1 1
MariStat 1 1 1 1 1 1 1 1 1 1SocioCateg 1 1 1 1 1 1 1 1 1 1
VehUsage 1 1 1 1 1 1 1 1 1 1DrivAge 1 1 1 1 1 1 1 1 1 1
HasKmLimit 1 1 1 1 1 1 1 1 1 1BonusMalus 1 1 1 1 1 1 1 1 1 1
VehBody 1 1 1 1 0 0 0 0 0 0VehPrice 1 1 1 1 0 0 0 0 0 0
VehEngine 1 1 1 1 0 0 0 0 0 0VehEnergy 1 1 1 1 0 0 0 0 0 0
VehMaxSpeed 1 1 1 1 0 0 0 0 0 0VehClass 1 1 1 1 0 0 0 0 0 0
ClaimAmount 1 1 1 1 1 1 1 1 1 1RiskVar 1 1 1 1 0 0 0 0 0 0Garage 1 1 1 1 0 0 0 0 0 0
ClaimInd 1 1 1 1 1 1 1 1 1 1DeducType 0 0 1 1 0 0 0 0 0 0
ClaimNbResp 0 0 0 0 1 1 1 1 1 1ClaimNbNonResp 0 0 0 0 1 1 1 1 1 1
ClaimNbParking 0 0 0 0 1 1 1 1 1 1ClaimNbFireTheft 0 0 0 0 1 1 1 1 1 1
ClaimNbWindscreen 0 0 0 0 1 1 1 1 1 1OutUseNb 0 0 0 0 1 1 1 1 1 1
60 freMPL
RiskArea 0 0 0 0 1 1 1 1 1 1
The comprehensive list of the variables (of all datasets) is given below, yet no dataset contains allthese variables.
VehAge The vehicle age, in years.
DrivAge The driver age, in years (in France, people can drive a car at 18).
LicAge The driving licence age, in months.
Gender The gender, either "Male" or "Female".
MariStat The marital status, either "Alone" or "Other".
SocioCateg The social category known as CSP in France, between "CSP1" and "CSP99".
VehUsage The vehicle usage among "Private", "Private+trip to office" "Professional","Professional run".
Garage The garage, if any, among "Collective garage", "None", "Private garage".
HasKmLimit A numeric, 1 if there is a km limit for the policy, 0 otherwise.
BonusMalus A numeric for the bonus/malus, between 50 and 350: <100 means bonus, >100 meansmalus in France.
RecordBeg Beginning date of record.
RecordEnd End date of record.
Exposure The exposure, in years.
VehClass The vehicle class (unknown categories), among "0", "A", "B", "H", "M1", "M2".
VehBody The vehicle body, among "bus", "cabriolet", "coupe", "microvan", "other microvan","sedan", "sport utility vehicle", "station wagon", "van".
VehEnergy The vehicle energy, among "diesel", "eletric", "GPL", "regular".
VehEngine The vehicle engine, among "carburation", "direct injection overpowered", "electric","GPL", "injection", "injection overpowered".
VehMaxSpeed The VehMaxSpeed, among "1-130 km/h", "130-140 km/h", "140-150 km/h", "150-160km/h", "160-170 km/h", "170-180 km/h", "180-190 km/h", "190-200 km/h", "200-220 km/h","220+ km/h".
RiskVar Unkonw risk variable between 1 and 20, possibly ordered.
DeducType Deductible type, among "Majorized", "Normal", "Partially refunded", "Proportional","Refunded".
RiskArea Unkonw risk area between 1 and 13, possibly ordered.
ClaimNbResp Number of responsible claims in the 4 preceding years.
ClaimNbNonResp Number of non-responsible claims in the 4 preceding years.
ClaimNbParking Number of parking claims in the 4 preceding years.
ClaimNbFireTheft Number of fire-theft claims in the 4 preceding years.
ClaimNbWindscreen Number of windscreen claims in the 4 preceding years.
OutUseNb Number of out-of-use in the 4 preceding years.
ClaimAmount Total claim amount of the guarantee.
ClaimInd Claim indicator of the guarantee. (this is not the claim number)
freMTPL 61
Source
Unknown French private insurer.
See Also
For the vehicle body variable, see https://en.wikipedia.org/wiki/Car_classification
Examples
# (1) load of data#data(freMPL1)data(freMPL2)data(freMPL3)data(freMPL4)data(freMPL5)data(freMPL6)data(freMPL7)data(freMPL8)data(freMPL9)data(freMPL10)
freMTPL French Motor Third-Part Liability datasets
Description
In the two datasets freMTPLfreq, freMTPLsev, risk features are collected for 413,169 motor third-part liability policies (observed mostly on one year). In addition, we have claim numbers by policyas well as the corresponding claim amounts. freMTPLfreq contains the risk features and the claimnumber while freMTPLsev contains the claim amount and the corresponding policy ID.
In the two datasets freMTPL2freq, freMTPL2sev, risk features are collected for 677,991 motorthird-part liability policies (observed mostly on one year). In addition, we have claim numbers bypolicy as well as the corresponding claim amounts. freMTPL2freq contains the risk features andthe claim number while freMTPL2sev contains the claim amount and the corresponding policy ID.
Usage
data(freMTPLfreq)data(freMTPLsev)
data(freMTPL2freq)data(freMTPL2sev)
62 freMTPL
Format
freMTPLfreq contains 10 columns:
PolicyID The policy ID (used to link with the claims dataset).
ClaimNb Number of claims during the exposure period.
Exposure The period of exposure for a policy, in years.
Power The power of the car (ordered categorical).
CarAge The vehicle age, in years.
DriverAge The driver age, in years (in France, people can drive a car at 18).
Brand The car brand divided in the following groups: A- Renaut Nissan and Citroen, B- Volkswa-gen, Audi, Skoda and Seat, C- Opel, General Motors and Ford, D- Fiat, E- Mercedes Chryslerand BMW, F- Japanese (except Nissan) and Korean, G- other.
Gas The car gas, Diesel or regular.
Region The policy region in France (based on the 1970-2015 classification).
Density The density of inhabitants (number of inhabitants per km2) in the city the driver of thecar lives in.
freMTPLsev contains 2 columns:
PolicyID The occurence date (used to link with the contract dataset).
ClaimAmount The cost of the claim, seen as at a recent date.
freMTPL2freq contains 11 columns:
IDpol The policy ID (used to link with the claims dataset).
ClaimNb Number of claims during the exposure period.
Exposure The period of exposure for a policy, in years.
VehPower The power of the car (ordered values).
VehAge The vehicle age, in years.
DrivAge The driver age, in years (in France, people can drive a car at 18).
BonusMalus Bonus/malus, between 50 and 350: <100 means bonus, >100 means malus in France.
VehBrand The car brand (unknown categories).
VehGas The car gas, Diesel or regular.
Area The density value of the city community where the car driver lives in: from "A" for rural areato "F" for urban centre.
Density The density of inhabitants (number of inhabitants per square-kilometer) of the city wherethe car driver lives in.
Region The policy region in France (based on the 1970-2015 classification).
freMTPL2sev contains 2 columns:
IDpol The occurence date (used to link with the contract dataset).
ClaimAmount The cost of the claim, seen as at a recent date.
Source
Unknown private insurer.
freportfolio 63
Examples
# (1) load of data#data(freMTPLfreq)dim(freMTPLfreq)
data(freMTPLsev)dim(freMTPLsev)
# (2) check#should be equalsum(freMTPLsev$PolicyID %in% freMTPLfreq$PolicyID)sum(freMTPLfreq$ClaimNb)
# (1) load of data#data(freMTPL2freq)dim(freMTPL2freq)
data(freMTPL2sev)dim(freMTPL2sev)
freportfolio Portfolio Mortality and Disability Tables
Description
The freprojqxINSEE table has been established on INSEE projection for the period 2007-2060based a median scenario, cf. Blanpain and Chardon (2010), adjusted and selected for the purposeof the book.
The frefictivetable represents a fictive portfolio of 87,090 individuals that enter in a healthycondition and have been observed between 1996-01-01 and 2007-12-31. The exit (that may occurbefore December 2007) is either "deceased" or "other".
The frefictivetable2,frefictivetable3 represents a fictive portfolio of 100,000 individualsthat enter in a healthy condition and have been observed between 1988-12-29 and 1993-12-31. Theexit (that may occur before December 1993) is either "deceased" or "other".
The freptfpermdis and freptftempdis datasets comes from two portfolio of two French pri-vate companies (insurer or institute), respectively for permanent disability insurance and temporarydisability insurance.
Usage
data(freprojqxINSEE)data(frefictivetable)data(frefictivetable2)
64 freportfolio
data(frefictivetable3)data(freptfpermdis)data(freptftempdis)
Format
freprojqxINSEE is a data frame of 109 columns and 66 rows:
Age The age.
F2007,..., F2060 The 1-year female death probabilities
M2007,..., M2060 The 1-year male death probabilities
frefictivetable is a data frame of 6 columns and 87,090 rows:
Id the identification number.
Gender the gender as "factor".
DateOfBirth the date of birth as "Date".
DateIn the entry date as "Date".
DateOut the exit date as "Date".
Status the status at exit : "deceased" (i.e. non-censored observation) or "other" (i.e. censoredobservation) as "factor".
frefictivetable2,frefictivetable3 are data frames of 5 columns and 100,000 rows:
DateIn the entry date as "Date".
DateOut the exit date as "Date".
Status the status at exit : "deceased" (i.e. non-censored observation) or "other" (i.e. censoredobservation) as "factor".
DateOfBirth the date of birth as "Date".
Gender the gender as "factor".
freptfpermdis is a data frame of 6 columns and 1,048,575 rows:
PolicyID the policy identification number.
BirthDate the date of birth.
Gender the sex: M for male and F for female.
EntryDate the entry date.
ExitDate the exit date.
ExitStatus the status at exit: "deceased" (i.e. non-censored observation) or "other" (i.e. cen-sored observation).
freptftempdis is a data frame of 9 columns and 560,725 rows:
Gender the sex: M for male and F for female.
JobType the job category: "employee", "managers,engineers,sales responsibles", "non-manageremployee" "other 1", "other 2", "other 3", "other 4", "other 5", "technician", "unemployedworkers".
UWType the underwriting type: either "specific policy in a collective agreement", "specificpolicy not linked to a collective agreement", "standard policy in a collective agreement"or "standard policy not linked to a collective agreement".
freportfolio 65
JobStopType the reason for disability: "illness", "work accident", "pregnancy" (for womenonly).
Birthdate the date of birth.
OccurDate the date of occurence.
EntryDate the entry date.
ExitDate the exit date.
JobComebackType the status at exit: "recovered" (i.e. non-censored observation: the persongoes back to work), "disabled" (i.e. non-censored observation: the person is permanentlydisabled) or "on-going" (i.e. censored observation).
Source
For freprojqxINSEE, Blanpain and Chardon (2010).
For frefictivetable, Chapter 9 of Computational Actuarial Science with R, Ed. Arthur Charp-entier, Chapman and Hall/CRC The R Series, 2014.
For freptfpermdis, freptftempdis, RessourcesActuarielles
References
Blanpain, N. and Chardon, O. (2010). Projections de populations 2007-2060 pour la Francemetropolitaine: methode et principaux resultats. Serie des Documents de Travail de la directiondes statistiques Demographiques et Sociales F1008, INSEE.
Examples
# (1) load of data#data(freprojqxINSEE)data(frefictivetable)
head(freprojqxINSEE)head(frefictivetable)
## Not run:data(freptfpermdis)data(freptftempdis)
head(freptfpermdis)head(freptftempdis)
## End(Not run)
66 hurricanehist
hurricanehist Hurricane history: Per Storm Maximum Wind Speeds (North Atlantic)
Description
The dataset consists of 2010 observations for all tropical cyclones in the NHC best track recordover the period 1899-2006. Each observation contains per cyclone maximum wind speeds andother relevant information.
Usage
data(hurricanehist)
Format
hurricanehist contains 7 columns:
Year The Year.
Region The region among "Basin", "East Florida", "Gulf", "US".
Windmax The maximum windspeed in knot (1kt = 0.51 m/s).
NAO the North Atlantic Oscillation (NAO) index as an indicator of storm steering.
SOI the Southern Oscillation Index (SOI) as an indicator of El Nino-Southern Oscillation.
SST the Atlantic sea-surface temperature (SST) as an indicator of cyclone energy.
SSTmda the SST mda.
Source
See http://myweb.fsu.edu/jelsner/_site/.
References
Dataset used in Jagger and Elsner (2008), Modelling tropical cyclone intensity with quantile regres-sion, International Journal of Climatology 29, 1351 - 1361.
Examples
# (1) load of data#data(hurricanehist)dim(hurricanehist)
# (2) box plot#boxplot(Windmax ~ Year, data=hurricanehist,ylim=c(35,175), subset=Year > 1939)
ICB 67
ICB Insurance Company Benchmark
Description
This data set used in the CoIL 2000 Challenge contains information on customers of an insurancecompany. The data consists of 86 variables and includes product usage data and socio-demographicdata derived from zip area codes.
The data was collected to answer the following question: Can you predict who would be interestedin buying a caravan insurance policy and give an explanation why?
Usage
data(ICB1)data(ICB2)
Format
ICB1 (resp. ICB2) is a data frame of 86 columns (resp. 85) and 5,822 rows (resp. 4,000). Eachrecord consists of 86 (resp 85) variables, containing sociodemographic data (variables 1-43) andproduct ownership (variables 44-86). The sociodemographic data is derived from zip codes. Allcustomers living in areas with the same zip code have the same sociodemographic attributes. Vari-able 86 (Purchase) indicates whether the customer purchased a caravan insurance policy. As ICB2does not have the 86th column, ICB1 should be used for training purposes and ICB2 for testingpurposes.
Columns are detailed below
MOSTYPE Customer Subtype see L0
MAANTHUI Number of houses 1 - 10
MGEMOMV Avg size household 1 - 6
MGEMLEEF Avg age see L1
MOSHOOFD Customer main type see L2
MGODRK Roman catholic see L3
MGODPR Protestant ...
MGODOV Other religion
MGODGE No religion
MRELGE Married
MRELSA Living together
MRELOV Other relation
MFALLEEN Singles
MFGEKIND Household without children
MFWEKIND Household with children
MOPLHOOG High level education
MOPLMIDD Medium level education
MOPLLAAG Lower level education
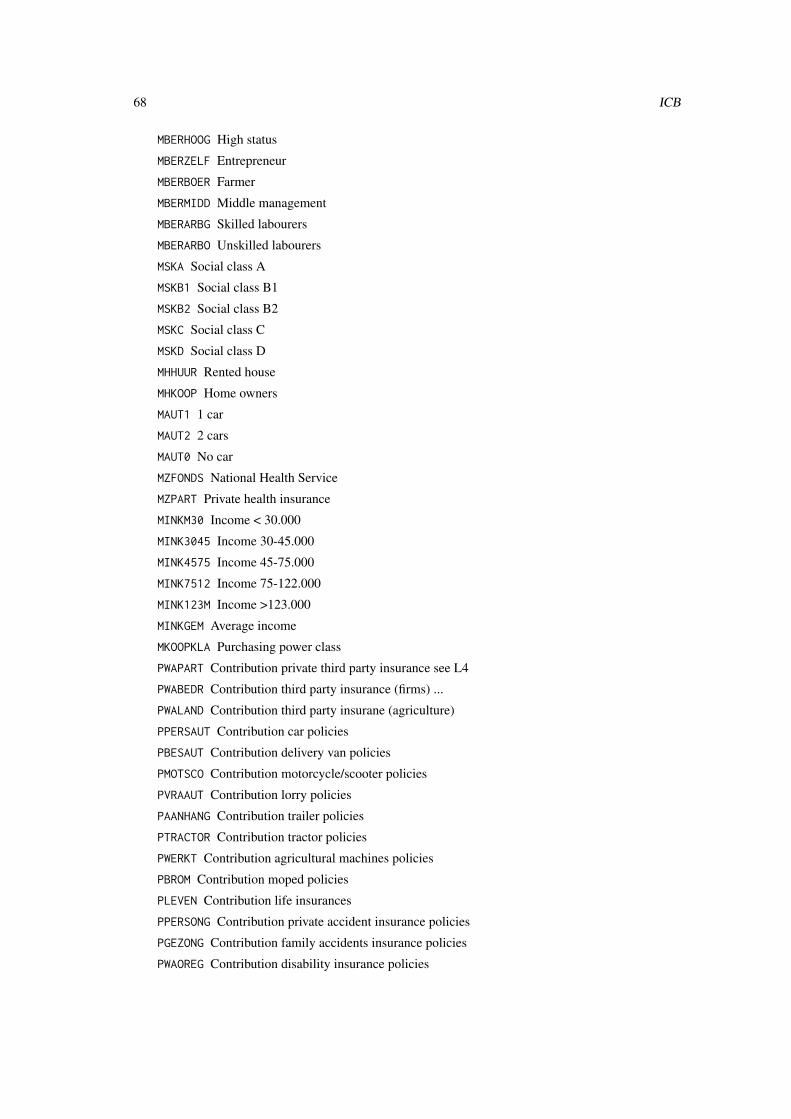
68 ICB
MBERHOOG High status
MBERZELF Entrepreneur
MBERBOER Farmer
MBERMIDD Middle management
MBERARBG Skilled labourers
MBERARBO Unskilled labourers
MSKA Social class A
MSKB1 Social class B1
MSKB2 Social class B2
MSKC Social class C
MSKD Social class D
MHHUUR Rented house
MHKOOP Home owners
MAUT1 1 car
MAUT2 2 cars
MAUT0 No car
MZFONDS National Health Service
MZPART Private health insurance
MINKM30 Income < 30.000
MINK3045 Income 30-45.000
MINK4575 Income 45-75.000
MINK7512 Income 75-122.000
MINK123M Income >123.000
MINKGEM Average income
MKOOPKLA Purchasing power class
PWAPART Contribution private third party insurance see L4
PWABEDR Contribution third party insurance (firms) ...
PWALAND Contribution third party insurane (agriculture)
PPERSAUT Contribution car policies
PBESAUT Contribution delivery van policies
PMOTSCO Contribution motorcycle/scooter policies
PVRAAUT Contribution lorry policies
PAANHANG Contribution trailer policies
PTRACTOR Contribution tractor policies
PWERKT Contribution agricultural machines policies
PBROM Contribution moped policies
PLEVEN Contribution life insurances
PPERSONG Contribution private accident insurance policies
PGEZONG Contribution family accidents insurance policies
PWAOREG Contribution disability insurance policies
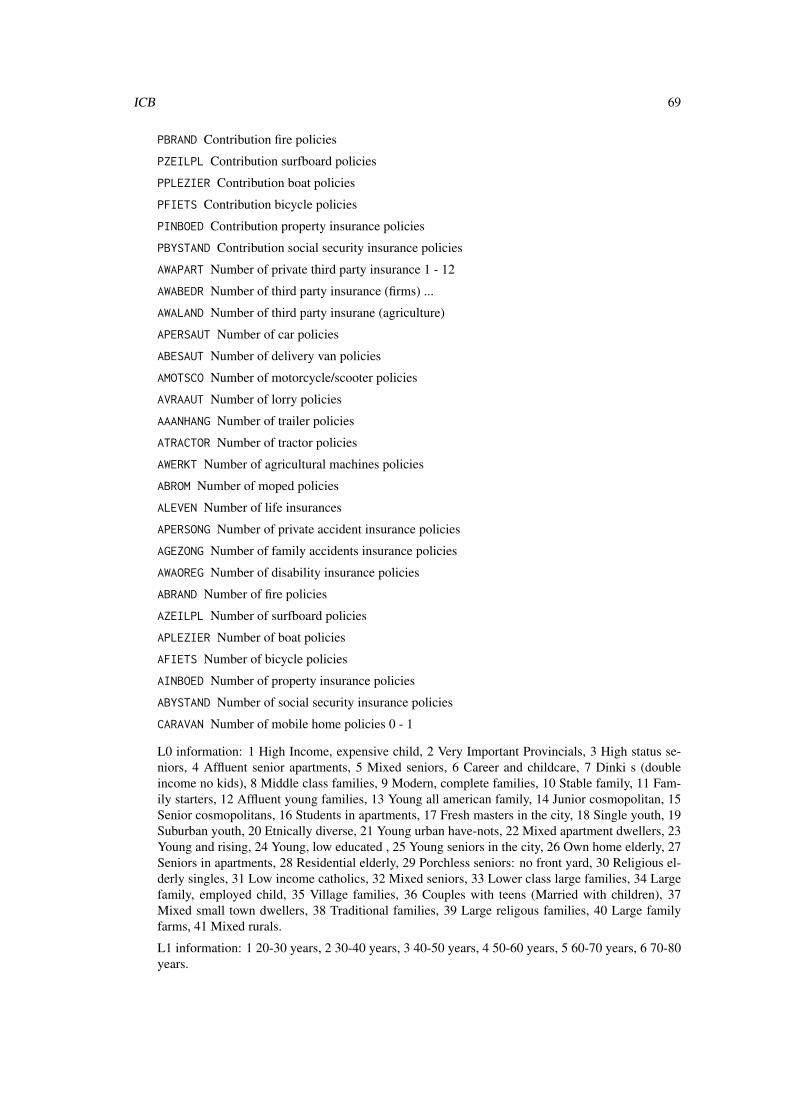
ICB 69
PBRAND Contribution fire policies
PZEILPL Contribution surfboard policies
PPLEZIER Contribution boat policies
PFIETS Contribution bicycle policies
PINBOED Contribution property insurance policies
PBYSTAND Contribution social security insurance policies
AWAPART Number of private third party insurance 1 - 12
AWABEDR Number of third party insurance (firms) ...
AWALAND Number of third party insurane (agriculture)
APERSAUT Number of car policies
ABESAUT Number of delivery van policies
AMOTSCO Number of motorcycle/scooter policies
AVRAAUT Number of lorry policies
AAANHANG Number of trailer policies
ATRACTOR Number of tractor policies
AWERKT Number of agricultural machines policies
ABROM Number of moped policies
ALEVEN Number of life insurances
APERSONG Number of private accident insurance policies
AGEZONG Number of family accidents insurance policies
AWAOREG Number of disability insurance policies
ABRAND Number of fire policies
AZEILPL Number of surfboard policies
APLEZIER Number of boat policies
AFIETS Number of bicycle policies
AINBOED Number of property insurance policies
ABYSTAND Number of social security insurance policies
CARAVAN Number of mobile home policies 0 - 1
L0 information: 1 High Income, expensive child, 2 Very Important Provincials, 3 High status se-niors, 4 Affluent senior apartments, 5 Mixed seniors, 6 Career and childcare, 7 Dinki s (doubleincome no kids), 8 Middle class families, 9 Modern, complete families, 10 Stable family, 11 Fam-ily starters, 12 Affluent young families, 13 Young all american family, 14 Junior cosmopolitan, 15Senior cosmopolitans, 16 Students in apartments, 17 Fresh masters in the city, 18 Single youth, 19Suburban youth, 20 Etnically diverse, 21 Young urban have-nots, 22 Mixed apartment dwellers, 23Young and rising, 24 Young, low educated , 25 Young seniors in the city, 26 Own home elderly, 27Seniors in apartments, 28 Residential elderly, 29 Porchless seniors: no front yard, 30 Religious el-derly singles, 31 Low income catholics, 32 Mixed seniors, 33 Lower class large families, 34 Largefamily, employed child, 35 Village families, 36 Couples with teens (Married with children), 37Mixed small town dwellers, 38 Traditional families, 39 Large religous families, 40 Large familyfarms, 41 Mixed rurals.
L1 information: 1 20-30 years, 2 30-40 years, 3 40-50 years, 4 50-60 years, 5 60-70 years, 6 70-80years.

70 ICB
L2 information: 1 Successful hedonists, 2 Driven Growers, 3 Average Family, 4 Career Loners, 5Living well, 6 Cruising Seniors, 7 Retired and Religeous, 8 Family with grown ups, 9 Conservativefamilies, 10 Farmers.
L3 information: 0 0%, 1 1 - 10%, 2 11 - 23%, 3 24 - 36%, 4 37 - 49%, 5 50 - 62%, 6 63 - 75%, 776 - 88%.
L4 information: 0 0, 1 1 - 49, 2 50 - 99, 3 100 - 199, 4 200 - 499, 5 500 - 999, 6 1000 - 4999, 75000 - 9999, 8 10.000 - 19.999, 9 20.000 - Inf.
Source
Data is (c) Sentient Machine Research 2000
This dataset is owned and supplied by the Dutch datamining company Sentient Machine Research,and is based on real world business data. You are allowed to use this dataset and accompanying in-formation for NON commercial research and education purposes only. It is explicitly NOT allowedto use this dataset for commercial education or demonstration purposes.
http://kdd.ics.uci.edu/databases/tic/tic.data.html.
References
P. van der Putten and M. van Someren (eds) . CoIL Challenge 2000: The Insurance CompanyCase. Published by Sentient Machine Research, Amsterdam. Also a Leiden Institute of AdvancedComputer Science Technical Report 2000-09. June 22, 2000.
See Also
http://kdd.ics.uci.edu/databases/tic/tic.html
There is a special website for this benchmark at http://www.liacs.nl/~putten/library/cc2000/.On this website, you can find an online report featuring 29 papers written by participants in the CoILChallenge 2000 and further background information.
Examples
# (1) load of data#data(ICB1)dim(ICB1)head(ICB1)
summary(ICB1)
data(ICB2)
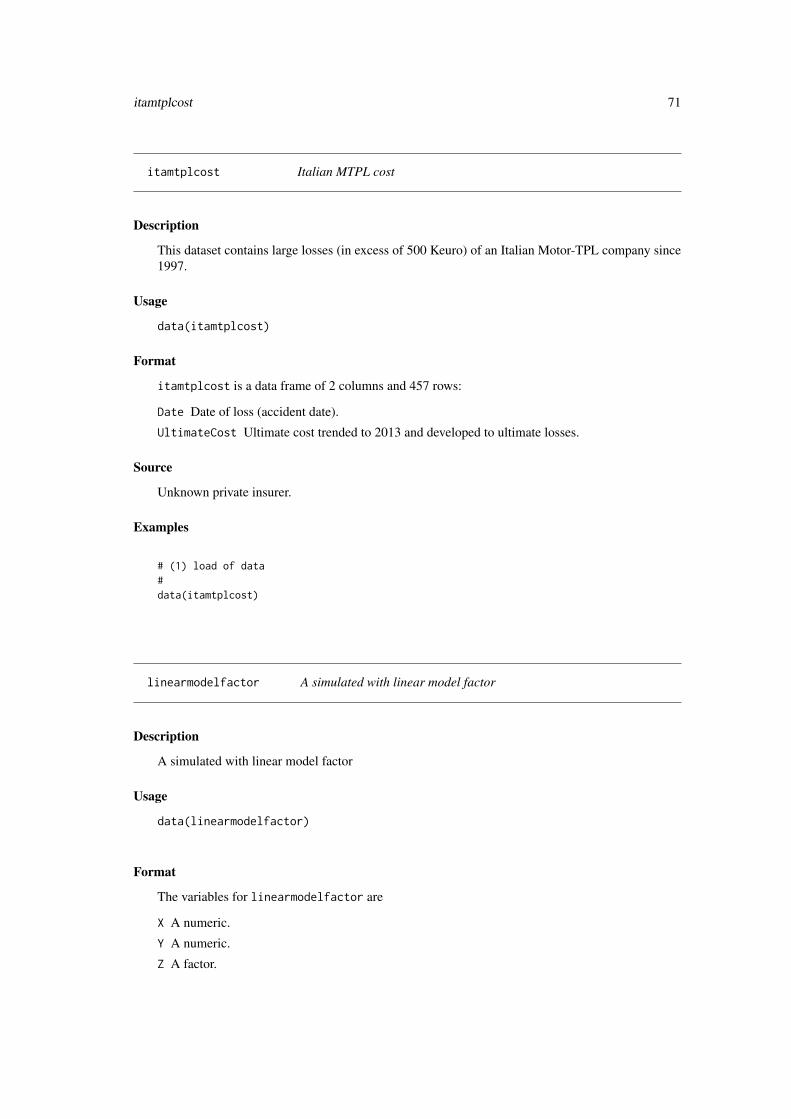
itamtplcost 71
itamtplcost Italian MTPL cost
Description
This dataset contains large losses (in excess of 500 Keuro) of an Italian Motor-TPL company since1997.
Usage
data(itamtplcost)
Format
itamtplcost is a data frame of 2 columns and 457 rows:
Date Date of loss (accident date).
UltimateCost Ultimate cost trended to 2013 and developed to ultimate losses.
Source
Unknown private insurer.
Examples
# (1) load of data#data(itamtplcost)
linearmodelfactor A simulated with linear model factor
Description
A simulated with linear model factor
Usage
data(linearmodelfactor)
Format
The variables for linearmodelfactor are
X A numeric.
Y A numeric.
Z A factor.
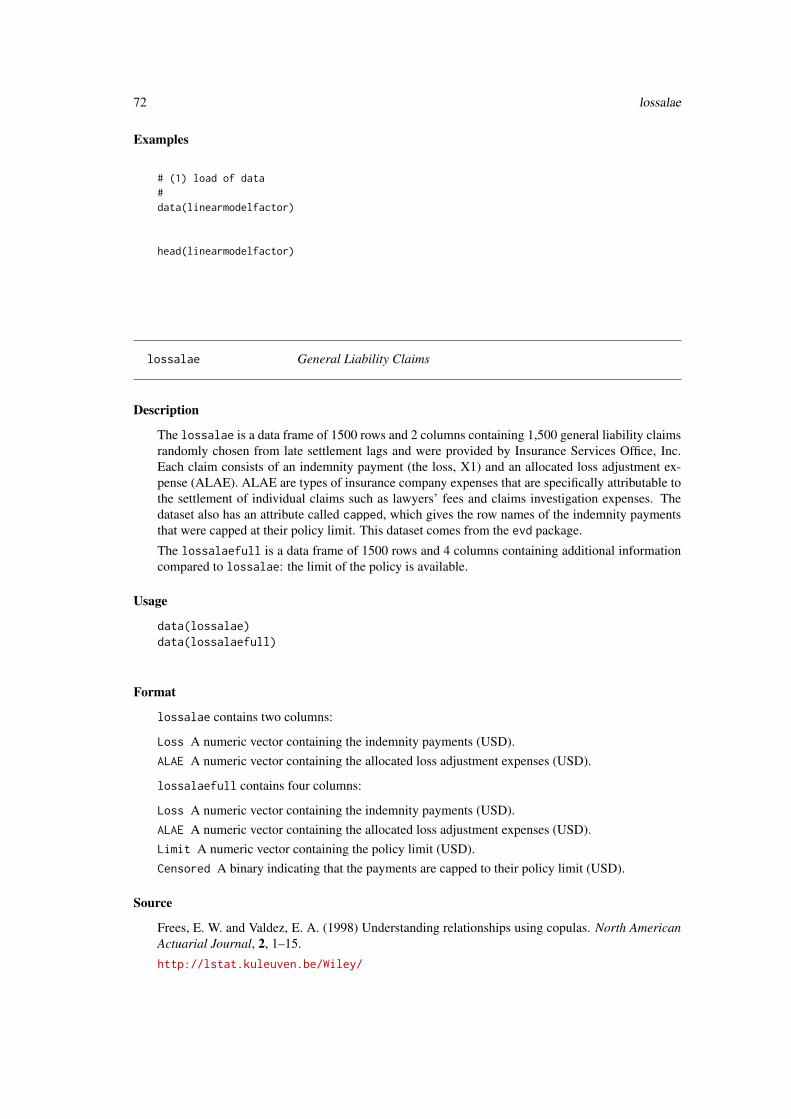
72 lossalae
Examples
# (1) load of data#data(linearmodelfactor)
head(linearmodelfactor)
lossalae General Liability Claims
Description
The lossalae is a data frame of 1500 rows and 2 columns containing 1,500 general liability claimsrandomly chosen from late settlement lags and were provided by Insurance Services Office, Inc.Each claim consists of an indemnity payment (the loss, X1) and an allocated loss adjustment ex-pense (ALAE). ALAE are types of insurance company expenses that are specifically attributable tothe settlement of individual claims such as lawyers’ fees and claims investigation expenses. Thedataset also has an attribute called capped, which gives the row names of the indemnity paymentsthat were capped at their policy limit. This dataset comes from the evd package.
The lossalaefull is a data frame of 1500 rows and 4 columns containing additional informationcompared to lossalae: the limit of the policy is available.
Usage
data(lossalae)data(lossalaefull)
Format
lossalae contains two columns:
Loss A numeric vector containing the indemnity payments (USD).ALAE A numeric vector containing the allocated loss adjustment expenses (USD).
lossalaefull contains four columns:
Loss A numeric vector containing the indemnity payments (USD).ALAE A numeric vector containing the allocated loss adjustment expenses (USD).Limit A numeric vector containing the policy limit (USD).Censored A binary indicating that the payments are capped to their policy limit (USD).
Source
Frees, E. W. and Valdez, E. A. (1998) Understanding relationships using copulas. North AmericanActuarial Journal, 2, 1–15.
http://lstat.kuleuven.be/Wiley/
norauto 73
References
Klugman, S. A. and Parsa, R. (1999) Fitting bivariate loss distributions with copulas. Insurance:Mathematics and Economics, 24, 139–148.
Beirlant, J., Goegebeur, Y., Segers, J. and Teugels, J. L. (2004) Statistics of Extremes: Theory andApplications., Chichester, England: John Wiley and Sons.
Cebrian, A.C., Denuit, M. and Lambert, P. (2003). Analysis of bivariate tail dependence usingextreme value copulas: An application to the SOA medical large claims database, Belgian ActuarialBulletin, Vol. 3, No. 1.
Examples
# (1) load of data#data(lossalae)data(lossalaefull)
# (2) plot of data#plot(lossalae$ALAE, lossalae$Loss, log="xy", pch=19)
norauto Norwegian fire insurance dataset
Description
This dataset comprises 183,999 observations of automobile insurance policies losses over a one-year period.
Usage
data(norauto)
Format
norauto contains 7 columns (each row is a policy):
Male 1 if the policyholder is a male, 0 otherwise.
Young 1 if the policyholder age is below 26 years, 0 otherwise.
DistLimit The distance limit as stated in the insurance contract: "8000 km", "12000 km", "16000km", "20000 km", "25000-30000 km", "no limit".
GeoRegion Density of the geographical region (from heaviest to lightest): "High+", "High-","Medium+", "Medium-", "Low+", "Low-".
Expo Exposure as a fraction of year.
ClaimAmount 0 or the average claim amount if NbClaim > 0.
NbClaim The claim number.
74 Norberg
Source
Unknown Norwegian insurer.
Downloaded from University of Oslo: http://www.uio.no/studier/emner/matnat/math/STK4520/h05/undervisningsmateriale/
Examples
# (1) load of data#data(norauto)summary(norauto)
Norberg Norberg’s credibility dataset
Description
This univariate dataset was self-made by Norberg (1979) for pointing out the relevancy of credibil-ity. It contains hypothetic records of binary claim of an insurance portfolio with 20 policies.
Usage
data(Norberg)
Format
Norberg contains 20 columns and 10 rows. Rows are the 10 years of experience, while columnsare the 20 policies in the portfolio.
Source
Public.
References
Dataset used in Ragnar Norberg (1979), The credibility approach to experience rating, ScandinavianActuarial Journal, 181-221.
Examples
# (1) load of data#data(Norberg)
# (2) plot and description of data#matplot(0:9, apply(Norberg, 2, cumsum)/(1:10), type="l",ylim=c(0, 1), main="Claim experience")
norfire 75
norfire Norwegian fire insurance dataset
Description
This dataset comprises 9181 fire losses over the period 1972 to 1992 from an unknown Norwegiancompany. A priority of 500 thousands of Norwegian Krone (NKR) was applied to get this dataset.
Usage
data(norfire)
Format
norfire contains three columns:
Year The year of claim occurence.
Loss The total loss amount NKR thousands.
Loss2012 The total loss amount in thousands of 2012 Norwegian Krone, inflated using the Nor-wegian CPI.
Source
http://lstat.kuleuven.be/Wiley/
References
Dataset used in Beirlant, Teugels and Vynckier (1996), Practical Analysis of Extreme Values, Leu-ven University Press.
in Beirlant, Matthys and Diercks (2001), Heavy-tailed distributions and rating, ASTIN Bulletin,Vol. 31, Issue 1.
in Beirlant, Goegebeur, Segers and Teugels (2006), Statistics of extremes: theory and applications,John Wiley and Sons.
Examples
# (1) load of data#data(norfire)
# (2) plot and description of data#
boxplot(Loss ~ Year, data= norfire, log="y", xlab="Year",ylab="Claim size", main="Norwegian fire dataset")
76 nortritpl8800
nortritpl8800 Australian liabilty insurance triangles
Description
Dataset nortritpl8800 contains claim triangles from a Norwegian non-life insurer between 1988and 2000 for bodily injuries. nortritpl8800 is a list of 5 elements : a triangle of claim counts bythe sum of reporting and valuation delay, a triangle of claim payments by the sum of reporting andvaluation delay, a triangle of reported incurred claims by the sum of reporting and valuation delay,a triangle of claim payments by valuation delay, a triangle of reported incurred claims by valuationdelay. Values are cumulated amounts.
Usage
#1st Line of Businessdata(nortritpl8800)
Format
nortritpl8800$countbyrepdel, nortritpl8800$paidbyrepdel, nortritpl8800$incurbyrepdelcontain the insurance triangles by reporting+valuation delay. nortritpl8800$paidbydel, nortritpl8800$incurbydelcontains the insurance triangles by valuation delay.
References
W. Neuhaus (2004), On the Estimation of Outstanding Claims, Australian Actuarial Journal, 10,485-518.
Examples
# (1) load of data#
#1st Line of Businessdata(nortritpl8800)

nzcathist 77
nzcathist New Zealand catastrophe historic
Description
Historical disaster statistics in Zealand from 1968 to 2014.
Usage
data(nzcathist)
Format
nzcathist is a data frame of 9 columns:
Year a numeric for the Year.
Quarter a numeric for the quarter of the year.
Date a character string for the date.
FirstDay a Date object for the first day of natural catastrophe.
Event a character string describing the event.
Type a factor describing the event type among the list: "Cyclone", "Earthquake", "Flood","Flood,Storm", "Hailstorm", "Other", "Power outage", "Storm", "Tornado", "Weather".
Location a character string describing the location.
OriginalCost Original cost in million of Australian dollars (NZD).
NormCost2011 Normed cost in million of 2011 New Zealand dollars (NZD).
NormCost2014 Normed cost in million of 2014 New Zealand dollars (NZD).
Source
https://www.icnz.org.nz/media-and-resources/natural-disasters/
Examples
# (1) load of data#data(nzcathist)
# (2) plot of data#plot(ecdf(nzcathist$NormCost2014))
78 PnCdemand
PnCdemand Property and casualty insurance demand
Description
The PnCdemand contains indicators of the demand for property and liability insurance in terms ofnational economic and risk aversion characteristics. There are 22 countries over 7 years between1987-1993.
Usage
data(PnCdemand)
Format
PnCdemand contains 22 columns:
"Name" A character for the country name.
"Country" A numeric for the country identifier.
"Time" A numeric for the time identifier.
"GNPCAP" A numeric for the Gross national product, in US dollars per capita..
"NewMEAS" A numeric for the new measure of wealth produced by the World Bank. It is a com-posite measure that includes human resources, produced or manufactured assets and naturalresources. This variable is time-invariant. It is wealth per capita, in thousands of US dollars.
"RiskAversion" A numeric for the risk aversion, which is proxied by level of education. This ismeasured by the enrollment ratio of third-level education, that is, the ratio of total enrollmentin third-level education institutions to the total population age 20 to 24. Education at thethird level is provided by different types of institutions, including universities, teacher-traininginstitutions and technical institutes.
"Protect" A numeric for the protective measures may reduce competition and thus raise prices.Trade barriers are proxied by the insurance market share of foreign firms. Specifically, thisis the market share of branches or agencies of foreign undertakings in total domestic non-lifeinsurance.
"PopDens" A numeric for the population density, the average number of people living within asquare kilometer.
"Urban" A numeric for the urbanization. The percentage of people living in urban areas.
"LegalSyst" A numeric for the legal system. This is an indicator variable that is equal to one if thecountry has a common law system and is zero otherwise (statutory law system). This variableis time-invariant.
"CPI" A numeric for the Consumer Price Index, as a percentage.
"Auto" Automobile premium density, computed as total direct gross automobile insurance premi-ums divided by the country’s population. It includes damage or loss to land vehicles as wellas liability arising out of the use of motor vehicles. The measure is in US dollars per capita.
"Transport" Transport premium density. Transport insurance includes railway loss, aircraft lossand liability and ship loss and liability.
"Freight" Freight premium density. It includes all damage to or loss of goods in transit or bag-gage.
pricingame 79
"FireProp" Fire and other property damage premium density. It includes damage or loss of prop-erty due to fire, explosion, storm, other natural forces, nuclear energy and land subsidence aswell as other damage to property.
"PecLoss" Pecuniary loss premium density. It includes credit loss, surety loss and other miscella-neous financial losses.
"GenLiab" General liability premium density. It includes all liability other than motor vehicle,aircraft and ship liability.
"AccSick" Accident and sickness premium density.
"OtherNL" Other non-life premium density. It includes legal expenses, assistance and other mis-cellaneous insurance.
"MRATE" Motor vehicle ownership per capita.
"NumAcc" ?
"Population" Total population number.
Source
FreesBook-LPD
References
Browne, M. J., Chung, J. and Frees, E. W. (2000). International property-liability insurance con-sumption. Journal of Risk and Insurance, 73-90.
Frees, E. W. (2004). Longitudinal and panel data: analysis and applications in the social sciences.Cambridge University Press.
Examples
# (1) load of data#data(PnCdemand)
pricingame French Motor Third-Part Liability datasets used for 100 percent DataScience game
Description
pg15training, pg15pricing are the two datasets used for the 2015 pricing game of the French in-stitute of Actuaries organized on November 5, 2015. pg15training contains 100,000 TPL policiesfor private motor insurance used to fit the models, whereas pg15pricing contains 36,311 policiesof the same guarantee for which the premium is computed. Each record has been observed at mostone year and contains risk features of the policyholder and the insured vehicle. For confidentialityreasons, most categorical levels have unknown meaning.
pg16trainpol, pg16trainclaim, pg16test are the three datasets used for the 2016 pricing gameof the French institute of Actuaries organized on November 8, 2016. pg16trainpol contains 87,228policies for private motor insurance and pg16trainclaim contains 4,568 claims of those 87,228
80 pricingame
TPL policies. Policies are guaranteed for all kinds of material damages, but not bodily injuries.Both datasets are used to fit the models, whereas pg16test is used for training. For confidentialityreasons, most categorical levels have unknown meaning.
pg17trainpol, pg17trainclaim are the two training datasets used for the 2017 pricing game of theFrench institute of Actuaries organized on November 16, 2017. pg17trainpol contains 100,000policies for private motor insurance and pg17trainclaim contains 14,243 claims of those 100,00TPL policies. These training sets correspond to year t = 0. pg17testyear1, pg17testyear2,pg17testyear3, pg17testyear4 are the four test datasets used for the pricing game: each has100,000 rows of new policies (drivers willing to purchase insurance for Year t with t = 1, 2, 3, 4).
Usage
data(pg15training)data(pg15pricing)
data(pg16trainpol)data(pg16trainclaim)data(pg16test)
data(pg17trainpol)data(pg17trainclaim)data(pg17testyear1)data(pg17testyear2)data(pg17testyear3)data(pg17testyear4)
Format
pg15training and pg15pricing are two dataframes with the same columns:
PolNum The policy number.
CalYear The underwriting year.
Gender The gender of the car driver.
Type The car type (a single letter).
Category The car category (a string character).
Occupation The occupation of the driver (a string character).
Age The driver age, in years (in France, people can drive a car at 18).
Group1 The group of the car.
Bonus The bonus-malus (French no-claim discount): -30 means a 30 percent bonus while +20means a 20 percent malus; see details below.
Poldur The policy age (in year).
Value The car value (in euro).
Adind A dummy variable indicating a material cover.
SubGroup2 The subregion of the driver home (unknown category).
Group2 The region of the driver home (unknown category).
Density The density of inhabitants (number of inhabitants per km2) in the city the driver of thecar lives in.
pricingame 81
Expdays Exposure in days.
Numtppd The number of third-party material claims.
Numtpbi The number of third-party bodily injury claims.
Indtppd The total cost of third-party material claims (euro).
Indtpbi The total cost of third-party bodily injury claims (euro).
pg16trainpol,pg16trainclaim,pg16test are dataframes with the following columns:
Year The coverage year.
BeginDate,EndDate Beginning date and ending date of the coverage period (of class "Date").
Exposure The exposure as a fraction of year, computed as the difference between EndDate andBeginDate divided by 365.
PolicyID The identification number of the policy.
PolicyAgeCateg The category of the policy age.
PolicyCateg The category of the policy.
CompanyCreation A dummy indicating if the company has been created.
FleetMgt The fleet management category.
FleetSizeCateg The fleet size category
Area The geographical area.
PayFreq The payment frequency.
VehiclAge The vehicle age category.
VehiclNb The number of vehicles
VehiclCateg The vehicle category.
VehiclPower The vehicle power
LicNb The license number of the vehicle.
Deduc The deductible category
SumInsured The category of the sum insured.
BusinessType The business type.
ChannelDist The distribution channel.
ClaimNb The claim number.
ClaimCharge The claim charge.
DirectComp As claims correspond only to material damage, the French claim convention (IDA)was applied. So the insurer may directly refund the insured (when DirectComp=TRUE) even ifthe insurer will sue the third-party insurer to recover the indemnity afterwards.
CompRate The rate of compensation (in percent).
SettlYear The settlement year.
pg17*** are dataframes with the following columns:
id_client The client identification number: a string of the form Annnnnnnn (A followed by an8-digit number). First client ID is A00000001 and last is A00091488.
id_vehicle The vehicle identification number: a string of the form Vnn (a V followed by a 2-digitnumber). First vehicle is always numbered V01. If a client has multiple vehicles, then thenumeration increases by 1. There is no particular ordering in the vehicles, so their rank shouldnot represent anything valuable.
82 pricingame
id_policy The policy identification number, a string of the form Annnnnnnn-Vnn resulting fromappending id_client and id_vehicle.
id_year The year of coverage, Year ID begins at "Year 0" and ends at "Year 4".
pol_bonus The policy bonus (French no-claim discount): 0.5 means a 30 percent bonus while 1.2means a 20 percent malus; see details below.
pol_coverage The coverage category: The coverage are of 4 types : Mini, Median1, Median2 andMaxi, in this order. As you can guess, Mini policies covers only Third Party Liability claims,whereas Maxi policies covers all claims, including Damage, Theft, Windshield Breaking, As-sistance, etc.
pol_duration The policy duration: Policy duration represents how old the policy is. It is ex-pressed in year, accounted from the beginning of the current year i. Oldest policies in thisportfolio can last since prehistoric ages of 45 years.
pol_sit_duration The policy current endorsement duration: Situation duration represent howold the current policy caracteristics are. It can be different from pol duration, because thesame insurance policy could have evolved in the past (e.g. by changing coverage, or vehicle,or drivers, . . . ).
pol_pay_freq The payment frequency: The price of the insurance coverage can be paid annually,bi-annually, quarterly or monthly.
pol_payd A dummy indicating pay as you drive: a string with Yes or No, which indicates whetherour client has subscribed a mileage-based policy or not. In those early ages of Year 0, Pay AsYou Drive was not that current, so they represent a minority in the portfolio.
pol_usage The policy usage: it describes what usage the driver makes from his vehicle, most oftime. There are 4 possible values : "WorkPrivate" which is the most common, "Retired"which is presumed to be aimed at retired people (who also are presumed driving less kilome-ters), "Professional" which denotes a professional usage of the vehicle, and "AllTrips"which is quite similar to Professional (including pro tours). As for the coverage, it would bevery surprising that this variable had no effect on frequency.
pol_insee_code The INSEE code of the French city/municipality where the policyholder lives:it is a 5-digits alphanumeric code used by the French National Institute for Statistics andEconomic Studies (hence INSEE) to identify "communes" and departments in France. Thereare about 36,000 "communes" in France, but not every one of them is present in the dataset(there are only 18,000 of them). The first 2 digits of insee code identifies the department (theyare 96, not including overseas departments). The insee code or department code can be usedto possibly merge external data to the datasets: population density, OSM data, etc.
drv_drv2 A character string indicating if there is a secondary driver: there is always a first driver,which characteristics (age, sex, licence) are provided, but a secondary driver is optional, andis present 1 time out of 3.
drv_age1,drv_age2 The driver age of the ith driver: it is expressed in years counted from thebeginning of the considered year. Then, drv_age1 increases by 1 every year, like in realworld... Legal age to drive is 18, so you shouldn’t find any age below that limit. Due to thefact that the database is built on existing situations before Year 0, in fact the minimum age is19 in Year 0 dataset. On the other side, you’ll also find quite old drivers.
drv_sex1,drv_sex2 The driver sex of the ith driver. European rules force insurers to charge thesame price for women and men. But driver’s gender can still be used in academic studies, andthat’s why drv sex1 is still available in the datasets, and can be used as discriminatory variablein this pricing game.
drv_age_lic1,drv_age_lic2 The age of the driving license of the ith driver. As for the otherages, it is expressed in integer years from the beginning of the current year.
pricingame 83
vh_age The vehicle age: This variable is the vehicle’s age, the difference between the year ofrelease and the current year.
vh_cyl The engine cylinder displacement is expressed in ml in a continuous scale. This variableshould be highly correlated with din power of the vehicle.
vh_din The vh_din is a representation of the motor power. Highly correlated with din power,cylinder, speed and even value of the vehicle.
vh_fuel The vehicle fuel type: with mainly two values "Diesel" and "Gasoline". Very fewHybrid vehicles can also be found, but, 6 years ago, the hybrid market was still at its beginning.
vh_make The vehicle carmaker. As the database is built from a French insurance, the three majorbrands are Renault, Peugeot and Citroen.
vh_model The vehicle model. As a subdivision of the carmake, vehicle is identified by its modelname.
vh_sale_begin,vh_sale_end vh_sale_begin and vh_sale_end are the dates (in fact: ages)from the beginning of the current year of the beginning and the end of marketing years ofthe vehicle. This could for instance identify policies that covers very new vehicles or second-hand ones.
vh_speed The vehicle maximum speed (km/h), as stated by the manufacturer.
vh_type The vehicle type, either "Tourism" or "Commercial". There are more "Commercial"types for "Professional" policy usage than for "WorkPrivate".
vh_value The vehicle’s value (replacement value) is expressed in euros, without inflation so itshould be stable from a year to another.
vh_weight The vehicle weight (kg).
id_claim The claim identification number: a string of the form CLnn (CL followed by a 2-digitnumber). Numbering of the claims begins at 1 for every policy and each year. Then, thelast value of id claim is the maximum number of claims for a vehicle in a year. Two-digitsrepresentation is sufficient : this maximum doesn’t exceed 7 (but not on Year 0, where themaximum is 6).
claim_nb The claim number, as we are talking about individual claims, each claim nb has a valueof 1.
claim_amount The claim amount: amounts range from (approx.) -2,000 to +300,000. Yes, thereare negative values, they come from claims where our driver’s liability is not engaged, sothere’s a legal recourse.
The bonus/malus system is compulsary in France, but we will only use it here as a possible feature.The coefficient is attached to the driver. It starts at 1 for young drivers (i.e. first year of insurance).Then, every year without claim, the bonus decreases by 5 percent until it reaches its minimum of0.5. Without any claim, the bonus evolution would then be : 1 − > 0.95 − > 0.9 − > 0.85 − >0.8 − > 0.76 − > 0.72 − > 0.68 − > 0.64 − > 0.6 − > 0.57 − > 0.54 − > 0.51 − > 0.5. Everytime the driver causes a claim (only certain types of claims are taken into account), the coefficientincreases by 25 percent, with a maximum of 3.5. Thus, the range of bonus/malus coefficient extendsfrom 0.5 to 3.5 in the datasets.
Source
Datasets from unknown private insurers.
See https://freakonometrics.hypotheses.org/20034 for the first pricing game.
See https://actinfo.hypotheses.org/69 for the second pricing game.
See https://actinfo.hypotheses.org/86 for the third pricing game.
84 sgautonb
Examples
# (1) load of data#data(pg15training)data(pg15pricing)
data(pg16trainpol)data(pg16trainclaim)data(pg16test)
data(pg17trainpol)data(pg17trainclaim)data(pg17testyear1)
# (2) some check# should be zerosum(!pg16trainclaim$PolicyID %in% pg16trainpol$PolicyID)# should be trueNROW(pg16trainclaim) == sum(pg16trainpol$ClaimNb)
sgautonb Singapore Automobile claim count dataset
Description
This dataset contains automobile injury claim number collected in 1993 in Singapore by the GeneralInsurance Association of Singapore. Records contains individuals characteristics in addition toclaim counts.
Usage
data(sgautonb)
Format
sgautonb is a data frame of 8 columns and 1,340 rows:
SexInsured Gender of insured, including male (M), female(F) and unspecified (U).
Female Numeric: 1 if female, 0 otherwise.
VehicleType The type of vehicle being insured, such as automobile (A), truck (T), and motorcycle(M).
PC Numeric: 1 if private vehicle, 0 otherwise.
Clm_Count Number of claims during the year.
Exp_weights Exposure weight or the fraction of the year that the policy is in effect.
LNWEIGHT Logarithm of exposure weight.
NCD No Claims Discount. This is based ont he previous accident record of the policyholder. Thehigher the discount, the better is the prior accident record.
sgtriangles 85
AgeCat The age of the policyholder, in years grouped into seven categories. 0-6 indicate age groups21 and younger, 22-25, 26-35, 36-45, 46-55, 56-65, 66 and over, respectively.
VAgeCat The age of the vehicle, in years, grouped into seven categories. 0-6 indicate groups 0, 1,2, 3-5, 6-10, 11-15, 16 and older, respectively.
AutoAge0 Numeric: 1 if private vehicle and VAgeCat = 0, 0 otherwise.
AutoAge1 Numeric: 1 if private vehicle and VAgeCat = 1, 0 otherwise.
AutoAge2 Numeric: 1 if private vehicle and VAgeCat = 2, 0 otherwise.
AutoAge Numeric: 1 if Private vehicle and VAgeCat = 0, 1 or 2, 0 otherwise.
VAgecat1 VAgeCat with categories 0, 1, and 2 combined.
Source
FreesBook-RMAFA
References
Frees (2010), Regression modelling with actuarial and financial applications, Cambridge Univer-sity Press.
Frees and Valdez (2008), Hierarchical Insurance Claims Modeling, Journal of the American Statis-tical Association (103), 1457-1469.
Examples
# (1) load of data#data(sgautonb)dim(sgautonb)head(sgautonb)
sgtriangles Singapore general liability triangles
Description
sgautoprop9701 is a data report incremental payments from a portfolio of automobile policies fora Singapore property and casualty (general) insurer for years 1997-2001. Payments are for thirdparty property damage from comprehensive insurance policies. All payments have been deflatedusing a Singaporean consumer price index, so they are in constant dollars.
sgautoBI9301 contains payments from a portfolio of automobile policies for a Singapore propertyand casualty (general) insurer for years 1993-2001. Payments, deflated for inflation, are for thirdparty injury from comprehensive insurance policies.
Usage
data(sgautoprop9701)data(sgautoBI9301)
86 SOAGMI
Format
sgautoprop9701 and sgautoBI9301 are two matrices containing insurance triangles.
Source
Freesbook-RMAFA
References
Frees, E.W. (2010), Regression modelling with actuarial and financial applications, CambridgeUniversity Press.
Frees, E.W., and E. Valdez (2008). Hierarchical insurance claims modeling, Journal of the Ameri-can Statistical Association 103, 1457-69.
Examples
# (1) load of data#data(sgautoprop9701)data(sgautoBI9301)
SOAGMI SOA Group Medical Insurance claim dataset
Description
The dataset was collected by SOA for a group medical insurance and contains records of all theclaim amounts exceeding 25,000 USD over the period 1991 and is available at http://www.soa.org. There is no truncation due to maximum benefits.
Usage
data(SOAGMI)
Format
SOAGMI contains two columns and 371 rows:
Year The year of claim occurence.
Loss The loss amount in euros (EUR).
Source
http://lstat.kuleuven.be/Wiley/
spacedata 87
References
Dataset used in Beirlant, Dierckx, Goegebeur and Matthys (2004), Statistics of Extremes, Wiley
in Grazier and G’Sell (1997), Group Medical Insurance Large Claims Database and Collection,SOA Monograph M-HB97-1, Society of Actuaries, Schaumburg.
and in Cebrian, Denuit and Lambert (2003), Analysis of bivariate tail dependence using extremevalue copulas: An application to the SOA medical large claims database, Belgian Actuarial Bul-letin, Vol.3, Issue 1.
Examples
# (1) load of data#data(SOAGMI)
spacedata Space dataset
Description
This dataset contains 1,698 observations of satelites between 1956 and 2013 where the study focusesfailure and success once the satelite has reached its targeted orbit. Failures during the launching stepor the testing step are not considered.
Usage
data(spacedata)
Format
spacedata is a data frame of 16 columns and 1,698 rows:
Event A character string describing the launch: always "LAUNCH: Satellite launched success-fully".
EventDate The date of the launch.
MissionType A character string describing the mission goals.
InitOrbit A character string for the satelite orbit, see details.
OrbitRange A character string summarizing the satelite orbit.
Position A character for the position.
ContractLife The contractual life (in years).
Sector A character string: either "CIVIL" or "MILITARY".
IsCommercial When civil usage, 1 indicates private (commercial), 0 public (institution).
Mass Mass of satellite (Kg).
RetireDate Date of retirement, if any.
TotalFailDate Date of total failure, if any, see details.
88 spacedata
PartialFailDate Date of partial failure, if any, see details.AnyFailDate Date of first failure, in any.OperLifeTime Life Length of the satelite (in years) when operating successfully.Censored Indicator for censoring.
Details
The satelite orbit is an acronym given by
EO Elliptical Orbit.G Geostationary.GTO Geostationary Transfert Orbit.HEL Heliocentric Orbit.HEO Highly Elliptical Orbit.LEO Low Earth Orbit.MEO Medium Earth Orbit.PEO Polar Elliptical Orbit.PO Polar Orbit.SSO Sun-Synchronous Orbit
Some details on earth orbit are given below:
LEO Low Earth orbits (LEO) are defined to be orbits with an average altitude that is less than2,000 km. An important subset of LEO is the sun-synchronous orbit (SSO). These are circularorbits with an altitude between 500 km and 1200 km that provide an orbital period that resultin passes over a point on the Earth’s surface at the same time of day, a fixed number of daysapart. This is ideal for Earth observation missions. LEO has predominantly been used bycivil and military agencies for Earth observation, scientific missions, manned missions andintelligence or spy satellites.
MEO Medium Earth orbits (MEO) are defined to be orbits with an average altitude in the range of5,000 to 20,000 km. The U.S. military were the first to exploit this orbit with the Global Po-sitioning Satellites (GPS). The numerous satellites in the constellation appear to move slowlyacross the sky of an observer and several satellites are always visible at any point on the Earth’ssurface. A similar orbit is used by the Russia’s equivalent Glonass system and the EuropeanGalileo.
GEO The Geostationary Earth Orbit GEO type orbit features an altitude of approximately 36,000km. The matched orbital period means that the satellite will appear to be nearly stationary inthe sky of an observer, allowing for simplified earth communications and a global coverage.The main use of this type of orbit has been for the telecommunications industry, point-to-point,mobile and direct broadcast. A significant secondary user has been for Earth observation,especially meteorological but also military missile launch and nuclear explosion detectionsatellites. Commercial use of space satellites has tended to concentrate on the GEO orbitwith the market predominantly developing in the late 1970s and throughout the 1980s and1990s. Total demand for launches to GEO again increased to 1997, mainly due to commercialinterests, before a sharp decline in demand into the early 2000s.
Generally, a difference is made between partial losses and total losses with the following definitions:
Total Loss - Constructive Total Loss: (1) Total Loss means physical destruction of the spacecraft,no separation from the launch vehicle or injection in a useless orbit, loss of control of thespacecraft. (2) Constructive Total Loss means a partial loss where the loss ratio is equal orabove 75 percent, assimilated to a Total Loss.
swautoins 89
Partial Loss: loss of performance impacting the spacecraft intended mission, reduction of usefullifetime, permanently intermittent mission based on a predetermined loss formula.
Source
Data based on two actuarial memoirs and partially modified to fit package standards.
References
Guelou, S. (2013). Risques spatiaux: modelisation de la fiabilite des satellites en orbite., EURoInstitut d’Actuariat master thesis, University of Brest, France.
Gauche, J.F. (2012). Space risks., Centre d’Etudes Actuarielles master thesis, Paris, France.
See Also
Castet, J.F. and Saleh, J.H. (2011). Spacecraft reliability and multi-state failures : a statisticalapproach, Wiley.
Castet, J.F., Dubos, G.F and Saleh, J.H. (2011). Statistical reliability analysis of satellites by masscategory : Does spacecraft size matter?, Acta Astronautica, pages 584-595.
Examples
# (1) load of data#data(spacedata)dim(spacedata)
swautoins Swedish Motor Insurance dataset
Description
This dataset contains motor insurance data collected in 1977 in Sweden by the Swedish Committeeon the Analysis of Risk Premium. Records contains individuals characteristics in addition to claimcounts and severities.
Usage
data(swautoins)
Format
swautoins is a data frame of 7 columns and 2,182 rows:
Kilometres Distance driven by a vehicle, grouped into five categories.
Zone Graphic zone of a vehicle, grouped into 7 categories.
Bonus Driver claim experience, grouped into 7 categories.
90 swbusscase
Make The type of a vehicle
Insured The number of policyholder years. A policyholder year is the fraction of the year that thepolicyholder has a contract with the issuing company.
Claims Number of claims.
Payment Sum of payments.
Source
FreesBook-RMAFA
References
Frees (2010), Regression modelling with actuarial and financial applications, Cambridge Univer-sity Press.
Hallin and Ingenbleek (1983), The Swedish automobile portfolio in 1977. A statistical study, Scan-dinavian Actuarial Journal, 49-64.
Andrews and Herzberg (1985), Data. A collection of problems from many fields for the student andresearch worker, Springer-Vedag, New York, pp. 4t3-421.
Examples
# (1) load of data#data(swautoins)dim(swautoins)head(swautoins)
swbusscase Swedish Buss Insurance dataset
Description
This data comes from the former Swedish insurance company Wasa, before its 1999 fusion withLaensfoersaekringar Alliance. In Sweden, insurance involves three types of cover: TPL (third partyliability), partial casco and hull. TPL covers any bodily injuries plus property damages caused toothers in a traffic accident. Partial casco (may not be used in all countries) covers theft but also someother causes of loss such as fire. Hull covers damage on the policyholder’s own vehicle. Note thatThe TPL insurance is mandatory, while the others are optional. The three types of cover are oftensold in a package as a comprehensive insurance, but they are usually priced separately. This datasetcontains information relative to partial casco only for buss in the commercial lines. Transportationcompanies own one or more buses which are insured for a shorter or longer period. It containsaggregated data on 670 companies that were policyholders at Wasa insurance company during theyears 1990-1998.
Usage
data(swbusscase)

swmotorcycle 91
Format
swbusscase is a data frame of 7 columns and 1,542 rows:
IDpol The policy ID, recoded for confidentiality reasons.
Area The type of area.
BusAgeClass The bus age class with 5 unknown categories.
ObsNb The number of observations for the company in a given tariff cell based on area and ageclass. There may be more than one observation per record, since each renewal is counted as anew observation.
ClaimNb The number of claims.
AggClaim The sum of claim payments.
Exposure The number of policy years.
Source
OhlsonBook
References
E. Ohlsson and B. Johansson (2010), Non-Life Insurance Pricing with Generalized Linear Models,Springer.
Examples
# (1) load of data#data(swbusscase)dim(swbusscase)head(swbusscase)
swmotorcycle Swedish Motorcycle Insurance dataset
Description
This data comes from the former Swedish insurance company Wasa, before its 1999 fusion withLaensfoersaekringar Alliance. In Sweden, insurance involves three types of cover: TPL (third partyliability), partial casco and hull. TPL covers any bodily injuries plus property damages caused toothers in a traffic accident. Partial casco (may not be used in all countries) covers theft but alsosome other causes of loss such as fire. Hull covers damage on the policyholder’s own vehicle. Notethat The TPL insurance is mandatory, while the others are optional. The three types of cover areoften sold in a package as a comprehensive insurance, but they are usually priced separately. Thisdataset contains information relative to partial casco only for motorcycles. It contains aggregateddata on all insurance policies and claims during 1994-1998.
92 swmotorcycle
Usage
data(swmotorcycle)
Format
swmotorcycle is a data frame of 9 columns and 64,548 rows:
OwnerAge The owner age.
Gender The gender.
Area The type of area.
RiskClass The motorcycle class, a classification by the so called EV ratio, defined as (Enginepower in kW x 100) / (Vehicle weight in kg + 75), rounded to the nearest lower integer. The75 kg represent the average driver weight. The EV ratios are divided into seven classes.
VehAge The Vehicle age, between 0 and 99.
BonusClass The bonusclass,taking values from 1 to 7. A new driver starts with bonus class 1;for each claim-free year the bonus class is increased by 1. After the first claim the bonus isdecreased by 2; the driver can not return to class 7 with less than 6 consecutive claim freeyears.
Exposure The number of policy years.
ClaimNb The number of claims.
ClaimAmount The sum of claim payments.
Source
OhlsonBook
References
E. Ohlsson and B. Johansson (2010), Non-Life Insurance Pricing with Generalized Linear Models,Springer.
Examples
# (1) load of data#data(swmotorcycle)dim(swmotorcycle)head(swmotorcycle)
swtriangles 93
swtriangles Switzerland general liability triangles
Description
swtri1auto is a named list of two triangles : the incurred (cumulative) amounts and the paid(cumulative) amounts.
Usage
data(swtri1auto)
Format
swtriangles is a named list of two matrices, respectively for incurred and paid amounts.
References
Dahms, R. (2008), A Loss Reserving Method for Incomplete Claim Data, Bulletin of the SwissAssociation of Actuaries, pp. 127-148.
Dahms, R., Merz, M., Wuethrich, M.V. (2009), Claims development result for combined claimsincurred and claims paid data. Bulletin Francais d’Actuariat 9 (18), 5-39.
Merz, M., and M. V. Wuethrich (2010), Paid-Incurred Chain Claims Reserving Method, Insurance:Mathematics and Economics 46, 2010, pp. 568-579.
Merz, M., and M. V. Wuethrich (2013), Estimation of Tail Development Factors in the Paid-IncurredChain Reserving Method, Variance 71, pp. 61-73.
Examples
# (1) load of data#data(swtri1auto)
tplclaimnumber TPL claim number dataset
Description
The univariate dataset was collected in the French motor market and comprise 90270 one-yearpolicies for which the claim number is recorded.
Usage
data(tplclaimnumber)
94 ukaggclaim
Format
tplclaimnumber contains three columns:
policy.id The policy identification number.
claim.number The claim number.
driver.age The driver age (given in the insurance contract).
Examples
# (1) load of data#data(tplclaimnumber)
# (2) plot and description of data#table(tplclaimnumber$claim.number)
ukaggclaim UK Car Insurance Claims for 1975
Description
The data give the average claims for damage to the owner’s car for privately owned and compre-hensively insured vehicles in Britain in 1975. Averages are given in pounds sterling adjusted forinflation. The datasets contains 128 observations.
Usage
data(ukaggclaim)
Format
ukaggclaim contains 5 columns:
OwnerAge Policy-holder’s age in years, categorized into 8 levels.
Model Type of car, in 4 groups.
CarAge Vehicle age in years, categorized into 4 levels.
NClaims Number of claims.
AveCost Average cost of each claim in pounds.
Source
The original dataset was provided by Baxter et al. (1980), then used in McCullagh and Nelder(1989). It is also available at http://www.statsci.org/data/general/carinsuk.html.

ukautocoll 95
References
Baxter, L. A., Coutts, S. M., and Ross, G. A. F. (1980). Applications of linear models in mo-tor insurance. In Proceedings of the 21st International Congress of Actuaries, Zurich, Society ofActuaries, pages 11-29.
McCullagh, P., and Nelder, J. A. (1989). Generalized linear models. Chapman and Hall, London.
Examples
# (1) load of data#data(ukaggclaim)dim(ukaggclaim)
# (2) summary#sapply(1:5, function(i) summary(ukaggclaim[,i]))
ukautocoll UK Automobile Collision Claims
Description
The data give the average claims and claim counts for insured vehicles in UK. Averages are givenin pounds sterling adjusted for inflation. The datasets contains 32 observations.
Usage
data(ukautocoll)
Format
ukautocoll contains 5 columns:
Age Policy-holder’s age in years, categorized into 8 levels.
Model Type of car, in 4 groups.
CarAge Vehicle age in years, categorized into 4 levels.
NClaims Number of claims.
AveCost Average cost of each claim in pounds.
Source
The original dataset was provided by Baxter et al. (1980), then used in McCullagh and Nelder(1989) and Mildenhall (1999) It is also available at http://www.statsci.org/data/general/carinsuk.html.
96 usautoBI
References
Baxter, L. A., Coutts, S. M., and Ross, G. A. F. (1980). Applications of linear models in mo-tor insurance. In Proceedings of the 21st International Congress of Actuaries, Zurich, Society ofActuaries, pages 11-29.
McCullagh, P., and Nelder, J. A. (1989). Generalized linear models. Chapman and Hall, London.
Mildenhall, S. J. (1999). A systematic relationship between minimum bias and generalized linearmodels. Casualty Actuarial Society Proceedings 86, 393-487, Casualty Actuarial Society. Arling-ton, Virginia.
Examples
# (1) load of data#data(ukautocoll)dim(ukautocoll)
# (2) summary#sapply(1:NCOL(ukautocoll), function(i) summary(ukautocoll[,i]))
usautoBI Automobile bodily injury claim dataset
Description
This dataset contains automobile injury claims collected in 2002 by the Insurance Research Council(part of AICPCU and IIA). There are 1,340 records with demographic information, in addition tothe claim amount.
Usage
data(usautoBI)
Format
usautoBI is a data frame of 8 columns and 1,340 rows:
CASENUM Case number to identify the claim.
ATTORNEY Whether the claimant is represented by an attorney: 1 is yes.
CLMSEX Claimant’s gender: M for male and F for female.
MARITAL claimant’s marital status : 1 if married, 2 if single, 3 if widowed, and 4 if divorced/separated.
CLMINSUR Whether or not the driver of the claimant’s vehicle was uninsured: 1 if yes, 2 if no, and3 if not applicable.
SEATBELT Whether or not the claimant was wearing a seatbelt/child restraint: 1 if yes, 2 if no, and3 if not applicable.
CLMAGE Claimant’s age.
LOSS The claimant’s total economic loss (in thousands of USD).
usautotriangles 97
Source
FreesBook-RMAFA
References
Frees (2010), Regression modelling with actuarial and financial applications, Cambridge Univer-sity Press.
Examples
# (1) load of data#data(usautoBI)dim(usautoBI)head(usautoBI)
usautotriangles US Automobile triangles
Description
usautotri9504 comes from Wacek (2007) and represent industry aggregates for private passengerauto liability/medical coverages. This dataset contains cumulative payments between 1995 and2004 in millions of dollars. Amounts are based on insurance company annual statements fromSchedule P (Part 3B). The elements of the triangle represent cumulative net payments, includingdefense and cost containment expenses.
usreauto8700 comes from the 2001 edition of the Historical Loss. This dataset has been used byBraun (2004). These data are from reinsurance business for automobile liability coverages for years1987-2000 and contain cumulative incurred amounts in thousands of US dollars.
Usage
data(usautotri9504)data(usreauto8700)
Format
usautotri9504, data(usreauto8700) are matrices containing insurance triangles.
Source
FreesBook-RMAFA
98 usexpense
References
Frees (2010), Regression modelling with actuarial and financial applications, Cambridge Univer-sity Press.
Wacek, M.G. (2007). The path of the ultimate loss ratio estimate, Variance 1, no. 2, 173-92.
Braun, C. (2004), The prediction error of the chain ladder method applied to correlated run-offtriangles, ASTIN Bulletin 34, no. 2, 399-423.
Examples
# (1) load of data#data(usautotri9504)data(usreauto8700)
usexpense US expense dataset
Description
This dataset is originally from the National Association of Insurance Commissioners and was ex-amined by Frees (2011). This dataset contains financial statements based on 2005 annual reports forall the property and casualty insurance companies in United States. The annual reports are financialstatements that use statutory accounting principles.
Usage
data(usexpense)
Format
usexpense is a data frame of 15 columns and 384 rows:
CompanyName Name of the company.
Group Indicates if the company is affiliated.
Mutual Indicates if the company is a mutual company.
Stock Indicates if the company is a stock company.
RBC Risk-Based Capital.
Expenses Total expenses incurred, in millions of dollars.
StaffWage Annual average wage of the insurer’s administrative staff, in thousands of dollars.
AgentWage Annual average wage of the insurance agent, in thousands of dollars.
LongLoss Losses incurred for long tail lines, in millions of dollars.
ShortLoss Losses incurred for short tail lines, in millions of dollars.
usGLtriangles 99
GWPpersonal Gross written premium for personal lines, in millions of dollars.
GWPcommercial Gross written premium for commercial lines, in millions of dollars.
Assets Net admitted assets, in millions of dollars.
Cash Cash and invested assets, in millions of dollars.
LiqRatio The ratio of the liquid assets to the current liabilities level.
Source
FreesBook-RMAFA
References
Frees, E.W. (2011). Regression Modeling with Actuarial and Financial Applications, CambridgeUniversity Press.
Examples
# (1) load of data#data(usexpense)
usGLtriangles US general liability triangles
Description
usreGL8190 comes from the 1991 edition of the Historical Loss Development Study published bythe Reinsurance Association of American (page 91). This dataset has been used by Mack (1994)and by England and Verrall (2002). These data are from automatic facultative reinsurance businessin general liability (excluding asbestos and environmental) coverages for years 1981-1990. Undera facultative basis, each risk is underwritten by the reinsurer on its own merits.
usreGL8700 comes from the 2001 edition of the Historical Loss. This dataset has been used byBraun (2004). These data are from reinsurance business for general liability coverages for years1987-2000 and contain cumulative incurred amounts in thousands of US dollars.
ustri1fire is a list of two triangles for fire insurance (one for incurred amounts and the other forpaid amounts) from Quard and Mack (2008).
ustri2GL is a list of three triangles for three line-of-business: commercial automobile businesses,homeowners, workers’ compensation from Kirschner, Kerley and Isaacs (2002). These are cumu-lative paid amounts in thousands of dollars.
Usage
data(usreGL8700)data(usreGL8190)data(ustri1fire)data(ustri2GL)

100 ushurricane
Format
usreGL8700 and usreGL8190 are two matrices containing insurance triangles. ustri1fire, ustri2GLare named lists.
Source
FreesBook-RMAFA
References
Braun, C. (2004), The prediction error of the chain ladder method applied to correlated run-offtriangles, ASTIN Bulletin 34, no. 2, 399-423.
England, P.D., and R.J. Verrall (2002), Stochastic claims reserving in general insurance, BritishActuarial Journal 8, 443-544.
Frees, E.W. (2010), Regression modelling with actuarial and financial applications, CambridgeUniversity Press.
Mack, T. (1994), Measuring the variability of chain-ladder reserve estimates, Casualty ActuarialSociety, Spring Forum, Arlington, Virginia.
Quard and Mack (2008), Munich Chain Ladder: a reserving method that reduces the gap betweenIBNR projections based on paid losses and IBNR projections based on incurred losses, Variance,Volume 2, Issue 2.
Kirschner, G.S., Kerley C. and Isaacs B. (2002), Two approaches to calculating correlated reservesindicators across multiple lines of business, CAS forum fall.
Examples
# (1) load of data#data(usreGL8700)data(usreGL8190)
data(ustri1fire)data(ustri2GL)
ushurricane Normalized Hurricane Damages
Description
Normalized Hurricane Damages in the United States: 1900-2005 used in Pielke et al. (2008).Originally, the data are stored in an Excel file with 4 worksheets. Damages are normalized accordingtwo approaches : (1) the methodology used by Pielke and Landsea (1998), adjusting for inflation,wealth, and population updated to 2005, called PL05; and (2) the methodology used by Collins andLowe (2001), adjusting for inflation, wealth, and housing units updated to 2005, called CL05.
ushurricane 101
Usage
data(ushustormloss)data(ushuannualloss)data(ushuinflation)data(ushupopulation)
Format
ushustormloss is a data frame of 7 columns and 207 rows:
Year Year of the Hurricane.Hurricane.Description Description of the Hurricane.State States damaged by the Hurricane.Category Category of the Hurricane.Base.Economic.Damage Economic damages (original USD).Normalized.PL05 Normalized PL05 damages (2005 USD).Normalized.CL05 Normalized CL05 damages (2005 USD).
ushuannualloss is a data frame of 2 columns and 106 rows:
Year Year.Normalized.PL05 Total year Normalized damages (2005 USD).
ushuinflation is a data frame of 9 columns and 106 rows:
Year Year.Implicit.Price.Deflator Implicit price deflator.Inflation.Multiplier Inflation multiplier.Wealth Wealth.Real.Wealth.2005.Base Real wealth (2005 base).Real.Wealth.Per.Capita Real wealth per capita.Real.Wealth.Per.Capita.Multiplier Real wealth per capita multiplier.Real.Wealth.Per.Housing.Unit Real wealth per housing unit.Real.Wealth.Per.Housing.Unit.Multiplier Real wealth per housing multiplier.
ushupopulation is a data frame of 12 columns and 217 rows:
Storm.ID Storm ID.Storm.Year Year of the Storm.Storm.Name Name of the Storm.County.Original.Population Original population in counties affected by storm.County.2005.Population 2005 population in counties affected by storm.County.Population.Multiplier County population multiplier.County.Original.Housing.Units Original housing units in counties affected by storm.County.2005.Housing.Units 2005 housing units in counties affected by storm.Housing.Units.Multiplier Housing units multiplier.Year YearUS.Population Total US population.US.Housing.Units Total US housing units.
102 ushustormloss4980
Source
http://sciencepolicy.colorado.edu/publications/special/normalized_hurricane_damages.html
References
Dataset used in Pielke, Gratz, Landsea, Collins, Saunders, and Musulin (2008), Normalized Hurri-cane Damages in the United States: 1900-2005, Natural Hazards Review, Volume 9, Issue 1, pp. 29-42. http://sciencepolicy.colorado.edu/admin/publication_files/resource-2476-2008.02.pdf
Examples
# (1) load of data#data(ushustormloss)
ushustormloss4980 Normalized Hurricane Damages in US between 1949 and 1980
Description
Normalized Hurricane Damages in the United States due to single hurricanes. They applied to theperiod from 1949 and 1980 and are adjusted for inflation. Originally, the dataset was compiled bythe American Insurance Association and is also reported in Beirlant, Teugels and Vynckier (1996).
Usage
data(ushustormloss4980)
Format
ushustormloss4980 is a data frame of 7 columns and 207 rows:
NormLoss80 Normalized damages (million of 1980 USD).
References
Dataset used in Beirlant, Teugels and Vynckier (1996), Practical Analysis of Extreme Values, Leu-ven University Press.
Examples
# (1) load of data#data(ushustormloss4980)
uslapseagent 103
uslapseagent United States lapse dataset from tied-agent channel
Description
The uslapseagent portfolio contains detailed information on the 29,317 Whole Life policies, allsold from the tied-agent channel between January 1995 and December 2008.
For each policy, we know the issuance date, the gender of the policyholder, the age category,etc. . . ~Unfortunately, some variables are rather uninformative.
Usage
data(uslapseagent)
Format
uslapseagent is a data frame of 14 columns and 29,317 rows:
issue.date Issue date. For policies not terminated in December 2008, we have non information:fixed right censored.
duration Time duration in quarters, unknown if censored.
acc.death.rider Indicates if the policy has an accidental death rider (i.e. an option coveringaccidental death).
gender The gender of the policyholder.
premium.frequency The premium frequency: either infra-annual (monthly, quarterly, semi-annual);annual or supra-annual.
risk.state The risk state: either "Smoker" or "NonSmoker".
underwriting.age The underwriting age: either "Young" (between 0 and 34 years old), "Middle"(between 35 and 54 years old) or "Old" (between 55 and 84 years old).
living.place The living place (categorical value).
annual.premium The annual premium (standardized scale): mean 560.88 and standard deviation526.58 in original USD scale.
DJIA the last observed quarterly variation of the DowJones Index (in standardized scale): mean0.00178 and standard deviation 0.0494 in original scale.
termination.cause The type of termination.
surrender A binary variable indicating the surrender by policyholder.
death A binary variable indicating the death of policyholder.
other A binary variable indicating other termination such as term.
allcause A binary variable indicating all termination.
Source
Unknown non-life insurers from United States, used in Milhaud and Dutang (2018), preprint athttps://hal.archives-ouvertes.fr/hal-01985256
104 usmassBI
References
Dataset used in Milhaud and Dutang (2018), Lapse tables for lapse risk management in insurance:a competing risk approach, European Actuarial Journal, 2018, Volume 8, Issue 1.
Examples
# (1) load of data#data(uslapseagent)head(uslapseagent)
usmassBI Massachusetts Automobile bodily injury claim datasets
Description
The dataset usmassBI contains automobile bodily injury claims collected in 2001 in Massachusetts,and studied in Frees (2010) and Rempala and Derrig (2005). There are 348 records with demo-graphic information, in addition to the claim amount. Claims that are closed by year end are ex-cluded. Potential fraudulent claims are from provider=A.
The dataset usmassBI2 contains automobile bodily injury claims collected between 1993 and 1998in Massachusetts, and studied in Frees and Wang (2005). This is a sample of 29 Massachusettstowns described in Frees (2003). Claim amounts have been rescaled to adjust for the effects ofinflation: all claims are in 1991 dollars, using the Consumer Price Index (CPI) for the rescalingfactor.
Usage
data(usmassBI)data(usmassBI2)
Format
usmassBI is a data frame of 8 columns and 1,340 rows:
claims Claim amount for bodily insurance coverage (in millions of USD).provider Health care provider is either "A" or "Other".providerA Binary variable indicating the presence of "Other" provider.logclaims Logarithm of claim amount.
usmassBI2 is a data frame of 5 columns and 174 rows:
TOWNCODE The index of Massachusetts towns.YEAR The calendar year of the observation.AC Average claims per unit of exposure.PCI Per-capita income of the town.PPSM Population per square mile of the town.

usmedclaim 105
Source
FreesBook-RMAFA
References
Frees, E.W. (2003), Multivariate Credibility for Aggregate Loss Models, North American ActuarialJournal 7(1), 13-37.
Frees, E.W. (2010), Regression modelling with actuarial and financial applications, CambridgeUniversity Press.
Frees, E.W. and Wang, P. (2005), Credibility using copulas, North American Actuarial Journal,9(2), 31-48.
Rempala, G.A., and R.A. Derrig (2005), Modeling hidden exposures in claim severity via the EMalgorithm, North American Actuarial Journal 9(2), 108-128.
Examples
# (1) load of data#data(usmassBI)dim(usmassBI)head(usmassBI)
# (1) load of data#data(usmassBI2)dim(usmassBI2)head(usmassBI2)
# summary tablessapply(levels(usmassBI2$TOWNCODE), function(x) summary(subset(usmassBI2, TOWNCODE == x)$AC))sapply(unique(usmassBI2$YEAR), function(x) summary(subset(usmassBI2, YEAR == x)$AC))
#plot average claimsplot(AC~YEAR, data=usmassBI2)for(i in usmassBI2$TOWNCODE) lines(AC~YEAR, data=subset(usmassBI2, TOWNCODE== i), col=i)
usmedclaim US Medical claim incremental triangles
Description
This dataset comes from Gamage et al. (2007) and contains medical-care payements by monthbetween January 2001 and December 2003. Payments for medical-care coverage come from poli-cies with no deductible or coinsurance. For a given month and a development year, payments areaggregated among members but are cumulated over development year. The payments exclude pre-scription drugs that typically have a shorter payment pattern than other medical claims.
106 usprivautoclaim
Usage
data(usmedclaim)
Format
usmedclaim is a matrix containing two columns (with members count and month) and the insurancetriangle.
Source
FreesBook-RMAFA
References
Frees (2010), Regression modelling with actuarial and financial applications, Cambridge Univer-sity Press.
Gamage, J., Linfield, J., Ostaszewski, K. and S. Siegel (2007). Statistical methods for health actu-aries - IBNR estimates: An introduction, Society of Actuaries Working Paper, Schaumburg, Illinois.
Examples
# (1) load of data#data(usmedclaim)head(usmedclaim, 10)
# (2) graph of data#matplot(t(as.matrix(usmedclaim[,-(1:2)])), type="b", main="Payment by accident month",
xlab="Month", ylab="Amount (USD)")
usprivautoclaim US Private Auto Claims
Description
This dataset contains claim amounts for private motor insurance from a US property and casualtyinsurer. Claims that were not closed by the year end are excluded. A risk classification is availableand is based on driver and vehicle characteristics.
Usage
data(usprivautoclaim)
usquakeLR 107
Format
usprivautoclaim contains 5 columns:
STATE State in US.
CLASS Risk category.
GENDER Gender.
AGE Driver age.
PAID Claim amount.
Source
FreesBook-RMAFA
References
Frees (2010), Regression modelling with actuarial and financial applications, Cambridge Univer-sity Press.
Hallin and Ingenbleek (1983), The Swedish automobile portfolio in 1977. A statistical study, Scan-dinavian Actuarial Journal, 49-64.
Andrews and Herzberg (1985), Data. A collection of problems from many fields for the student andresearch worker, Springer-Vedag, New York, pp. 4t3-421.
Examples
# (1) load of data#data(usprivautoclaim)dim(usprivautoclaim)
usquakeLR California earthquake loss ratios
Description
Loss ratios for earthquake insurance in California between 1971 and 1994.
Usage
data(usquakeLR)
Format
usquakeLR is a data frame of 2 columns and 24 rows:
Year Year of the earthquake.
LossRatio Loss ratio.
108 ustermlife
References
Dataset used in Jaffee and Russell (1996), Catastrophe Insurance, Capital Markets and UninsurableRisks, Philadelphia: Financial Institutions Center, The Wharton School, p. 96-112.
and
in Embrechts, Resnick and Samorodnitsky (1999). Extreme Value Theory as a Risk ManagementTool, North American Actuarial Journal, Volume 3, Number 2.
Examples
# (1) load of data#data(usquakeLR)
# (2) plot log scale#plot(usquakeLR$Year, usquakeLR$LossRatio+1e-3,ylim=c(1e-3, 1e4), log="y", ylab="Loss Ratio", xlab="Year")
ustermlife US Term Life insurance
Description
This dataset comes from Survey of Consumer Finances (SCF), a nationally representative samplethat contains extensive information on assets, liabilities, income, and demographic characteristicsof those sampled (potential U.S. customers). It contains a random sample of 500 households withpositive incomes that were interviewed in the 2004 survey. For term life insurance, the quantityof insurance is measured by the policy face, the amount that the company will pay in the eventof the death of the named insured. Characteristics include annual income, the number of years ofeducation of the survey respondent and the number of household members.
Usage
data(ustermlife)
Format
ustermlife is a data frame of 15 columns and 384 rows:
Gender Gender of the survey respondent.
Age Age of the survey respondent.
MarStat Marital status of the survey respondent: 1 if married, 2 if living with partner, and 0otherwise.
Education Number of years of education of the survey respondent.
Ethnicity Ethnicity.
uswarrantaggnum 109
SmarStat Marital status of the respondent’s spouse.
Sgender Gender of the respondent’s spouse.
Sage Age of the respondent’s spouse.
Seducation Education of the respondent’s spouse.
NumHH Number of household members.
Income Annual income of the family.
TotIncome Total income.
Charity Charitable contributions.
Face Amount that the company will pay in the event of the death of the named insured.
FaceCVLifePol Face amount of life insurance policy with a cash value.
CashCVLifePol Cash value of life insurance policy with a cash value.
BorrowCVLifePol Amount borrowed on life insurance policy with a cash value.
NetValue Net amount at risk on life insurance policy with a cash value.
Source
FreesBook-RMAFA
References
Frees, E.W. (2011). Regression Modeling with Actuarial and Financial Applications, CambridgeUniversity Press.
Examples
# (1) load of data#data(ustermlife)
uswarrantaggnum Warranty Automobile claims
Description
This dataset contains claims numbers for a sample of 15,775 automobiles that were sold and underwarranty for 365 days. Warranties are guarantees of product reliability issued by the manufacturer.The warranty data are for one vehicle system (e.g., brakes or power train) and cover one year witha 12,000 mile limit on coverage.
Usage
data(uswarrantaggnum)
110 usworkcomp
Format
uswarrantaggnum is a data frame of 8 columns and 1,340 rows:
PolicyNumber Policy number.
ClaimNumber Claim number. 5 is actually 5 and more.
Source
FreesBook-RMAFA
References
Cook, R.J. and J.F. Lawless (2002), The statistical analysis of recurrent events, Springer.
Frees (2010), Regression modelling with actuarial and financial applications, Cambridge Univer-sity Press.
Examples
# (1) load of data#data(uswarrantaggnum)uswarrantaggnum
usworkcomp US workers compensation datasets
Description
The dataset usworkcomp is originally from the National Council on Compensation Insurance andwas examined by Klugman (1992), Frees et al. (2001) and Frees (2011). This database containsrecords of losses due to permanent or partial disability claims for workers compensation insurancein US. For each claim amount, the payroll is available as a measure of exposure units. A total of847 data points is available coming from the observation of 121 risk classes over 7 years.
The dataset usworkcomptri8807 comes from an unknown US insurer: this reserve triangle wasused in Lacoume (2007).
Usage
data(usworkcomp)
usworkcomp 111
Format
usworkcomp is a data frame of 4 columns and 847 rows:
CL Occupation class identifier, 1-124.
YR Year identifier, 1-7.
PR Payroll, a measure of exposure to loss, in dollars.
LOSS Losses related to permanent partial disability, in dollars.
usworkcomptri8807 is a reserve triangle with 21 development years and 20 accident years.
Source
FreesBook-RMAFA
References
Klugman, Stuart A. (1992). Bayesian Statistics in Actuarial Science, Kluwer, Boston.
Frees, E.W. and Young, V.R. and Luo, Y. (2001), Case studies using panel data models, NorthAmerican Actuarial Journal, 5, 24-42.
Lacoume, A. (2007), Mesure du risque de reserve sur un horizon de un an, Actuary memoir, ISFA.
Frees, E.W. (2011). Regression Modeling with Actuarial and Financial Applications, CambridgeUniversity Press.
Examples
# (1) load of data#data(usworkcomp)
# Table 3 of Fres et al. (2001)# (in million USD)
t(sapply(unique(usworkcomp$YR),function(y) summary( subset(usworkcomp, YR == y)[,"PR"] / 10^6 )))
Index
∗Topic datasetsasiacomrisk, 3ausautoBI8999, 4auscathist, 5ausNLHYby, 6ausNLHYglossary, 10ausNLHYlloyd, 12ausNLHYtotal, 14ausNSW, 16ausprivauto, 17austriLoB, 19beaonre, 21besecura, 22bragg, 23brautocoll, 24brgeomunic, 25brvehins, 27canlifins, 29CASdatasets, 30credit, 33danish, 35Davis, 36ECBYieldCurve, 37eqlist, 37eudirectlapse, 39FedYieldCurve, 40forexUSUK, 40fre4LoBtriangles, 41freaggnumber, 42frebiloss, 43freclaimset, 44freclaimset2, 45frecomfire, 46freDisTables, 47fredpt17, 50fremarine, 51freMortTables, 52fremotorclaim, 55freMPL, 58freMTPL, 61freportfolio, 63hurricanehist, 66ICB, 67
itamtplcost, 71linearmodelfactor, 71lossalae, 72norauto, 73Norberg, 74norfire, 75nortritpl8800, 76nzcathist, 77PnCdemand, 78pricingame, 79sgautonb, 84sgtriangles, 85SOAGMI, 86spacedata, 87swautoins, 89swbusscase, 90swmotorcycle, 91swtriangles, 93tplclaimnumber, 93ukaggclaim, 94ukautocoll, 95usautoBI, 96usautotriangles, 97usexpense, 98usGLtriangles, 99ushurricane, 100ushustormloss4980, 102uslapseagent, 103usmassBI, 104usmedclaim, 105usprivautoclaim, 106usquakeLR, 107ustermlife, 108uswarrantaggnum, 109usworkcomp, 110
asiacomrisk, 3ausautoBI8999, 4auscathist, 5, 30ausMTPL8486 (ausprivauto), 17ausNLHYby, 6, 12, 13, 16ausNLHYCapAdeq, 30ausNLHYCapAdeq (ausNLHYtotal), 14ausNLHYCapAdeqByComp, 30
112
INDEX 113
ausNLHYCapAdeqByComp (ausNLHYby), 6ausNLHYClaimByState, 30ausNLHYClaimByState (ausNLHYby), 6ausNLHYFinPerf, 30ausNLHYFinPerf (ausNLHYtotal), 14ausNLHYFinPerfByComp, 30ausNLHYFinPerfByComp (ausNLHYby), 6ausNLHYFinPerfPublic, 30ausNLHYFinPerfPublic (ausNLHYby), 6ausNLHYFinPos, 30ausNLHYFinPos (ausNLHYtotal), 14ausNLHYFinPosByComp, 30ausNLHYFinPosByComp (ausNLHYby), 6ausNLHYFinPosPublic, 30ausNLHYFinPosPublic (ausNLHYby), 6ausNLHYglossary, 9, 10, 13, 16ausNLHYLiability, 30ausNLHYLiability (ausNLHYtotal), 14ausNLHYlloyd, 9, 12, 12, 16ausNLHYLloydAsset, 30ausNLHYLloydAsset (ausNLHYlloyd), 12ausNLHYLloydGPI, 30ausNLHYLloydGPI (ausNLHYlloyd), 12ausNLHYLloydUWAcc, 30ausNLHYLloydUWAcc (ausNLHYlloyd), 12ausNLHYLloydUWRes, 30ausNLHYLloydUWRes (ausNLHYlloyd), 12ausNLHYOffProf, 30ausNLHYOffProf (ausNLHYtotal), 14ausNLHYOpIncExp, 30ausNLHYOpIncExp (ausNLHYtotal), 14ausNLHYOpIncExpPublic, 30ausNLHYOpIncExpPublic (ausNLHYby), 6ausNLHYPremByState, 30ausNLHYPremByState (ausNLHYby), 6ausNLHYPremClaim, 30ausNLHYPremClaim (ausNLHYtotal), 14ausNLHYPremClaimPublic, 30ausNLHYPremClaimPublic (ausNLHYby), 6ausNLHYPrivInsur, 30ausNLHYPrivInsur (ausNLHYby), 6ausNLHYPubInsur, 30ausNLHYPubInsur (ausNLHYby), 6ausNLHYRecAASB, 30ausNLHYRecAASB (ausNLHYtotal), 14ausNLHYReserve, 30ausNLHYReserve (ausNLHYtotal), 14ausNLHYtotal, 9, 12, 13, 14, 30ausNSW, 16, 30ausNSWdeath02 (ausNSW), 16ausNSWdriver04 (ausNSW), 16ausprivauto, 17, 30
ausprivauto0405 (ausprivauto), 17ausprivautolong (ausprivauto), 17austri1autoBI7895 (austriLoB), 19austri2auto (austriLoB), 19austriLoB, 19, 30
beaonre, 21, 30besecura, 22, 30bragg, 23, 31braggclaim (bragg), 23braggprem (bragg), 23brautocoll, 24, 31, 32brgeomunic, 25, 31, 32brgeomunicins, 31, 32brgeomunicins (brgeomunic), 25brvehins, 27brvehins1, 31brvehins1 (brvehins), 27brvehins1a (brvehins), 27brvehins1b (brvehins), 27brvehins1c (brvehins), 27brvehins1d (brvehins), 27brvehins1e (brvehins), 27brvehins2, 31brvehins2 (brvehins), 27brvehins2a (brvehins), 27brvehins2b (brvehins), 27brvehins2c (brvehins), 27brvehins2d (brvehins), 27
canlifins, 29, 31CASdatasets, 30credit, 31, 33
danish, 35danishmulti, 31danishmulti (danish), 35danishuni, 31danishuni (danish), 35Date, 24Davis, 32, 36
ECBYieldCurve, 32, 37eqlist, 32, 37eudirectlapse, 31, 39
FedYieldCurve, 32, 40forexUSUK, 32, 40fre4LoBtriangles, 31, 41freaggnumber, 31, 42freAS0002 (freMortTables), 52frebiloss, 31, 43freclaimset, 31, 44
114 INDEX
freclaimset2, 31, 45freclaimset2motor (freclaimset2), 45freclaimset3dam9207 (freclaimset2), 45freclaimset3fire9207 (freclaimset2), 45frecomfire, 31, 46freDisTables, 31, 47fredpt17, 50frefictivetable (freportfolio), 63frefictivetable2 (freportfolio), 63frefictivetable3 (freportfolio), 63fremarine, 31, 51freMortTables, 31, 52fremotor1freq0304a (fremotorclaim), 55fremotor1freq0304b (fremotorclaim), 55fremotor1freq0304c (fremotorclaim), 55fremotor1prem0304a (fremotorclaim), 55fremotor1prem0304b (fremotorclaim), 55fremotor1prem0304c (fremotorclaim), 55fremotor1sev0304a (fremotorclaim), 55fremotor1sev0304b (fremotorclaim), 55fremotor1sev0304c (fremotorclaim), 55fremotor2freq9907b (fremotorclaim), 55fremotor2freq9907u (fremotorclaim), 55fremotor2sev9907 (fremotorclaim), 55fremotor3freq9907b (fremotorclaim), 55fremotor3freq9907u (fremotorclaim), 55fremotor3sev9907 (fremotorclaim), 55fremotor4freq9907b (fremotorclaim), 55fremotor4freq9907u (fremotorclaim), 55fremotor4sev9907 (fremotorclaim), 55fremotorclaim, 31, 55freMPL, 31, 58freMPL1 (freMPL), 58freMPL10 (freMPL), 58freMPL2 (freMPL), 58freMPL3 (freMPL), 58freMPL4 (freMPL), 58freMPL5 (freMPL), 58freMPL6 (freMPL), 58freMPL7 (freMPL), 58freMPL8 (freMPL), 58freMPL9 (freMPL), 58freMTPL, 31, 61freMTPL2freq (freMTPL), 61freMTPL2sev (freMTPL), 61freMTPLfreq, 32freMTPLfreq (freMTPL), 61freMTPLsev, 32freMTPLsev (freMTPL), 61freP2Ddis10 (freDisTables), 47freP2Ddisprob10 (freDisTables), 47freP2Pdis10 (freDisTables), 47
freP2Pdis13 (freDisTables), 47freP2Pdisprob10 (freDisTables), 47freP2Pdisprob13 (freDisTables), 47frePF6064 (freMortTables), 52frePM6064 (freMortTables), 52freportfolio, 31, 63freprojqxINSEE, 32freprojqxINSEE (freportfolio), 63freptfpermdis, 32freptfpermdis (freportfolio), 63freptftempdis (freportfolio), 63freT2Ddis10 (freDisTables), 47freT2Ddisprob10 (freDisTables), 47freT2Pdis10 (freDisTables), 47freT2Pdis13 (freDisTables), 47freT2Pdisprob10 (freDisTables), 47freT2Pdisprob13 (freDisTables), 47freT2Tdis10 (freDisTables), 47freT2Tdis13 (freDisTables), 47freT2Tdisprob10 (freDisTables), 47freT2Tdisprob13 (freDisTables), 47freTD7377 (freMortTables), 52freTD8890 (freMortTables), 52freTF0002 (freMortTables), 52freTGF05 (freMortTables), 52freTGH05 (freMortTables), 52freTH0002 (freMortTables), 52freTPG93full (freMortTables), 52freTPRV93 (freMortTables), 52fretri1auto9605 (fre4LoBtriangles), 41fretri2auto9605 (fre4LoBtriangles), 41fretri3auto9605 (fre4LoBtriangles), 41fretri4auto9403 (fre4LoBtriangles), 41freTV7377 (freMortTables), 52freTV8890 (freMortTables), 52
hurricanehist, 32, 66
ICB, 67ICB1, 32ICB1 (ICB), 67ICB2, 32ICB2 (ICB), 67itamtplcost, 31, 71
linearmodelfactor, 71lossalae, 32, 72lossalaefull, 32lossalaefull (lossalae), 72
norauto, 31, 73Norberg, 31, 74norfire, 31, 75
INDEX 115
nortritpl8800, 31, 76nzcathist, 31, 77
pg15pricing (pricingame), 79pg15training (pricingame), 79pg16test (pricingame), 79pg16trainclaim (pricingame), 79pg16trainpol (pricingame), 79pg17testyear1 (pricingame), 79pg17testyear2 (pricingame), 79pg17testyear3 (pricingame), 79pg17testyear4 (pricingame), 79pg17trainclaim (pricingame), 79pg17trainpol (pricingame), 79PnCdemand, 32, 78pricingame, 31, 50, 79
sgautoBI9301 (sgtriangles), 85sgautonb, 31, 84sgautoprop9701 (sgtriangles), 85sgtriangles, 32, 85SOAGMI, 32, 86sp, 25, 26, 51spacedata, 32, 87swautoins, 32, 89swbusscase, 32, 90swmotorcycle, 32, 91swtri1auto (swtriangles), 93swtriangles, 93
tplclaimnumber, 93
ukaggclaim, 32, 94ukautocoll, 32, 95usautoBI, 32, 96usautotri9504 (usautotriangles), 97usautotriangles, 32, 97usexpense, 32, 98usGLtriangles, 32, 99ushuannualloss (ushurricane), 100ushuinflation (ushurricane), 100ushupopulation (ushurricane), 100ushurricane, 32, 100ushustormloss (ushurricane), 100ushustormloss4980, 32, 102uslapseagent, 32, 103usmassBI, 32, 104usmassBI2, 32usmassBI2 (usmassBI), 104usmedclaim, 32, 105usprivautoclaim, 32, 106usquakeLR, 32, 107usreauto8700 (usautotriangles), 97
usreGL8190 (usGLtriangles), 99usreGL8700 (usGLtriangles), 99ustermlife, 32, 108ustri1fire (usGLtriangles), 99ustri2GL (usGLtriangles), 99uswarrantaggnum, 32, 109usworkcomp, 32, 110usworkcomptri8807 (usworkcomp), 110