Embed Size (px)
Citation preview
Package ‘PMwR’July 3, 2020
Type Package
Title Portfolio Management with R
Version 0.15-0
Date 2020-05-26
Maintainer Enrico Schumann <[email protected]>
Description Functions and examples for 'PortfolioManagement with R': backtesting investment andtrading strategies, computing profit/loss andreturns, analysing trades, handling lists oftransactions, reporting, and more.
Imports NMOF, datetimeutils, fastmatch, orgutils, parallel, textutils,utils, zoo
Suggests crayon, rbenchmark, tinytest
Depends R (>= 2.10)
License GPL-3
LazyLoad yes
LazyData yes
ByteCompile yes
URL http://enricoschumann.net/PMwR/,
https://github.com/enricoschumann/PMwR,
https://gitlab.com/enricoschumann/PMwR
NeedsCompilation no
Author Enrico Schumann [aut, cre] (<https://orcid.org/0000-0001-7601-6576>)
R topics documented:PMwR-package . . . . . . . . . . . . . . . . . . . . . . . . . . . . . . . . . . . . . . . 2Adjust-Series . . . . . . . . . . . . . . . . . . . . . . . . . . . . . . . . . . . . . . . . 3btest . . . . . . . . . . . . . . . . . . . . . . . . . . . . . . . . . . . . . . . . . . . . . 4DAX . . . . . . . . . . . . . . . . . . . . . . . . . . . . . . . . . . . . . . . . . . . . . 9
1
2 PMwR-package
drawdowns . . . . . . . . . . . . . . . . . . . . . . . . . . . . . . . . . . . . . . . . . 10instrument . . . . . . . . . . . . . . . . . . . . . . . . . . . . . . . . . . . . . . . . . . 11is_valid_ISIN . . . . . . . . . . . . . . . . . . . . . . . . . . . . . . . . . . . . . . . . 12journal . . . . . . . . . . . . . . . . . . . . . . . . . . . . . . . . . . . . . . . . . . . . 13NAVseries . . . . . . . . . . . . . . . . . . . . . . . . . . . . . . . . . . . . . . . . . . 17pl . . . . . . . . . . . . . . . . . . . . . . . . . . . . . . . . . . . . . . . . . . . . . . 19plot_trading_hours . . . . . . . . . . . . . . . . . . . . . . . . . . . . . . . . . . . . . 23position . . . . . . . . . . . . . . . . . . . . . . . . . . . . . . . . . . . . . . . . . . . 25pricetable . . . . . . . . . . . . . . . . . . . . . . . . . . . . . . . . . . . . . . . . . . 27quote32 . . . . . . . . . . . . . . . . . . . . . . . . . . . . . . . . . . . . . . . . . . . 29rc . . . . . . . . . . . . . . . . . . . . . . . . . . . . . . . . . . . . . . . . . . . . . . 30rebalance . . . . . . . . . . . . . . . . . . . . . . . . . . . . . . . . . . . . . . . . . . 32returns . . . . . . . . . . . . . . . . . . . . . . . . . . . . . . . . . . . . . . . . . . . . 34REXP . . . . . . . . . . . . . . . . . . . . . . . . . . . . . . . . . . . . . . . . . . . . 37scale1 . . . . . . . . . . . . . . . . . . . . . . . . . . . . . . . . . . . . . . . . . . . . 38streaks . . . . . . . . . . . . . . . . . . . . . . . . . . . . . . . . . . . . . . . . . . . . 39toHTML . . . . . . . . . . . . . . . . . . . . . . . . . . . . . . . . . . . . . . . . . . . 41Trade-Analysis . . . . . . . . . . . . . . . . . . . . . . . . . . . . . . . . . . . . . . . 41unit_prices . . . . . . . . . . . . . . . . . . . . . . . . . . . . . . . . . . . . . . . . . . 43valuation . . . . . . . . . . . . . . . . . . . . . . . . . . . . . . . . . . . . . . . . . . . 44
Index 47
PMwR-package Tools for the Management of Financial Portfolios
Description
Functions for the practical management of financial portfolios: backtesting investment and tradingstrategies, computing profit-and-loss and returns, analysing trades, reporting, and more.
Details
PMwR provides a small set of reliable, efficient and convenient tools that help in processing andanalysing trade/portfolio data. The Manual provides all the details; it is available from http://enricoschumann.net/PMwR/. Examples and descriptions of new features are described at http://enricoschumann.net/notes/PMwR/.
Author(s)
Enrico Schumann <[email protected]>
References
Gilli, M., Maringer, D. and Schumann, E. (2011) Numerical Methods and Optimization in Finance.Elsevier. https://www.elsevier.com/books/numerical-methods-and-optimization-in-finance/gilli/978-0-12-375662-6
Schumann, E. (2019) Portfolio Management with R. http://enricoschumann.net/PMwR/
Adjust-Series 3
Adjust-Series Adjust Time Series for Dividends and Splits
Description
Adjust a time series for dividends and splits.
Usage
div_adjust(x, t, div, backward = TRUE, additive = FALSE)
split_adjust(x, t, ratio, backward = TRUE)
Arguments
x a numeric vector
t an integer vector, specifying the positions in x at which dividends were paid(‘ex-days’) or at which a split occurred
div a numeric vector, specifying the dividends. If necessary, recycled to the lengthof t.
ratio a numeric vector, specifying the split ratios. The ratio must be ‘American Style’:a 2-for-1 stock split, for example, corresponds to a ratio of 2. (In other countries,for instance Germany, a 2-for-1 stock split would be called a 1-for-1 split: youkeep your shares and receive one new share per share that you own.)
backward logical
additive logical
Details
With backward set to TRUE, which is the default, the final prices in the unadjusted series matchesthe final prices in the adjusted series.
Value
a numeric vector of length equal to length(x)
Author(s)
Enrico Schumann
4 btest
Examples
x <- c(9.777, 10.04, 9.207, 9.406)div <- 0.7t <- 3
div_adjust(x, t, div)div_adjust(x, t, div, FALSE)
## assume there were three splits: adjust shares outstandingshares <- c(100, 100, 200, 200, 1000, 1500)t <- c(3, 5, 6)ratio <- c(2, 5, 1.5)### => invert ratiosplit_adjust(shares, t, 1/ratio)## [1] 1500 1500 1500 1500 1500 1500
split_adjust(shares, t, 1/ratio, backward = FALSE)## [1] 100 100 100 100 100 100
btest Backtesting Investment Strategies
Description
Testing trading and investment strategies.
Usage
btest(prices, signal,do.signal = TRUE, do.rebalance = TRUE,print.info = NULL, b = 1, fraction = 1,initial.position = 0, initial.cash = 0,final.position = FALSE,cashflow = NULL, tc = 0, ...,add = FALSE, lag = 1, convert.weights = FALSE,trade.at.open = TRUE, tol = 1e-5, tol.p = NA,Globals = list(),prices0 = NULL,include.data = FALSE, include.timestamp = TRUE,timestamp, instrument,progressBar = FALSE,variations, variations.settings, replications)
Arguments
prices For a single asset, a matrix of prices with four columns: open, high, low andclose. For n assets, a list of length four: prices[[1]] is then a matrix with ncolumns containing the open prices for the assets; prices[[2]] is a matrix with
btest 5
the high prices, and so on. If only close prices are used, then for a single asseteither a matrix of one column or a numeric vector; for multiple assets a list oflength one, containing the matrix of close prices. For example, with 100 closeprices of 5 assets, the prices should be arranged in a matrix p of size 100 times5; and prices = list(p).The series in prices are used both as transaction prices and for valuing openpositions. If signals are to be based on other series, such other series should bepassed via the . . . argument.Prices must be ordered by time (though the timestamps need not be provided).
signal A function that evaluates to the position in units of the instruments suggestedby the trading rule. If convert.weights is TRUE, signal should return thesuggested position as weights (which need not sum to 1). If signal returnsNULL, the current position is kept. See Details.
do.signal Logical or numeric vector, a function that evaluates to TRUE or FALSE, or a string.When a logical vector, its length must match the number of observations inprices: do.signal then corresponds to the rows in prices at which a signalis computed. Alternatively, these rows may also be specified as integers. If alength-one TRUE or FALSE, the value is recycled to match the number of obser-vations in prices. Default is TRUE: a signal is then computed in every period.do.signal may also be the string “firstofmonth”, “lastofmonth”, “firstofquar-ter” or “lastofquarter”; in these cases, timestamp needs to specified and mustbe coercable to Date.
do.rebalance Same as do.signal. Can also be the string "do.signal", in which case thevalue of do.signal is copied.
print.info A function or NULL. If NULL, nothing is printed.
cashflow A function or NULL (default).
b burn-in (an integer). Defaults to 1. This may also be a length-one timestamp ofthe same class as timestamp, in which case the data up to (and including) b areskipped.
fraction amount of rebalancing to be done: a scalar between 0 and 1initial.position
a numeric vector: initial portfolio in units of instruments. If supplied, this willalso be the initial suggested position.
initial.cash a numeric vector of length 1. Defaults to 0.
final.position logical
tc transaction costs as a fraction of turnover (e.g., 0.001 means 0.1%). May also bea function that evaluates to such a fraction. More-complex computations maybe specified with argument cashflow.
... other named arguments. All functions (signal, do.signal, do.rebalance, print.info,cashflow) will have access to these arguments. See Details for reserved argu-ment names.
add Default is FALSE. TRUE is not implemented – but would mean that signalshould evaluate to changes in position, i.e. orders.
lag default is 1
6 btest
convert.weights
Default is FALSE. If TRUE, the value of signal will be considered a weight vectorand automatically translated into (fractional) position sizes.
trade.at.open A logical vector of length one; default is TRUE.
tol A numeric vector of length one: only rebalance if the maximum absolute sug-gested change for at least one position is greater than tol. Default is 0.00001(which practically means always rebalance).
tol.p A numeric vector of length one: only rebalance those positions for which therelative suggested change is greater than tol.p. Default is NA: always rebalance.
Globals A list of named elements. See Details.
prices0 A numeric vector (default is NULL). Only used if b is 0 and an initial portfolio(initial.position) is specified.
include.data logical. If TRUE, all passed data are stored in final btest object. See SectionValue. See also argument include.timestamp.
include.timestamp
logical. If TRUE, timestamp is stored in final btest object. If timestamp ismissing, integers 1, 2, . . . are used. See Section Value. See also argumentinclude.data.
timestamp a vector of timestamps, along prices (optional; mainly used for print method andjournal)
instrument character vector of instrument names (optional; mainly used for print methodand journal)
progressBar logical: display txtProgressBar?
variations a list. See Details.variations.settings
a list. See Details.
replications an integer. If set, the function returns a list of btest objects. Each btest has anattribute replication, which records the replication number.
Details
The function provides infrastructure for testing trading rules. Essentially, btest does accounting:keep track of transactions and positions, value open positions, etc. The ingredients are price time-series (single series or OHLC bars), which need not be equally spaced; and several functions thatmap these series and other pieces of information into positions.
How btest works:btest runs a loop from b + 1 to NROW(prices). In iteration t, a signal can be computed basedon information from periods prior to t. Trading then takes place at the opening price of t. Forslow-to-compute signals this is reasonable if there is a time lag between close and open. For dailyprices, for instance, signals could be computed overnight. For higher frequencies, such as everyminute, the signal function should be fast to compute. Alternatively, it may be better to use alarger time offset (i.e. use a longer time lag) and to trade at the close of t by setting argumenttrade.at.open to FALSE.If no OHLC bars are available, a single series per asset (assumed to be close prices) can be used.
btest 7
The trade logic needs to be coded in the function signal. Arguments to that function must benamed and need to be passed with .... Certain names are reserved and cannot be used as argu-ments: Open, High, Low, Close, Wealth, Cash, Time, Timestamp, Portfolio, SuggestedPortfolio,Globals. Further reserved names may be added in the future: it is suggested to not start an ar-gument name with capital letter.The function signal must evaluate to the target position in units of the instruments. To work withweights, set convert.weights to TRUE, and btest will translate the weights into positions.
Accessing data:Within signal (and also other function arguments, such as do.signal), you can access datavia special functions such as Close. These are automatically added as arguments to signal.Currently, the following functions are available: Open, High, Low, Close, Wealth, Cash, Time,Timestamp, Portfolio, SuggestedPortfolio, Globals. Globals is special: it is an environment,which can be used to persistently store data during the run of btest. Use the argument Globalsto add initial objects. See the Examples below and the manual.Additional functions may be added to btest in the future. The names of those functions willalways be in title case. Hence, it is recommended to not use argument names for signal, etc. thatstart with a capital letter.
Replications and variations:btest allows to run backtests in parallel. See the examples at http://enricoschumann.net/notes/parallel-backtests.html.The argument variations.settings is a list with the following defaults:method character: supported are "loop", "parallel" (or "snow") and "multicore"
load.balancing logicalcores numeric
Value
A list with class attribute btest. The list comprises:
position actual portfolio holdingssuggested.position
suggested holdingscash cashwealth time-series of total portfolio value (aka equity curve)cum.tc transaction costsjournal journal of tradesinitial.wealth initial wealthb burn-infinal.position final position if final.position is TRUE; otherwise NA
Globals environment Globals
When include.timestamp is TRUE, the timestamp is included. If no timestamp was specified,integers 1,2,... are used instead.
When include.data is TRUE, essentially all information (prices, instrument, the actual call andfunctions signal etc.) are stored in the list as well.
8 btest
Author(s)
Enrico Schumann <[email protected]>
References
Schumann, E. (2019) Portfolio Management with R. http://enricoschumann.net/PMwR/; inparticular the chapter on backtesting: http://enricoschumann.net/R/packages/PMwR/manual/PMwR.html#backtesting
Schumann, E. (2018) Backtesting. https://ssrn.com/abstract=3374195
Examples
## For more examples, please see the Manual## http://enricoschumann.net/R/packages/PMwR/manual/PMwR.html
## 1 - a simple ruletimestamp <- structure(c(16679L, 16680L, 16681L, 16682L,
16685L, 16686L, 16687L, 16688L,16689L, 16692L, 16693L),
class = "Date")prices <- c(3182, 3205, 3272, 3185, 3201,
3236, 3272, 3224, 3194, 3188, 3213)data.frame(timestamp, prices)
signal <- function() ## buy when last price isif (Close() < 3200) ## below 3200, else sell
1 else 0 ## (more precisely: build position of 1## when price < 3200, else reduce## position to 0)
solution <- btest(prices = prices, signal = signal)journal(solution)
## with Date timestampssolution <- btest(prices = prices, signal = signal,
timestamp = timestamp)journal(solution)
## 2 - a simple MA model## Not run:library("PMwR")library("NMOF")
dax <- DAX[[1]]
n <- 5ma <- MA(dax, n, pad = NA)
DAX 9
ma_strat <- function(ma) {if (Close() > ma[Time()])
1else
0}
plot(as.Date(row.names(DAX)), dax, type = "l", xlab = "", ylab = "DAX")lines(as.Date(row.names(DAX)), ma, type = "l")
res <- btest(prices = dax,signal = ma_strat,b = n, ma = ma)
par(mfrow = c(3, 1))plot(as.Date(row.names(DAX)), dax, type = "l",
xlab = "", ylab = "DAX")plot(as.Date(row.names(DAX)), res$wealth, type = "l",
xlab = "", ylab = "Equity")plot(as.Date(row.names(DAX)), position(res), type = "s",
xlab = "", ylab = "Position")
## End(Not run)
DAX Deutscher Aktienindex (DAX)
Description
Historical Prices of the DAX.
Usage
data("DAX")
Format
A data frame with 505 observations on the following variable:
DAX a numeric vector
Details
Close prices.
Examples
str(DAX)
10 drawdowns
drawdowns Compute Drawdowns
Description
Compute drawdown statistics.
Usage
drawdowns(x, ...)## Default S3 method:drawdowns(x, ...)## S3 method for class 'zoo'drawdowns(x, ...)
Arguments
x a numeric vector of prices
... additional arguments, to be passed to methods
Details
drawdowns is a generic function. It computes drawdown statistics: maximum; and time of peak,trough and recovery.
Value
a data.frame
Author(s)
Enrico Schumann
References
Gilli, M., Maringer, D. and Schumann, E. (2011) Numerical Methods and Optimization in Finance.Elsevier. https://www.elsevier.com/books/numerical-methods-and-optimization-in-finance/gilli/978-0-12-375662-6
Schumann, E. (2019) Portfolio Management with R. http://enricoschumann.net/PMwR/
See Also
The actual computation of the drawdowns is done by function drawdown in package NMOF.
Series of uninterrupted up and down movements can be computed with streaks.
instrument 11
Examples
x <- c(100, 98)drawdowns(x)
x <- c(100, 98, 102, 99)dd <- drawdowns(x)dd[order(dd$max, decreasing = TRUE), ]
instrument Retrieve or Change Instrument
Description
Generic function for retrieving and changing instrument information.
Usage
instrument(x, ...)
instrument(x, ...) <- value
Arguments
x an object
... arguments passed to methods
value an object
Details
Generic function: extract or, if meaningful, replace instrument information
Value
when used to extract instrument, a character vector
Author(s)
Enrico Schumann
References
Schumann, E. (2017) Portfolio Management with R. http://enricoschumann.net/R/packages/PMwR/manual/PMwR.html
See Also
position
12 is_valid_ISIN
Examples
jnl <- journal(instrument = "A",amount = 100,price = 1)
instrument(jnl)
is_valid_ISIN Validate International Securities Identification Numbers (ISINs)
Description
Check whether a given ISIN is valid.
Usage
is_valid_ISIN(isin)
Arguments
isin a character vector
Details
Checks a character vector of ISINs. The function returns TRUE if the ISIN is valid; else FALSE.
The test procedure in ISO 6166 does not differentiate between cases. Thus, ISINs are transformedto uppercase before being tested.
Value
a logical vector
Author(s)
Enrico Schumann
References
http://en.wikipedia.org/wiki/ISO_6166
https://www.anna-web.org/standards/isin-iso-6166/
Examples
isin <- c("US0378331005", "AU0000XVGZA3","DE000A0C3743", "not_an_isin")
is_valid_ISIN(isin)
is_valid_ISIN(c("US0378331005","us0378331005")) ## case is ignored
journal 13
journal Journal
Description
Create and manipulate a journal of financial transactions.
Usage
journal(amount, ...)
as.journal(x, ...)
is.journal(x)
## Default S3 method:journal(amount, price, timestamp, instrument,
id = NULL, account = NULL, ...)
## S3 method for class 'journal'c(..., recursive = FALSE)
## S3 method for class 'journal'length(x)
## S3 method for class 'journal'aggregate(x, by, FUN, ...)
## S3 method for class 'journal'print(x, ...,
width = getOption("width"), max.print = getOption("max.print"),exclude = NULL, include.only = NULL)
## S3 method for class 'journal'sort(x, decreasing = FALSE, by = "timestamp", ..., na.last = TRUE)
## S3 method for class 'journal'subset(x, ...)
## S3 method for class 'journal'x[i, match.against = NULL,
ignore.case = TRUE, perl = FALSE, fixed = FALSE,useBytes = FALSE, ..., invert = FALSE]
## S3 replacement method for class 'journal'x[i, match.against = NULL,
ignore.case = TRUE, ..., invert = FALSE] <- value
14 journal
## S3 method for class 'journal'as.data.frame(x, row.names = NULL, optional = FALSE, ...)
## S3 method for class 'journal'head(x, n = 6L, ..., by = TRUE)
## S3 method for class 'journal'tail(x, n = 6L, ..., by = TRUE)
Arguments
timestamp An atomic vector of mode numeric or character. Timestamps should typicallybe sortable.
amount numeric
price numeric
instrument character or numeric (though typically character)
id An atomic vector. Default is NULL.
account An atomic vector. Default is NULL.
... For journal: further arguments, which must all be named.For subset: an expression that evaluates to a logical vector. The expressionmay use all fields of the passed journal; see Examples.For `[`: arguments other than ignore.case to be passed to grep.For sort: arguments passed to sort.
x a journal or an object to be coerced to class journal (for as.journal) or tobe checked if it inherits from journal (for is.journal)
width integer. See options.
decreasing passed to sort
by sort: sort by field. head/tail: by instrument.
na.last arguments passed to sort
max.print maximum number of transactions to print
exclude character: fields that should not be printed
include.only character: print only those fields. (Not supported yet.)
row.names see as.data.frame
optional see as.data.frame
recursive ignored (see c)
i integer, logical or character. The latter is interpreted as a regexp (see grep)
n integer
match.against character vector of field names. Default is NULL, which means to match againstall character fields.
ignore.case logical: passed to grepl
journal 15
perl logical: passed to grepl
fixed logical: passed to grepl
useBytes logical: passed to grepl
invert logical. If TRUE, invert selection (when i is of mode character, select journalentries that do not match regular expression)
FUN either a function that takes as input a journal and evaluates to a journal, or a listof named functions
value a replacement value
Details
The journal function creates a list of the arguments and attaches a class attribute (‘journal’). It isa generic function; the default method creates a journal from atomic vectors. The btest methodextracts the journal from the results of a backtest; see btest.
as.journal coerces an object to a journal; mostly used for creating a journal from a data.frame.
journal methods are available for several generic functions, for instance:
all.equal compare contents of two journals
aggregate Splits a journal according to by, applies a function to every sub-journal and recombinesthe results into a journal.
as.data.frame coerces journal to data.frame
c Combine several journals into one. Note that the first argument to c.journal must inherit fromjournal, or else the method dispatch will fail. For empty journals, use journal() (not NULL).
length number of transactions in a journal; it uses the length of amount.
split Splits a journal according to f, yielding a list of journals. Often used interactively to haveinformation per sub-journal printed.
subset evaluates an expression in an environment that can access all fields of the journal. Thefunction is meant for interactive analysis; care is needed when it is used within other functions:see Examples and the Manual.
summary provides summary statistics, such as number of trades and average buy/sell prices
toOrg converts a journal to an Org table; package orgutils must be available
For journals that have a length, missing arguments will be coded as NA except for id and account,which become NULL. In zero-length (i.e. ‘empty’) journals, all fields have length 0. A zero-lengthjournal is created, of instance, by saying journal() or when an zero-row data.frame is passed toas.journal.
Value
An object of class journal, which is a list of atomic vectors.
Author(s)
Enrico Schumann <[email protected]>
16 journal
References
Schumann, E. (2019) Portfolio Management with R. http://enricoschumann.net/R/packages/PMwR/
See Also
position, pl
Examples
j <- journal(timestamp = 1:3,amount = c(1,2,3),price = 101:103,instrument = c("Stock A", "Stock A", "Stock B"))
## *** subset *** in functions## this should work as expected ...t0 <- 2.5subset(j, timestamp > t0)
## ... but here?!tradesAfterT <- function(j, t0)
subset(j, timestamp > t0)tradesAfterT(j, 0)
## if really requiredtradesAfterT <- function(j, t0) {
e <- substitute(timestamp > t0, list(t0 = t0))do.call(subset, list(j, e))
}tradesAfterT(j, 0)
## ... or much simplertradesAfterT <- function(j, t0)
j[j$timestamp > t0]tradesAfterT(j, 0)
## *** aggregate ***## several buys and sells on two days## aim: find average buy/sell price per dayj <- journal(timestamp = structure(c(15950, 15951, 15950, 15951, 15950,
15950, 15951, 15951, 15951, 15951),class = "Date"),
amount = c(-3, -4, -3, -1, 3, -2, 1, 3, 5, 3),price = c(104, 102, 102, 110, 106, 104, 104, 106, 108, 107),instrument = c("B", "B", "A", "A", "B", "B", "A", "B", "A", "A"))
by <- list(j$instrument, sign(j$amount), as.Date(j$timestamp))fun <- function(x) {
journal(timestamp = as.Date(x$timestamp[1]),amount = sum(x$amount),
NAVseries 17
price = sum(x$amount*x$price)/sum(x$amount),instrument = x$instrument[1L])
}aggregate(j, by = by, FUN = fun)
## *** iterate over transactions in (previously defined) journal ***for (j in split(j, seq_along(j)))
print(j)
NAVseries Net-Asset-Value (NAV) Series
Description
Create a net-asset-value (NAV) series.
Usage
NAVseries(NAV, timestamp,instrument = NULL, title = NULL, description = NULL,drop.NA = NULL)
as.NAVseries(x, ...)
## S3 method for class 'NAVseries'print(x, ... )
## S3 method for class 'NAVseries'summary(object, ..., monthly.vol = TRUE,
bm = NULL, monthly.te = TRUE,na.rm = FALSE, assume.daily = FALSE)
## S3 method for class 'NAVseries'plot(x, y, ..., xlab = "", ylab = "", type = "l")
## S3 method for class 'NAVseries'window(x, start = NULL, end = NULL, ...)
Arguments
NAV numeric
timestamp time stamp (typically Date or POSIXct)
instrument character
title character
description character
18 NAVseries
x an NAVseries or an object to be coerced to NAVseries
object an NAVseries
... further arguments. For summary, these can be NAVseries.
drop.NA logical
bm an optional NAVseries. If bm does not inherit from NAVseries, as.NAVseriesis tried.
monthly.vol if TRUE (default), volatility computations are done on monthly returns
monthly.te if TRUE (default), tracking error computations are done on monthly returns
assume.daily logical
na.rm logical
y a second NAVseries to be plotted. Not supported yet.
xlab character
ylab character
type character. See plot.
start same class as timestamp; NULL means the first timestamp
end same class as timestamp; NULL means the last timestamp
Details
An NAVseries is a numeric vector (the actual series) and additional information, attached as at-tributes: timestamp, instrument, title, description. Of these attributes, timestamp is the most useful,as it is used for several computations (e.g. when calling summary) or for plotting.
The summary method returns a list of the original NAVseries plus various statistics, such as returnper year and volatility.
Value
an NAVseries: see Details.
an NAVseries summary: a list of lists. If a benchmark series is present, the summary has an attributebm: an integer, specifying the position of the benchmark.
Note
The semantics of handling NAVseries are not stable yet. Currently, objects of class NAVseries areunivariate: you create a single NAVseries, summarise it, plot it, and so one. In the future, at leastsome of the methods will support the multi-variate case, i.e. be able to handle several series at once.
Author(s)
Enrico Schumann <[email protected]>
References
Schumann, E. (2019) Portfolio Management with R. http://enricoschumann.net/PMwR/
pl 19
See Also
btest, journal
Examples
summary(NAVseries(DAX[[1]], as.Date(row.names(DAX)), title = "DAX"))
pl Profit and Loss
Description
Compute profit and (or) loss of financial transactions.
Usage
pl(amount, ... )
## Default S3 method:pl(amount, price, timestamp = NULL,
instrument = NULL, multiplier = 1,multiplier.regexp = FALSE,along.timestamp = FALSE, approx = FALSE,initial.position = NULL, initial.price = NULL,vprice = NULL, tol = 1e-10, do.warn = TRUE,do.sum = FALSE, pl.only = FALSE,footnotes = TRUE, ... )
## S3 method for class 'journal'pl(amount, multiplier = 1,
multiplier.regexp = FALSE,along.timestamp = FALSE, approx = FALSE,initial.position = NULL, initial.price = NULL,vprice = NULL, tol = 1e-10, do.warn = TRUE, ... )
## S3 method for class 'pl'pl(amount, ... )
## S3 method for class 'pl'print(x, ..., use.crayon = NULL, na.print = ".",
footnotes = TRUE)
## S3 method for class 'pl'as.data.frame(x, ... )
.pl(amount, price, tol = 1e-10, do.warn = TRUE)
20 pl
Arguments
amount numeric or a journal
price numeric
instrument character or numeric (though typically character)
timestamp An atomic vector of mode numeric or character. Timestamps should typicallybe sortable.
along.timestamp
logical; or a a vector of timestamps. If the latter, vprice must be specified aswell. See the vignette “Profit/Loss for Open Positions” (pl_open_positions)for details.
initial.position
a position
initial.price prices to evaluate initial position
vprice valuation price; a numeric vector. With several instruments, the prices must benamed, e.g. c(stock1 = 100,stock2 = 101). See Details.
multiplier numeric vector. When instrument is specified and the vector is named, thenames will be matched against instruments.
multiplier.regexp
logical. If TRUE, the names of multiplier are interpreted as regular expressions.See Examples.
approx logical
tol numeric: threshold to consider a position zero.
x a pl object to be printed or to be coerced to a data.frame
... further argument
use.crayon logical
na.print character: how to print NA values
do.warn logical: issue warnings?
do.sum logical: sum profit/loss across instruments?
pl.only logical: if TRUE, return only numeric vector of profit/loss
footnotes logical, with default TRUE: collect and print notes?
Details
Computes profit and/or loss and returns a list with several statistics (see Section Value, below). Toget only the profit/loss numbers as a numeric vector, set argument pl.only to TRUE.
pl is a generic function: The default input is vectors for amount, price, etc. Alternatively (and oftenmore conveniently), the function may also be called with a journal or a data.frame as its input.For data frames, columns must be named amount, price, and so on, as in a journal.
pl may be called in two ways: either to compute total profit/loss from a list of trades, possiblybroken down by instrument and account; or to compute profit/loss over time. The latter casetypically requires setting arguments along.timestamp and/or vprice (see Examples).
pl 21
Using vprice: when along.timestamp is logical (FALSE or TRUE), vprice can be used to value anopen position. For a single asset, it should be a single number; for several assets, it should be namedvector, with names indicating the instrument. When along.timestamp is used to pass a customtimestamp: for a single asset, vprice must be a vector with the same length as along.timestamp;for several assets, it must be a numeric matrix with dimension length(along.timestamp) timesnumber of assets.
To use package crayon – which is only sensible in interactive use –, either explicitly set use.crayonto TRUE or set an option PMwR.use.crayon to TRUE.
Value
For pl, an object of class pl, which is a list of lists: one list for each instrument. Each such listcontains numeric vectors: pl, realised, unrealised, buy, sell, volume.
For .pl, a numeric vector with four elements: profit/loss in units of the instrument, sum of absoluteamounts, average buy price, average sell price.
Author(s)
Enrico Schumann <[email protected]>
References
Schumann, E. (2020) Portfolio Management with R. http://enricoschumann.net/PMwR/
See Also
btest, returns
Examples
J <- journal(timestamp = c( 1, 2, 3),amount = c( 1, 1, -2),price = c(100, 102, 101))
pl(J)
pl(amount = c( 1, 1, -2),price = c(100, 102, 101)) ## without a 'journal'
J <- journal(timestamp = c( 1, 2, 3, 1, 2, 3),amount = c( 1, 1, -2, 1, 1, -2),price = c(100, 102, 101, 100, 102, 105),instrument = c(rep("Bond A", 3), rep("Bond B", 3)))
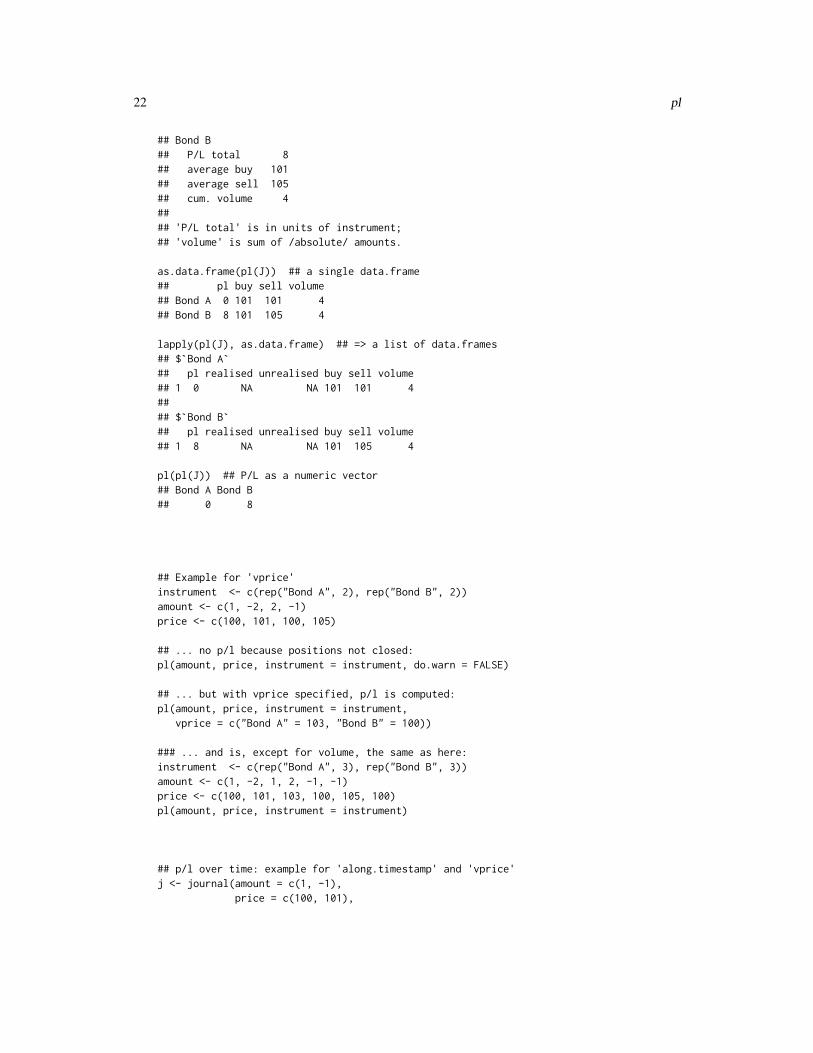
pl(J)## Bond A## P/L total 0## average buy 101## average sell 101## cum. volume 4##
22 pl
## Bond B## P/L total 8## average buy 101## average sell 105## cum. volume 4#### 'P/L total' is in units of instrument;## 'volume' is sum of /absolute/ amounts.
as.data.frame(pl(J)) ## a single data.frame## pl buy sell volume## Bond A 0 101 101 4## Bond B 8 101 105 4
lapply(pl(J), as.data.frame) ## => a list of data.frames## $`Bond A`## pl realised unrealised buy sell volume## 1 0 NA NA 101 101 4#### $`Bond B`## pl realised unrealised buy sell volume## 1 8 NA NA 101 105 4
pl(pl(J)) ## P/L as a numeric vector## Bond A Bond B## 0 8
## Example for 'vprice'instrument <- c(rep("Bond A", 2), rep("Bond B", 2))amount <- c(1, -2, 2, -1)price <- c(100, 101, 100, 105)
## ... no p/l because positions not closed:pl(amount, price, instrument = instrument, do.warn = FALSE)
## ... but with vprice specified, p/l is computed:pl(amount, price, instrument = instrument,
vprice = c("Bond A" = 103, "Bond B" = 100))
### ... and is, except for volume, the same as here:instrument <- c(rep("Bond A", 3), rep("Bond B", 3))amount <- c(1, -2, 1, 2, -1, -1)price <- c(100, 101, 103, 100, 105, 100)pl(amount, price, instrument = instrument)
## p/l over time: example for 'along.timestamp' and 'vprice'j <- journal(amount = c(1, -1),
price = c(100, 101),
plot_trading_hours 23
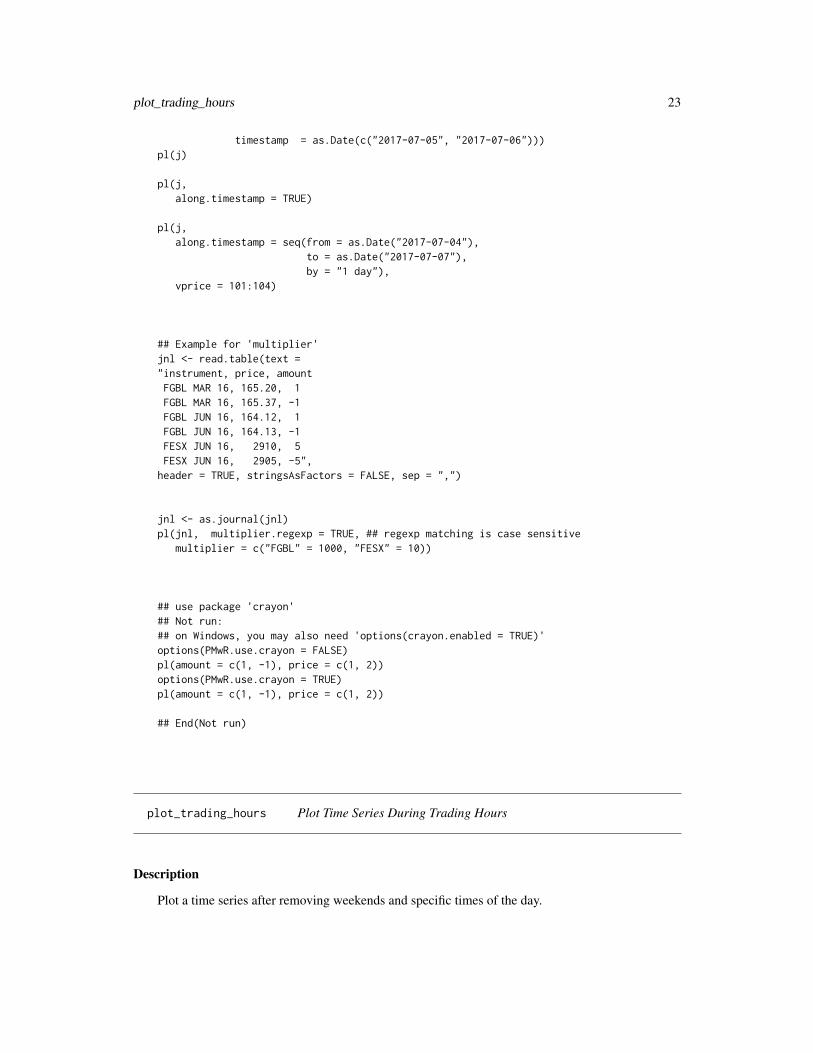
timestamp = as.Date(c("2017-07-05", "2017-07-06")))pl(j)
pl(j,along.timestamp = TRUE)
pl(j,along.timestamp = seq(from = as.Date("2017-07-04"),
to = as.Date("2017-07-07"),by = "1 day"),
vprice = 101:104)
## Example for 'multiplier'jnl <- read.table(text ="instrument, price, amountFGBL MAR 16, 165.20, 1FGBL MAR 16, 165.37, -1FGBL JUN 16, 164.12, 1FGBL JUN 16, 164.13, -1FESX JUN 16, 2910, 5FESX JUN 16, 2905, -5",
header = TRUE, stringsAsFactors = FALSE, sep = ",")
jnl <- as.journal(jnl)pl(jnl, multiplier.regexp = TRUE, ## regexp matching is case sensitive
multiplier = c("FGBL" = 1000, "FESX" = 10))
## use package 'crayon'## Not run:## on Windows, you may also need 'options(crayon.enabled = TRUE)'options(PMwR.use.crayon = FALSE)pl(amount = c(1, -1), price = c(1, 2))options(PMwR.use.crayon = TRUE)pl(amount = c(1, -1), price = c(1, 2))
## End(Not run)
plot_trading_hours Plot Time Series During Trading Hours
Description
Plot a time series after removing weekends and specific times of the day.
24 plot_trading_hours
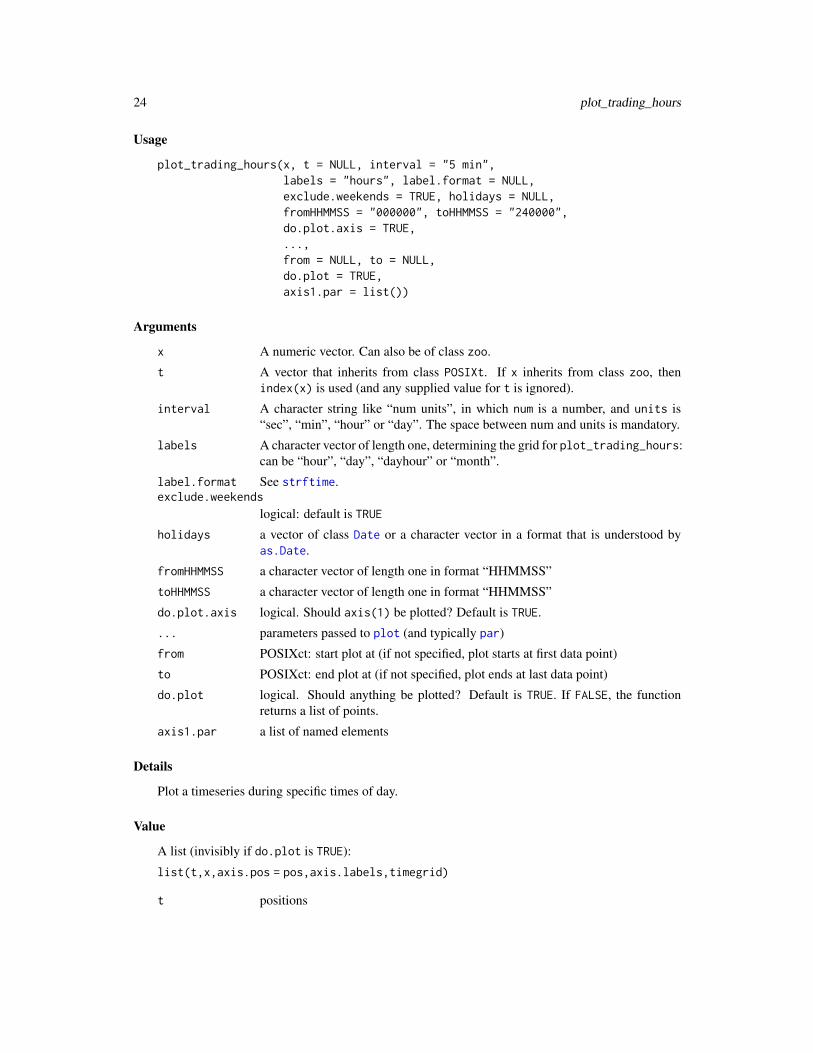
Usage
plot_trading_hours(x, t = NULL, interval = "5 min",labels = "hours", label.format = NULL,exclude.weekends = TRUE, holidays = NULL,fromHHMMSS = "000000", toHHMMSS = "240000",do.plot.axis = TRUE,...,from = NULL, to = NULL,do.plot = TRUE,axis1.par = list())
Arguments
x A numeric vector. Can also be of class zoo.
t A vector that inherits from class POSIXt. If x inherits from class zoo, thenindex(x) is used (and any supplied value for t is ignored).
interval A character string like “num units”, in which num is a number, and units is“sec”, “min”, “hour” or “day”. The space between num and units is mandatory.
labels A character vector of length one, determining the grid for plot_trading_hours:can be “hour”, “day”, “dayhour” or “month”.
label.format See strftime.exclude.weekends
logical: default is TRUE
holidays a vector of class Date or a character vector in a format that is understood byas.Date.
fromHHMMSS a character vector of length one in format “HHMMSS”
toHHMMSS a character vector of length one in format “HHMMSS”
do.plot.axis logical. Should axis(1) be plotted? Default is TRUE.
... parameters passed to plot (and typically par)
from POSIXct: start plot at (if not specified, plot starts at first data point)
to POSIXct: end plot at (if not specified, plot ends at last data point)
do.plot logical. Should anything be plotted? Default is TRUE. If FALSE, the functionreturns a list of points.
axis1.par a list of named elements
Details
Plot a timeseries during specific times of day.
Value
A list (invisibly if do.plot is TRUE):
list(t,x,axis.pos = pos,axis.labels,timegrid)
t positions
position 25
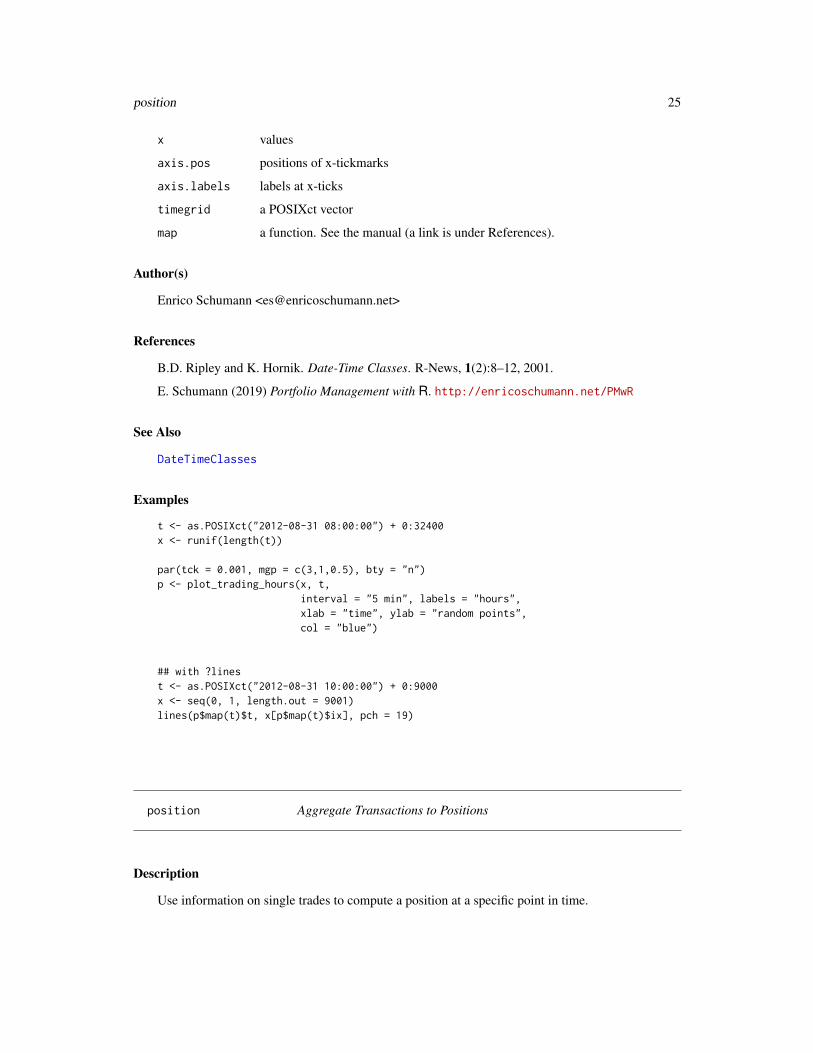
x values
axis.pos positions of x-tickmarks
axis.labels labels at x-ticks
timegrid a POSIXct vector
map a function. See the manual (a link is under References).
Author(s)
Enrico Schumann <[email protected]>
References
B.D. Ripley and K. Hornik. Date-Time Classes. R-News, 1(2):8–12, 2001.
E. Schumann (2019) Portfolio Management with R. http://enricoschumann.net/PMwR
See Also
DateTimeClasses
Examples
t <- as.POSIXct("2012-08-31 08:00:00") + 0:32400x <- runif(length(t))
par(tck = 0.001, mgp = c(3,1,0.5), bty = "n")p <- plot_trading_hours(x, t,
interval = "5 min", labels = "hours",xlab = "time", ylab = "random points",col = "blue")
## with ?linest <- as.POSIXct("2012-08-31 10:00:00") + 0:9000x <- seq(0, 1, length.out = 9001)lines(p$map(t)$t, x[p$map(t)$ix], pch = 19)
position Aggregate Transactions to Positions
Description
Use information on single trades to compute a position at a specific point in time.
26 position
Usage
position(amount, ...)
## Default S3 method:position(amount, timestamp, instrument, when,
drop.zero = FALSE, account = NULL,use.names = NULL, ...)
## S3 method for class 'journal'position(amount, when, drop.zero = FALSE,
use.account = FALSE, ...)
## S3 method for class 'position'print(x, ..., sep = ":")
Arguments
when a timestamp or a vector of timestamps; alternatively, several keywords are sup-ported. See Details.
amount numeric or an object of class journal
timestamp numeric or character: timestamps, must be sortable
instrument character: symbols to identify different instruments
account character: description of account
use.account logical
use.names logical
drop.zero If logical, drop instruments that have a zero position; default is FALSE. If nu-meric, it is used as a tolerance; e.g., a value of 1-e12 will drop any positionwhose absolute amount is smaller than 1-e12.
x An object of type position.
... arguments passed to print
sep A regular expression. Split instruments accordingly. Not implemented yet.
Details
position is a generic function; most useful is the method for journals.
The function checks if timestamp is sorted (see is.unsorted) and sorts the journal by timestamp,if required. If there are (some) NA values in timestamp, but timestamp is sorted otherwise, thefunction will proceed (with a warning, though).
The argument when can also be specified as one of several keywords: last (or newest or latest)provides the position at the latest timestamp; first (or oldest) provides the position at the earliesttimestamp; all provides the positions at all timestamps in the journal. endofday and endofmonthprovide positions at the end of all calendar days and months within the timestamp range of thejournal. The latter keywords can only work if timestamp can be coerced to Date.
pricetable 27
Value
An object of class position, which is a numeric matrix with instrument and timestamp attributes.Note that position will never drop the result’s dim attribute: it will always be a matrix of sizelength(when) times length(unique(instrument)), which may not be obvious from the printedoutput.
To extract the numeric position matrix, say as.matrix(p).
Author(s)
Enrico Schumann
References
Schumann, E. (2018) Portfolio Management with R. http://enricoschumann.net/R/packages/PMwR/
See Also
journal
Examples
position(amount = c(1, 1, -1, 3, -4), timestamp = 1:5, when = 4.9)
## using a journalJ <- journal(timestamp = 1:5, amount = c(1, 1, -1, 3, -4))position(J, when = 4.9)
pricetable Price Table
Description
Create price table
Usage
pricetable(price, ...)
Arguments
price a matrix
... further arguments, passed to methods
28 pricetable
Details
pricetable is a helper function for extracting prices of particular instrument at specified dates.For this, it first creates a table that merges series passed via . . . and appends a class attribute. A [method then allows to extract prices. Importantly, if you ask for a subset of m rows and n columns,the result will be a matrix of size m times n, even if times or instruments are missing.
pricetable is a generic function, currently with methods for numeric vectors (including vectorswith a dim, aka matrices) and for zoo objects.
Value
a numeric matrix with class attribute pricetable
Author(s)
Enrico Schumann
References
Schumann, E. (2020) Portfolio Management with R. http://enricoschumann.net/R/packages/PMwR/
See Also
match
Examples
## quickly creating a pricetablepricetable(1:3)pricetable(1:3, instrument = c("A", "B", "C"))### ... and the samepricetable(c(A = 1, B = 2, C = 3))
## subsetting examplesm <- 3n <- 2price <- array(c(1:m, 1:m + 100), dim = c(m,n))colnames(price) <- LETTERS[1:n]pt <- pricetable(price, timestamp = 1:m)## A B## 1 1 101## 2 2 102## 3 3 103
pt[ , "A"]## A## 1 1## 2 2## 3 3
quote32 29
pt[ , c("X", "A", "X")]## X A X## 1 NA 1 NA## 2 NA 2 NA## 3 NA 3 NA
pt[ , c("X", "A", "X"), missing = 0]## X A X## 1 0 1 0## 2 0 2 0## 3 0 3 0
pt[c(0, 1.5, 4), , missing = "locf"]## A B## 0 NA NA## 1.5 2 102## 4 3 103
quote32 Treasury Quotes with 1/32nds of Point
Description
Print treasury quotes with 1/32nds of points.
Usage
quote32(price, sep = "(-|'|:)", warn = TRUE)q32(price, sep = "(-|'|:)", warn = TRUE)
Arguments
price numeric or character. See Details.
sep character: a regular expression
warn logical. Warn about rounding errors?
Details
The function is meant for pretty-printing of US treasury bond quotes; it provides no other function-ality.
If price is numeric, it is interpreted as a quote in decimal notation and ‘translated’ into a pricequoted in fractions of a point.
If price is character, it is interpreted as a quote in fractional notation.
q32 is a short-hand for quote32.
Value
A numeric vector of class quote32.
30 rc
Author(s)
Enrico Schumann
References
CME Group (2015). Treasury Futures Price Rounding Conventions. https://www.cmegroup.com/education/articles-and-reports/treasury-futures-price-rounding-conventions.html
Examples
quote32(100 + 17/32 + 0.75/32)q32("100-172")
q32("100-272") - q32("100-270")as.numeric(q32("100-272") - q32("100-270"))
rc Return Contribution
Description
Return contribution of portfolio segments.
Usage
rc(R, weights, timestamp, segments = NULL)
Arguments
R returns: a numeric matrix
weights the segment weights: a numeric matrix. weights[i,j] must correspond toR[i,j]
timestamp character or numeric
segments character. If missing, column names of R or of weights are used (if they are notNULL).
Details
The function computes segment contribution, potentially over time. Returns and weights must bearranged in matrices, with rows corresponding to time periods and columns to portfolio segments
Weights can be missing, in which case R is assumed to already comprise segment returns.
rc 31
Value
A list of two components
period_contributions
a data.frametotal_contributions
a numeric vector
Author(s)
Enrico Schumann
References
Feibel, Bruce (2003), Investment Performance Measurement, Wiley.
See Also
returns
Examples
weights <- rbind(c( 0.25, 0.75),c( 0.40, 0.60),c( 0.25, 0.75))
R <- rbind(c( 1 , 0),c( 2.5, -1.0),c(-2 , 0.5))/100
rc(R, weights, segment = c("equities", "bonds"))
## contribution for btest:## run a portfolio 10% equities, 90% bondsP <- as.matrix(merge(DAX, REXP, by = "row.names")[, -1])(bt <- btest(prices = list(P),
signal = function() c(0.1, 0.9),convert.weights = TRUE,initial.cash = 100))
W <- bt$position*P/bt$wealthrc(returns(P)*W[-nrow(W), ])$total_contributions
32 rebalance
rebalance Rebalance Portfolio
Description
Compute the differences between two portfolios.
Usage
rebalance(current, target, price,notional = NULL, multiplier = 1,truncate = TRUE, match.names = TRUE,fraction = 1, drop.zero = FALSE,current.weights = FALSE,target.weights = TRUE)
## S3 method for class 'rebalance'print(x, ..., drop.zero = TRUE)
replace_weight(weights, ..., prefix = TRUE, sep = "::")
Arguments
current the current holdings: a (typically named) vector of position sizes; can also be aposition
target the target holdings: a (typically named) vector of weights; can also be a positionprice the current pricesnotional the value of the portfolio; if missing, replaced by sum(current*prices)
multiplier numeric vector, possibly namedtruncate truncate computed positions? Default is TRUE.match.names logicalfraction numericx an object of class rebalance.... rebalance: arguments passed to print; replace_weight: numeric vectorsdrop.zero logical: should instruments with no difference between current and target be
included?Note the different defaults for computing and printing.
current.weights
logical. If TRUE (the default), the values in current are interpreted as weights. IfFALSE, current is interpreted as a position (i.e. notional/number of contracts).
target.weights logical. If TRUE (the default), the values in target are interpreted as weights. IfFALSE, target is interpreted as a position (i.e. notional/number of contracts).
weights a numeric vector with named componentssep characterprefix logical
rebalance 33
Details
The function computes the necessary trades to move from the current portfolio to a target port-folio.
replace_weight is a helper function to split baskets into their components. All arguments passedvia ... should be named vectors. If names are not syntactically valid (see make.names), quotethem. The passed vectors themselves should be passed as named arguments: see examples.
Value
An object of class rebalance, which is a data.frame:
instrument character, or NA when match.names is FALSE
price prices
current current portfolio
target new portfolio
difference the difference between current and target
Attached to the data.frame are several attributes:
notional notional
match.names logical
multiplier multipliers
Author(s)
Enrico Schumann
References
Schumann, E. (2018) Portfolio Management with R. http://enricoschumann.net/R/packages/PMwR/
See Also
journal
Examples
r <- rebalance(current = c(a = 100, b = 20),target = c(a = 0.2, c = 0.3),price = c(a = 1, b = 2, c = 3))
as.journal(r)
## replace_weight: the passed vectors must be named;## 'basket_3' is ignored because not## component of weights is named## 'basket_3'
34 returns
replace_weight(c(basket_1 = 0.3,basket_2 = 0.7),
basket_1 = c(a = 0.1, b = 0.4, c = .5),basket_2 = c(x = 0.1, y = 0.4, z = .5),basket_3 = c(X = 0.5, Z = 0.5),sep = "|")
returns Compute Returns
Description
Convert prices into returns.
Usage
returns(x, ...)
## Default S3 method:returns(x, t = NULL, period = NULL, complete.first = TRUE,
pad = NULL, position = NULL,weights = NULL, rebalance.when = NULL,lag = 1, ...)
## S3 method for class 'zoo'returns(x, period = NULL, complete.first = TRUE,
pad = NULL, position = NULL,weights = NULL, rebalance.when = NULL, lag = 1, ...)
## S3 method for class 'p_returns'print(x, ..., year.rows = TRUE, month.names = NULL,
zero.print = "0", plus = FALSE, digits = 1,na.print = NULL)
## S3 method for class 'p_returns'toLatex(object, ...,
year.rows = TRUE, ytd = "YTD", month.names = NULL,eol = "\\\\", stand.alone = FALSE)
## S3 method for class 'p_returns'toHTML(x, ...,
year.rows = TRUE, ytd = "YTD", month.names = NULL,stand.alone = TRUE, table.style = NULL, table.class = NULL,th.style = NULL, th.class = NULL,td.style = "text-align:right; padding:0.5em;",td.class = NULL, tr.style = NULL, tr.class = NULL,browse = FALSE)
.returns(x, pad = NULL, lag)
returns 35
Arguments
x for the default method, a numeric vector (possibly with a dim attribute; i.e.a matrix) of prices. returns also supports x of other classes, such as zoo orNAVseries. For time-series classes, argument t should be NULL.For .returns, x must be numeric (for other classes, .returns may not workproperly).
t timestamps. See arguments period and rebalance.when.
period Typically character; supported are "hour", "day", "month", "quarter", "year","ann" (annualised), "ytd" (year-to-date), "mtd" (month-to-date), "itd" (inception-to-date) or a single year, such as "2012". Instead of "itd", "total" may also beused. The value of ‘period’ is used only when timestamp information is avail-able: for instance, when t is not NULL or with zoo/xts objects. The exception is"itd": it can be computed without timestamp information.All returns are computed as simple returns. They will only be annualised withoption "ann"; they will not be annualised when the length of the time series isless than one year. To force annualising in such a case, use "ann!". Annuali-sation can only work when the timestamp t can be coerced to class Date. Theresult will have an attribute is.annualised, which is a logical vector of lengthone.
complete.first logical. For holding-period returns such an monthly or yearly, should the firstperiod (if incomplete) be used.
pad either NULL (no padding of initial lost observation) or a value used for padding(reasonable values might be NA or 0)
position numeric; the same length/dimension as x. This argument is currently ignored.weights either a numeric vector of the same length as the number of assets (i.e. ncol(x)),
or a numeric matrix whose dimensions match those of prices (i.e. dim(x) mustequal dim(weights))
rebalance.when logical or numeric. If x is a time-series class (such as zoo), it may also be of thesame class as the time index of x.
... further arguments to be passed to methods
year.rows logical. If TRUE (the default), print monthly returns with one row per year.
zero.print character. How to print zero values.
na.print character. How to print NA values. (Not supported yet.)
plus logical. Add a ‘+’ before positive numbers? Default is FALSE.
lag The lag for computing returns. A positive integer, defaults to one; ignored fortime-weighted returns or if t is supplied.
object an object of class p_returns (‘period returns’)
month.names character: names of months. Default is an abbreviated month name as providedby the locale. That may cause trouble, notably with toLatex, if such namescontain non-ASCII characters: a safe choice is either the numbers 1 to 12, or thecharacter vector month.abb, which lives in the base package.
digits number of digits in table
ytd header for YTD
36 returns
eol character
stand.alone logical or character
table.class character
table.style character
th.class character
th.style character
td.class character
td.style character
tr.class character
tr.style character
browse logical: open table in browser?
Details
returns is a generic function. It computes simple returns: current values divided by prior valuesminus one. The default method works for numeric vectors/matrices. The function .returns doesthe actual computations and may be used when a ‘raw’ return computation is needed.
Holding-Period Returns:When a timestamp is available, returns can compute returns for specific calendar periods. Seeargument period.
Portfolio Returns:returns may compute returns for a portfolio specified in weights. The portfolio is rebalancedat rebalance.when; the default is every period. Weights need not sum to one. A zero-weightportfolio, or a portfolio that never rebalances (e.g. with rebalance.when set to FALSE), willresult in a zero return.rebalance.when may either be logical, integers or of the same class as a timestamp (e.g. Date).
Value
If called as returns(x): a numeric vector or matrix, possibly with a class attribute (e.g. for a zooseries).
If called with a period argument: an object of class "p_returns" (period returns), which is anumeric vector of returns with attributes t (timestamp) and period. Main use is to have methodsthat pretty-print such period returns; currently, there are methods for toLatex and toHTML.
In some cases, additional attributes may be attached: when portfolio returns were computed (i.e.argument weights was specified), there are attributes holdings and contributions. For holding-period returns, there may be a logical attribute is.annualised, and an attribute from.to, whichtells the start and end date of the holding period.
Author(s)
Enrico Schumann <[email protected]>
REXP 37
See Also
btest, pl
Examples
x <- 101:105returns(x)returns(x, pad = NA)returns(x, pad = NA, lag = 2)
## monthly returnst <- seq(as.Date("2012-06-15"), as.Date("2012-12-31"), by = "1 day")x <- seq_along(t) + 1000returns(x, t = t, period = "month")returns(x, t = t, period = "month", complete.first = FALSE)
### formattingprint(returns(x, t = t, period = "month"), plus = TRUE, digits = 0)
## returns per year (annualised returns)returns(x, t = t, period = "ann") ## less than one year, not annualisedreturns(x, t = t, period = "ann!") ## less than one year, *but* annualised
is.ann <- function(x)attr(x, "is.annualised")
is.ann(returns(x, t = t, period = "ann")) ## FALSEis.ann(returns(x, t = t, period = "ann!")) ## TRUE
## with weights and fixed rebalancing timesprices <- cbind(p1 = 101:105,
p2 = rep(100, 5))R <- returns(prices, weights = c(0.5, 0.5), rebalance.when = 1)## ... => resulting weightsh <- attr(R, "holdings")h*prices / rowSums(h*prices)
REXP REXP
Description
Historical Prices of the REXP.
Usage
data("REXP")
38 scale1
Format
A data frame with 502 observations on the following variable:
REXP a numeric vector
Details
Daily prices.
Examples
str(REXP)
scale1 Scale Time Series
Description
Scale time series so that they can be better compared.
Usage
scale1(x, ...)
## Default S3 method:scale1(x, ..., when = "first.complete", level = 1,
centre = FALSE, scale = FALSE, geometric = TRUE,total.g = NULL)
## S3 method for class 'zoo'scale1(x, ..., when = "first.complete", level = 1,
centre = FALSE, scale = FALSE, geometric = TRUE,inflate = NULL, total.g = NULL)
Arguments
x a time series
when origin: for the default method, either a string or numeric (integer). Allowedstrings are "first.complete" (the default), "first", and "last". For the zoomethod, a value that matches the class of the index of x; for instance, with anindex of class Date, when should inherit from Date.
level numeric
centre logical
scale logical or numeric
geometric logical: if TRUE (the default), the geometric mean is deducted with centre isTRUE; if FALSE, the arithmetic mean is used
streaks 39
inflate numeric: an annual rate at which the series is inflated (or deflated if negative)total.g numeric: to total growth rate (or total return) of a series... other arguments passed to methods
Details
This is a generic function, with methods for numeric vectors and matrices, and zoo objects.
Value
An object of the same type as x.
Author(s)
Enrico Schumann
References
Enrico Schumann – Portfolio Management with R. http://enricoschumann.net/R/packages/PMwR/manual/PMwR.html
See Also
scale
Examples
scale1(cumprod(1 + c(0, rnorm(20, sd = 0.02))), level = 100)
streaks Up and Down Streaks
Description
Compute up and down streaks for time-series.
Usage
streaks(x, ...)
## Default S3 method:streaks(x, up = 0.2, down = -up,
initial.state = NA, y = NULL, ...)## S3 method for class 'zoo'streaks(x, up = 0.2, down = -up,
initial.state = NA, y = NULL, ...)## S3 method for class 'NAVseries'streaks(x, up = 0.2, down = -up,
initial.state = NA, bm = NULL, ...)
40 streaks
Arguments
x a price series
initial.state NA, "up" or "down"
up a number, such as 0.1 (i.e. 10%)
down a negative number, such as -0.1 (i.e. -10%)
y another price series
bm another price series. Mapped to ‘y’ in the default method.
... other arguments passed to methods
Details
streaks is a generic function. It computes series of uninterrupted up and down movements (‘streaks’)in a price series. Uninterrupted is meant in the sense that no countermovement of down (up) percentor more occurs in up (down) movements.
There are methods for numeric vectors, and NAVseries and zoo objects.
The turning points (extreme points) are computed with the benefit of hindsight: the starting point(the low) of an up streak can only be determined once the streak is triggered, i.e. the up streak hasalready run its minimum amount. Vice versa for down streaks.
When ‘up’ and ‘down’ are not equal, results may be inconsistent: in the current implementation,streaks alternates between up and down streaks. Suppose up is large compared with down, i.e. ittakes long to trigger up streaks, but they are easily broken. Down streaks, on the other hand, arequickly triggered but rarely broken. Now suppose that a down streak is broken by an up streak: itmay then well be that the up streak would never have been counted as such, because it was actuallybroken itself by another down streak. The implementation for differing values of ‘up’ and ‘down’may change in the future.
Value
A data.frame:
start beginning of streak
end end of streak
state up, down or NA
return the return over the streak. If y was specified, geometric excess return is com-puted (see Examples).
Author(s)
Enrico Schumann <[email protected]>
See Also
drawdowns
toHTML 41
Examples
streaks(DAX[[1]], t = as.Date(row.names(DAX)))
## results <- streaks(x = <...>, y = <...>)#### ===> *arithmetic* excess returns## x[results$end]/x[results$start] -## y[results$end]/y[results$start]## ===> *geometric* excess returns## x[results$end]/x[results$start] /## (y[results$end]/y[results$start]) - 1
toHTML Import from package textutils
Description
The toHTML function is imported from package textutils. Help is available at textutils::toHTML.Say library("textutils") in your code to use the function.
Trade-Analysis Analysing Trades: Compute Profit/Loss, Resize and more
Description
Functions to help analyse trades (as opposed to profit-and-loss series)
Usage
scale_trades(amount, price, timestamp, aggregate = FALSE,fun = NULL, ...)
split_trades(amount, price, timestamp, aggregate = FALSE)
limit(amount, price, timestamp, lim, tol = 1e-8)scale_to_unity(amount)close_on_first(amount)
tw_exposure(amount, timestamp, start, end, abs.value = TRUE)
42 Trade-Analysis
Arguments
amount notionals
price a vector of prices
timestamp a vector.
aggregate TRUE or FALSE
fun a function
lim a maximum absolute position size
start optional time
end optional time
abs.value logical. If TRUE, the absolute exposure is computed.
... passed on to fun
tol numeric
Details
scale_trades takes a vector of notionals, prices and scales all trades along the paths so that themaximum exposure is 1.
The default fun divides every element of a vector n by max(abs(cumsum(n))). If user-specified,the function fun needs to take a vector of notionals (changes in position.)
split_trades decomposes a trade list into single trades, where a single trade comprises thosetrades from a zero position to the next zero position.
Value
Either a list or a list-of-lists.
Author(s)
Enrico Schumann
See Also
btest
Examples
n <- c(1,1,-3,-1,2)p <- 100 + 1:length(n)timestamp <- 1:length(n)
split_trades(n, p, timestamp)split_trades(n, p, timestamp, TRUE) ## almost like the original series
scale_trades(n, p, timestamp)scale_trades(n, p, timestamp, TRUE) ## each _trade_ gets scaled
unit_prices 43
unit_prices Compute Prices for Portfolio Based on Units
Description
Compute prices for a portfolio based on outstanding shares.
Usage
unit_prices(NAV, cashflows,initial.price = 100, initial.shares = 0,cf.included = FALSE)
Arguments
NAV a dataframe of two columns: timestamp and net asset value
cashflows a data.frame of two or three columns: timestamp, cashflow and (optionally) anid
initial.price initial price
initial.shares number of outstanding shares for first NAV
cf.included logical
Details
The function may be used to compute the returns for a portfolio with external cashflows, i.e. whatis usually called time-weighted returns.
Valuation (i.e. the computation of the NAV) must take place before external cashflows. Fairnesssuggests that: what price would you give an external investor if you had not valued the positions?And even if fairness mattered not: suppose we traded on a specific day, had a positive PL, and endedthe day in cash. We could then not differentiate any more between a cash increase because of anexternal inflow and a cash increase because of a profitable trade.
Value
A data.frame
timestamp
NAV total NAV
price NAV per share
shares outstanding shares before cashflows, used for valuation
cashflow external cashflows
new_shares shares add/subtracted
total_shares total outstanding shares after cashflows
NAV_after_cf total NAV after cashflows
44 valuation
Author(s)
Enrico Schumann
References
Schumann, E. (2018) Portfolio Management with R. http://enricoschumann.net/PMwR/
See Also
returns, pl
Examples
NAV <- data.frame(timestamp = seq(as.Date("2017-1-1"),as.Date("2017-1-10"),by = "1 day"),
NAV = c(0,101:104,205:209))
cf <- data.frame(timestamp = c(as.Date("2017-1-1"),as.Date("2017-1-5")),
cashflow = c(100, 100))
unit_prices(NAV, cf)
valuation Valuation
Description
Valuation of financial objects: map an object into a quantity that is measured in a concrete (typicallycurrency) unit.
Usage
valuation(x, ...)
## S3 method for class 'journal'valuation(x, multiplier = 1,
cashflow = function(x, ...) x$amount * x$price,instrument = function(x, ...) "cash",flip.sign = TRUE, ...)
## S3 method for class 'position'valuation(x, price.table, multiplier = 1,
do.sum = FALSE,price.unit, verbose = TRUE, do.warn = TRUE, ...)
valuation 45
Arguments
x an object
multiplier a numeric vector, typically with named elements
cashflow either a numeric vector or a function that takes on argument (a journal) andtransforms it into a numeric vector
instrument either a character vector or a function that takes on argument (a journal) andtransforms it into a character vector
flip.sign logical. If TRUE (the default), a positive amount gets mapped into a negativecashflow.
price.table numeric: a matrix whose elements correspond to those in x. If only a singletimestamp is used and the position is named, this may also be a named numericvector; see Examples.
do.sum logical: sum over positions
price.unit a named character vector. Not implemented.
verbose logical
do.warn logical
... other arguments passed to methods
Details
valuation is a generic function. Its semantics suggest that an object (e.g. a financial instrument ora position) is mapped into a concrete quantity (such as an amount of some currency).
The journal method transforms the transactions in a journal into amounts of currency (e.g, a saleof 100 shares of a company is transformed into the value of these 100 shares).
The position method takes a position and returns the value (in currency units) of the position.
Value
depends on the object: for journals, a journal
Note
Very experimental.
Author(s)
Enrico Schumann <[email protected]>
References
Schumann, E. (2020) Portfolio Management with R. http://enricoschumann.net/R/packages/PMwR/
See Also
journal
46 valuation
Examples
## valuing a JOURNAL
j <- journal(amount = 10, price = 2)## amount price## 1 10 2#### 1 transaction
valuation(j, instrument = NA)## amount price## 1 -20 1#### 1 transaction
## valuing a POSITIONpos <- position(c(AMZN = -10, MSFT = 200))
### contructing a price table:### ==> P[i, j] must correspond to pos[i, j]P <- array(c(2200, 170), dim = c(1, 2))colnames(P) <- instrument(pos)
valuation(pos, price.table = P)## AMZN MSFT## [1,] -22000 34000
### contructing a price table, alternative:### a named vector### ==> only works when there is only a single timestampvaluation(pos, price.table = c(MSFT = 170, AMZN = 2200))
all.equal(valuation(pos, price.table = P),valuation(pos, price.table = c(MSFT = 170, AMZN = 2200)))
Index
∗ Backtestingbtest, 4
∗ chronplot_trading_hours, 23
∗ datasetsDAX, 9REXP, 37
∗ hplotplot_trading_hours, 23
∗ packagePMwR-package, 2
∗ tsplot_trading_hours, 23
.pl (pl), 19
.returns (returns), 34[.journal (journal), 13[.pricetable (pricetable), 27[<-.journal (journal), 13
Adjust-Series, 3aggregate.journal (journal), 13all.equal.journal (journal), 13as.data.frame, 14as.data.frame.journal (journal), 13as.data.frame.pl (pl), 19as.Date, 24as.journal (journal), 13as.matrix.position (position), 25as.NAVseries, 18as.NAVseries (NAVseries), 17
btest, 4, 15, 19, 21, 37, 42
c, 14c.journal (journal), 13character, 20close_on_first (Trade-Analysis), 41
data.frame, 10, 15, 20, 40Date, 5, 17, 24, 26, 35, 36, 38
DateTimeClasses, 25DAX, 9dim, 28div_adjust (Adjust-Series), 3drawdown, 10drawdowns, 10, 40
environment, 7
grep, 14grepl, 14, 15
head.journal (journal), 13
instrument, 11instrument<- (instrument), 11is.journal (journal), 13is.unsorted, 26is_valid_ISIN, 12
journal, 7, 13, 19, 20, 26, 27, 33, 45
length.journal (journal), 13limit (Trade-Analysis), 41
make.names, 33match, 28month.abb, 35
NA, 6, 7, 15, 35, 40NAVseries, 17, 35, 40NULL, 15numeric, 20
options, 14
p_returns (returns), 34par, 24pl, 16, 19, 37, 44plot, 18, 24plot.NAVseries (NAVseries), 17
47
48 INDEX
plot_trading_hours, 23plotTradingHours (plot_trading_hours),
23PMwR (PMwR-package), 2PMwR-package, 2position, 11, 16, 20, 25, 45POSIXct, 17pricetable, 27print, 26, 32print.journal (journal), 13print.NAVseries (NAVseries), 17print.p_returns (returns), 34print.pl (pl), 19print.position (position), 25print.rebalance (rebalance), 32
q32 (quote32), 29quote32, 29
rc, 30rebalance, 32replace_weight (rebalance), 32returns, 21, 31, 34, 44REXP, 37
scale, 39scale1, 38scale_to_unity (Trade-Analysis), 41scale_trades (Trade-Analysis), 41sort, 14sort.journal (journal), 13split.journal (journal), 13split_adjust (Adjust-Series), 3split_trades (Trade-Analysis), 41streaks, 10, 39strftime, 24subset.journal (journal), 13summary, 18summary.journal (journal), 13summary.NAVseries (NAVseries), 17
tail.journal (journal), 13textutils::toHTML, 41toHTML, 36, 41toHTML.p_returns (returns), 34toLatex, 36toLatex.p_returns (returns), 34Trade-Analysis, 41tw_exposure (Trade-Analysis), 41
txtProgressBar, 6
unit_prices, 43
valuation, 44
window.NAVseries (NAVseries), 17
zoo, 28
![[XLS] · Web view0.4 1 3 8 0.1 0.1 1 2 0.1 0.1 1 3 0.1 0.15 1 4 0.1 0.15 1 4 0.1 0.15 1 4 0.1 0.1 1 2 0.1 0.15 1 4 0.1 0.1 1 3 0.1 0.1 1 3 0.1 0.1 1 3 0.1 0.15 1 4 0.1 0.1 1 3 0.1](https://img.pdfslide.net/doc/110x75/5ab00b917f8b9a3a038e2f4f/xls-view04-1-3-8-01-01-1-2-01-01-1-3-01-015-1-4-01-015-1-4-01-015-1.jpg)
![[XLS] · Web view2 1 0.75 0.75 0.1 0.1 3 1 0.75 0.75 0.1 0.1 4 1 0.5 0.75 0.15 0.1 4 1 0.5 0.75 0.15 0.1 4 1 0.5 0.75 0.15 0.1 2 1 0.75 0.75 0.1 0.1 4 1 0.5 0.75 0.15 0.1 3 1 0.75](https://img.pdfslide.net/doc/110x75/5ad2a5ef7f8b9a0f198ca6d1/xls-view2-1-075-075-01-01-3-1-075-075-01-01-4-1-05-075-015-01-4-1.jpg)