Embed Size (px)
Citation preview

Package ‘FactoClass’February 15, 2013
Version 1.0.8
Date 2012-01-25
Title Combination of Factorial Methods and Cluster Analysis
Author Campo Elias Pardo <[email protected]> and Pedro Cesar delCampo <[email protected]>, with the contributions fromCamilo Jose Torres <[email protected]>, Ivan Diaz<[email protected]>, Mauricio Sadinle <[email protected]>.
Maintainer Campo Elias Pardo <[email protected]>
Depends R (>= 2.7.0), ade4, xtable
Description Multivariate exploration of a data table with factorial analysis and cluster methods.
License GPL (>= 2)
Encoding latin1
Repository CRAN
Date/Publication 2012-02-01 08:13:22
NeedsCompilation yes
R topics documented:Bogota . . . . . . . . . . . . . . . . . . . . . . . . . . . . . . . . . . . . . . . . . . . . 2BreedsDogs . . . . . . . . . . . . . . . . . . . . . . . . . . . . . . . . . . . . . . . . . 2centroids . . . . . . . . . . . . . . . . . . . . . . . . . . . . . . . . . . . . . . . . . . . 3cluster.carac . . . . . . . . . . . . . . . . . . . . . . . . . . . . . . . . . . . . . . . . . 4ColorAdjective . . . . . . . . . . . . . . . . . . . . . . . . . . . . . . . . . . . . . . . 5dudi.tex . . . . . . . . . . . . . . . . . . . . . . . . . . . . . . . . . . . . . . . . . . . 6Fac.Num . . . . . . . . . . . . . . . . . . . . . . . . . . . . . . . . . . . . . . . . . . . 7FactoClass . . . . . . . . . . . . . . . . . . . . . . . . . . . . . . . . . . . . . . . . . . 8FactoClass.tex . . . . . . . . . . . . . . . . . . . . . . . . . . . . . . . . . . . . . . . . 10kmeansW . . . . . . . . . . . . . . . . . . . . . . . . . . . . . . . . . . . . . . . . . . 12
1

2 BreedsDogs
list.to.data . . . . . . . . . . . . . . . . . . . . . . . . . . . . . . . . . . . . . . . . . . 13planfac . . . . . . . . . . . . . . . . . . . . . . . . . . . . . . . . . . . . . . . . . . . . 14plotFactoClass . . . . . . . . . . . . . . . . . . . . . . . . . . . . . . . . . . . . . . . . 16stableclus . . . . . . . . . . . . . . . . . . . . . . . . . . . . . . . . . . . . . . . . . . 17Vietnam . . . . . . . . . . . . . . . . . . . . . . . . . . . . . . . . . . . . . . . . . . . 19ward.cluster . . . . . . . . . . . . . . . . . . . . . . . . . . . . . . . . . . . . . . . . . 20
Index 22
Bogota Localities by Stratums in Bogota City
Description
Contingency Table that indicates the number of blocks of Bogota, in localities by stratums (DAPD1997, p.77).
Usage
data(Bogota)
Format
Object whit class data.frame of 19 rows and 7 columns.
Source
DAPD (1997), Population, stratification and socioeconomic aspects of Bogota
References
C.E. Pardo y J.E. Ortiz (2004). Analisis multivariado de datos en R. Simposio de Estadistica,Cartagena Colombia. http://www.docentes.unal.edu.co/cepardot/analmultir.pdf
BreedsDogs Breeds of Dog
Description
Table that describes 27 breeds of dog considering their size, weight, speed, intelligence, affectivity,aggressiveness and function.
Usage
data(BreedsDogs)
Format
Object of class data.frame with 27 rows and 7 columns with the following description:

centroids 3
VARIABLE CATEGORIES[,1] Size(SIZE) Small(sma) Mediun(med) Large(lar)[,2] Weight(WEIG) lightweight(lig) Mediun(med) Heavy(hea)[,3] Speed(SPEE) Low(low) Mediun(med) High(hig)[,4] Intelligence(INTE) Low(low) Mediun(med) High(hig)[,5] Affectivity(AFFE) Low(low) High(hig)[,6] aggressiveness(AGGR) Low(low) High(hig)[,7] function(FUNC) Company(com) Hunt(hun) Utility(uti)
Source
Fine, J. (1996), ’Iniciacion a los analisis de datos multidimensionales a partir de ejemplos’, Notasde clase, Montevideo.
References
Brefort, A.(1982), ’Letude des races canines a partir de leurs caracteristiques qualitatives’, HEC -Jouy en Josas
centroids Centroids of the Classes of a Partition
Description
It evaluates the centroids of a partition with the weights in rw
Usage
centroids(df,cl,rw=rep(1/nrow(df),nrow(df)))
Arguments
df object of class data.frame, with the data of variables or coordinates
cl vector indicating the cluster of each element
rw weight of the rows of df, by default the same
Value
Object of class list with the following:
centroids class centroids
weights class weights
Author(s)
Campo Elias Pardo <[email protected]>

4 cluster.carac
Examples
data(iris)centroids(iris[,-5],iris[,5])
cluster.carac Cluster Characterization by Variables
Description
It makes the characterization of the classes or cluster considering the variables in tabla. Thesevariables can be quantitative, qualitative or frequencies.
Usage
cluster.carac( tabla , clase , tipo.v="d" , v.lim = 2 )
Arguments
tabla object data.frame with variables of characterization, the variables must be of asingle type (quantitative, qualitative or frequencies)
clase vector that determines the partition of the table
tipo.v type of variables: quantitative("continuas"), qualitative ("nominales") or fre-quencies("frecuencia")
v.lim test value to show the variable or category like characteristic.
Details
For nominal or frecuency variables it compares the percentage of the categories within each classwith the global percentage. For continuous variables it compares the average within each class withthe general average. Categories and variables are ordered within each class by the test values and itshows only those that pass the threshold v.lim.
Value
Object of class list. It has the characterization of each class or cluster.
Author(s)
Pedro Cesar del Campo <[email protected]>, Campo Elias Pardo <[email protected]>,Mauricio Sadinle <[email protected]>
References
Lebart, L. and Morineau, A. and Piron, M. (1995) Statisitique exploratoire multidimensionnelle,Paris.

ColorAdjective 5
Examples
data(BreedsDogs)BD.act <- BreedsDogs[-7] # active variablesBD.function <- subset(BreedsDogs,select=7)cluster.carac(BD.act,BD.function,"ca",2.0) # nominal variables
data(iris)iris.act <- Fac.Num(iris)$numericclase <- Fac.Num(iris)$factorcluster.carac(iris.act,clase,"co",2.0) # continuous variables
# frequency variablesdata(BreedsDogs)attach(BreedsDogs)weig<-table(FUNc,WEIG)weig<-data.frame(weig[,1],weig[,2],weig[,3])cluster.carac(weig, row.names(weig), "fr", 2) # frequency variablesdetach(BreedsDogs)
ColorAdjective Associations between colors and adjectives.
Description
A group of students from Nanterre University (Paris X) were presented with a list of eleve colours:blue, yellow, red, white, pink, brown, purple, grey, black, green and orange. Each person in thegroup was asked to describe each color with one ore more adjectives. A final list of 89 adjectiveswere associates with eleven colors.
Usage
data(ColorAdjective)
Format
Object of class data.frame with 89 rows and 11 columns.
Source
Jambu, M. and Lebeaux M.O. Cluster Analysis and Data Analysis. North-Holland. Amsterdam1983.
References
Fine, J. (1996), Iniciacion a los analisis de datos multidimensionales a partir de ejemplos, Notasde curso, Montevideo
6 dudi.tex
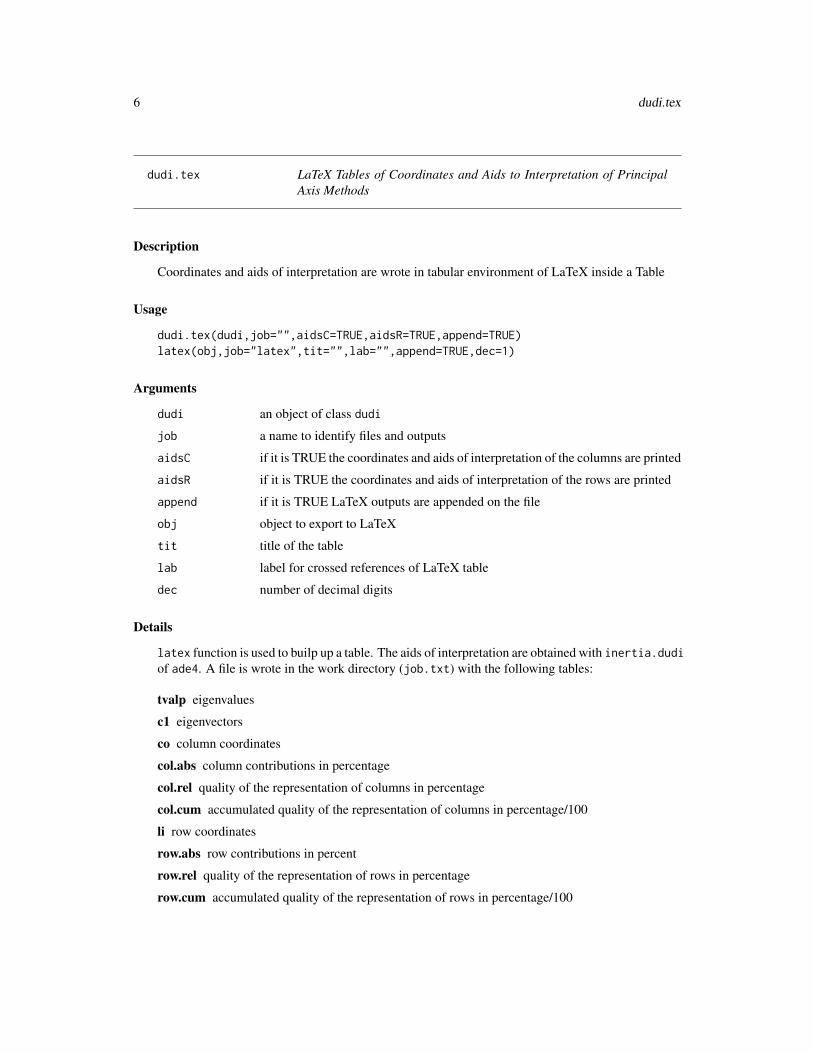
dudi.tex LaTeX Tables of Coordinates and Aids to Interpretation of PrincipalAxis Methods
Description
Coordinates and aids of interpretation are wrote in tabular environment of LaTeX inside a Table
Usage
dudi.tex(dudi,job="",aidsC=TRUE,aidsR=TRUE,append=TRUE)latex(obj,job="latex",tit="",lab="",append=TRUE,dec=1)
Arguments
dudi an object of class dudi
job a name to identify files and outputs
aidsC if it is TRUE the coordinates and aids of interpretation of the columns are printed
aidsR if it is TRUE the coordinates and aids of interpretation of the rows are printed
append if it is TRUE LaTeX outputs are appended on the file
obj object to export to LaTeX
tit title of the table
lab label for crossed references of LaTeX table
dec number of decimal digits
Details
latex function is used to builp up a table. The aids of interpretation are obtained with inertia.dudiof ade4. A file is wrote in the work directory (job.txt) with the following tables:
tvalp eigenvalues
c1 eigenvectors
co column coordinates
col.abs column contributions in percentage
col.rel quality of the representation of columns in percentage
col.cum accumulated quality of the representation of columns in percentage/100
li row coordinates
row.abs row contributions in percent
row.rel quality of the representation of rows in percentage
row.cum accumulated quality of the representation of rows in percentage/100

Fac.Num 7
Author(s)
Campo Elías PARDO <[email protected]>
Examples
data(ardeche)coa1 <- dudi.coa(ardeche$tab, scann = FALSE, nf = 4)dudi.tex(coa1,job="Ardeche")
Fac.Num Division of qualitative and quantitative variables
Description
An object of class data.frame is divided into a list with two tables, one with quantitative variablesand the other with qualitative variables.
Usage
Fac.Num(tabla)
Arguments
tabla object of class ’data.frame’
Value
It returns one list with one or two objects of class data.frame with the following characteristics:
factor table with the qualitative variables
numeric table with the quantitative variables
Author(s)
Pedro Cesar Del Campo <[email protected]>
Examples
data(BreedsDogs)Fac.Num(BreedsDogs)
data(iris)Fac.Num(iris)

8 FactoClass
FactoClass Combination of Factorial Methods and Cluster Analysis
Description
Performs the factorial analysis of the data and a cluster analysis using the nfcl first factorial coor-dinates
Usage
FactoClass( dfact, metodo, dfilu = NULL , nf = 2, nfcl = 10, k.clust = 3,scanFC = TRUE , n.max = 5000 , n.clus = 1000 ,sign = 2.0,conso=TRUE , n.indi = 25,row.w = rep(1, nrow(dfact)) )
## S3 method for class ’FactoClass’print(x, ...)analisis.clus(X,W)
Arguments
dfact object of class data.frame, with the data of active variables.
metodo function of ade4 for ade4 factorial analysis, dudi.pca,Principal ComponentAnalysis; dudi.coa, Correspondence Analysis; witwit.coa, Internal Corre-spondence Analysis; dudi.acm, Multiple Correspondence Analysis ...
dfilu ilustrative variables (default NULL)
nf number of axes to use into the factorial analysis (default 2)
nfcl number of axes to use in the classification (default 10)
k.clust number of classes to work (default 3)
scanFC if is TRUE, it asks in the console the values nf, nfcl y k.clust
n.max when rowname(dfact)>=n.max, k-means is performed previous to hierarchicalclustering (default 5000)
n.clus when rowname(fact)>=n.max, the previous k-means is performed with n.clusgroups (default 1000)
sign threshold test value to show the characteristic variables and modalities
conso when conso is TRUE, the process of consolidating the classification is per-formed (default TRUE)
n.indi number of indices to draw in the histogram (default 25)
row.w vector containing the row weights if metodo<>dudi.coa
x object of class FactoClass
... further arguments passed to or from other methods
X coordinates of the elements of a class
W weights of the elements of a class

FactoClass 9
Details
Lebart et al. (1995) present a strategy to analyze a data table using multivariate methods, consistingof an intial factorial analysis according to the nature of the compiled data, followed by the perfor-mance of mixed clustering. The mixed clustering combines hierarchic clustering using the Ward’smethod with K-means clustering. Finally a partition of the data set and the characterization of eachone of the classes is obtained, according to the active and illustrative variables, being quantitative,qualitative or frequency.
FactoClass is a function that connects procedures of the package ade4 to perform the analysisfactorial of the data and from stats for the cluster analysis.
The function analisis.clus calculates the geometric characteristics of each class: size, inertia,weight and square distance to the origin.
For impression in LaTeX format see FactoClass.tex
To draw factorial planes with cluster see plotFactoClass
Value
object of class FactoClass with the following:
dudi object of class dudi from ade4 with the specifications of the factorial analysis
nfcl number of axes selected for the classification
k number of classes
indices table of indices obtained through WARD method
cor.clus coordinates of the clusters
clus.summ summary of the clusters
cluster vector indicating the cluster of each element
carac.cate cluster characterization by qualitative variables
carac.cont cluster characterization by quantitative variables
carac.frec cluster characterization by frequency active variables
Author(s)
Pedro Cesar del Campo <[email protected]>, Campo Elias Pardo <[email protected]>http://www.docentes.unal.edu.co/cepardot, Ivan Diaz <[email protected]>, MauricioSadinle <[email protected]>
References
Lebart, L. and Morineau, A. and Piron, M. (1995) Statisitique exploratoire multidimensionnelle,Paris.

10 FactoClass.tex
Examples
# Cluster analysis with Correspondence Analysisdata(ColorAdjective)FC.col <-FactoClass(ColorAdjective, dudi.coa)6105
FC.col
FC.col$dudi
# Cluster analysis with Multiple Correspondence Analysisdata(BreedsDogs)
BD.act <- BreedsDogs[-7] # active variablesBD.ilu <- BreedsDogs[7] # ilustrative variables
FC.bd <-FactoClass( BD.act, dudi.acm, k.clust = 4,scanFC = FALSE, dfilu = BD.ilu, nfcl = 10)
FC.bd
FC.bd$clus.summFC.bd$indices
FactoClass.tex Table of Coordinates, Aids of Interpretation of the Principal Axes andCluster Analysis in LaTeX format.
Description
The coordinates, aids of interpretation and results of cluster analysis of an object of class FactoClassare written in tables for edition in LaTeX format and written in a file.
Usage
FactoClass.tex(FC,job="",append=TRUE, dir = getwd(), p.clust = FALSE )
## S3 method for class ’FactoClass.tex’print(x, ...)
latexDF(obj, job="latex" ,tit="" ,lab="" ,append=TRUE ,dec=1,dir = getwd() , to.print = TRUE )
roundDF(tabla,dec=1)
FactoClass.tex 11
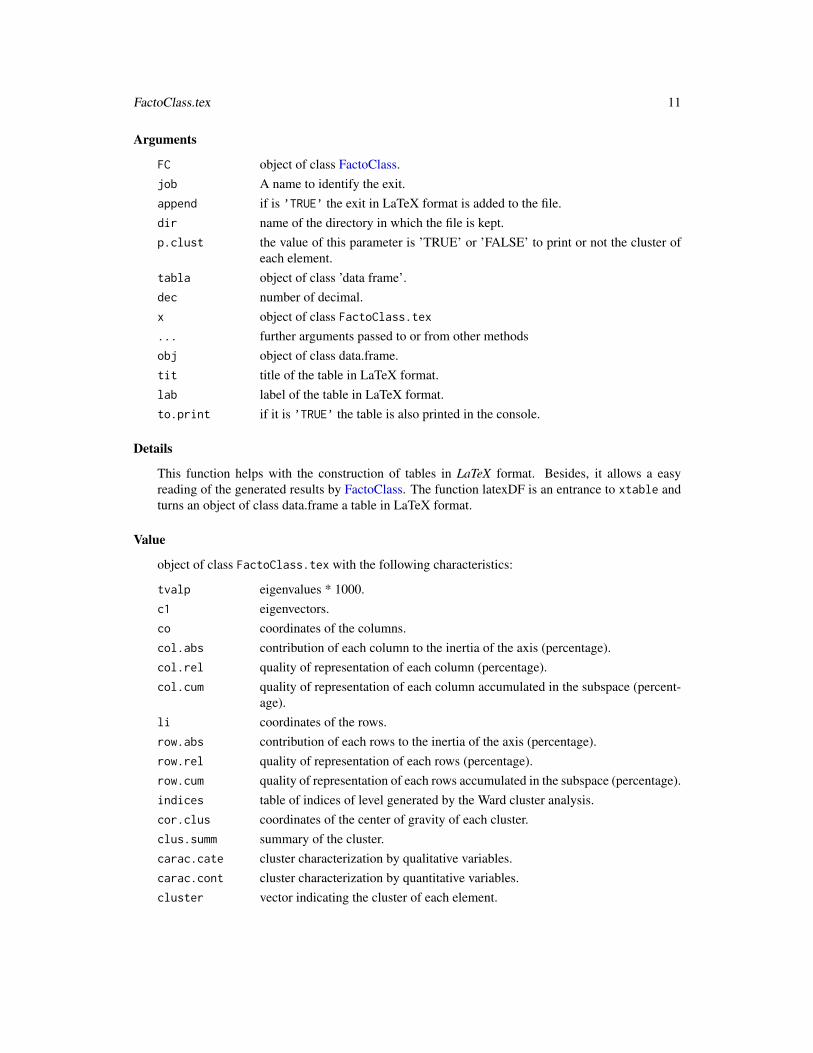
Arguments
FC object of class FactoClass.job A name to identify the exit.append if is ’TRUE’ the exit in LaTeX format is added to the file.dir name of the directory in which the file is kept.p.clust the value of this parameter is ’TRUE’ or ’FALSE’ to print or not the cluster of
each element.tabla object of class ’data frame’.dec number of decimal.x object of class FactoClass.tex... further arguments passed to or from other methodsobj object of class data.frame.tit title of the table in LaTeX format.lab label of the table in LaTeX format.to.print if it is ’TRUE’ the table is also printed in the console.
Details
This function helps with the construction of tables in LaTeX format. Besides, it allows a easyreading of the generated results by FactoClass. The function latexDF is an entrance to xtable andturns an object of class data.frame a table in LaTeX format.
Value
object of class FactoClass.tex with the following characteristics:
tvalp eigenvalues * 1000.c1 eigenvectors.co coordinates of the columns.col.abs contribution of each column to the inertia of the axis (percentage).col.rel quality of representation of each column (percentage).col.cum quality of representation of each column accumulated in the subspace (percent-
age).li coordinates of the rows.row.abs contribution of each rows to the inertia of the axis (percentage).row.rel quality of representation of each rows (percentage).row.cum quality of representation of each rows accumulated in the subspace (percentage).indices table of indices of level generated by the Ward cluster analysis.cor.clus coordinates of the center of gravity of each cluster.clus.summ summary of the cluster.carac.cate cluster characterization by qualitative variables.carac.cont cluster characterization by quantitative variables.cluster vector indicating the cluster of each element.

12 kmeansW
Author(s)
Pedro Cesar del Campo <[email protected]>, Campo Elias Pardo <[email protected]>
Examples
data(BreedsDogs)BD.act <- BreedsDogs[-7] # active variablesBD.ilu <- BreedsDogs[7] # illustrative variables# MCAFaCl <- FactoClass( BD.act, dudi.acm,
scanFC = FALSE, dfilu = BD.ilu, nfcl = 10, k.clust = 4 )FactoClass.tex(FaCl,job="BreedsDogs1", append=TRUE)FactoClass.tex(FaCl,job="BreedsDogs", append=TRUE , p.clust = TRUE)
kmeansW K-means with Weights of the Elements
Description
It is a modification of kmeans Hartigan-Wong algorithm to consider the weight of the elements toclassify.
Usage
kmeansW(x, centers, weight = rep(1,nrow(x)),iter.max = 10, nstart = 1)
Arguments
x A numeric vector, matrix or data frame.
centers Either the number of clusters or a set of initial (distinct) cluster centres. If anumber, a random set of (distinct) rows in x is chosen as the initial centres.
weight weight of the elements of x. by default the same.
iter.max The maximum number of iterations allowed.
nstart If centers is a number, how many random sets should be chosen?
Details
With the ’Hartigan-Wong’ algorithm, this function performs the K-means clustering diminishinginertia intra classes. In this version the Fortran code kmnsW.f was changed by C++ code kmeanw.ccprogramed by Camilo Jose Torres, modifing C code programed by Burkardt.
Value
object of class FactoClass.tex with the following characteristics:
cluster vector indicating the cluster of each element.
...

list.to.data 13
Author(s)
Camilo José Torres <[email protected]>, Campo Elias Pardo <[email protected]>
References
Hartigan, J. A. and Wong, M. A. (1979). A K-means clustering algorithm. Applied Statistics 28,100–108.
Burkardt, J. (2008). ASA136 The K-Means Algorithm. http://people.sc.fsu.edu/~burkardt/cpp_src/asa136/asa136.html
Examples
data(Bogota)ac.bog <- Bogota[-1]il.bog <- Bogota[ 1]
acs <- dudi.coa( ac.bog, nf=6 , scannf = FALSE )
kmeansW( acs$li, 7, acs$lw )
list.to.data list to data.frame
Description
Modification of an object of class list into an object of class data.frame.
Usage
list.to.data(lista,nvar="clasif")
Arguments
lista list that contains several data.frame of the same structure.
nvar (Optional) Name of the new variable that considers the partition given by theelements of the list.
Details
This function turns an object of class list into an object of class data.frame, this function is usedinternally to create objects of class data.frame to make tables in LaTeX format.
Value
Object of class data.frame.

14 planfac
Author(s)
Pedro Cesar Del Campo <[email protected]>
Examples
A <- data.frame(r1=rnorm(5),r2=rnorm(5))B <- data.frame(r1=rnorm(15),r2=rnorm(15))
LL <- list(A=A,B=B)LLlist.to.data(LL)
planfac Correspondence Analysis Factorial Planes
Description
It plots factorial planes of a correspondence analysis
Usage
planfac(dudi,x=1,y=2,xlim=NULL,ylim=NULL,rotx=FALSE,roty=FALSE,roweti=row.names(dudi$li),coleti=row.names(dudi$co),titre=NULL,axislabel=TRUE,col.row="black",col.col="blue",cex=0.8,cex.row=0.8,cex.col=0.8,all.point=TRUE,Trow=TRUE,Tcol=TRUE,cframe=1.2,ucal=0,
cex.global=1,infaxes="out")sutil.grid(cgrid,scale=TRUE)
Arguments
dudi object of type dudi
x number indentifying the factor to be used as horizontal axis. Default x=1
y number indentifying the factor to be used as vertical axis. Default y=2
xlim the x limits (x1, x2) of the plot
ylim the y limits of the plot
rotx TRUE if you want change the sign of the horizontal coordinates. Default FALSE
roty TRUE if you want change the sign of the vertical coordinates. Default FALSE
roweti selected row points for the graphic. Default all points
coleti selected column points for the graphic. Default all points
titre graphic title
axislabel if it is TRUE the axis information is written

planfac 15
col.row color for row points and row labels. Default "black"
col.col color for column points and column labels. Default "blue"
cex global scale for the labels. Default cex=0.8
cex.row scale for row points and row labels. Default cex.row=0.8
cex.col scale for column points and column labels. Default cex.col=0.8
all.point If if is TRUE, all points are outlined. Default all.point=TRUE
Trow if it is TRUE the row points are outlined. Default TRUE
Tcol if it is TRUE the column points are outlined. Default TRUE
cframe scale for graphic limits
ucal quality representation threshold (percentage) in the plane . Default ucal=0
cex.global scale for the label sizes
infaxes place to put the axes information: "out","in","no". Default infaxes="out". Ifinfaxes="out" the graphic is similar to FactoMineR graphics, otherwise the styleis similar to the one in ade4, without axes information when infaxes="no"
cgrid sutil.grid internal
scale sutil.grid internal
Details
Plot the selected factorial plane. sutil.grid is used by planfac
Value
It graphs the factorial plane x,y using $co, $li of a "dudi" "coa" object. If ucal > 0, the functioninertia.dudi is used to calculate the quality of representation on the plane
Author(s)
Campo Elias Pardo <[email protected]>
http://www.docentes.unal.edu.co/cepardot
Examples
data(ardeche)ca <- dudi.coa(ardeche$tab,scannf=FALSE,nf=4)# FactoMineR styleplanfac(ca,ucal=40,all.point=FALSE,titre="SCA of Ardeche, First Factorial Plane")dev.new()# ade4 styleplanfac(ca,x=3,y=4,ucal=20,all.point=FALSE,infaxes="in",titre="SCA ofArdeche, Plane 3-4")

16 plotFactoClass
plotFactoClass Factorial Planes Showing the Classes
Description
For objects of class FactoClass it graphs a factorial plane showing the center of gravity of the cluster,and identifying with colors the cluster to which each element belongs.
Usage
plotFactoClass(FC , x=1, y=2,xlim=NULL,ylim=NULL, rotx=FALSE, roty=FALSE,roweti=row.names(dudi$li),coleti=row.names(dudi$co),titre=NULL, axislabel=TRUE,col.row=1:FC$k, col.col="blue", cex=0.8, cex.row=0.8, cex.col=0.8,all.point=TRUE, Trow=TRUE, Tcol=TRUE,cframe=1.2, ucal=0,cex.global=1, infaxes="out",nclus=paste("cl", 1:FC$k, sep=""),cex.clu=cex.row,cstar=1 )
Arguments
FC object of class FactoClass.
x number indentifying the factor to be used as horizontal axis. Default x=1
y number indentifying the factor to be used as vertical axis. Default y=2
xlim the x limits (x1, x2) of the plot
ylim the y limits of the plot
rotx TRUE if you want change the sign of the horizontal coordinates (default FALSE).
roty TRUE if you want change the sign of the vertical coordinates (default FALSE).
roweti selected row points for the graphic. Default all points.
coleti selected column points for the graphic. Default all points.
titre graphics title.
axislabel if it is TRUE the axis information is written.
col.row color for row points and row labels. Default 1:FC$k.
col.col color for column points and column labels. Default "grey55".
cex global scale for the labels. Default cex=0.8.
cex.row scale for row points and row labels. Default cex.row=0.8.
cex.col scale for column points and column labels. Default cex.col=0.8.
cex.clu scale for cluster points and cluster labels. (default cex.row).
all.point if if is TRUE, all points are outlined. Default all.point=TRUE.
Trow if it is TRUE the row points are outlined. Default TRUE.
Tcol if it is TRUE the column points are outlined. Default TRUE.

stableclus 17
nclus labels for the clusters (default cl1, cl2, ...
cframe scale for graphics limits
ucal quality Representation Threshold in the plane. Default ucal=0
cex.global scale for the label sizes
infaxes place to put the axes information: "out","in","no". Default infaxes="out". Ifinfaxes="out" the graphic is similar to FactoMineR graphics, otherwise the styleis similar to the one in ade4, without axes information when infaxes="no"
cstar length of the rays between the centroids of the classes and their points
Details
It draws the factorial plane with the clusters. Only for objects FactoClass see FactoClass. Thefactorial plane is drawn with planfac and the classes are projected with s.class of ade4
Value
It draws the factorial plane x, y using $co, $li of the object of class FactoClass. If ucal > 0, thefunction inertia.dudi is used to calculate the quality of representation in the plane.
Author(s)
Campo Elías Pardo <[email protected]> Pedro Cesar del Campo <[email protected]>,
Examples
data(Bogota)Bog.act <- Bogota[-1]Bog.ilu <- Bogota[ 1]
FC.Bogota<-FactoClass(Bog.act, dudi.coa,Bog.ilu,nf=2,nfcl=5,k.clust=5,scanFC=FALSE)
plotFactoClass(FC.Bogota,titre="Primer plano factorial del ACS de la TC de manzanas de Bogota",col.row=c("maroon2","orchid4","darkgoldenrod2","dark red","aquamarine4"))
stableclus Stable clusters for cluster analysis
Description
Performs Stable Cluster Algorithm for cluster analysis, using factorial coordinates from a dudiobject
Usage
stableclus(dudi,part,k.clust,ff.clus=NULL,bplot=TRUE,kmns=FALSE)

18 stableclus
Arguments
dudi A dudi object, result of a previous factorial analysis using ade4 or FactoClass
part Number of partitions
k.clust Number of clusters in each partition
ff.clus Number of clusters for the final output, if NULL it asks in the console (DefaultNULL)
bplot if TRUE, prints frequencies barplot of each cluster in the product partition (De-fault TRUE)
kmns if TRUE, the process of consolidating the classification is performed (DefaultFALSE)
Details
Diday (1972) (cited by Lebart et al. (2006)) presented a method for cluster analysis in an attemptto solve one of the inconvinients with the kmeans algorithm, which is convergence to local optims.Stable clusters are built by performing different partitions (using kmeansW algorithmn), each onewith different initial points. The groups are then formed by selecting the individuals belonging tothe same cluster in every partion.
Value
object of class stableclus with the following characteristics:
cluster vector indicating the cluster of each element.
...
Author(s)
Carlos Andrés Arias <[email protected]>, Campo Elias Pardo <[email protected]>
References
Arias, C. A.; Zarate, D.C. and Pardo C.E. (2009), ’Implementacion del metodo de grupos estables enel paquete FactoClass de R’, in: XIX Simposio Colombiano de Estadistica. Estadisticas OficialesMedellín Colombia, Julio 16 al 20 de 2009 Universidad Nacional de Colombia. Bogota. http://www.docentes.unal.edu.co/cepardot/docs/
Lebart, L. (2008), ’DtmVic: Data and Text Mining - Visualization, Inference, Classification. Ex-ploratory statistical processing of complex data sets comprising both numerical and textual data.’,Web. http://egsh.enst.fr/lebart/
Lebart, L., Morineau, A., Lambert, T. and Pleuvret, P. (1999), SPAD. Systéme Pour L’Analyse desDonées, Paris. http://www.spad.eu
Lebart, L., Piron, M. and Morineau, A. (2006), Statisitique exploratoire multidimensionnelle. Vi-sualisation et inférence en fouilles de données, 4 edn, Dunod, Paris.

Vietnam 19
Examples
data(ColorAdjective)FCcol <-FactoClass(ColorAdjective, dudi.coa,nf=6,nfcl=10,k.clust=7,scanFC = FALSE)acs <- FCcol$dudistableclus(acs,3,3,4,TRUE,TRUE)
Vietnam Student opinions about the Vietnam War
Description
The newspaper of the students of the University of Chapel Hill (North Carolina) conducted a surveyof student opinions about the Vietnam War in May 1967. Responses were classified by sex, year inthe program and one of four opinions:
A defeat power of North Vietnam by widespread bombing and land invasion
B follow the present policy
C withdraw troops to strong points and open negotiations on elections involving the Viet Cong
D immediate withdrawal of all U.S. troops
Usage
data(Vietnam)
Format
The 3147 consulted students were classified considering the sex, year of study and chosen strategy,originating a contingency table of 10 rows: M1 to M5 and F1 to F5 (the years of education are from1 to 5 and sexes are male (M) and female (F)) and 4 columns A, B, C and D.
Source
Fine, J. (1996), ’Iniciación a los análisis de datos multidimensionales a partir de ejemplos’, Notesof course, Montevideo
References
Julian Faraway (2007). faraway: Functions and datasets for books by Julian Faraway, R packageversion 1.0.2, http://www.maths.bath.ac.uk/

20 ward.cluster
ward.cluster Hierarchic Classification by Ward’s Method
Description
Performs the classification by Ward’s method from the matrix of Euclidean distances.
Usage
ward.cluster(dista, peso = NULL , plots = TRUE, h.clust = 2, n.indi = 25 )
Arguments
dista matrix of Euclidean distances ( class(dista)=="dist" ).
peso (Optional) weight of the individuals, by default equal weights
plots it makes dendrogram and histogram of the Ward’s method
h.clust if it is ’0’ returns a object of class hclust and a table of level indices, if it is ’1’returns a object of class hclust, if it is ’2’ returns a table of level indices.
n.indi number of indices to draw in the histogram (default 25).
Details
It is an entrance to the function h.clus to obtain the results of the procedure presented in Lebart etal. (1995). Initially the matrix of distances of Ward of the elements to classify is calculated:
The Ward’s distance between two elements to classify $i$ and $l$ is given by:
W (i, l) = (mi ∗ml)/(mi +mi) ∗ dist(i, l)2
where $m_i$ y $m_l$ are the weights and $dist(i,l)$ is the Euclidean distance between them.
Value
It returns an object of class hclust and a table of level indices (depending of h.clust). If plots =TRUE it draws the indices of level and the dendrogram.
Author(s)
Pedro Cesar del Campo <[email protected]>, Campo Elias Pardo <[email protected]>http://www.docentes.unal.edu.co/cepardot
References
Lebart, L. and Morineau, A. and Piron, M. (1995) Statisitique exploratoire multidimensionnelle,Paris.

ward.cluster 21
Examples
data(ardeche)ca <- dudi.coa(ardeche$tab,scannf=FALSE,nf=4)
ward.cluster( dista= dist(ca$li), peso=ca$lw )
dev.new()HW <- ward.cluster( dista= dist(ca$li), peso=ca$lw ,h.clust = 1)plot(HW)rect.hclust(HW, k=4, border="red")

Index
∗Topic clusterFactoClass, 8kmeansW, 12plotFactoClass, 16stableclus, 17
∗Topic datasetsBogota, 2BreedsDogs, 2ColorAdjective, 5Vietnam, 19
∗Topic hplotcluster.carac, 4planfac, 14plotFactoClass, 16ward.cluster, 20
∗Topic multivariatecentroids, 3cluster.carac, 4dudi.tex, 6Fac.Num, 7FactoClass, 8FactoClass.tex, 10kmeansW, 12list.to.data, 13planfac, 14plotFactoClass, 16stableclus, 17ward.cluster, 20
analisis.clus (FactoClass), 8
Bogota, 2BreedsDogs, 2
centroids, 3cluster.carac, 4ColorAdjective, 5
dudi.tex, 6
Fac.Num, 7
FactoClass, 8, 11, 16, 17FactoClass.tex, 9, 10
kmeansW, 12
latex (dudi.tex), 6latexDF (FactoClass.tex), 10list.to.data, 13
planfac, 14plotFactoClass, 9, 16print.FactoClass (FactoClass), 8print.FactoClass.tex (FactoClass.tex),
10
roundDF (FactoClass.tex), 10
stableclus, 17sutil.grid (planfac), 14
Vietnam, 19
ward.cluster, 20
22


![Fitriandi Dudi Aprillianto Kepramukaan[Sandi-menyandi]](https://img.pdfslide.net/doc/110x75/559ac5661a28abcd138b4609/fitriandi-dudi-aprillianto-kepramukaansandi-menyandi.jpg)