Embed Size (px)
Citation preview

Package ‘FRESA.CAD’November 27, 2018
Type Package
Title Feature Selection Algorithms for Computer Aided Diagnosis
Version 3.1.0
Date 2018-10-30
Author Jose Gerardo Tamez-Pena, Antonio Martinez-Torteya and Israel Alanis
Maintainer Jose Gerardo Tamez-Pena <[email protected]>
Description Contains a set of utilities for building and testing statistical models (linear, logis-tic,ordinal or COX) for Computer Aided Diagnosis/Prognosis applications. Utilities in-clude data adjustment, univariate analysis, model building, model-validation, longitudinal analy-sis, reporting and visualization.
License LGPL (>= 2)
Depends Rcpp (>= 0.10.0),stringr,miscTools,Hmisc,pROC
LinkingTo Rcpp, RcppArmadillo
Suggestsnlme,rpart,gplots,RColorBrewer,class,cvTools,glmnet,randomForest,survival,e1071,MASS,naivebayes,mRMRe,epiR,DescTools,irr
NeedsCompilation yes
Repository CRAN
Date/Publication 2018-11-27 08:50:03 UTC
R topics documented:FRESA.CAD-package . . . . . . . . . . . . . . . . . . . . . . . . . . . . . . . . . . . 3backVarElimination_Bin . . . . . . . . . . . . . . . . . . . . . . . . . . . . . . . . . . 8backVarElimination_Res . . . . . . . . . . . . . . . . . . . . . . . . . . . . . . . . . . 10baggedModel . . . . . . . . . . . . . . . . . . . . . . . . . . . . . . . . . . . . . . . . 11barPlotCiError . . . . . . . . . . . . . . . . . . . . . . . . . . . . . . . . . . . . . . . . 13benchmarking . . . . . . . . . . . . . . . . . . . . . . . . . . . . . . . . . . . . . . . . 14bootstrapValidation_Bin . . . . . . . . . . . . . . . . . . . . . . . . . . . . . . . . . . 18bootstrapValidation_Res . . . . . . . . . . . . . . . . . . . . . . . . . . . . . . . . . . 21bootstrapVarElimination_Bin . . . . . . . . . . . . . . . . . . . . . . . . . . . . . . . . 23bootstrapVarElimination_Res . . . . . . . . . . . . . . . . . . . . . . . . . . . . . . . . 25
1

2 R topics documented:
BSWiMS.model . . . . . . . . . . . . . . . . . . . . . . . . . . . . . . . . . . . . . . . 26cancerVarNames . . . . . . . . . . . . . . . . . . . . . . . . . . . . . . . . . . . . . . 31crossValidationFeatureSelection_Bin . . . . . . . . . . . . . . . . . . . . . . . . . . . . 32crossValidationFeatureSelection_Res . . . . . . . . . . . . . . . . . . . . . . . . . . . . 37CVsignature . . . . . . . . . . . . . . . . . . . . . . . . . . . . . . . . . . . . . . . . . 41EmpiricalSurvDiff . . . . . . . . . . . . . . . . . . . . . . . . . . . . . . . . . . . . . 42ensemblePredict . . . . . . . . . . . . . . . . . . . . . . . . . . . . . . . . . . . . . . . 44featureAdjustment . . . . . . . . . . . . . . . . . . . . . . . . . . . . . . . . . . . . . . 45FilterUnivariate . . . . . . . . . . . . . . . . . . . . . . . . . . . . . . . . . . . . . . . 46ForwardSelection.Model.Bin . . . . . . . . . . . . . . . . . . . . . . . . . . . . . . . . 48ForwardSelection.Model.Res . . . . . . . . . . . . . . . . . . . . . . . . . . . . . . . . 50FRESA.Model . . . . . . . . . . . . . . . . . . . . . . . . . . . . . . . . . . . . . . . 52FRESAScale . . . . . . . . . . . . . . . . . . . . . . . . . . . . . . . . . . . . . . . . 56getKNNpredictionFromFormula . . . . . . . . . . . . . . . . . . . . . . . . . . . . . . 57getSignature . . . . . . . . . . . . . . . . . . . . . . . . . . . . . . . . . . . . . . . . . 58getVar.Bin . . . . . . . . . . . . . . . . . . . . . . . . . . . . . . . . . . . . . . . . . . 60getVar.Res . . . . . . . . . . . . . . . . . . . . . . . . . . . . . . . . . . . . . . . . . . 61heatMaps . . . . . . . . . . . . . . . . . . . . . . . . . . . . . . . . . . . . . . . . . . 63improvedResiduals . . . . . . . . . . . . . . . . . . . . . . . . . . . . . . . . . . . . . 65KNN_method . . . . . . . . . . . . . . . . . . . . . . . . . . . . . . . . . . . . . . . . 66LASSO . . . . . . . . . . . . . . . . . . . . . . . . . . . . . . . . . . . . . . . . . . . 67listTopCorrelatedVariables . . . . . . . . . . . . . . . . . . . . . . . . . . . . . . . . . 68LM_RIDGE_MIN . . . . . . . . . . . . . . . . . . . . . . . . . . . . . . . . . . . . . 69modelFitting . . . . . . . . . . . . . . . . . . . . . . . . . . . . . . . . . . . . . . . . . 70mRMR.classic_FRESA . . . . . . . . . . . . . . . . . . . . . . . . . . . . . . . . . . . 71NAIVE_BAYES . . . . . . . . . . . . . . . . . . . . . . . . . . . . . . . . . . . . . . 71nearestNeighborImpute . . . . . . . . . . . . . . . . . . . . . . . . . . . . . . . . . . . 72plot.bootstrapValidation_Bin . . . . . . . . . . . . . . . . . . . . . . . . . . . . . . . . 73plot.bootstrapValidation_Res . . . . . . . . . . . . . . . . . . . . . . . . . . . . . . . . 74plot.FRESA_benchmark . . . . . . . . . . . . . . . . . . . . . . . . . . . . . . . . . . 75plotModels.ROC . . . . . . . . . . . . . . . . . . . . . . . . . . . . . . . . . . . . . . 76predict.fitFRESA . . . . . . . . . . . . . . . . . . . . . . . . . . . . . . . . . . . . . . 77predict.FRESAKNN . . . . . . . . . . . . . . . . . . . . . . . . . . . . . . . . . . . . 78predict.FRESAsignature . . . . . . . . . . . . . . . . . . . . . . . . . . . . . . . . . . 78predict.FRESA_LASSO . . . . . . . . . . . . . . . . . . . . . . . . . . . . . . . . . . 79predict.FRESA_NAIVEBAYES . . . . . . . . . . . . . . . . . . . . . . . . . . . . . . 80predict.FRESA_RIDGE . . . . . . . . . . . . . . . . . . . . . . . . . . . . . . . . . . . 80predictionStats . . . . . . . . . . . . . . . . . . . . . . . . . . . . . . . . . . . . . . . 81randomCV . . . . . . . . . . . . . . . . . . . . . . . . . . . . . . . . . . . . . . . . . . 82rankInverseNormalDataFrame . . . . . . . . . . . . . . . . . . . . . . . . . . . . . . . 85reportEquivalentVariables . . . . . . . . . . . . . . . . . . . . . . . . . . . . . . . . . . 87residualForFRESA . . . . . . . . . . . . . . . . . . . . . . . . . . . . . . . . . . . . . 88signatureDistance . . . . . . . . . . . . . . . . . . . . . . . . . . . . . . . . . . . . . . 89summary.bootstrapValidation_Bin . . . . . . . . . . . . . . . . . . . . . . . . . . . . . 90summary.fitFRESA . . . . . . . . . . . . . . . . . . . . . . . . . . . . . . . . . . . . . 91summaryReport . . . . . . . . . . . . . . . . . . . . . . . . . . . . . . . . . . . . . . . 92timeSerieAnalysis . . . . . . . . . . . . . . . . . . . . . . . . . . . . . . . . . . . . . . 93uniRankVar . . . . . . . . . . . . . . . . . . . . . . . . . . . . . . . . . . . . . . . . . 94

FRESA.CAD-package 3
univariateRankVariables . . . . . . . . . . . . . . . . . . . . . . . . . . . . . . . . . . 97update.uniRankVar . . . . . . . . . . . . . . . . . . . . . . . . . . . . . . . . . . . . . 101updateModel.Bin . . . . . . . . . . . . . . . . . . . . . . . . . . . . . . . . . . . . . . 102updateModel.Res . . . . . . . . . . . . . . . . . . . . . . . . . . . . . . . . . . . . . . 103
Index 105
FRESA.CAD-package FeatuRE Selection Algorithms for Computer-Aided Diagnosis(FRESA.CAD)
Description
Contains a set of utilities for building and testing formula-based models for Computer Aided Di-agnosis/prognosis applications via feature selection. Bootstrapped Stage Wise Model Selection(B:SWiMS) controls the false selection (FS) for linear, logistic, or Cox proportional hazards regres-sion models. Utilities include functions for: univariate/longitudinal analysis, data conditioning (i.e.covariate adjustment and normalization), model validation and visualization.
Details
Package: FRESA.CADType: PackageVersion: 3.1.0Date: 2018-10-30License: LGPL (>= 2)
Purpose: The design of diagnostic or prognostic multivariate models via the selection of signifi-cantly discriminant features. The models are selected via the bootstrapped step-wise selection ofmodel features that offer a significant improvement in subject classification/error. The false selec-tion control is achieved by train-test partitions, where train sets are used to select variables and testsets used to evaluate model performance. Variables that do not improve subject classification/erroron the blind test are not included in the models. The main function of this package is the selectionand cross-validation of diagnostic/prognostic linear, logistic, or Cox proportional hazards regres-sion model constructed from a large set of candidate features. The variable selection may start byconditioning all variables via a covariate-adjustment and a z-inverse-rank-transformation. In orderto integrate features with partial discriminant power, the package can be used to categorize the con-tinuous variables and rank their discriminant power. Once ranked, each feature is bootstrap-tested ina multivariate model, and its blind performance is evaluated. Variables with a statistical significantimprovement in classification/error are stored and finally inserted into the final model according totheir relative store frequency. A cross-validation procedure may be used to diagnose the amount ofmodel shrinkage produced by the selection scheme.
Author(s)
Jose Gerardo Tamez-Pena, Antonio Martinez-Torteya and Israel Alanis Maintainer: <[email protected]>
4 FRESA.CAD-package
References
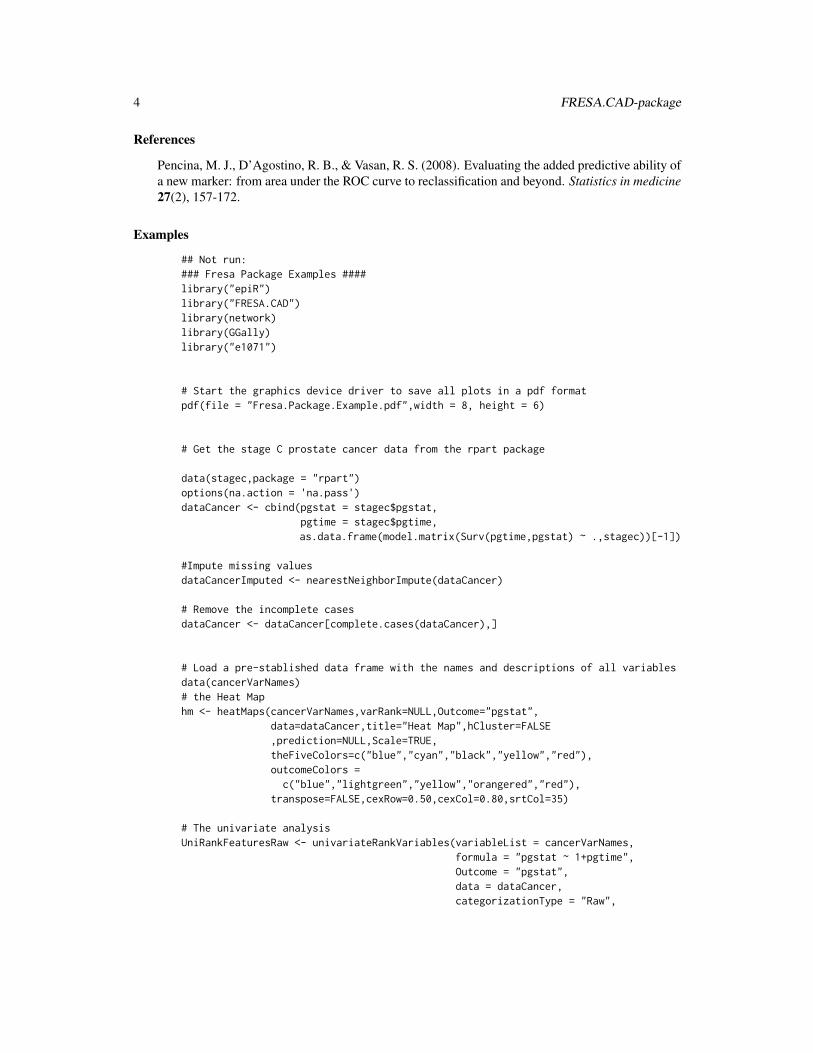
Pencina, M. J., D’Agostino, R. B., & Vasan, R. S. (2008). Evaluating the added predictive ability ofa new marker: from area under the ROC curve to reclassification and beyond. Statistics in medicine27(2), 157-172.
Examples
## Not run:### Fresa Package Examples ####library("epiR")library("FRESA.CAD")library(network)library(GGally)library("e1071")
# Start the graphics device driver to save all plots in a pdf formatpdf(file = "Fresa.Package.Example.pdf",width = 8, height = 6)
# Get the stage C prostate cancer data from the rpart package
data(stagec,package = "rpart")options(na.action = 'na.pass')dataCancer <- cbind(pgstat = stagec$pgstat,
pgtime = stagec$pgtime,as.data.frame(model.matrix(Surv(pgtime,pgstat) ~ .,stagec))[-1])
#Impute missing valuesdataCancerImputed <- nearestNeighborImpute(dataCancer)
# Remove the incomplete casesdataCancer <- dataCancer[complete.cases(dataCancer),]
# Load a pre-stablished data frame with the names and descriptions of all variablesdata(cancerVarNames)# the Heat Maphm <- heatMaps(cancerVarNames,varRank=NULL,Outcome="pgstat",
data=dataCancer,title="Heat Map",hCluster=FALSE,prediction=NULL,Scale=TRUE,theFiveColors=c("blue","cyan","black","yellow","red"),outcomeColors =
c("blue","lightgreen","yellow","orangered","red"),transpose=FALSE,cexRow=0.50,cexCol=0.80,srtCol=35)
# The univariate analysisUniRankFeaturesRaw <- univariateRankVariables(variableList = cancerVarNames,
formula = "pgstat ~ 1+pgtime",Outcome = "pgstat",data = dataCancer,categorizationType = "Raw",

FRESA.CAD-package 5
type = "LOGIT",rankingTest = "zIDI",description = "Description",uniType="Binary")
print(UniRankFeaturesRaw)
# A simple BSIWMS Model
BSWiMSModel <- BSWiMS.model(formula = Surv(pgtime, pgstat) ~ 1, dataCancerImputed)
# The Log-Rank Analysis using survdiff
lrsurvdiff <- survdiff(Surv(pgtime,pgstat)~BSWiMSModel$BSWiMS.model$back.model$linear.predictors > 0,data=dataCancerImputed)
# The Log-Rank Analysis EmpiricalSurvDiff and permutations of the null Chi distributionlrp <- EmpiricalSurvDiff(dataCancerImputed$pgtime,dataCancerImputed$pgstat,
BSWiMSModel$BSWiMS.model$back.model$linear.predictors > 0,type="Chi",plots=TRUE,samples=10000)
# The Log-Rank Analysis EmpiricalSurvDiff and permutations of the null SLR distributionlrp <- EmpiricalSurvDiff(dataCancerImputed$pgtime,dataCancerImputed$pgstat,
BSWiMSModel$BSWiMS.model$back.model$linear.predictors > 0,type="SLR",plots=TRUE,samples=10000)
# The Log-Rank Analysis EmpiricalSurvDiff and bootstrapping the SLR distributionlrp <- EmpiricalSurvDiff(dataCancerImputed$pgtime,dataCancerImputed$pgstat,
BSWiMSModel$BSWiMS.model$back.model$linear.predictors > 0,computeDist=TRUE,plots=TRUE)
#The performance of the final model using the summary functionsm <- summary(BSWiMSModel$BSWiMS.model$back.model)print(sm$coefficients)pv <- plot(sm$bootstrap)
# The equivalent modeleq <- reportEquivalentVariables(BSWiMSModel$BSWiMS.model$back.model,data=dataCancer,
variableList=cancerVarNames,Outcome = "pgstat",timeOutcome="pgtime",type = "COX");
print(eq$equivalentMatrix)
#The list of all models of the bootstrap forward selectionprint(BSWiMSModel$forward.selection.list)
#With FRESA.CAD we can do a leave-one-out using the list of modelspm <- ensemblePredict(BSWiMSModel$forward.selection.list,
dataCancer,predictType = "linear",type="LOGIT",Outcome="pgstat")
#Ploting the ROC with 95

6 FRESA.CAD-package
pm <- plotModels.ROC(cbind(dataCancer$pgstat,pm$ensemblePredict),main=("LOO Forward Selection Median Predict"))
#The plotModels.ROC provides the diagnosis confusion matrix.summary(epi.tests(pm$predictionTable))
#FRESA.CAD can be used to create a bagged model using the forward selection formulasbagging <- baggedModel(BSWiMSModel$forward.selection.list,dataCancer,useFreq=32)pm <- predict(bagging$bagged.model)pm <- plotModels.ROC(cbind(dataCancer$pgstat,pm),main=("Bagged"))
#Let's check the performance of the modelsm <- summary(bagging$bagged.model)print(sm$coefficients)
#Using bootstrapping object I can check the Jaccard Indexprint(bagging$Jaccard.SM)
#Ploting the evolution of the coefficient valueplot(bagging$coefEvolution$grade,main="Evolution of grade")
gplots::heatmap.2(bagging$formulaNetwork,trace="none",mar=c(10,10),main="eB:SWIMS Formula Network")
barplot(bagging$frequencyTable,las = 2,cex.axis=1.0,cex.names=0.75,main="Feature Frequency")
n <- network::network(bagging$formulaNetwork, directed = FALSE,ignore.eval = FALSE,names.eval = "weights")
ggnet2(n, label = TRUE, size = "degree",size.cut = 3,size.min = 1,mode = "circle",edge.label = "weights",edge.label.size=4)
# Get a Cox proportional hazards model using:# - The default parameters
mdCOXs <- FRESA.Model(formula = Surv(pgtime, pgstat) ~ 1,data = dataCancer)sm <- summary(mdCOXs$BSWiMS.model)print(sm$coefficients)
# The model with singificant improvement in the residual errormdCOXs <- FRESA.Model(formula = Surv(pgtime, pgstat) ~ 1,
data = dataCancer,OptType = "Residual" )sm <- summary(mdCOXs$BSWiMS.model)print(sm$coefficients)
# Get a Cox proportional hazards model using second order models:mdCOX <- FRESA.Model(formula = Surv(pgtime, pgstat) ~ 1,
data = dataCancer,categorizationType="RawRaw")sm <- summary(mdCOX$BSWiMS.model)print(sm$coefficients)

FRESA.CAD-package 7
namesc <- names(mdCOX$BSWiMS.model$coefficients)[-1]hm <- heatMaps(mdCOX$univariateAnalysis[namesc,],varRank=NULL,
Outcome="pgstat",data=dataCancer,title="Heat Map",hCluster=FALSE,prediction=NULL,Scale=TRUE,theFiveColors=c("blue","cyan","black","yellow","red"),outcomeColors = c("blue","lightgreen","yellow","orangered","red"),transpose=FALSE,cexRow=0.50,cexCol=0.80,srtCol=35)
# The LOO estimationpm <- ensemblePredict(mdCOX$BSWiMS.models$formula.list,dataCancer,
predictType = "linear",type="LOGIT",Outcome="pgstat")pm <- plotModels.ROC(cbind(dataCancer$pgstat,pm$ensemblePredict),main=("LOO Median Predict"))#Let us check the diagnosis performancesummary(epi.tests(pm$predictionTable))
# Get a Logistic model using FRESA.Model# - The default parametersdataCancer2 <-dataCancerdataCancer2$pgtime <-NULLmdLOGIT <- FRESA.Model(formula = pgstat ~ 1,data = dataCancer2)if (!is.null(mdLOGIT$bootstrappedModel)) pv <- plot(mdLOGIT$bootstrappedModel)sm <- summary(mdLOGIT$BSWiMS.model)print(sm$coefficients)
## FRESA.Model with Cross Validation and Recursive Partitioning and Regression Trees
md <- FRESA.Model(formula = Surv(pgtime, pgstat) ~ 1,data = dataCancer,CVfolds = 10,repeats = 5,equivalent = TRUE,usrFitFun=rpart::rpart)
colnames(md$cvObject$Models.testPrediction)
pm <- plotModels.ROC(md$cvObject$LASSO.testPredictions,theCVfolds=10,main="CV LASSO",cex=0.90)pm <- plotModels.ROC(md$cvObject$KNN.testPrediction,theCVfolds=10,main="KNN",cex=0.90)pm <- plotModels.ROC(md$cvObject$Models.testPrediction,theCVfolds=10,
predictor="Prediction",main="B:SWiMS Bagging",cex=0.90)pm <- plotModels.ROC(md$cvObject$Models.testPrediction,theCVfolds=10,
predictor="Ensemble.B.SWiMS",main="Forward Selection Median Ensemble",cex=0.90)
pm <- plotModels.ROC(md$cvObject$Models.testPrediction,theCVfolds=10,predictor="Ensemble.Forward",main="Forward Selection Bagging",cex=0.90)
pm <- plotModels.ROC(md$cvObject$Models.testPrediction,theCVfolds=10,predictor="eB.SWiMS",main="Equivalent Model",cex=0.90)
pm <- plotModels.ROC(md$cvObject$Models.testPrediction,theCVfolds=10,predictor="Forward.Selection.Bagged",main="The Forward Bagging",cex=0.90)
pm <- plotModels.ROC(md$cvObject$Models.testPrediction,theCVfolds=20,predictor="usrFitFunction",main="Recursive Partitioning and Regression Trees",cex=0.90)
pm <- plotModels.ROC(md$cvObject$Models.testPrediction,theCVfolds=20,predictor="usrFitFunction_Sel",
main="Recursive Partitioning and Regression Trees with FS",cex=0.90)

8 backVarElimination_Bin
## FRESA.Model with Cross Validation, LOGISTIC and Support Vector Machine
md <- FRESA.Model(formula = pgstat ~ 1,data = dataCancer2,CVfolds = 10,repeats = 5,equivalent = TRUE,usrFitFun=svm)
pm <- plotModels.ROC(md$cvObject$LASSO.testPredictions,theCVfolds=10,main="CV LASSO",cex=0.90)pm <- plotModels.ROC(md$cvObject$KNN.testPrediction,theCVfolds=10,main="KNN",cex=0.90)pm <- plotModels.ROC(md$cvObject$Models.testPrediction,theCVfolds=10,
predictor="Prediction",main="B:SWiMS Bagging",cex=0.90)
md$cvObject$Models.testPrediction[,"usrFitFunction"] <-md$cvObject$Models.testPrediction[,"usrFitFunction"] - 0.5
md$cvObject$Models.testPrediction[,"usrFitFunction_Sel"] <-md$cvObject$Models.testPrediction[,"usrFitFunction_Sel"] - 0.5
pm <- plotModels.ROC(md$cvObject$Models.testPrediction,theCVfolds=10,predictor="usrFitFunction",main="SVM",cex = 0.90)
pm <- plotModels.ROC(md$cvObject$Models.testPrediction,theCVfolds=10,predictor="usrFitFunction_Sel",main="SVM with FS",cex = 0.90)
# Shut down the graphics device driverdev.off()
## End(Not run)
backVarElimination_Bin
IDI/NRI-based backwards variable elimination
Description
This function removes model terms that do not significantly affect the integrated discriminationimprovement (IDI) or the net reclassification improvement (NRI) of the model.
Usage
backVarElimination_Bin(object,pvalue = 0.05,Outcome = "Class",data,startOffset = 0,type = c("LOGIT", "LM", "COX"),selectionType = c("zIDI", "zNRI")
)

backVarElimination_Bin 9
Arguments
object An object of class lm, glm, or coxph containing the model to be analyzedpvalue The maximum p-value, associated to either IDI or NRI, allowed for a term in
the modelOutcome The name of the column in data that stores the variable to be predicted by the
modeldata A data frame where all variables are stored in different columnsstartOffset Only terms whose position in the model is larger than the startOffset are
candidates to be removedtype Fit type: Logistic ("LOGIT"), linear ("LM"), or Cox proportional hazards ("COX")selectionType The type of index to be evaluated by the improveProb function (Hmisc pack-
age): z-score of IDI or of NRI
Details
For each model term xi, the IDI or NRI is computed for the Full model and the reduced model(where the term xi removed). The term whose removal results in the smallest drop in improvementis selected. The hypothesis: the term adds classification improvement is tested by checking thepvalue of improvement. If p(IDIorNRI) > pvalue, then the term is removed. In other words,only model terms that significantly aid in subject classification are kept. The procedure is repeateduntil no term fulfils the removal criterion.
Value
back.model An object of the same class as object containing the reduced modelloops The number of loops it took for the model to stabilizereclas.info A list with the NRI and IDI statistics of the reduced model, as given by the
getVar.Bin functionback.formula An object of class formula with the formula used to fit the reduced modellastRemoved The name of the last term that was removed (-1 if all terms were removed)at.opt.model the model before the BH procedurebeforeFSC.formula
the string formula of the model before the BH procedure
Author(s)
Jose G. Tamez-Pena and Antonio Martinez-Torteya
References
Pencina, M. J., D’Agostino, R. B., & Vasan, R. S. (2008). Evaluating the added predictive ability ofa new marker: from area under the ROC curve to reclassification and beyond. Statistics in medicine27(2), 157-172.
See Also
backVarElimination_Res, bootstrapVarElimination_Bin, bootstrapVarElimination_Res

10 backVarElimination_Res
backVarElimination_Res
NeRI-based backwards variable elimination
Description
This function removes model terms that do not significantly improve the "net residual" (NeRI)
Usage
backVarElimination_Res(object,pvalue = 0.05,Outcome = "Class",data,startOffset = 0,type = c("LOGIT", "LM", "COX"),testType = c("Binomial", "Wilcox", "tStudent", "Ftest"),setIntersect = 1
)
Arguments
object An object of class lm, glm, or coxph containing the model to be analyzedpvalue The maximum p-value, associated to the NeRI, allowed for a term in the modelOutcome The name of the column in data that stores the variable to be predicted by the
modeldata A data frame where all variables are stored in different columnsstartOffset Only terms whose position in the model is larger than the startOffset are
candidates to be removedtype Fit type: Logistic ("LOGIT"), linear ("LM"), or Cox proportional hazards ("COX")testType Type of non-parametric test to be evaluated by the improvedResiduals func-
tion: Binomial test ("Binomial"), Wilcoxon rank-sum test ("Wilcox"), Student’st-test ("tStudent"), or F-test ("Ftest")
setIntersect The intersect of the model (To force a zero intersect, set this value to 0)
Details
For each model term xi, the residuals are computed for the Full model and the reduced model(where the term xi removed). The term whose removal results in the smallest drop in residualsimprovement is selected. The hypothesis: the term improves residuals is tested by checking thepvalue of improvement. If p(residualsbetterthanreducedresiduals) > pvalue, then the term isremoved. In other words, only model terms that significantly aid in improving residuals are kept.The procedure is repeated until no term fulfils the removal criterion. The p-values of improvementcan be computed via a sign-test (Binomial) a paired Wilcoxon test, paired t-test or f-test. The firstthree tests compare the absolute values of the residuals, while the f-test test if the variance of theresiduals is improved significantly.

baggedModel 11
Value
back.model An object of the same class as object containing the reduced model
loops The number of loops it took for the model to stabilize
reclas.info A list with the NeRI statistics of the reduced model, as given by the getVar.Resfunction
back.formula An object of class formula with the formula used to fit the reduced model
lastRemoved The name of the last term that was removed (-1 if all terms were removed)
at.opt.model the model with before the FSR procedure.
beforeFSC.formula
the string formula of the the FSR procedure
Author(s)
Jose G. Tamez-Pena and Antonio Martinez-Torteya
See Also
backVarElimination_Bin, bootstrapVarElimination_Bin bootstrapVarElimination_Res
baggedModel Get the bagged model from a list of models
Description
This function will take the frequency-ranked of variables and the list of models to create a singlebagged model
Usage
baggedModel(modelFormulas,data,type=c("LM","LOGIT","COX"),Outcome=NULL,timeOutcome=NULL,frequencyThreshold=0.025,univariate=NULL,
useFreq=TRUE,n_bootstrap=1
)

12 baggedModel
Arguments
modelFormulas The name of the column in data that stores the variable to be predicted by themodel
data A data frame with two columns. The first one must have the names of the can-didate variables and the other one the description of such variables
type Fit type: Logistic ("LOGIT"), linear ("LM"), or Cox proportional hazards ("COX")
Outcome The name of the column in data that stores the time to outcome
timeOutcome The name of the column in data that stores the time to event (needed only for aCox proportional hazards regression model fitting)
frequencyThreshold
set the frequency the threshold of the frequency of features to be included in themodel)
univariate The FFRESA.CAD univariate analysis matrix
useFreq Use the feature frequency to order the formula terms. If set to a positive value isthe number of estimation loops
n_bootstrap if greater than 1, defines the number of bootstraps samples to be used
Value
bagged.model the bagged model
formula the formula of the model
frequencyTable the table of variables ranked by their model frequency
faverageSize the average size of the models
formulaNetwork The matrix of interaction between formulas
Jaccard.SM The Jaccard Stability Measure of the formulas
coefEvolution The evolution of the coefficients
avgZvalues The average Z value of each coefficient
featureLocation
The average location of the feature in the formulas
Author(s)
Jose G. Tamez-Pena
See Also
ensemblePredict

barPlotCiError 13
barPlotCiError Bar plot with error bars
Description
Ranked Plot a set of measurements with error bars or confidence intervals (CI)
Usage
barPlotCiError(ciTable,metricname,
thesets,themethod,main,angle = 0,offsets = c(0.1,0.1),
scoreDirection = ">",ho=NULL,
...)
Arguments
ciTable A matrix with three columns: the value, the low CI value and the high CI value
metricname The name of the plotted values
thesets A character vector with the names of the sets
themethod A character vector with the names of the methods
main The plot title
angle The angle of the x labels
offsets The offset of the x-labels
scoreDirection Indicates how to aggregate the supMethod score and the ingMethod score.
ho the null hypothesis
... Extra parametrs pased to the barplot function
Value
barplot the x-location of the bars
ciTable the ordered matrix with the 95 CI
barMatrix the mean values of the bars
supMethod A superiority score equal to the numbers of methods that were inferior
infMethod A inferiority score equal to the number of methods that were superiorinterMethodScore
the sum of supMethod and infMethod defined by the score direction.

14 benchmarking
Author(s)
Jose G. Tamez-Pena
benchmarking Compare performance of different model fitting/filtering algorithms
Description
Evaluates a data set with a set of fitting/filtering methods and returns the observed cross-validationperformance
Usage
BinaryBenchmark(theData = NULL, theOutcome = "Class", reps = 100, trainFraction = 0.5,referenceCV = NULL,referenceName = "Reference",referenceFilterName="Reference")
RegresionBenchmark(theData = NULL, theOutcome = "Class", reps = 100, trainFraction = 0.5,referenceCV = NULL,referenceName = "Reference",referenceFilterName="Reference")
OrdinalBenchmark(theData = NULL, theOutcome = "Class", reps = 100, trainFraction = 0.5,referenceCV = NULL,referenceName = "Reference",referenceFilterName="Reference")
Arguments
theData The data frame
theOutcome The outcome feature
reps The number of times that the random cross-validation will be performed
trainFraction The fraction of the data used for training.
referenceCV A user supplied random cross-validation object to be benchmarked
referenceName The name of the reference classifier to be used in the reporting tablesreferenceFilterName
The name of the reference filter to be used in the reporting tables
Details
The benchmark functions provide the performance of different classification algorithms (Binary-Benchmark), registration algorithms (RegresionBenchmark) or ordinal regression algorithms (Or-dinalBenchmark) The evaluation method is based on applying the random cross-validation method(randomCV) that randomly splits the data into train and test sets. The user can provide a Crossvalidated object that will define the train-test partitions.

benchmarking 15
The BinaryBenchmark compares: BSWiMS,Random Forest ,RPART,LASSO,SVM/mRMR,KNNand the ensemble of them in their ability to correctly classify the test data. Furthermore, it evalu-ates the ability of the following feature selection algorithms: BSWiMS or ReferenceCV, LASSO,RPART, RF/BSWiMS, IDI, NRI, t-test, Wilcoxon, Kendall, and mRMR in their ability to select thebest set of features for the following classification methods: SVM, KNN, Naive Bayes, RandomForest Nearest Centroid (NC) with root sum square (RSS) , and NC with Spearman correlation
The RegresionBenchmark compares: BSWiMS,Random Forest ,RPART,LASSO,SVM/mRMR andthe ensemble of them in their ability to correctly predict the test data. Furthermore, it evaluates theability of the following feature selection algorithms: BSWiMS or referenceCV, LASSO, RPART,RF/BSWiMS, F-Test, W-Test, Pearson Kendall, and mRMR in their ability to select the best setof features for the following regression methods: Linear Regression, Robust Regression, RidgeRegression, LASSO, SVM, and Random Forest.
The OrdinalBenchmark compares: BSWiMS,Random Forest ,RPART,LASSO,KNN ,SVM and theensemble of them in their ability to correctly predict the test data. Furthermore, it evaluates theability of the following feature selection algorithms: BSWiMS or referenceCV, LASSO, RPART,RF/BSWiMS, F-Test, Kendall, and mRMR in their ability to select the best set of features for thefollowing regression methods: Ordinal, KNN, SVM, Random Forest, and Naive Bayes.
Value
errorciTable the matrix of the balanced error with the 95 CI
accciTable the matrix of the classification accuracy with the 95 CI
aucTable the matrix of the ROC AUC with the 95 CI
senTable the matrix of the sensitivity with the 95 CI
speTable the matrix of the specificity with the 95 CIerrorciTable_filter
the matrix of the balanced error with the 95 CI for filter methodsaccciTable_filter
the matrix of the classification accuracy with the 95 CI for filter methodssenciTable_filter
the matrix of the classification sensitivity with the 95 CI for filter methodsspeciTable_filter
the matrix of the classification specificity with the 95 CI for filter methodsaucTable_filter
the matrix of the ROC AUC with the 95 CI for filter methods
CorTable the matrix of the Pearson correlation with the 95 CI
RMSETable the matrix of the root mean square error (RMSE) with the 95 CI
BiasTable the matrix of the prediction bias with the 95 CICorTable_filter
the matrix of the Pearson correlation with the 95 CI for filter methodsRMSETable_filter
the matrix of the root mean square error (RMSE) with the 95 CI for filter meth-ods
BiasTable_filter
the matrix of the prediction bias with the 95 CI for filter methods

16 benchmarking
BMAETable the matrix of the balanced mean absolute error (MEA) with the 95 CI for filtermethods
KappaTable the matrix of the Kappa value with the 95 CI
BiasTable the matrix of the prediction Bias with the 95 CI
KendallTable the matrix of the Kendall correlation with the 95 CIMAETable_filter
the matrix of the mean absolute error (MEA) with the 95 CI for filter methodsKappaTable_filter
the matrix of the Kappa value with the 95 CI for filter methodsBiasTable_filter
the matrix of the prediction Bias with the 95 CI for filter methodsKendallTable_filter
the matrix of the Kendall correlation with the 95 CI for filter methods
times The average CPU time used by the method
jaccard_filter The average Jaccard Index of the feature selection methodsTheCVEvaluations
The output of the randomCV (randomCV) evaluations of the different methodstestPredictions
A matrix with all the test predictionsfeatureSelectionFrequency
The frequency of feature selectioncpuElapsedTimes
The mean elapsed times
cpuElapsedTimes
Author(s)
Jose G. Tamez-Pena
See Also
randomCV
Examples
## Not run:
### Binary Classification Example ##### Start the graphics device driver to save all plots in a pdf formatpdf(file = "BinaryClassificationExample.pdf",width = 8, height = 6)# Get the stage C prostate cancer data from the rpart package
data(stagec,package = "rpart")
# Prepare the data. Create a model matrix without the event timestagec$pgtime <- NULLstagec$eet <- as.factor(stagec$eet)

benchmarking 17
options(na.action = 'na.pass')stagec_mat <- cbind(pgstat = stagec$pgstat,as.data.frame(model.matrix(pgstat ~ .,stagec))[-1])
# Impute the missing datadataCancerImputed <- nearestNeighborImpute(stagec_mat)
dataCancerImputed[,1:ncol(dataCancerImputed)] <- sapply(dataCancerImputed,as.numeric)
# Cross validating a LDA classifier.# 80cv <- randomCV(dataCancerImputed,"pgstat",MASS::lda,trainFraction = 0.8,repetitions = 10,featureSelectionFunction = univariate_tstudent,featureSelection.control = list(limit = 0.5,thr = 0.975));
# Compare the LDA classifier with other methodscp <- BinaryBenchmark(referenceCV = cv,referenceName = "LDA",
referenceFilterName="t.Student")pl <- plot(cp,prefix = "StageC: ")
# Default Benchmark classifiers method (BSWiMS) and filter methods.# 80cp <- BinaryBenchmark(theData = dataCancerImputed,theOutcome = "pgstat", reps = 10, fraction = 0.8)
# plot the Cross Validation Metricspl <- plot(cp,prefix = "Stagec:");
# Shut down the graphics device driverdev.off()
#### Regression Example ####### Start the graphics device driver to save all plots in a pdf formatpdf(file = "RegressionExample.pdf",width=8, height=6)
# Get the body fat data from the TH package
data("bodyfat", package = "TH.data")
# Benchmark regression methods and filter methods.#80cp <- RegresionBenchmark(theData = bodyfat,theOutcome = "DEXfat", reps = 10, fraction = 0.8)
# plot the Cross Validation Metricspl <- plot(cp,prefix = "Body Fat:");# Shut down the graphics device driverdev.off()
#### Ordinal Regression Example ###### Start the graphics device driver to save all plots in a pdf formatpdf(file = "OrdinalRegressionExample.pdf",width=8, height=6)

18 bootstrapValidation_Bin
# Get the GBSG2 datadata("GBSG2", package = "TH.data")
# Prepare the model frame for benchmarkingGBSG2$time <- NULL;GBSG2$cens <- NULL;GBSG2_mat <- cbind(tgrade = as.numeric(GBSG2$tgrade),as.data.frame(model.matrix(tgrade~.,GBSG2))[-1])
# Benchmark regression methods and filter methods.#30cp <- OrdinalBenchmark(theData = GBSG2_mat,theOutcome = "tgrade", reps = 10, fraction = 0.3)
# plot the Cross Validation Metricspl <- plot(cp,prefix = "GBSG:");
# Shut down the graphics device driverdev.off()
## End(Not run)
bootstrapValidation_Bin
Bootstrap validation of binary classification models
Description
This function bootstraps the model n times to estimate for each variable the empirical distributionof model coefficients, area under ROC curve (AUC), integrated discrimination improvement (IDI)and net reclassification improvement (NRI). At each bootstrap the non-observed data is predictedby the trained model, and statistics of the test prediction are stored and reported. The method keepstrack of predictions and plots the bootstrap-validated ROC. It may plots the blind test accuracy,sensitivity, and specificity, contrasted with the bootstrapped trained distributions.
Usage
bootstrapValidation_Bin(fraction = 1,loops = 200,model.formula,Outcome,data,type = c("LM", "LOGIT", "COX"),plots = FALSE,
best.model.formula=NULL)

bootstrapValidation_Bin 19
Arguments
fraction The fraction of data (sampled with replacement) to be used as train
loops The number of bootstrap loops
model.formula An object of class formula with the formula to be used
Outcome The name of the column in data that stores the variable to be predicted by themodel
data A data frame where all variables are stored in different columns
type Fit type: Logistic ("LOGIT"), linear ("LM"), or Cox proportional hazards ("COX")
plots Logical. If TRUE, density distribution plots are displayedbest.model.formula
An object of class formula with the formula to be used for the best model
Details
The bootstrap validation will estimate the confidence interval of the model coefficients and theNRI and IDI. The non-sampled values will be used to estimate the blind accuracy, sensitivity, andspecificity. A plot to monitor the evolution of the bootstrap procedure will be displayed if plotsis set to TRUE. The plot shows the train and blind test ROC. The density distribution of the trainaccuracy, sensitivity, and specificity are also shown, with the blind test results drawn along they-axis.
Value
data The data frame used to bootstrap and validate the model
outcome A vector with the predictions made by the model
blind.accuracy The accuracy of the model in the blind test setblind.sensitivity
The sensitivity of the model in the blind test setblind.specificity
The specificity of the model in the blind test set
train.ROCAUC A vector with the AUC in the bootstrap train sets
blind.ROCAUC An object of class roc containing the AUC in the bootstrap blind test set
boot.ROCAUC An object of class roc containing the AUC using the mean of the bootstrappedcoefficients
fraction The fraction of data that was sampled with replacement
loops The number of loops it took for the model to stabilize
base.Accuracy The accuracy of the original modelbase.sensitivity
The sensitivity of the original modelbase.specificity
The specificity of the original model
accuracy A vector with the accuracies in the bootstrap test sets

20 bootstrapValidation_Bin
sensitivities A vector with the sensitivities in the bootstrap test sets
specificities A vector with the specificities in the bootstrap test sets
train.accuracy A vector with the accuracies in the bootstrap train sets
train.sensitivity
A vector with the sensitivities in the bootstrap train sets
train.specificity
A vector with the specificities in the bootstrap train sets
s.coef A matrix with the coefficients in the bootstrap train sets
boot.model An object of class lm, glm, or coxph containing a model whose coefficients arethe median of the coefficients of the bootstrapped models
boot.accuracy The accuracy of the mboot.model model
boot.sensitivity
The sensitivity of the mboot.model model
boot.specificity
The specificity of the mboot.model model
z.NRIs A matrix with the z-score of the NRI for each model term, estimated using thebootstrap train sets
z.IDIs A matrix with the z-score of the IDI for each model term, estimated using thebootstrap train sets
test.z.NRIs A matrix with the z-score of the NRI for each model term, estimated using thebootstrap test sets
test.z.IDIs A matrix with the z-score of the IDI for each model term, estimated using thebootstrap test sets
NRIs A matrix with the NRI for each model term, estimated using the bootstrap testsets
IDIs A matrix with the IDI for each model term, estimated using the bootstrap testsets
testOutcome A vector that contains all the individual outcomes used to validate the model inthe bootstrap test sets
testPrediction A vector that contains all the individual predictions used to validate the modelin the bootstrap test sets
Author(s)
Jose G. Tamez-Pena and Antonio Martinez-Torteya
See Also
bootstrapValidation_Res, plot.bootstrapValidation_Bin, summary.bootstrapValidation_Bin

bootstrapValidation_Res 21
bootstrapValidation_Res
Bootstrap validation of regression models
Description
This function bootstraps the model n times to estimate for each variable the empirical bootstrappeddistribution of model coefficients, and net residual improvement (NeRI). At each bootstrap the non-observed data is predicted by the trained model, and statistics of the test prediction are stores andreported.
Usage
bootstrapValidation_Res(fraction = 1,loops = 200,model.formula,Outcome,data,type = c("LM", "LOGIT", "COX"),plots = FALSE,
bestmodel.formula=NULL)
Arguments
fraction The fraction of data (sampled with replacement) to be used as train
loops The number of bootstrap loops
model.formula An object of class formula with the formula to be used
Outcome The name of the column in data that stores the variable to be predicted by themodel
data A data frame where all variables are stored in different columns
type Fit type: Logistic ("LOGIT"), linear ("LM"), or Cox proportional hazards ("COX")
plots Logical. If TRUE, density distribution plots are displayed
bestmodel.formula
An object of class formula with the best formula to be compared
Details
The bootstrap validation will estimate the confidence interval of the model coefficients and theNeRI. It will also compute the train and blind test root-mean-square error (RMSE), as well as thedistribution of the NeRI p-values.

22 bootstrapValidation_Res
Value
data The data frame used to bootstrap and validate the model
outcome A vector with the predictions made by the model
boot.model An object of class lm, glm, or coxph containing a model whose coefficients arethe median of the coefficients of the bootstrapped models
NeRIs A matrix with the NeRI for each model term, estimated using the bootstrap testsets
tStudent.pvalues
A matrix with the t-test p-value of the NeRI for each model term, estimatedusing the bootstrap train sets
wilcox.pvalues A matrix with the Wilcoxon rank-sum test p-value of the NeRI for each modelterm, estimated using the bootstrap train sets
bin.pvalues A matrix with the binomial test p-value of the NeRI for each model term, esti-mated using the bootstrap train sets
F.pvalues A matrix with the F-test p-value of the NeRI for each model term, estimatedusing the bootstrap train sets
test.tStudent.pvalues
A matrix with the t-test p-value of the NeRI for each model term, estimatedusing the bootstrap test sets
test.wilcox.pvalues
A matrix with the Wilcoxon rank-sum test p-value of the NeRI for each modelterm, estimated using the bootstrap test sets
test.bin.pvalues
A matrix with the binomial test p-value of the NeRI for each model term, esti-mated using the bootstrap test sets
test.F.pvalues A matrix with the F-test p-value of the NeRI for each model term, estimatedusing the bootstrap test sets
testPrediction A vector that contains all the individual predictions used to validate the modelin the bootstrap test sets
testOutcome A vector that contains all the individual outcomes used to validate the model inthe bootstrap test sets
testResiduals A vector that contains all the residuals used to validate the model in the bootstraptest sets
trainPrediction
A vector that contains all the individual predictions used to validate the modelin the bootstrap train sets
trainOutcome A vector that contains all the individual outcomes used to validate the model inthe bootstrap train sets
trainResiduals A vector that contains all the residuals used to validate the model in the bootstraptrain sets
testRMSE The global RMSE, estimated using the bootstrap test sets
trainRMSE The global RMSE, estimated using the bootstrap train sets

bootstrapVarElimination_Bin 23
trainSampleRMSE
A vector with the RMSEs in the bootstrap train setstestSampledRMSE
A vector with the RMSEs in the bootstrap test sets
Author(s)
Jose G. Tamez-Pena and Antonio Martinez-Torteya
See Also
bootstrapValidation_Bin, plot.bootstrapValidation_Res
bootstrapVarElimination_Bin
IDI/NRI-based backwards variable elimination with bootstrapping
Description
This function removes model terms that do not improve the bootstrapped integrated discriminationimprovement (IDI) or net reclassification improvement (NRI) significantly.
Usage
bootstrapVarElimination_Bin(object,pvalue = 0.05,Outcome = "Class",data,startOffset = 0,type = c("LOGIT", "LM", "COX"),selectionType = c("zIDI", "zNRI"),loops = 64,print=TRUE,plots=TRUE)
Arguments
object An object of class lm, glm, or coxph containing the model to be analyzed
pvalue The maximum p-value, associated to either IDI or NRI, allowed for a term inthe model
Outcome The name of the column in data that stores the variable to be predicted by themodel
data A data frame where all variables are stored in different columns
startOffset Only terms whose position in the model is larger than the startOffset arecandidates to be removed

24 bootstrapVarElimination_Bin
type Fit type: Logistic ("LOGIT"), linear ("LM"), or Cox proportional hazards ("COX")
selectionType The type of index to be evaluated by the improveProb function (Hmisc pack-age): z-score of IDI or of NRI
loops The number of bootstrap loops
print Logical. If TRUE, information will be displayed
plots Logical. If TRUE, plots are displayed
Details
For each model term xi, the IDI or NRI is computed for the Full model and the reduced model(where the term xi removed). The term whose removal results in the smallest drop in bootstrappedimprovement is selected. The hypothesis: the term adds classification improvement is tested bychecking the p value of average improvement. If p(IDIorNRI) > pvalue, then the term isremoved. In other words, only model terms that significantly aid in subject classification are kept.The procedure is repeated until no term fulfils the removal criterion.
Value
back.model An object of the same class as object containing the reduced model
loops The number of loops it took for the model to stabilize
reclas.info A list with the NRI and IDI statistics of the reduced model, as given by thegetVar.Bin function
bootCV An object of class bootstrapValidation_Bin containing the results of thebootstrap validation in the reduced model
back.formula An object of class formula with the formula used to fit the reduced model
lastRemoved The name of the last term that was removed (-1 if all terms were removed)
at.opt.model The model will have the fitted model that had close to maximum bootstrappedtest accuracy
beforeFSC.formula
The formula of the model before False Selection Correctionat.Accuracy.formula
the string formula of the model that had the best or close to tbe best test accuracy
Author(s)
Jose G. Tamez-Pena and Antonio Martinez-Torteya
References
Pencina, M. J., D’Agostino, R. B., & Vasan, R. S. (2008). Evaluating the added predictive ability ofa new marker: from area under the ROC curve to reclassification and beyond. Statistics in medicine27(2), 157-172.
See Also
bootstrapVarElimination_Res, backVarElimination_Bin, backVarElimination_Res
bootstrapVarElimination_Res 25
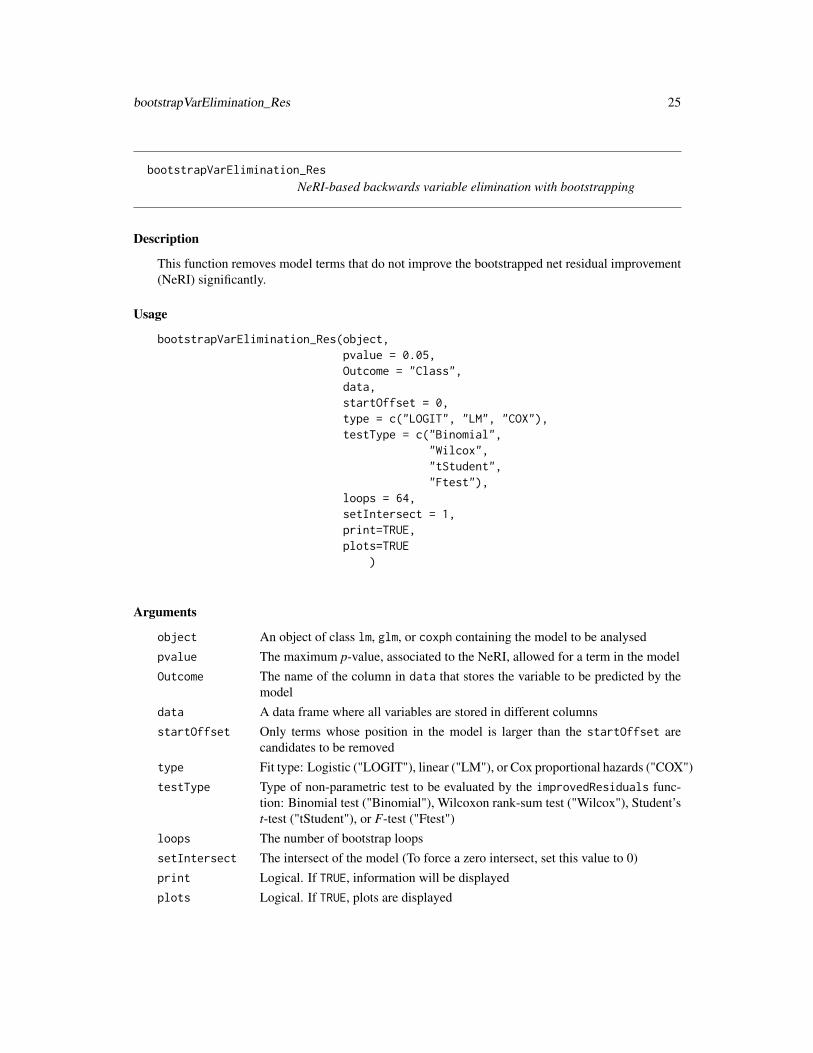
bootstrapVarElimination_Res
NeRI-based backwards variable elimination with bootstrapping
Description
This function removes model terms that do not improve the bootstrapped net residual improvement(NeRI) significantly.
Usage
bootstrapVarElimination_Res(object,pvalue = 0.05,Outcome = "Class",data,startOffset = 0,type = c("LOGIT", "LM", "COX"),testType = c("Binomial",
"Wilcox","tStudent","Ftest"),
loops = 64,setIntersect = 1,print=TRUE,plots=TRUE
)
Arguments
object An object of class lm, glm, or coxph containing the model to be analysedpvalue The maximum p-value, associated to the NeRI, allowed for a term in the modelOutcome The name of the column in data that stores the variable to be predicted by the
modeldata A data frame where all variables are stored in different columnsstartOffset Only terms whose position in the model is larger than the startOffset are
candidates to be removedtype Fit type: Logistic ("LOGIT"), linear ("LM"), or Cox proportional hazards ("COX")testType Type of non-parametric test to be evaluated by the improvedResiduals func-
tion: Binomial test ("Binomial"), Wilcoxon rank-sum test ("Wilcox"), Student’st-test ("tStudent"), or F-test ("Ftest")
loops The number of bootstrap loopssetIntersect The intersect of the model (To force a zero intersect, set this value to 0)print Logical. If TRUE, information will be displayedplots Logical. If TRUE, plots are displayed

26 BSWiMS.model
Details
For each model term xi, the residuals are computed for the Full model and the reduced model( wherethe term xi removed). The term whose removal results in the smallest drop in bootstrapped testresiduals improvement is selected. The hypothesis: the term improves residuals is tested by check-ing the p-value of average improvement. If p(residualsbetterthanreducedresiduals) > pvalue,then the term is removed. In other words, only model terms that significantly aid in improving resid-uals are kept. The procedure is repeated until no term fulfils the removal criterion. The p-valuesof improvement can be computed via a sign-test (Binomial) a paired Wilcoxon test, paired t-test orf-test. The first three tests compare the absolute values of the residuals, while the f-test test if thevariance of the residuals is improved significantly.
Value
back.model An object of the same class as object containing the reduced model
loops The number of loops it took for the model to stabilize
reclas.info A list with the NeRI statistics of the reduced model, as given by the getVar.Resfunction
bootCV An object of class bootstrapValidation_Res containing the results of thebootstrap validation in the reduced model
back.formula An object of class formula with the formula used to fit the reduced model
lastRemoved The name of the last term that was removed (-1 if all terms were removed)
at.opt.model The model with close to minimum bootstrapped RMSEbeforeFSC.formula
The formula of the model before the FSC stageat.RMSE.formula
the string formula of the model that had the minimum or close to minimumRMSE
Author(s)
Jose G. Tamez-Pena and Antonio Martinez-Torteya
See Also
bootstrapVarElimination_Bin, backVarElimination_Res, bootstrapValidation_Res
BSWiMS.model BSWiMS model selection
Description
This function returns a set of models that best predict the outcome. Based on a Bootstrap StageWise Model Selection algorithm.

BSWiMS.model 27
Usage
BSWiMS.model(formula,data,type = c("Auto","LM","LOGIT","COX"),testType = c("Auto","zIDI",
"zNRI","Binomial","Wilcox","tStudent","Ftest"),
pvalue=0.05,variableList=NULL,size=0,loops=32,elimination.bootstrap.steps = 100,fraction=1.0,maxTrainModelSize=20,maxCycles=20,print=FALSE,plots=FALSE,featureSize=0,
NumberofRepeats=1)
Arguments
formula An object of class formula with the formula to be fitted
data A data frame where all variables are stored in different columns
type The fit type. Auto will determine the fitting based on the formula
testType For an Binary-based optimization, the type of index to be evaluated by theimproveProb function (Hmisc package): z-value of Binary or of NRI. For aNeRI-based optimization, the type of non-parametric test to be evaluated by theimprovedResiduals function: Binomial test ("Binomial"), Wilcoxon rank-sumtest ("Wilcox"), Student’s t-test ("tStudent"), or F-test ("Ftest")
pvalue The maximum p-value, associated to the testType, allowed for a term in themodel (it will control the false selection rate)
variableList A data frame with two columns. The first one must have the names of the can-didate variables and the other one the description of such variables
size The number of candidate variables to be tested (the first size variables fromvariableList)
loops The number of bootstrap loops for the forward selection procedureelimination.bootstrap.steps
The number of bootstrap loops for the backwards elimination procedure
fraction The fraction of data (sampled with replacement) to be used as train

28 BSWiMS.model
maxTrainModelSize
Maximum number of terms that can be included in the each forward selectionmodel
maxCycles The maximum number of model generation cycles
print Logical. If TRUE, information will be displayed
plots Logical. If TRUE, plots are displayed
featureSize The original number of features to be explored in the data frame.
NumberofRepeats
How many times the BSWiMS search will be repeated
Details
This is a core function of FRESA.CAD. The function will generate a set of B:SWiMS models fromthe data based on the provided baseline formula. The function will loop extracting a models whoseall terms are statistical significant. After each loop it will remove the significant terms, and it willrepeat the model generation until no mode significant models are found or the maximum number ofcycles is reached.
Value
BSWiMS.model the output of the bootstrap backwards elimination step
forward.model The output of the forward selection step
update.model The output of the forward selection step
univariate The univariate ranking of variables if no list of features was provided
bagging The model after bagging the set of models
formula.list The formulas extracted at each cycle
forward.selection.list
All formulas generated by the forward selection procedure
oridinalModels A list of scores, the data and a formulas vector required for ordinal scores pre-dictions
Author(s)
Jose G. Tamez-Pena
References
Pencina, M. J., D’Agostino, R. B., & Vasan, R. S. (2008). Evaluating the added predictive ability ofa new marker: from area under the ROC curve to reclassification and beyond. Statistics in medicine27(2), 157-172.

BSWiMS.model 29
Examples
## Not run:
# Start the graphics device driver to save all plots in a pdf formatpdf(file = "BSWiMS.model.Example.pdf",width = 8, height = 6)
# Get the stage C prostate cancer data from the rpart packagedata(stagec,package = "rpart")options(na.action = 'na.pass')stagec_mat <- cbind(pgstat = stagec$pgstat,
pgtime = stagec$pgtime,as.data.frame(model.matrix(Surv(pgtime,pgstat) ~ .*.,stagec))[-1])
fnames <- colnames(stagec_mat)fnames <- str_replace_all(fnames,":","__")colnames(stagec_mat) <- fnames
dataCancerImputed <- nearestNeighborImpute(stagec_mat)
# Get a Cox proportional hazards model using:# - The default parametersmd <- BSWiMS.model(formula = Surv(pgtime, pgstat) ~ 1,
data = dataCancerImputed)
#Plot the bootstrap validationpt <- plot(md$BSWiMS.model$bootCV)
#Get the coefficients summarysm <- summary(md)print(sm$coefficients)
#Plot the bagged modelpl <- plotModels.ROC(cbind(dataCancerImputed$pgstat,
predict(md,dataCancerImputed)),main = "Bagging Predictions")
# Get a Cox proportional hazards model using:# - The default parameters but repeated 10 timesmd <- BSWiMS.model(formula = Surv(pgtime, pgstat) ~ 1,
data = dataCancerImputed,NumberofRepeats = 10)
#Get the coefficients summarysm <- summary(md)print(sm$coefficients)
#Check all the formulasprint(md$formula.list)
#Plot the bagged modelpl <- plotModels.ROC(cbind(dataCancerImputed$pgstat,
predict(md,dataCancerImputed)),

30 BSWiMS.model
main = "Bagging Predictions")
# Get a regression of the survival time
timeSubjects <- dataCancerImputedtimeSubjects$pgtime <- log(timeSubjects$pgtime)
md <- BSWiMS.model(formula = pgtime ~ 1,data = timeSubjects,)
pt <- plot(md$BSWiMS.model$bootCV)sm <- summary(md)print(sm$coefficients)
# Get a logistic regression model using# - The default parameters and removing time as possible predictordata(stagec,package = "rpart")stagec$pgtime <- NULLstagec_mat <- cbind(pgstat = stagec$pgstat,
as.data.frame(model.matrix(pgstat ~ .*.,stagec))[-1])fnames <- colnames(stagec_mat)fnames <- str_replace_all(fnames,":","__")colnames(stagec_mat) <- fnamesdataCancerImputed <- nearestNeighborImpute(stagec_mat)
md <- BSWiMS.model(formula = pgstat ~ 1,data = dataCancerImputed)
pt <- plot(md$BSWiMS.model$bootCV)sm <- summary(md)print(sm$coefficients)
# Get a ordinal regression of grade model using GBSG2 data# - The default parameters and removing the# time and status as possible predictor
data("GBSG2", package = "TH.data")
# Prepare the model frame for predictionGBSG2$time <- NULL;GBSG2$cens <- NULL;GBSG2_mat <- cbind(tgrade = as.numeric(GBSG2$tgrade),
as.data.frame(model.matrix(tgrade~.*.,GBSG2))[-1])
fnames <- colnames(GBSG2_mat)fnames <- str_replace_all(fnames,":","__")colnames(GBSG2_mat) <- fnames
md <- BSWiMS.model(formula = tgrade ~ 1,data = GBSG2_mat)

cancerVarNames 31
sm <- summary(md$oridinalModels$theBaggedModels[[1]]$bagged.model)print(sm$coefficients)sm <- summary(md$oridinalModels$theBaggedModels[[2]]$bagged.model)print(sm$coefficients)
print(table(GBSG2_mat$tgrade,predict(md,GBSG2_mat)))
# Shut down the graphics device driverdev.off()
## End(Not run)
cancerVarNames Data frame used in several examples of this package
Description
This data frame contains two columns, one with names of variables, and the other with descriptionsof such variables. It is used in several examples of this package. Specifically, it is used in examplesworking with the stage C prostate cancer data from the rpart package
Usage
data(cancerVarNames)
Format
A data frame with names and descriptions of the variables used in several examples
Var A column with the names of the variables
Description A column with a short description of the variables
Examples
data(cancerVarNames)

32 crossValidationFeatureSelection_Bin
crossValidationFeatureSelection_Bin
IDI/NRI-based selection of a linear, logistic, or Cox proportional haz-ards regression model from a set of candidate variables
Description
This function performs a cross-validation analysis of a feature selection algorithm based on theintegrated discrimination improvement (IDI) or the net reclassification improvement (NRI) to returna predictive model. It is composed of an IDI/NRI-based feature selection followed by an updateprocedure, ending with a bootstrapping backwards feature elimination. The user can control howmany train and blind test sets will be evaluated.
Usage
crossValidationFeatureSelection_Bin(size = 10,fraction = 1.0,pvalue = 0.05,loops = 100,covariates = "1",Outcome,timeOutcome = "Time",variableList,data,maxTrainModelSize = 20,type = c("LM", "LOGIT", "COX"),selectionType = c("zIDI", "zNRI"),startOffset = 0,elimination.bootstrap.steps = 100,trainFraction = 0.67,trainRepetition = 9,bootstrap.steps = 100,nk = 0,unirank = NULL,print=TRUE,plots=TRUE,lambda="lambda.1se",equivalent=FALSE,bswimsCycles=10,usrFitFun=NULL,featureSize=0)
Arguments
size The number of candidate variables to be tested (the first size variables fromvariableList)
fraction The fraction of data (sampled with replacement) to be used as train

crossValidationFeatureSelection_Bin 33
pvalue The maximum p-value, associated to either IDI or NRI, allowed for a term inthe model
loops The number of bootstrap loops
covariates A string of the type "1 + var1 + var2" that defines which variables will alwaysbe included in the models (as covariates)
Outcome The name of the column in data that stores the variable to be predicted by themodel
timeOutcome The name of the column in data that stores the time to event (needed only for aCox proportional hazards regression model fitting)
variableList A data frame with two columns. The first one must have the names of the can-didate variables and the other one the description of such variables
data A data frame where all variables are stored in different columnsmaxTrainModelSize
Maximum number of terms that can be included in the model
type Fit type: Logistic ("LOGIT"), linear ("LM"), or Cox proportional hazards ("COX")
selectionType The type of index to be evaluated by the improveProb function (Hmisc pack-age): z-score of IDI or of NRI
startOffset Only terms whose position in the model is larger than the startOffset arecandidates to be removed
elimination.bootstrap.steps
The number of bootstrap loops for the backwards elimination procedure
trainFraction The fraction of data (sampled with replacement) to be used as train for the cross-validation procedure
trainRepetition
The number of cross-validation folds (it should be at least equal to 1/trainFractionfor a complete cross-validation)
bootstrap.steps
The number of bootstrap loops for the confidence intervals estimation
nk The number of neighbours used to generate a k-nearest neighbours (KNN) clas-sification. If zero, k is set to the square root of the number of cases. If less thanzero, it will not perform the KNN classification
unirank A list with the results yielded by the uniRankVar function, required only if therank needs to be updated during the cross-validation procedure
print Logical. If TRUE, information will be displayed
plots Logical. If TRUE, plots are displayed
lambda The passed value to the s parameter of the glmnet cross validation coefficient
equivalent Is set to TRUE CV will compute the equivalent model
bswimsCycles The maximum number of models to be returned by BSWiMS.model
usrFitFun A user fitting function to be evaluated by the cross validation procedure
featureSize The original number of features to be explored in the data frame.
34 crossValidationFeatureSelection_Bin
Details
This function produces a set of data and plots that can be used to inspect the degree of over-fitting orshrinkage of a model. It uses bootstrapped data, cross-validation data, and, if possible, retrain data.During each cycle, a train and a test ROC will be generated using bootstrapped data. At the end ofthe cross-validation feature selection procedure, a set of three plots may be produced depending onthe specifications of the analysis. The first plot shows the ROC for each cross-validation blind test.The second plot, if enough samples are given, shows the ROC of each model trained and tested inthe blind test partition. The final plot shows ROC curves generated with the train, the bootstrappedblind test, and the cross-validation test data. Additionally, this plot will also contain the ROC ofthe cross-validation mean test data, and of the cross-validation coherence. These set of plots maybe used to get an overall perspective of the expected model shrinkage. Along with the plots, thefunction provides the overall performance of the system (accuracy, sensitivity, and specificity). Thefunction also produces a report of the expected performance of a KNN algorithm trained with theselected features of the model, and an elastic net algorithm. The test predictions obtained withthese algorithms can then be compared to the predictions generated by the logistic, linear, or Coxproportional hazards regression model.
Value
formula.list A list containing objects of class formula with the formulas used to fit the mod-els found at each cycle
Models.testPrediction
A data frame with the blind test set predictions (Full B:SWiMS,Median,Bagged,Forward,BackwardsEliminations) made at each fold of the cross validation, where the models usedto generate such predictions (formula.list) were generated via a feature se-lection process which included only the train set. It also includes a column withthe Outcome of each prediction, and a column with the number of the fold atwhich the prediction was made.
FullBSWiMS.testPrediction
A data frame similar to Models.testPrediction, but where the model used togenerate the predictions was the Full model, generated via a feature selectionprocess which included all data.
TestRetrained.blindPredictions
A data frame similar to Models.testPrediction, but where the models wereretrained on an independent set of data (only if enough samples are given at eachfold)
LastTrainBSWiMS.bootstrapped
An object of class bootstrapValidation_Bin containing the results of thebootstrap validation in the last trained model
Test.accuracy The global blind test accuracy of the cross-validation procedureTest.sensitivity
The global blind test sensitivity of the cross-validation procedureTest.specificity
The global blind test specificity of the cross-validation procedureTrain.correlationsToFull
The Spearman ρ rank correlation coefficient between the predictions made witheach model from formula.list and the Full model in the train set

crossValidationFeatureSelection_Bin 35
Blind.correlationsToFull
The Spearman ρ rank correlation coefficient between the predictions made witheach model from formula.list and the Full model in the test set
FullModelAtFoldAccuracies
The blind test accuracy for the Full model at each cross-validation foldFullModelAtFoldSpecificties
The blind test specificity for the Full model at each cross-validation foldFullModelAtFoldSensitivities
The blind test sensitivity for the Full model at each cross-validation foldFullModelAtFoldAUC
The blind test ROC AUC for the Full model at each cross-validation foldAtCVFoldModelBlindAccuracies
The blind test accuracy for the Full model at each final cross-validation foldAtCVFoldModelBlindSpecificities
The blind test specificity for the Full model at each final cross-validation foldAtCVFoldModelBlindSensitivities
The blind test sensitivity for the Full model at each final cross-validation foldCVTrain.Accuracies
The train accuracies at each foldCVTrain.Sensitivity
The train sensitivity at each foldCVTrain.Specificity
The train specificity at each fold
CVTrain.AUCs The train ROC AUC for each foldforwardSelection
A list containing the values returned by ForwardSelection.Model.Bin usingall data
updateforwardSelection
A list containing the values returned by updateModel.Bin using all data andthe model from forwardSelection
BSWiMS A list containing the values returned by bootstrapVarElimination_Bin usingall data and the model from updateforwardSelection
FullBSWiMS.bootstrapped
An object of class bootstrapValidation_Bin containing the results of thebootstrap validation in the Full model
Models.testSensitivities
A matrix with the mean ROC sensitivities at certain specificities for each trainand all test cross-validation folds using the cross-validation models (i.e. 0.95,0.90, 0.80, 0.70, 0.60, 0.50, 0.40, 0.30, 0.20, 0.10, and 0.05)
FullKNN.testPrediction
A data frame similar to Models.testPrediction, but where a KNN classifierwith the same features as the Full model was used to generate the predictions
KNN.testPrediction
A data frame similar to Models.testPrediction, but where KNN classifierswith the same features as the cross-validation models were used to generate thepredictions at each cross-validation fold

36 crossValidationFeatureSelection_Bin
Fullenet An object of class cv.glmnet containing the results of an elastic net cross-validation fit
LASSO.testPredictions
A data frame similar to Models.testPrediction, but where the predictionswere made by the elastic net model
LASSOVariables A list with the elastic net Full model and the models found at each cross-validation fold
uniTrain.Accuracies
The list of accuracies of an univariate analysis on each one of the model vari-ables in the train sets
uniTest.Accuracies
The list of accuracies of an univariate analysis on each one of the model vari-ables in the test sets
uniTest.TopCoherence
The accuracy coherence of the top ranked variable on the test setuniTrain.TopCoherence
The accuracy coherence of the top ranked variable on the train setModels.trainPrediction
A data frame with the outcome and the train prediction of every modelFullBSWiMS.trainPrediction
A data frame with the outcome and the train prediction at each CV fold for themain model
LASSO.trainPredictions
A data frame with the outcome and the prediction of each enet lasso modelBSWiMS.ensemble.prediction
The ensemble prediction by all models on the test dataAtOptFormulas.list
The list of formulas with "optimal" performanceForwardFormulas.list
The list of formulas produced by the forward procedurebaggFormulas.list
The list of the bagged modelsLassoFilterVarList
The list of variables used by LASSO fitting
Author(s)
Jose G. Tamez-Pena and Antonio Martinez-Torteya
References
Pencina, M. J., D’Agostino, R. B., & Vasan, R. S. (2008). Evaluating the added predictive ability ofa new marker: from area under the ROC curve to reclassification and beyond. Statistics in medicine27(2), 157-172.
See Also
crossValidationFeatureSelection_Res, ForwardSelection.Model.Bin, ForwardSelection.Model.Res

crossValidationFeatureSelection_Res 37
crossValidationFeatureSelection_Res
NeRI-based selection of a linear, logistic, or Cox proportional hazardsregression model from a set of candidate variables
Description
This function performs a cross-validation analysis of a feature selection algorithm based on netresidual improvement (NeRI) to return a predictive model. It is composed of a NeRI-based featureselection followed by an update procedure, ending with a bootstrapping backwards feature elimina-tion. The user can control how many train and blind test sets will be evaluated.
Usage
crossValidationFeatureSelection_Res(size = 10,fraction = 1.0,pvalue = 0.05,loops = 100,covariates = "1",Outcome,timeOutcome = "Time",variableList,data,maxTrainModelSize = 20,type = c("LM", "LOGIT", "COX"),testType = c("Binomial",
"Wilcox","tStudent","Ftest"),
startOffset = 0,elimination.bootstrap.steps = 100,trainFraction = 0.67,trainRepetition = 9,setIntersect = 1,unirank = NULL,print=TRUE,plots=TRUE,lambda="lambda.1se",equivalent=FALSE,bswimsCycles=10,usrFitFun=NULL,featureSize=0)
Arguments
size The number of candidate variables to be tested (the first size variables fromvariableList)

38 crossValidationFeatureSelection_Res
fraction The fraction of data (sampled with replacement) to be used as train
pvalue The maximum p-value, associated to the NeRI, allowed for a term in the model
loops The number of bootstrap loops
covariates A string of the type "1 + var1 + var2" that defines which variables will alwaysbe included in the models (as covariates)
Outcome The name of the column in data that stores the variable to be predicted by themodel
timeOutcome The name of the column in data that stores the time to event (needed only for aCox proportional hazards regression model fitting)
variableList A data frame with two columns. The first one must have the names of the can-didate variables and the other one the description of such variables
data A data frame where all variables are stored in different columnsmaxTrainModelSize
Maximum number of terms that can be included in the model
type Fit type: Logistic ("LOGIT"), linear ("LM"), or Cox proportional hazards ("COX")
testType Type of non-parametric test to be evaluated by the improvedResiduals func-tion: Binomial test ("Binomial"), Wilcoxon rank-sum test ("Wilcox"), Student’st-test ("tStudent"), or F-test ("Ftest")
startOffset Only terms whose position in the model is larger than the startOffset arecandidates to be removed
elimination.bootstrap.steps
The number of bootstrap loops for the backwards elimination procedure
trainFraction The fraction of data (sampled with replacement) to be used as train for the cross-validation procedure
setIntersect The intersect of the model (To force a zero intersect, set this value to 0)trainRepetition
The number of cross-validation folds (it should be at least equal to 1/trainFractionfor a complete cross-validation)
unirank A list with the results yielded by the uniRankVar function, required only if therank needs to be updated during the cross-validation procedure
print Logical. If TRUE, information will be displayed
plots Logical. If TRUE, plots are displayed
lambda The passed value to the s parameter of the glmnet cross validation coefficient
equivalent Is set to TRUE CV will compute the equivalent model
bswimsCycles The maximum number of models to be returned by BSWiMS.model
usrFitFun A user fitting function to be evaluated by the cross validation procedure
featureSize The original number of features to be explored in the data frame.
Details
This function produces a set of data and plots that can be used to inspect the degree of over-fittingor shrinkage of a model. It uses bootstrapped data, cross-validation data, and, if possible, retraindata.

crossValidationFeatureSelection_Res 39
Value
formula.list A list containing objects of class formula with the formulas used to fit the mod-els found at each cycle
Models.testPrediction
A data frame with the blind test set predictions made at each fold of the cross val-idation (Full B:SWiMS,Median,Bagged,Forward,Backward Elimination), wherethe models used to generate such predictions (formula.list) were generatedvia a feature selection process which included only the train set. It also includesa column with the Outcome of each prediction, and a column with the numberof the fold at which the prediction was made.
FullBSWiMS.testPrediction
A data frame similar to Models.testPrediction, but where the model used togenerate the predictions was the Full model, generated via a feature selectionprocess which included all data.
BSWiMS A list containing the values returned by bootstrapVarElimination_Res usingall data and the model from updatedforwardModel
forwardSelection
A list containing the values returned by ForwardSelection.Model.Res usingall data
updatedforwardModel
A list containing the values returned by updateModel.Res using all data andthe model from forwardSelection
testRMSE The global blind test root-mean-square error (RMSE) of the cross-validationprocedure
testPearson The global blind test Pearson r product-moment correlation coefficient of thecross-validation procedure
testSpearman The global blind test Spearman ρ rank correlation coefficient of the cross-validationprocedure
FulltestRMSE The global blind test RMSE of the Full modelFullTestPearson
The global blind test Pearson r product-moment correlation coefficient of theFull model
FullTestSpearman
The global blind test Spearman ρ rank correlation coefficient of the Full model
trainRMSE The train RMSE at each fold of the cross-validation procedure
trainPearson The train Pearson r product-moment correlation coefficient at each fold of thecross-validation procedure
trainSpearman The train Spearman ρ rank correlation coefficient at each fold of the cross-validation procedure
FullTrainRMSE The train RMSE of the Full model at each fold of the cross-validation procedureFullTrainPearson
The train Pearson r product-moment correlation coefficient of the Full model ateach fold of the cross-validation procedure

40 crossValidationFeatureSelection_Res
FullTrainSpearman
The train Spearman ρ rank correlation coefficient of the Full model at each foldof the cross-validation procedure
testRMSEAtFold The blind test RMSE at each fold of the cross-validation procedureFullTestRMSEAtFold
The blind test RMSE of the Full model at each fold of the cross-validation pro-cedure
Fullenet An object of class cv.glmnet containing the results of an elastic net cross-validation fit
LASSO.testPredictions
A data frame similar to Models.testPrediction, but where the predictionswere made by the elastic net model
LASSOVariables A list with the elastic net Full model and the models found at each cross-validation fold
byFoldTestMS A vector with the Mean Square error for each blind foldbyFoldTestSpearman
A vector with the Spearman correlation between prediction and outcome foreach blind fold
byFoldTestPearson
A vector with the Pearson correlation between prediction and outcome for eachblind fold
byFoldCstat A vector with the C-index (Somers’ Dxy rank correlation :rcorr.cens) betweenprediction and outcome for each blind fold
CVBlindPearson A vector with the Pearson correlation between the outcome and prediction foreach repeated experiment
CVBlindSpearman
A vector with the Spearm correlation between the outcome and prediction foreach repeated experiment
CVBlindRMS A vector with the RMS between the outcome and prediction for each repeatedexperiment
Models.trainPrediction
A data frame with the outcome and the train prediction of every modelFullBSWiMS.trainPrediction
A data frame with the outcome and the train prediction at each CV fold for themain model
LASSO.trainPredictions
A data frame with the outcome and the prediction of each enet lasso model
uniTrainMSS A data frame with mean square of the train residuals from the univariate modelsof the model terms
uniTestMSS A data frame with mean square of the test residuals of the univariate models ofthe model terms
BSWiMS.ensemble.prediction
The ensemble prediction by all models on the test dataAtOptFormulas.list
The list of formulas with "optimal" performance

CVsignature 41
ForwardFormulas.list
The list of formulas produced by the forward procedurebaggFormulas.list
The list of the bagged modelsLassoFilterVarList
The list of variables used by LASSO fitting
Author(s)
Jose G. Tamez-Pena and Antonio Martinez-Torteya
See Also
crossValidationFeatureSelection_Bin, improvedResiduals, bootstrapVarElimination_Res
CVsignature Cross-validated Signature
Description
A formula based wrapper of the getSignature function
Usage
CVsignature(formula = formula,data=NULL,...)
Arguments
formula The base formula
data The data to be used for training the signature method
... Parameters for the getSignature function
Value
fit A getSignature object.
method The distance methodvariable.importance
The named vector of relevant features
Author(s)
Jose G. Tamez-Pena
See Also
getSignature,signatureDistance

42 EmpiricalSurvDiff
EmpiricalSurvDiff Estimate the LR value and its associated p-values
Description
Permutations or Bootstrapping computation of the standardized log-rank (SLR) or the Chi=SLR^2p-values for differences in survival times
Usage
EmpiricalSurvDiff(times=times,status=status,groups=groups,samples=1000,type=c("SLR","Chi"),plots=FALSE,minAproxSamples=100,computeDist=FALSE,...)
Arguments
times A numeric vector with he observed times to event
status A numeric vector indicating if the time to event is censored
groups A numeric vector indicating the label of the two survival groups
samples The number of bootstrap samples
type The type of log-rank statistics. SLR or Chi
plots If TRUE, the Kaplan-Meier plot will be plottedminAproxSamples
The number of tail samples used for the normal-distribution approximation
computeDist If TRUE, it will compute the bootstrapped distribution of the SLR
... Additional parameters for the plot
Details
It will compute the null distribution of the SRL or the square SLR (Chi) via permutations, and itwill return the p-value of differences between survival times between two groups. It may also beused to compute the empirical distribution of the difference in SLR using bootstrapping. (com-puteDist=TRUE) The p-values will be estimated based on the sampled distribution, or normal-approximated along the tails.

EmpiricalSurvDiff 43
Value
pvalue the minimum one-tailed p-value : min[p(SRL < 0),p(SRL > 0)] for type="SLR"or the two tailed p-value: 1-p(|SRL| > 0) for type="Chi"
LR A list of LR statistics: LR=Expected, VR=Variance, SLR=Standardized LR.
p.equal The two tailed p-value: 1-p(|SRL| > 0)
p.sup The one tailed p-value: p(SRL < 0), return NA for type="Chi"
p.inf The one tailed p-value: p(SRL > 0), return NA for type="Chi"
nullDist permutation derived probability density function of the null distribution
LRDist bootstrapped derived probability density function of the SLR (computeDist=TRUE)
Author(s)
Jose G. Tamez-Pena
Examples
## Not run:
library(rpart)data(stagec)
# The Log-Rank Analysis using survdiff
lrsurvdiff <- survdiff(Surv(pgtime,pgstat)~grade>2,data=stagec)print(lrsurvdiff)
# The Log-Rank Analysis: permutations of the null Chi distributionlrp <- EmpiricalSurvDiff(stagec$pgtime,stagec$pgstat,stagec$grade>2,
type="Chi",plots=TRUE,samples=10000,main="Chi Null Distribution")
print(list(unlist(c(lrp$LR,lrp$pvalue))))
# The Log-Rank Analysis: permutations of the null SLR distributionlrp <- EmpiricalSurvDiff(stagec$pgtime,stagec$pgstat,stagec$grade>2,
type="SLR",plots=TRUE,samples=10000,main="SLR Null Distribution")
print(list(unlist(c(lrp$LR,lrp$pvalue))))
# The Log-Rank Analysis: Bootstraping the SLR distributionlrp <- EmpiricalSurvDiff(stagec$pgtime,stagec$pgstat,stagec$grade>2,
computeDist=TRUE,plots=TRUE,samples=100000,main="SLR Null and SLR bootrapped")
print(list(unlist(c(lrp$LR,lrp$pvalue))))
## End(Not run)

44 ensemblePredict
ensemblePredict The median prediction from a list of models
Description
Given a list of model formulas, this function will train such models and return the a single(ensemble)prediction from the list of formulas on a test data set. It may also provides a k-nearest neighbors(KNN) prediction using the features listed in such models.
Usage
ensemblePredict(formulaList,trainData,testData = NULL,predictType = c("prob", "linear"),type = c("LOGIT", "LM", "COX","SVM"),Outcome = NULL,nk = 0
)
Arguments
formulaList A list made of objects of class formula, each representing a model formula tobe fitted and predicted with
trainData A data frame with the data to train the model, where all variables are stored indifferent columns
testData A data frame similar to trainData, but with the data set to be predicted. IfNULL, trainData will be used
predictType Prediction type: Probability ("prob") or linear predictor ("linear")
type Fit type: Logistic ("LOGIT"), linear ("LM"), or Cox proportional hazards ("COX")
Outcome The name of the column in data that stores the variable to be predicted by themodel
nk The number of neighbors used to generate the KNN classification. If zero, k isset to the square root of the number of cases. If less than zero, it will not performthe KNN classification
ValueensemblePredict
A vector with the median prediction for the testData data set, using the modelsfrom formulaList
medianKNNPredict
A vector with the median prediction for the testData data set, using the KNNmodels
predictions A matrix, where each column represents the predictions made with each modelfrom formulaList

featureAdjustment 45
KNNpredictions A matrix, where each column represents the predictions made with a differentKNN model
wPredict A vector with the weighted mean ensemble
Author(s)
Jose G. Tamez-Pena and Antonio Martinez-Torteya
featureAdjustment Adjust each listed variable to the provided set of covariates
Description
This function fits the candidate variables to the provided model,for each strata, on a control popu-lation. If the variance of the residual (the fitted observation minus the real observation) is reducedsignificantly, then, such residual is used in the resulting data frame. Otherwise, the control mean issubtracted to the observation.
Usage
featureAdjustment(variableList,baseModel,strata = NA,data,referenceframe,type = c("LM", "GLS"),pvalue = 0.05,correlationGroup = "ID")
Arguments
variableList A data frame with two columns. The first one must have the names of the can-didate variables and the other one the description of such variables
baseModel A string of the type "1 + var1 + var2" that defines the model to which variableswill be fitted
strata The name of the column in data that stores the variable that will be used tostratify the model
data A data frame where all variables are stored in different columns
referenceframe A data frame similar to data, but with only the control population
type Fit type: linear fitting ("LM"), or generalized least squares fitting ("GLS")
pvalue The maximum p-value, associated to the F-test, for the model to be allowed toreduce variability
correlationGroup
The name of the column in data that stores the variable to be used to group thedata (only needed if type defined as "GLS")

46 FilterUnivariate
Value
A data frame, where each input observation has been adjusted from data at each strata
Note
This function prints the residuals and the F-statistic for all candidate variables
Author(s)
Jose G. Tamez-Pena and Antonio Martinez-Torteya
FilterUnivariate Univariate Filters
Description
Returns the top set of features that are statistically associated with the outcome.
Usage
univariate_Logit(data=NULL, Outcome=NULL, pvalue=0.2, adjustMethod="BH",uniTest=c("zIDI","zNRI"),limit=0,...)
univariate_residual(data=NULL, Outcome=NULL, pvalue=0.2, adjustMethod="BH",uniTest=c("Ftest","Binomial","Wilcox","tStudent"),type=c("LM","LOGIT"),limit=0,...)
univariate_tstudent(data=NULL, Outcome=NULL, pvalue=0.2, adjustMethod="BH",limit=0,...)
univariate_Wilcoxon(data=NULL, Outcome=NULL, pvalue=0.2, adjustMethod="BH",limit=0,...)
univariate_correlation(data=NULL, Outcome=NULL, pvalue=0.2, adjustMethod="BH",method = "kendall",limit=0,...)
correlated_Remove(data=NULL,fnames=NULL,thr=0.999)
Arguments
data The data frame
Outcome The outcome feature
pvalue The threshold pvalue used after the p.adjust method
adjustMethod The method used by the p.adjust method
uniTest The unitTest to be performed by the linear fitting model
type The type of linear model: LM or LOGIT
method The correlation method: pearson,spearman or kendall.
limit The samples-wise fraction of features to return.

FilterUnivariate 47
fnames The list of features to test inside the correlated_Remove function
thr The maximum correlation to allow between features
... Parameters to be passed to the correlated_Remove function
Value
Named vector with the adjusted p-values or the list of no-correlated features for the correlated_Remove
Author(s)
Jose G. Tamez-Pena
Examples
## Not run:
library("FRESA.CAD")
### Univariate Filter Examples ####
# Get the stage C prostate cancer data from the rpart packagedata(stagec,package = "rpart")
# Prepare the data. Create a model matrix without the event time and interactionsstagec$pgtime <- NULLstagec$eet <- as.factor(stagec$eet)options(na.action = 'na.pass')stagec_mat <- cbind(pgstat = stagec$pgstat,
as.data.frame(model.matrix(pgstat ~ .*.,stagec))[-1])fnames <- colnames(stagec_mat)fnames <- str_replace_all(fnames,":","__")colnames(stagec_mat) <- fnames
# Impute the missing datadataCancerImputed <- nearestNeighborImpute(stagec_mat)
dataCancerImputed[,1:ncol(dataCancerImputed)] <- sapply(dataCancerImputed,as.numeric)
# Get the top Features associated to pgstat
q_values <- univariate_Logit(data=dataCancerImputed,Outcome="pgstat",pvalue = 0.05)
qValueMatrix <- q_valuesidiqValueMatrix <- q_valuesbarplot(-log(q_values),las=2,cex.names=0.4,ylab="-log(Q)",main="Association with PGStat: IDI Test")
q_values <- univariate_Logit(data=dataCancerImputed,Outcome="pgstat",uniTest="zNRI",pvalue = 0.05)
qValueMatrix <- cbind(idiqValueMatrix,q_values[names(idiqValueMatrix)])
48 ForwardSelection.Model.Bin
q_values <- univariate_residual(data=dataCancerImputed,Outcome="pgstat",pvalue = 0.05,type="LOGIT")
qValueMatrix <- cbind(qValueMatrix,q_values[names(idiqValueMatrix)])
q_values <- univariate_tstudent(data=dataCancerImputed,Outcome="pgstat",pvalue = 0.05)
qValueMatrix <- cbind(qValueMatrix,q_values[names(idiqValueMatrix)])
q_values <- univariate_Wilcoxon(data=dataCancerImputed,Outcome="pgstat",pvalue = 0.05)
qValueMatrix <- cbind(qValueMatrix,q_values[names(idiqValueMatrix)])
q_values <- univariate_correlation(data=dataCancerImputed,Outcome="pgstat",pvalue = 0.05)
qValueMatrix <- cbind(qValueMatrix,q_values[names(idiqValueMatrix)])
q_values <- univariate_correlation(data=dataCancerImputed,Outcome="pgstat",pvalue = 0.05,method = "pearson")
#The qValueMatrix has the qValues of all filter methods.qValueMatrix <- cbind(qValueMatrix,q_values[names(idiqValueMatrix)])colnames(qValueMatrix) <- c("IDI","NRI","F","t","W","K","P")#Do the log transform to display the heatmapqValueMatrix <- -log10(qValueMatrix)#the Heatmap of the q-valuesgplots::heatmap.2(qValueMatrix,Rowv = FALSE,dendrogram = "col",main = "Method q.values",cexRow = 0.4)
## End(Not run)
ForwardSelection.Model.Bin
IDI/NRI-based feature selection procedure for linear, logistic, and Coxproportional hazards regression models
Description
This function performs a bootstrap sampling to rank the variables that statistically improve pre-diction. After the frequency rank, the function uses a forward selection procedure to create a finalmodel, whose terms all have a significant contribution to the integrated discrimination improvement(IDI) or the net reclassification improvement (NRI). For each bootstrap, the IDI/NRI is computedand the variable with the largest statically significant IDI/NRI is added to the model. The procedure

ForwardSelection.Model.Bin 49
is repeated at each bootstrap until no more variables can be inserted. The variables that enter themodel are then counted, and the same procedure is repeated for the rest of the bootstrap loops. Thefrequency of variable-inclusion in the model is returned as well as a model that uses the frequencyof inclusion.
Usage
ForwardSelection.Model.Bin(size = 100,fraction = 1,pvalue = 0.05,loops = 100,covariates = "1",Outcome,variableList,data,maxTrainModelSize = 20,type = c("LM", "LOGIT", "COX"),timeOutcome = "Time",selectionType=c("zIDI", "zNRI"),cores = 4,randsize = 0,featureSize=0)
Arguments
size The number of candidate variables to be tested (the first size variables fromvariableList)
fraction The fraction of data (sampled with replacement) to be used as train
pvalue The maximum p-value, associated to either IDI or NRI, allowed for a term inthe model
loops The number of bootstrap loops
covariates A string of the type "1 + var1 + var2" that defines which variables will alwaysbe included in the models (as covariates)
Outcome The name of the column in data that stores the variable to be predicted by themodel
variableList A data frame with two columns. The first one must have the names of the can-didate variables and the other one the description of such variables
data A data frame where all variables are stored in different columnsmaxTrainModelSize
Maximum number of terms that can be included in the model
type Fit type: Logistic ("LOGIT"), linear ("LM"), or Cox proportional hazards ("COX")
timeOutcome The name of the column in data that stores the time to event (needed only for aCox proportional hazards regression model fitting)
selectionType The type of index to be evaluated by the improveProb function (Hmisc pack-age): z-score of IDI or of NRI
cores Cores to be used for parallel processing

50 ForwardSelection.Model.Res
randsize the model size of a random outcome. If randsize is less than zero. It will estimatethe size
featureSize The original number of features to be explored in the data frame.
Value
final.model An object of class lm, glm, or coxph containing the final model
var.names A vector with the names of the features that were included in the final model
formula An object of class formula with the formula used to fit the final model
ranked.var An array with the ranked frequencies of the features
z.selection A vector in which each term represents the z-score of the index defined inselectionType obtained with the Full model and the model without one term
formula.list A list containing objects of class formula with the formulas used to fit the mod-els found at each cycle
variableList A list of variables used in the forward selection
Author(s)
Jose G. Tamez-Pena and Antonio Martinez-Torteya
References
Pencina, M. J., D’Agostino, R. B., & Vasan, R. S. (2008). Evaluating the added predictive ability ofa new marker: from area under the ROC curve to reclassification and beyond. Statistics in medicine27(2), 157-172.
See Also
ForwardSelection.Model.Res
ForwardSelection.Model.Res
NeRI-based feature selection procedure for linear, logistic, or Cox pro-portional hazards regression models
Description
This function performs a bootstrap sampling to rank the most frequent variables that statisticallyaid the models by minimizing the residuals. After the frequency rank, the function uses a forwardselection procedure to create a final model, whose terms all have a significant contribution to thenet residual improvement (NeRI).
ForwardSelection.Model.Res 51
Usage
ForwardSelection.Model.Res(size = 100,fraction = 1,pvalue = 0.05,loops = 100,covariates = "1",Outcome,variableList,data,maxTrainModelSize = 20,type = c("LM", "LOGIT", "COX"),testType=c("Binomial", "Wilcox", "tStudent", "Ftest"),timeOutcome = "Time",cores = 4,randsize = 0,featureSize=0)
Arguments
size The number of candidate variables to be tested (the first size variables fromvariableList)
fraction The fraction of data (sampled with replacement) to be used as train
pvalue The maximum p-value, associated to the NeRI, allowed for a term in the model(controls the false selection rate)
loops The number of bootstrap loops
covariates A string of the type "1 + var1 + var2" that defines which variables will alwaysbe included in the models (as covariates)
Outcome The name of the column in data that stores the variable to be predicted by themodel
variableList A data frame with two columns. The first one must have the names of the can-didate variables and the other one the description of such variables
data A data frame where all variables are stored in different columnsmaxTrainModelSize
Maximum number of terms that can be included in the model
type Fit type: Logistic ("LOGIT"), linear ("LM"), or Cox proportional hazards ("COX")
testType Type of non-parametric test to be evaluated by the improvedResiduals func-tion: Binomial test ("Binomial"), Wilcoxon rank-sum test ("Wilcox"), Student’st-test ("tStudent"), or F-test ("Ftest")
timeOutcome The name of the column in data that stores the time to event (needed only for aCox proportional hazards regression model fitting)
cores Cores to be used for parallel processing
randsize the model size of a random outcome. If randsize is less than zero. It will estimatethe size
featureSize The original number of features to be explored in the data frame.

52 FRESA.Model
Value
final.model An object of class lm, glm, or coxph containing the final model
var.names A vector with the names of the features that were included in the final model
formula An object of class formula with the formula used to fit the final model
ranked.var An array with the ranked frequencies of the features
formula.list A list containing objects of class formula with the formulas used to fit the mod-els found at each cycle
variableList A list of variables used in the forward selection
Author(s)
Jose G. Tamez-Pena and Antonio Martinez-Torteya
See Also
ForwardSelection.Model.Bin
FRESA.Model Automated model selection
Description
This function uses a wrapper procedure to select the best features of a non-penalized linear modelthat best predict the outcome, given the formula of an initial model template (linear, logistic, or Coxproportional hazards), an optimization procedure, and a data frame. A filter scheme may be enabledto reduce the search space of the wrapper procedure. The false selection rate may be empiricallycontrolled by enabling bootstrapping, and model shrinkage can be evaluated by cross-validation.
Usage
FRESA.Model(formula,data,OptType = c("Binary", "Residual"),pvalue = 0.05,filter.p.value = 0.10,loops = 32,maxTrainModelSize = 20,elimination.bootstrap.steps = 100,bootstrap.steps = 100,print = FALSE,plots = FALSE,CVfolds = 1,repeats = 1,nk = 0,categorizationType = c("Raw",

FRESA.Model 53
"Categorical","ZCategorical","RawZCategorical","RawTail","RawZTail","Tail","RawRaw"),
cateGroups = c(0.1, 0.9),raw.dataFrame = NULL,var.description = NULL,testType = c("zIDI",
"zNRI","Binomial","Wilcox","tStudent","Ftest"),
lambda="lambda.1se",equivalent=FALSE,bswimsCycles=20,usrFitFun=NULL)
Arguments
formula An object of class formula with the formula to be fitted
data A data frame where all variables are stored in different columns
OptType Optimization type: Based on the integrated discrimination improvement (Bi-nary) index for binary classification ("Binary"), or based on the net residualimprovement (NeRI) index for linear regression ("Residual")
pvalue The maximum p-value, associated to the testType, allowed for a term in themodel (it will control the false selection rate)
filter.p.value The maximum p-value, for a variable to be included to the feature selectionprocedure
loops The number of bootstrap loops for the forward selection proceduremaxTrainModelSize
Maximum number of terms that can be included in the modelelimination.bootstrap.steps
The number of bootstrap loops for the backwards elimination procedurebootstrap.steps
The number of bootstrap loops for the bootstrap validation procedure
print Logical. If TRUE, information will be displayed
plots Logical. If TRUE, plots are displayed
CVfolds The number of folds for the final cross-validation
repeats The number of times that the cross-validation procedure will be repeated

54 FRESA.Model
nk The number of neighbors used to generate a k-nearest neighbors (KNN) classi-fication. If zero, k is set to the square root of the number of cases. If less thanzero, it will not perform the KNN classification
categorizationType
How variables will be analyzed: As given in data ("Raw"); broken into thep-value categories given by cateGroups ("Categorical"); broken into the p-value categories given by cateGroups, and weighted by the z-score ("ZCate-gorical"); broken into the p-value categories given by cateGroups, weighted bythe z-score, plus the raw values ("RawZCategorical"); raw values, plus the tails("RawTail"); or raw values, weighted by the z-score, plus the tails ("RawZTail")
cateGroups A vector of percentiles to be used for the categorization procedure
raw.dataFrame A data frame similar to data, but with unadjusted data, used to get the meansand variances of the unadjusted data
var.description
A vector of the same length as the number of columns of data, containing adescription of the variables
testType For an Binary-based optimization, the type of index to be evaluated by theimproveProb function (Hmisc package): z-value of Binary or of NRI. For aNeRI-based optimization, the type of non-parametric test to be evaluated by theimprovedResiduals function: Binomial test ("Binomial"), Wilcoxon rank-sumtest ("Wilcox"), Student’s t-test ("tStudent"), or F-test ("Ftest")
lambda The passed value to the s parameter of the glmnet cross validation coefficient
equivalent Is set to TRUE CV will compute the equivalent model
bswimsCycles The maximum number of models to be returned by BSWiMS.model
usrFitFun An optional user provided fitting function to be evaluated by the cross validationprocedure: fitting: usrFitFun(formula,data), with a predict function
Details
This important function of FRESA.CAD will model or cross validate the models. Given an outcomeformula, and a data.frame this function will do an univariate analysis of the data (univariateRankVariables),then it will select the top ranked variables; after that it will select the model that best describes theoutcome. At output it will return the bootstrapped performance of the model (bootstrapValidation_Binor bootstrapValidation_Res). It can be set to report the cross-validation performance of the se-lection process which will return either a crossValidationFeatureSelection_Bin or a crossValidationFeatureSelection_Resobject.
Value
BSWiMS.model An object of class lm, glm, or coxph containing the final model
reducedModel The resulting object of the backward elimination procedureunivariateAnalysis
A data frame with the results from the univariate analysis
forwardModel The resulting object of the feature selection function.updatedforwardModel
The resulting object of the the update procedure

FRESA.Model 55
bootstrappedModel
The resulting object of the bootstrap procedure on final.model
cvObject The resulting object of the cross-validation procedure
used.variables The number of terms that passed the filter procedure
call the function call
Author(s)
Jose G. Tamez-Pena and Antonio Martinez-Torteya
References
Pencina, M. J., D’Agostino, R. B., & Vasan, R. S. (2008). Evaluating the added predictive ability ofa new marker: from area under the ROC curve to reclassification and beyond. Statistics in medicine27(2), 157-172.
Examples
## Not run:
# Start the graphics device driver to save all plots in a pdf formatpdf(file = "FRESA.Model.Example.pdf",width = 8, height = 6)# Get the stage C prostate cancer data from the rpart packagedata(stagec,package = "rpart")options(na.action = 'na.pass')stagec_mat <- cbind(pgstat = stagec$pgstat,
pgtime = stagec$pgtime,as.data.frame(model.matrix(Surv(pgtime,pgstat) ~ .,stagec))[-1])
data(cancerVarNames)dataCancerImputed <- nearestNeighborImpute(stagec_mat)
# Get a Cox proportional hazards model using:# - The default parametersmd <- FRESA.Model(formula = Surv(pgtime, pgstat) ~ 1,
data = dataCancerImputed,var.description = cancerVarNames[,2])
pt <- plot(md$bootstrappedModel)sm <- summary(md$BSWiMS.model)print(sm$coefficients)
# Get a 10 fold CV Cox proportional hazards model using:# - Repeat 10 times de CVmd <- FRESA.Model(formula = Surv(pgtime, pgstat) ~ 1,
data = dataCancerImputed, CVfolds = 10,repeats = 10,var.description = cancerVarNames[,2])
pt <- plotModels.ROC(md$cvObject$Models.testPrediction,theCVfolds = 10)print(pt$predictionTable)
56 FRESAScale
pt <- plotModels.ROC(md$cvObject$LASSO.testPredictions,theCVfolds = 10)pt <- plotModels.ROC(md$cvObject$KNN.testPrediction,theCVfolds = 10)
# Get a regression of the survival time
timeSubjects <- dataCancerImputedtimeSubjects$pgtime <- log(timeSubjects$pgtime)
md <- FRESA.Model(formula = pgtime ~ 1,data = timeSubjects,var.description = cancerVarNames[,2])
pt <- plot(md$bootstrappedModel)sm <- summary(md$BSWiMS.model)print(sm$coefficients)
# Get a logistic regression model using# - The default parameters and removing time as possible predictor
dataCancerImputed$pgtime <- NULL
md <- FRESA.Model(formula = pgstat ~ 1,data = dataCancerImputed,var.description = cancerVarNames[,2])
pt <- plot(md$bootstrappedModel)sm <- summary(md$BSWiMS.model)print(sm$coefficients)
# Get a logistic regression model using:# - residual-based optimizationmd <- FRESA.Model(formula = pgstat ~ 1,
data = dataCancerImputed,OptType = "Residual",var.description = cancerVarNames[,2])
pt <- plot(md$bootstrappedModel)sm <- summary(md$BSWiMS.model)print(sm$coefficients)
# Shut down the graphics device driverdev.off()
## End(Not run)
FRESAScale Data frame normalization
Description
All features from the data will be normalized based on the distribution of the reference data-frame

getKNNpredictionFromFormula 57
Usage
FRESAScale(data,refFrame=NULL,method=c("Norm","Order","RankInv"),refMean=NULL,refDisp=NULL)
Arguments
data The dataframe to be normalized
refFrame The reference frame that will be used to extract the feature distribution
method The normalization method. Norm: Mean and Std, Order: Median and IQR,RankInv: rankInverseNormalDataFrame
refMean The mean vector of the reference frame
refDisp the data dispersion method of the reference frame
Details
The data-frame will be normalized according to the distribution of the reference frame or the meanvector(refMean) scaled by the reference dispersion vector(refDisp).
Value
scaledData The scaled data set
refMean The mean or median vector of the reference frame
refDisp The data dispersion (standard deviation or IQR)
Author(s)
Jose G. Tamez-Pena
See Also
rankInverseNormalDataFrame
getKNNpredictionFromFormula
Predict classification using KNN
Description
This function will return the classification of the samples of a test set using a k-nearest neighbors(KNN) algorithm with euclidean distances, given a formula and a train set.

58 getSignature
Usage
getKNNpredictionFromFormula(model.formula,trainData,testData,Outcome = "CLASS",nk = 3)
Arguments
model.formula An object of class formula with the formula to be used
trainData A data frame with the data to train the model, where all variables are stored indifferent columns
testData A data frame similar to trainData, but with the data set to be predicted
Outcome The name of the column in trainData that stores the variable to be predictedby the model
nk The number of neighbors used to generate the KNN classification
Value
prediction A vector with the predicted outcome for the testData data set
prob The proportion of k neighbors that predicted the class to be the one being re-ported in prediction
binProb The proportion of k neighbors that predicted the class of the outcome to be equalto 1
featureList A vector with the names of the features used by the KNN procedure
Author(s)
Jose G. Tamez-Pena and Antonio Martinez-Torteya
See Also
predict.fitFRESA, knn
getSignature Returns a CV signature template
Description
This function returns the matrix template [mean,sd,IQR] that maximizes the ROC AUC betweencases of controls.

getSignature 59
Usage
getSignature(data,varlist=NULL,Outcome=NULL,target=c("All","Control","Case"),CVFolds=3,repeats=9,distanceFunction=signatureDistance,...
)
Arguments
data A data frame whose rows contains the sampled "subject" data, and each columnis a feature.
varlist The varlist is a character vector that list all the features to be searched by theBackward elimination forward selection procedure.
Outcome The name of the column that has the binary outcome. 1 for cases, 0 for controls
target The target template that will be used to maximize the AUC.
CVFolds The number of folds to be used
repeats how many times the CV procedure will be repeateddistanceFunction
The function to be used to compute the distance between the template and eachsample
... the parameters to be passed to the distance function
Details
The function repeats full cycles of a Cross Validation (RCV) procedure. At each CV cycle thealgorithm estimate the mean template and the distance between the template and the test samples.The ROC AUC is computed after the RCV is completed. A forward selection scheme. The set offeatures that maximize the AUC during the Forward loop is returned.
ValuecontrolTemplate
the control matrix with quantile probs[0.025,0.25,0.5,0.75,0.975] that maximizedthe AUC (template of controls subjects)
caseTamplate the case matrix with quantile probs[0.025,0.25,0.5,0.75,0.975] that maximizedthe AUC (template of case subjects)
AUCevolution The AUC value at each cyclefeatureSizeEvolution
The number of features at each cycle
featureList The final list of features

60 getVar.Bin
CVOutput A data frame with four columns: ID, Outcome, Case Distances, Control Dis-tances. Each row contains the CV test results
MaxAUC The maximum ROC AUC
Author(s)
Jose G. Tamez-Pena
getVar.Bin Analysis of the effect of each term of a binary classification model byanalysing its reclassification performance
Description
This function provides an analysis of the effect of each model term by comparing the binary classi-fication performance between the Full model and the model without each term. The model is fittedusing the train data set, but probabilities are predicted for the train and test data sets. Reclassifi-cation improvement is evaluated using the improveProb function (Hmisc package). Additionally,the integrated discrimination improvement (IDI) and the net reclassification improvement (NRI) ofeach model term are reported.
Usage
getVar.Bin(object,data,Outcome = "Class",type = c("LOGIT", "LM", "COX"),testData = NULL,callCpp=TRUE)
Arguments
object An object of class lm, glm, or coxph containing the model to be analysed
data A data frame where all variables are stored in different columns
Outcome The name of the column in data that stores the variable to be predicted by themodel
type Fit type: Logistic ("LOGIT"), linear ("LM"), or Cox proportional hazards ("COX")
testData A data frame similar to data, but with a data set to be independently tested. IfNULL, data will be used.
callCpp is set to true it will use the c++ implementation of improvement.

getVar.Res 61
Value
z.IDIs A vector in which each term represents the z-score of the IDI obtained with theFull model and the model without one term
z.NRIs A vector in which each term represents the z-score of the NRI obtained with theFull model and the model without one term
IDIs A vector in which each term represents the IDI obtained with the Full model andthe model without one term
NRIs A vector in which each term represents the NRI obtained with the Full modeland the model without one term
testData.z.IDIs
A vector similar to z.IDIs, where values were estimated in testdatatestData.z.NRIs
A vector similar to z.NRIs, where values were estimated in testdata
testData.IDIs A vector similar to IDIs, where values were estimated in testdata
testData.NRIs A vector similar to NRIs, where values were estimated in testdata
uniTrainAccuracy
A vector with the univariate train accuracy of each model variableuniTestAccuracy
A vector with the univariate test accuracy of each model variable
Author(s)
Jose G. Tamez-Pena and Antonio Martinez-Torteya
References
Pencina, M. J., D’Agostino, R. B., & Vasan, R. S. (2008). Evaluating the added predictive ability ofa new marker: from area under the ROC curve to reclassification and beyond. Statistics in medicine27(2), 157-172.
See Also
getVar.Res
getVar.Res Analysis of the effect of each term of a linear regression model byanalysing its residuals
Description
This function provides an analysis of the effect of each model term by comparing the residuals ofthe Full model and the model without each term. The model is fitted using the train data set, butanalysis of residual improvement is done on the train and test data sets. Residuals are comparedby a paired t-test, a paired Wilcoxon rank-sum test, a binomial sign test and the F-test on residualvariance. Additionally, the net residual improvement (NeRI) of each model term is reported.

62 getVar.Res
Usage
getVar.Res(object,data,Outcome = "Class",type = c("LM", "LOGIT", "COX"),testData = NULL,callCpp=TRUE)
Arguments
object An object of class lm, glm, or coxph containing the model to be analyzed
data A data frame where all variables are stored in different columns
Outcome The name of the column in data that stores the variable to be predicted by themodel
type Fit type: Logistic ("LOGIT"), linear ("LM"), or Cox proportional hazards ("COX")
testData A data frame similar to data, but with a data set to be independently tested. IfNULL, data will be used.
callCpp is set to true it will use the c++ implementation of residual improvement.
Value
tP.value A vector in which each element represents the single sided p-value of the pairedt-test comparing the absolute values of the residuals obtained with the Fullmodel and the model without one term
BinP.value A vector in which each element represents the p-value associated with a signifi-cant improvement in residuals according to the binomial sign test
WilcoxP.value A vector in which each element represents the single sided p-value of the Wilcoxonrank-sum test comparing the absolute values of the residuals obtained with theFull model and the model without one term
FP.value A vector in which each element represents the single sided p-value of the F-testcomparing the residual variances of the residuals obtained with the Full modeland the model without one term
NeRIs A vector in which each element represents the net residual improvement be-tween the Full model and the model without one term
testData.tP.value
A vector similar to tP.value, where values were estimated in testdatatestData.BinP.value
A vector similar to BinP.value, where values were estimated in testdatatestData.WilcoxP.value
A vector similar to WilcoxP.value, where values were estimated in testdatatestData.FP.value
A vector similar to FP.value, where values were estimated in testdata
testData.NeRIs A vector similar to NeRIs, where values were estimated in testdata
unitestMSE A vector with the univariate residual mean sum of squares of each model vari-able on the test data
heatMaps 63
unitrainMSE A vector with the univariate residual mean sum of squares of each model vari-able on the train data
Author(s)
Jose G. Tamez-Pena and Antonio Martinez-Torteya
See Also
getVar.Bin
heatMaps Plot a heat map of selected variables
Description
This function creates a heat map for a data set based on a univariate or frequency ranking
Usage
heatMaps(variableList=NULL,varRank = NULL,Outcome,data,title = "Heat Map",hCluster = FALSE,prediction = NULL,Scale = FALSE,theFiveColors=c("blue","cyan","black","yellow","red"),outcomeColors = c("blue","lightgreen","yellow","orangered","red"),transpose=FALSE,...)
Arguments
variableList A data frame with two columns. The first one must have the names of the can-didate variables and the other one the description of such variables
varRank A data frame with the name of the variables in variableList, ranked accordingto a certain metric
Outcome The name of the column in data that stores the variable to be predicted by themodel
data A data frame where all variables are stored in different columns
title The title of the plot
hCluster Logical. If TRUE, variables will be clustered
prediction A vector with a prediction for each subject, which will be used to rank the heatmap

64 heatMaps
Scale An optional value to force the data normalization outcome
theFiveColors the colors of the heatmap
outcomeColors the colors of the outcome bar
transpose transpose the heatmap
... additional parameters for the heatmap.2 function
Value
dataMatrix A matrix with all the terms in data described by variableList
orderMatrix A matrix similar to dataMatrix, where rows are ordered according to the outcome
heatMap A list with the values returned by the heatmap.2 function (gplots package)
Author(s)
Jose G. Tamez-Pena and Antonio Martinez-Torteya
Examples
## Not run:
library(rpart)data(stagec)
# Set the options to keep the naoptions(na.action='na.pass')# create a model matrix with all the NA values imputedstagecImputed <- as.data.frame(nearestNeighborImpute(model.matrix(~.,stagec)[,-1]))
# the simple heat maphm <- heatMaps(Outcome="pgstat",data=stagecImputed,title="Heat Map",Scale=TRUE)
# transposing the heat-map with clustered columshm <- heatMaps(Outcome="pgstat",data=stagecImputed,title="Heat Map",Scale=TRUE,
transpose= TRUE,hCluster = TRUE,cexRow=0.80,cexCol=0.50,srtCol=35)
# transposing the heat-map with reds and time to event as outcomehm <- heatMaps(Outcome="pgtime",data=stagecImputed,title="Heat Map",Scale=TRUE,
theFiveColors=c("black","red","orange","yellow","white"),cexRow=0.50,cexCol=0.80,srtCol=35)
## End(Not run)

improvedResiduals 65
improvedResiduals Estimate the significance of the reduction of predicted residuals
Description
This function will test the hypothesis that, given a set of two residuals (new vs. old), the new onesare better than the old ones as measured with non-parametric tests. Four p-values are provided:one for the binomial sign test, one for the paired Wilcoxon rank-sum test, one for the paired t-test,and one for the F-test. The proportion of subjects that improved their residuals, the proportion thatworsen their residuals, and the net residual improvement (NeRI) will be returned.
Usage
improvedResiduals(oldResiduals,newResiduals,testType = c("Binomial", "Wilcox", "tStudent", "Ftest"))
Arguments
oldResiduals A vector with the residuals of the original model
newResiduals A vector with the residuals of the new model
testType Type of non-parametric test to be evaluated: Binomial test ("Binomial"), Wilcoxonrank-sum test ("Wilcox"), Student’s t-test ("tStudent"), or F-test ("Ftest")
Details
This function will test the hypothesis that the new residuals are "better" than the old residuals. Totest this hypothesis, four types of tests are performed:
1. The paired t-test, which compares the absolute value of the residuals
2. The paired Wilcoxon rank-sum test, which compares the absolute value of residuals
3. The binomial sign test, which evaluates whether the number of subjects with improved resid-uals is greater than the number of subjects with worsened residuals
4. The F-test, which is the standard test for evaluating whether the residual variance is "better"in the new residuals.
The proportions of subjects that improved and worsen their residuals are returned, and so is theNeRI.
Value
p1 Proportion of subjects that improved their residuals to the total number of sub-jects
p2 Proportion of subjects that worsen their residuals to the total number of subjects
NeRI The net residual improvement (p1-p2)
p.value The one tail p-value of the test specified in testType

66 KNN_method
BinP.value The p-value associated with a significant improvement in residuals
WilcoxP.value The single sided p-value of the Wilcoxon rank-sum test comparing the absolutevalues of the new and old residuals
tP.value The single sided p-value of the paired t-test comparing the absolute values ofthe new and old residuals
FP.value The single sided p-value of the F-test comparing the residual variances of thenew and old residuals
Author(s)
Jose G. Tamez-Pena and Antonio Martinez-Torteya
KNN_method KNN Setup for KNN prediction
Description
Prepares the KNN function to be used to predict the class of a new set
Usage
KNN_method(formula = formula,data=NULL,...)
Arguments
formula the base formula to extract the outcome
data the data to be used for training the KNN method
... parameters for the KNN function and the data scaling method
Value
trainData The data frame to be used to train the KNN prediction
scaledData The scaled training set
classData A vector with the outcome to be used by the KNN function
outcome The name of the outcome
usedFeatures The list of features to be used by the KNN method
mean_col A vector with the mean of each training feature
disp_col A vector with the dispesion of each training feature
kn The number of neigbors to be used by the predict function
scaleMethod The scaling method to be used by FRESAScale() function
Author(s)
Jose G. Tamez-Pena

LASSO 67
See Also
class::knn,FRESAScale
LASSO CV LASSO fit with s="lambda.min" or s="lambda.1se"
Description
Fits a glmnet::cv.glmnet object to the data, and sets the prediction to use the features that createdthe minimum CV error or one SE.
Usage
LASSO_MIN(formula = formula,data=NULL,...)LASSO_1SE(formula = formula,data=NULL,...)
Arguments
formula The base formula to extract the outcome
data The data to be used for training the KNN method
... Parameters to be passed to the cv.glmnet function
Value
fit The glmnet::cv.glmnet fitted object
s The s. Set to "lambda.min" or "lambda.1se" for prediction
formula The formula
outcome The name of the outcome
usedFeatures The list of features to be used
Author(s)
Jose G. Tamez-Pena
See Also
glmnet::cv.glmnet

68 listTopCorrelatedVariables
listTopCorrelatedVariables
List the variables that are highly correlated with each other
Description
This function computes the Pearson, Spearman, or Kendall correlation for each specified variablein the data set and returns a list of the variables that are correlated to them. It also provides a shortvariable list without the highly correlated variables.
Usage
listTopCorrelatedVariables(variableList,data,pvalue = 0.001,corthreshold = 0.9,method = c("pearson", "kendall", "spearman"))
Arguments
variableList A data frame with two columns. The first one must have the names of the can-didate variables and the other one the description of such variables
data A data frame where all variables are stored in different columns
pvalue The maximum p-value, associated to method, allowed for a pair of variables tobe defined as significantly correlated
corthreshold The minimum correlation score, associated to method, allowed for a pair ofvariables to be defined as significantly correlated
method Correlation method: Pearson product-moment ("pearson"), Spearman’s rank("spearman"), or Kendall rank ("kendall")
Valuecorrelated.variables
A data frame with two columns:
1. cor.var.names: The variables that are correlated2. cor.var.value: The correlation value
short.list A vector with a list of variables that are not correlated to each other. For everycorrelated pair, only the variable that first entered the correlation analysis waskept
Author(s)
Jose G. Tamez-Pena and Antonio Martinez-Torteya

LM_RIDGE_MIN 69
Examples
## Not run:# Start the graphics device driver to save all plots in a pdf formatpdf(file = "Example.pdf")# Get the stage C prostate cancer data from the rpart packagelibrary(rpart)data(stagec)# Split the stages into several columnsdataCancer <- cbind(stagec[,c(1:3,5:6)],
gleason4 = 1*(stagec[,7] == 4),gleason5 = 1*(stagec[,7] == 5),gleason6 = 1*(stagec[,7] == 6),gleason7 = 1*(stagec[,7] == 7),gleason8 = 1*(stagec[,7] == 8),gleason910 = 1*(stagec[,7] >= 9),eet = 1*(stagec[,4] == 2),diploid = 1*(stagec[,8] == "diploid"),tetraploid = 1*(stagec[,8] == "tetraploid"),notAneuploid = 1-1*(stagec[,8] == "aneuploid"))
# Remove the incomplete casesdataCancer <- dataCancer[complete.cases(dataCancer),]# Load a pre-stablished data frame with the names and descriptions of all variablesdata(cancerVarNames)# Get the variables that have a correlation coefficient larger# than 0.65 at a p-value of 0.05cor <- listTopCorrelatedVariables(variableList = cancerVarNames,
data = dataCancer,pvalue = 0.05,corthreshold = 0.65,method = "pearson")
# Shut down the graphics device driverdev.off()## End(Not run)
LM_RIDGE_MIN Ridge Linear Models
Description
FRESA wrapper to fit MASS::lm.ridge object to the data and returning the coef with minimumGCV
Usage
LM_RIDGE_MIN(formula = formula,data=NULL,...)

70 modelFitting
Arguments
formula The base formula to extract the outcomedata The data to be used for training the method... Parameters to be passed to the MASS::lm.ridge function
Value
fit The MASS::lm.ridge fitted object
Author(s)
Jose G. Tamez-Pena
See Also
MASS::lm.ridge
modelFitting Fit a model to the data
Description
This function fits a linear, logistic, or Cox proportional hazards regression model to given data
Usage
modelFitting(model.formula,data,type = c("LOGIT", "LM", "COX","SVM"),fitFRESA=TRUE,...)
Arguments
model.formula An object of class formula with the formula to be useddata A data frame where all variables are stored in different columnstype Fit type: Logistic ("LOGIT"), linear ("LM"), Cox proportional hazards ("COX")
or "SVM"fitFRESA if true it will perform use the FRESA cpp code for fitting... Additional parameters for fitting a default glm object
Value
A fitted model of the type defined in type
Author(s)
Jose G. Tamez-Pena and Antonio Martinez-Torteya

mRMR.classic_FRESA 71
mRMR.classic_FRESA FRESA.CAD wrapper of mRMRe::mRMR.classic
Description
Returns the positive MI-scored set of maximum relevance minimum redundancy (mRMR) featuresreturned by the mMRM.classic function
Usage
mRMR.classic_FRESA(data=NULL, Outcome=NULL,feature_count=0,...)
Arguments
data The data frame
Outcome The outcome feature
feature_count The number of features to return
... Extra parameters to be passed to the mRMRe::mMRM.classic function
Value
Named vector with the MI-score of the selected features
Author(s)
Jose G. Tamez-Pena
See Also
mRMRe::mRMR.classic
NAIVE_BAYES Naive Bayes Modeling
Description
FRESA wrapper to fit naivebayes::naive_bayes object to the data
Usage
NAIVE_BAYES(formula = formula,data=NULL,...)

72 nearestNeighborImpute
Arguments
formula The base formula to extract the outcome
data The data to be used for training the method
... Parameters to be passed to the naivebayes::naive_bayes function
Value
fit The naivebayes::naive_bayes fitted object
Author(s)
Jose G. Tamez-Pena
See Also
naivebayes::naive_bayes
nearestNeighborImpute nearest neighbor NA imputation
Description
The function will replace any NA present in the data-frame with the median values of the nearestneighbours.
Usage
nearestNeighborImpute(tobeimputed,referenceSet=NULL,distol=1.05)
Arguments
tobeimputed a data frame with missing values (NA values)
referenceSet An optional data frame with a set of complete observations. This data frame willbe added to the search set
distol The tolerance used to define if a particular set of row observations is similar tothe minimum distance
Details
This function will find any NA present in the data set and it will search for the row set of completeobservations that have the closest IQR normalized Manhattan distance to the row with missingvalues. If a set of rows have similar minimum distances (toldis*(minimum distance) > row setdistance) the median value will be used.
plot.bootstrapValidation_Bin 73
Value
A data frame, where each NA has been replaced with the value of the nearest neighbors
Author(s)
Jose G. Tamez-Pena
Examples
## Not run:# Get the stage C prostate cancer data from the rpart packagelibrary(rpart)data(stagec)# Set the options to keep the naoptions(na.action='na.pass')# create a model matrix with all the NA values imputedstagecImputed <- nearestNeighborImpute(model.matrix(~.,stagec)[,-1])
## End(Not run)
plot.bootstrapValidation_Bin
Plot ROC curves of bootstrap results
Description
This function plots ROC curves and a Kaplan-Meier curve (when fitting a Cox proportional hazardsregression model) of a bootstrapped model.
Usage
## S3 method for class 'bootstrapValidation_Bin'plot(x,
xlab = "Years",ylab = "Survival",
strata.levels=c(0),main = "ROC",
cex=1.0,...)
Arguments
x A bootstrapValidation_Bin object
xlab The label of the x-axis
ylab The label of the y-axis
strata.levels stratification level for the Kaplan-Meier plots
main Main Plot title

74 plot.bootstrapValidation_Res
cex The text cex
... Additional parameters for the generic plot function
Author(s)
Jose G. Tamez-Pena and Antonio Martinez-Torteya
See Also
plot.bootstrapValidation_Res
plot.bootstrapValidation_Res
Plot ROC curves of bootstrap results
Description
This function plots ROC curves and a Kaplan-Meier curve (when fitting a Cox proportional hazardsregression model) of a bootstrapped model.
Usage
## S3 method for class 'bootstrapValidation_Res'plot(x,
xlab = "Years",ylab = "Survival",...)
Arguments
x A bootstrapValidation_Res object
xlab The label of the x-axis
ylab The label of the y-axis
... Additional parameters for the plot
Author(s)
Jose G. Tamez-Pena and Antonio Martinez-Torteya
See Also
plot.bootstrapValidation_Bin

plot.FRESA_benchmark 75
plot.FRESA_benchmark Plot the results of the model selection benchmark
Description
The different output metrics of the benchmark (BinaryBenchmark,RegresionBenchmark or Ordi-nalBenchmark) are plotted. It returns data matrices that describe the different plots.
Usage
## S3 method for class 'FRESA_benchmark'plot(x,...)
Arguments
x A FRESA_benchmark object
... Additional parameters for the generic plot function
Value
metrics The model test performance based on the predictionStats_binary, predictionStats_regressionor predictionStats_ordinal functions.
barPlotsCI The barPlotCiError outputs for each metric.
metrics_filter The model test performance for each filter method based on the predictionStats_binaryfunction.
barPlotsCI_filter
The barPlotCiError outputs for each metric on the filter methods
minMaxMetrics Reports the min and maximum value for each reported metric.
Author(s)
Jose G. Tamez-Pena
See Also
BinaryBenchmark, predictionStats_binary

76 plotModels.ROC
plotModels.ROC Plot test ROC curves of each cross-validation model
Description
This function plots test ROC curves of each model found in the cross validation process. It willalso aggregate the models into a single prediction performance, plotting the resulting ROC curve(models coherence). Furthermore, it will plot the mean sensitivity for a given set of specificities.
Usage
plotModels.ROC(modelPredictions,number.of.models=0,specificities=c(0.975,0.95,0.90,0.80,0.70,0.60,0.50,0.40,0.30,0.20,0.10,0.05),theCVfolds=1,predictor="Prediction",
cex=1.0,...)
Arguments
modelPredictions
A data frame returned by the crossValidationFeatureSelection_Bin func-tion, either the Models.testPrediction, the FullBSWiMS.testPrediction,the Models.CVtestPredictions, the TestRetrained.blindPredictions,the KNN.testPrediction, or the LASSO.testPredictions value
number.of.models
The maximum number of models to plot
specificities Vector containing the specificities at which the ROC sensitivities will be calcu-lated
theCVfolds The number of folds performed in a Cross-validation experiment
predictor The name of the column to be plotted
cex Controlling the font size of the text inside the plots
... Additional parameters for the roc function (pROC package)
Value
ROC.AUCs A vector with the AUC of each ROCmean.sensitivities
A vector with the mean sensitivity at the specificities given by specificities
model.sensitivities
A matrix where each row represents the sensitivity at the specificity given byspecificities for a different ROC
specificities The specificities used to calculate the sensitivities
senAUC The AUC of the ROC curve that resulted from using mean.sensitivities
predict.fitFRESA 77
predictionTable
The confusion matrix between the outcome and the ensemble prediction
ensemblePrediction
The ensemble (median prediction) of the repeated predictions
Author(s)
Jose G. Tamez-Pena and Antonio Martinez-Torteya
predict.fitFRESA Linear or probabilistic prediction
Description
This function returns the predicted outcome of a specific model. The model is used to generatelinear predictions. The probabilistic values are generated using the logistic transformation on thelinear predictors.
Usage
## S3 method for class 'fitFRESA'predict(object,
...)
Arguments
object An object of class fitFRESA containing the model to be analyzed
... A list with: testdata=testdata;predictType=c("linear","prob") and impute=FALSE.If impute is set to TRUE it will use the object model to impute missing data
Value
A vector with the predicted values
Author(s)
Jose G. Tamez-Pena and Antonio Martinez-Torteya
See Also
nearestNeighborImpute

78 predict.FRESAsignature
predict.FRESAKNN Predicts class::knn models
Description
This function predicts the outcome from a FRESAKNN model
Usage
## S3 method for class 'FRESAKNN'predict(object,...)
Arguments
object An object of class FRESAKNN containing the KNN train set
... A list with: testdata=testdata
Value
A vector of the predicted values
Author(s)
Jose G. Tamez-Pena
See Also
KNN_method, class::knn
predict.FRESAsignature
Predicts CVsignature models
Description
This function predicts the outcome from a FRESAsignature model
Usage
## S3 method for class 'FRESAsignature'predict(object,...)
Arguments
object An object of class FRESAsignature
... A list with: testdata=testdata

predict.FRESA_LASSO 79
Value
A vector of the predicted values
Author(s)
Jose G. Tamez-Pena
See Also
CVsignature,getSignature,signatureDistance
predict.FRESA_LASSO Predicts LASSO fitted objects
Description
This function predicts the outcome from a FRESA_LASSO fitted object
Usage
## S3 method for class 'FRESA_LASSO'predict(object,...)
Arguments
object An object of class FRESA_LASSO containing the model to be analyzed
... A list with: testdata=testdata
Value
A vector of the predicted values
Author(s)
Jose G. Tamez-Pena
See Also
LASSO

80 predict.FRESA_RIDGE
predict.FRESA_NAIVEBAYES
Predicts NAIVE_BAYES models
Description
This function predicts the outcome from a FRESA_NAIVEBAYES model
Usage
## S3 method for class 'FRESA_NAIVEBAYES'predict(object,...)
Arguments
object An object of class FRESA_NAIVEBAYES
... A list with: testdata=testdata
Value
A vector of the predicted values
Author(s)
Jose G. Tamez-Pena
See Also
NAIVE_BAYES
predict.FRESA_RIDGE Predicts LM_RIDGE_MIN models
Description
This function predicts the outcome from a LM_RIDGE_MIN model
Usage
## S3 method for class 'FRESA_RIDGE'predict(object,...)
Arguments
object An object of class FRESA_RIDGE
... A list with: testdata=testdata

predictionStats 81
Value
A vector of the predicted values
Author(s)
Jose G. Tamez-Pena
See Also
LM_RIDGE_MIN
predictionStats Prediction Evaluation
Description
This function returns the statistical metrics describing the association between model predictionsand the ground truth outcome
Usage
predictionStats_binary(predictions, plotname="", center=FALSE,...)predictionStats_regression(predictions, plotname="",...)predictionStats_ordinal(predictions,plotname="",...)
Arguments
predictions A matrix whose first column is the ground truth, and the second is the modelprediction
plotname The main title to be used by the plot function. If empty, no plot will be provided
center For binary predictions indicates if the prediction is around zero
... Extra parameters to be passed to the plot function.
Details
These functions will analyze the prediction outputs and will compare to the ground truth. The outputwill depend on the prediction task: Binary classification, Linear Regression or Ordinal regression.

82 randomCV
Value
accc The classification accuracy with its95% confidence intervals (95/
berror The balanced error rate with its 95%CI
aucs The ROC area under the curve (ROC AUC) of the binary classifier with its95%CI
specificity The specificity with its 95%CI
sensitivity The sensitivity with its 95%CI
ROC.analysis The output of the ROC function
CM.analysis The output of the epiR::epi.tests function
corci the Pearson correlation with its 95%CI
biasci the regression bias and its 95%CI
RMSEci the root mean square error (RMSE) and its 95%CI
spearmanci the Spearman correlation and its 95%CI
MAEci the mean absolute difference(MAE) and its 95%CI
pearson the output of the cor.test function
Kendall the Kendall correlation and its 95%CI
Bias the ordinal regression bias and its 95%CI
BMAE the balanced mean absolute difference for ordinal regression
class95ci the output of the bootstrapped estimation of accuracy, sensitivity, and ROC AUC
KendallTauB the output of the DescTools::KendallTauB function
Kappa.analysis the output of the irr::kappa2 function
Author(s)
Jose G. Tamez-Pena
See Also
randomCV
randomCV Cross Validation of Prediction Models
Description
The data set will be divided into a random train set and a test sets. The train set will be modeled bythe user provided fitting method. Each fitting method must have a prediction function that will beused to predict the outcome of the test set.

randomCV 83
Usage
randomCV(theData = NULL,theOutcome = "Class",fittingFunction=NULL,trainFraction = 0.5,repetitions = 100,trainSampleSets=NULL,featureSelectionFunction=NULL,featureSelection.control=NULL,asFactor=FALSE,addNoise=FALSE,...)
Arguments
theData The data-frame for cross-validation
theOutcome The name of the outcomefittingFunction
The fitting function used to model the data
trainFraction The percentage of the data to be used for training
repetitions The number of times that the CV process will be repeatedtrainSampleSets
A set of train samplesfeatureSelectionFunction
The feature selection function to be used to filter out irrelevant featuresfeatureSelection.control
The parameters to control the feature selection function
asFactor Set theOutcome as factor
addNoise if TRUE will add 0.1
... Parameters to be passed to the fitting function
ValuetestPredictions
All the predicted outcomes. Is a data matrix with three columns c("Outcome","Model","Prediction").Each row has a prediction for a given test subject
trainPredictions
All the predicted outcomes in the train data set. Is a data matrix with threecolumns c("Outcome","Model","Prediction"). Each row has a prediction for agiven test subject
medianTest The median of the test prediction for each subject
medianTrain The median of the prediction for each train subject
boxstaTest The statistics of the boxplot for test data
boxstaTrain The statistics of the boxplot for train data

84 randomCV
trainSamplesSets
The id of the subjects used for trainingselectedFeaturesSet
A list with all the features used at each training cyclefeatureFrequency
A order table object that describes how many times a feature was selected.
jaccard The jaccard index of the features as well as the average number of features usedfor prediction
theTimes The CPU time analysis
Author(s)
Jose G. Tamez-Pena
Examples
## Not run:
### Cross Validation Example ##### Start the graphics device driver to save all plots in a pdf formatpdf(file = "CrossValidationExample.pdf",width = 8, height = 6)
# Get the stage C prostate cancer data from the rpart packagedata(stagec,package = "rpart")
# Prepare the data. Create a model matrix with interactions but no event timestagec$pgtime <- NULLstagec$eet <- as.factor(stagec$eet)options(na.action = 'na.pass')stagec_mat <- cbind(pgstat = stagec$pgstat,
as.data.frame(model.matrix(pgstat ~ .*.,stagec))[-1])fnames <- colnames(stagec_mat)fnames <- str_replace_all(fnames,":","__")colnames(stagec_mat) <- fnames
# Impute the missing datadataCancerImputed <- nearestNeighborImpute(stagec_mat)
dataCancerImputed[,1:ncol(dataCancerImputed)] <- sapply(dataCancerImputed,as.numeric)
# Cross validating a Random Forest classifiercvRF <- randomCV(dataCancerImputed,"pgstat",
randomForest::randomForest,trainFraction = 0.8,repetitions = 10,asFactor = TRUE);
# Evaluate the prediction performance of the Random Forest classifierRFStats <- predictionStats_binary(cvRF$medianTest,plotname = "Random Forest",cex = 0.9);
# Cross validating a BSWiMS with the same train/test set

rankInverseNormalDataFrame 85
cvBSWiMS <- randomCV(fittingFunction = BSWiMS.model,trainSampleSets = cvRF$trainSamplesSets);
# Evaluate the prediction performance of the BSWiMS classifierBSWiMSStats <- predictionStats_binary(cvBSWiMS$medianTest,plotname = "BSWiMS",cex = 0.9);
# Cross validating a LDA classifier with a t-student filtercvLDA <- randomCV(dataCancerImputed,"pgstat",MASS::lda,
trainSampleSets = cvRF$trainSamplesSets,featureSelectionFunction = univariate_tstudent,featureSelection.control = list(limit = 0.5,thr = 0.975));
# Evaluate the prediction performance of the LDA classifierLDAStats <- predictionStats_binary(cvLDA$medianTest,plotname = "LDA",cex = 0.9);
# Cross validating a QDA classifier with LDA t-student features and RF train/test setcvQDA <- randomCV(fittingFunction = MASS::qda,
trainSampleSets = cvRF$trainSamplesSets,featureSelectionFunction = cvLDA$selectedFeaturesSet);
# Evaluate the prediction performance of the QDA classifierQDAStats <- predictionStats_binary(cvQDA$medianTest,plotname = "QDA",cex = 0.9);
#Create a barplot with 95errorciTable <- rbind(RFStats$berror,BSWiMSStats$berror,LDAStats$berror,QDAStats$berror)
bpCI <- barPlotCiError(as.matrix(errorciTable),metricname = "Balanced Error",thesets = c("Classifier Method"),themethod = c("RF","BSWiMS","LDA","QDA"),main = "Balanced Error",offsets = c(0.5,0.15),scoreDirection = "<",ho = 0.5,args.legend = list(bg = "white",x = "topright"),col = terrain.colors(4));
dev.off()
## End(Not run)
rankInverseNormalDataFrame
rank-based inverse normal transformation of the data

86 rankInverseNormalDataFrame
Description
This function takes a data frame and a reference control population to return a z-transformed dataset conditioned to the reference population. Each sample data for each feature column in the dataframe is conditionally z-transformed using a rank-based inverse normal transformation, based onthe rank of the sample in the reference frame.
Usage
rankInverseNormalDataFrame(variableList,data,referenceframe,strata=NA)
Arguments
variableList A data frame with two columns. The first one must have the names of the can-didate variables and the other one the description of such variables
data A data frame where all variables are stored in different columns
referenceframe A data frame similar to data, but with only the control population
strata The name of the column in data that stores the variable that will be used tostratify the model
Value
A data frame where each observation has been conditionally z-transformed, given control data
Author(s)
Jose G. Tamez-Pena and Antonio Martinez-Torteya
Examples
## Not run:# Start the graphics device driver to save all plots in a pdf formatpdf(file = "Example.pdf")# Get the stage C prostate cancer data from the rpart packagelibrary(rpart)data(stagec)# Split the stages into several columnsdataCancer <- cbind(stagec[,c(1:3,5:6)],
gleason4 = 1*(stagec[,7] == 4),gleason5 = 1*(stagec[,7] == 5),gleason6 = 1*(stagec[,7] == 6),gleason7 = 1*(stagec[,7] == 7),gleason8 = 1*(stagec[,7] == 8),gleason910 = 1*(stagec[,7] >= 9),eet = 1*(stagec[,4] == 2),diploid = 1*(stagec[,8] == "diploid"),tetraploid = 1*(stagec[,8] == "tetraploid"),notAneuploid = 1-1*(stagec[,8] == "aneuploid"))
reportEquivalentVariables 87
# Remove the incomplete casesdataCancer <- dataCancer[complete.cases(dataCancer),]# Load a pre-established data frame with the names and descriptions of all variablesdata(cancerVarNames)# Set the group of no progressionnoProgress <- subset(dataCancer,pgstat==0)# z-transform g2 values using the no-progression group as referencedataCancerZTransform <- rankInverseNormalDataFrame(variableList = cancerVarNames[2,],
data = dataCancer,referenceframe = noProgress)
# Shut down the graphics device driverdev.off()## End(Not run)
reportEquivalentVariables
Report the set of variables that will perform an equivalent IDI dis-criminant function
Description
Given a model, this function will report a data frame with all the variables that may be interchangedin the model without affecting its classification performance. For each variable in the model, thisfunction will loop all candidate variables and report all of which result in an equivalent or betterzIDI than the original model.
Usage
reportEquivalentVariables(object,pvalue = 0.05,data,variableList,Outcome = "Class",timeOutcome=NULL,type = c("LOGIT", "LM", "COX"),description = ".",method="BH",osize=0,fitFRESA=TRUE)
Arguments
object An object of class lm, glm, or coxph containing the model to be analyzed
pvalue The maximum p-value, associated to the IDI , allowed for a pair of variables tobe considered equivalent
data A data frame where all variables are stored in different columns
variableList A data frame with two columns. The first one must have the names of the can-didate variables and the other one the description of such variables

88 residualForFRESA
Outcome The name of the column in data that stores the variable to be predicted by themodel
timeOutcome The name of the column in data that stores the time to event
type Fit type: Logistic ("LOGIT"), linear ("LM"), or Cox proportional hazards ("COX")
description The name of the column in variableList that stores the variable description
method The method used by the p-value adjustment algorithm
osize The number of features used for p-value adjustment
fitFRESA if TRUE it will use the cpp based fitting method
Value
pvalueList A list with all the unadjusted p-values of the equivalent features per model vari-able
equivalentMatrix
A data frame with three columns. The first column is the original variable ofthe model. The second column lists all variables that, if interchanged, will notstatistically affect the performance of the model. The third column lists thecorresponding z-scores of the IDI for each equivalent variable.
formulaList a character vector with all the equivalent formulasequivalentModel
a bagged model that used all the equivalent formulas. The model size is limitedby the number of observations
Author(s)
Jose G. Tamez-Pena
residualForFRESA Return residuals from prediction
Description
Given a model and a new data set, this function will return the residuals of the predicted values.When dealing with a Cox proportional hazards regression model, the function will return the Mar-tingale residuals.
Usage
residualForFRESA(object,testData,Outcome,eta = 0.05)

signatureDistance 89
Arguments
object An object of class lm, glm, or coxph containing the model to be analyzed
testData A data frame where all variables are stored in different columns, with the dataset to be predicted
Outcome The name of the column in data that stores the variable to be predicted by themodel
eta The weight of the contribution of the Martingale residuals, or 1 - the weight ofthe contribution of the classification residuals (only needed if object is of classcoxph)
Value
A vector with the residuals (i.e. the differences between the predicted and the real outcome)
Author(s)
Jose G. Tamez-Pena and Antonio Martinez-Torteya
signatureDistance Distance to the signature template
Description
This function returns a normalized distance to the signature template
Usage
signatureDistance(template,data=NULL,method = c("pearson","spearman","kendall","RSS","MAN")
)
Arguments
template A list with a template matrix of the signature described with quantiles = [0.025,0.25,0.5,0.75,0.975]
data A data frame that will be used to compute the distance
method The distance method.
Details
The distance to the template: "pearson","spearman" and "kendall" distances are computed using thecorrelation function i.e. 1-r. "RSS" distance is the root sum square distance "MAN" Manhattan.The standardized L^1 distance

90 summary.bootstrapValidation_Bin
Value
result the distance to the template
Author(s)
Jose G. Tamez-Pena
summary.bootstrapValidation_Bin
Generate a report of the results obtained using the bootstrapValida-tion_Bin function
Description
This function prints two tables describing the results of the bootstrap-based validation of binaryclassification models. The first table reports the accuracy, sensitivity, specificity and area under theROC curve (AUC) of the train and test data set, along with their confidence intervals. The secondtable reports the model coefficients and their corresponding integrated discrimination improvement(IDI) and net reclassification improvement (NRI) values.
Usage
## S3 method for class 'bootstrapValidation_Bin'summary(object,
...)
Arguments
object An object of class bootstrapValidation_Bin
... Additional parameters for the generic summary function
Value
performance A vector describing the results of the bootstrapping procedure
summary An object of class summary.lm, summary.glm, or summary.coxph containing asummary of the analyzed model
coef A matrix with the coefficients, IDI, NRI, and the 95% confidence intervals ob-tained via bootstrapping
performance.table
A matrix with the tabulated results of the blind test accuracy, sensitivity, speci-ficities, and area under the ROC curve
Author(s)
Jose G. Tamez-Pena and Antonio Martinez-Torteya

summary.fitFRESA 91
See Also
summaryReport
summary.fitFRESA Returns the summary of the fit
Description
Returns a summary of fitted model created by the modelFitting function with the fitFRESA param-eter set to TRUE
Usage
## S3 method for class 'fitFRESA'summary(object,type=c("Improvement","Residual"),ci=c(0.025,0.975),data=NULL,...)
Arguments
object fitted model with the modelFitting function
type the type of coefficient estimation
ci lower and upper limit of the ci estimation
data the data to be used for 95
... parameters of the boostrap method
Value
a list with the analysis results.
Author(s)
Jose G. Tamez-Pena
See Also
modelFitting,bootstrapValidation_Bin,bootstrapValidation_Res

92 summaryReport
summaryReport Report the univariate analysis, the cross-validation analysis and thecorrelation analysis
Description
This function takes the variables of the cross-validation analysis and extracts the results from theunivariate and correlation analyses. Then, it prints the cross-validation results, the univariate anal-ysis results, and the correlated variables. As output, it returns a list of each one of these results.
Usage
summaryReport(univariateObject,summaryBootstrap,listOfCorrelatedVariables = NULL,digits = 2)
Arguments
univariateObject
A data frame that contains the results of the univariateRankVariables func-tion
summaryBootstrap
A list that contains the results of the summary.bootstrapValidation_Bin func-tion
listOfCorrelatedVariables
A matrix that contains the correlated.variables value from the results ob-tained with the listTopCorrelatedVariables function
digits The number of significant digits to be used in the print function
Valueperformance.table
A matrix with the tabulated results of the blind test accuracy, sensitivity, speci-ficities, and area under the ROC curve
coefStats A data frame that lists all the model features along with its univariate statisticsand bootstrapped coefficients
cor.varibles A matrix that lists all the features that are correlated to the model variables
Author(s)
Jose G. Tamez-Pena and Antonio Martinez-Torteya
See Also
summary.bootstrapValidation_Bin
timeSerieAnalysis 93
timeSerieAnalysis Fit the listed time series variables to a given model
Description
This function plots the time evolution and does a longitudinal analysis of time dependent features.Features listed are fitted to the provided time model (mixed effect model) with a generalized leastsquares (GLS) procedure. As output, it returns the coefficients, standard errors, t-values, and corre-sponding p-values.
Usage
timeSerieAnalysis(variableList,baseModel,data,timevar = "time",contime = ".",Outcome = ".",...,description = ".",Ptoshow = c(1),plegend = c("p"),timesign = "-",catgo.names = c("Control", "Case"))
Arguments
variableList A data frame with two columns. The first one must have the names of the can-didate variables and the other one the description of such variables
baseModel A string of the type "1 + var1 + var2" that defines the model to which variableswill be fitted
data A data frame where all variables are stored in different columns
timevar The name of the column in data that stores the visit ID
contime The name of the column in data that stores the continuous time (e.g. days ormonths) that has elapsed since the baseline visit
Outcome The name of the column in data that stores an optional binary outcome that maybe used to show the stratified analysis
description The name of the column in variableList that stores the variable description
Ptoshow Index of the p-values to be shown in the plot
plegend Legend of the p-values to be shown in the plot
timesign The direction of the arrow of time
catgo.names The legends of the binary categories
... Additional parameters to be passed to the gls function

94 uniRankVar
Details
This function will plot the evolution of the mean value of the listed variables with its correspondingerror bars. Then, it will fit the data to the provided time model with a GLS procedure and it will plotthe fitted values. If a binary variable was provided, the plots will contain the case and control data.As output, the function will return the model coefficients and their corresponding t-values, and thestandard errors and their associated p-values.
Value
coef A matrix with the coefficients of the GLS fitting
std.Errors A matrix with the standardized error of each coefficient
t.values A matrix with the t-value of each coefficient
p.values A matrix with the p-value of each coefficient
sigmas The root-mean-square error of the fitting
Author(s)
Jose G. Tamez-Pena and Antonio Martinez-Torteya
uniRankVar Univariate analysis of features (additional values returned)
Description
This function reports the mean and standard deviation for each feature in a model, and ranks themaccording to a user-specified score. Additionally, it does a Kolmogorov-Smirnov (KS) test on theraw and z-standardized data. It also reports the raw and z-standardized t-test score, the p-value ofthe Wilcoxon rank-sum test, the integrated discrimination improvement (IDI), the net reclassifica-tion improvement (NRI), the net residual improvement (NeRI), and the area under the ROC curve(AUC). Furthermore, it reports the z-value of the variable significance on the fitted model. Besidesreporting an ordered data frame, this function returns all arguments as values, so that the results canbe updates with the update.uniRankVar if needed.
Usage
uniRankVar(variableList,formula,Outcome,data,categorizationType = c("Raw",
"Categorical","ZCategorical","RawZCategorical","RawTail","RawZTail","Tail",

uniRankVar 95
"RawRaw"),type = c("LOGIT", "LM", "COX"),rankingTest = c("zIDI",
"zNRI","IDI","NRI","NeRI","Ztest","AUC","CStat","Kendall"),
cateGroups = c(0.1, 0.9),raw.dataFrame = NULL,description = ".",uniType = c("Binary", "Regression"),FullAnalysis=TRUE,acovariates = NULL,timeOutcome = NULL)
Arguments
variableList A data frame with two columns. The first one must have the names of the can-didate variables and the other one the description of such variables
formula An object of class formula with the formula to be fitted
Outcome The name of the column in data that stores an optional binary outcome that maybe used to show the stratified analysis
data A data frame where all variables are stored in different columnscategorizationType
How variables will be analyzed : As given in data ("Raw"); broken into thep-value categories given by cateGroups ("Categorical"); broken into the p-value categories given by cateGroups, and weighted by the z-score ("ZCate-gorical"); broken into the p-value categories given by cateGroups, weighted bythe z-score, plus the raw values ("RawZCategorical"); raw values, plus the tails("RawTail"); or raw values, weighted by the z-score, plus the tails ("RawZTail")
type Fit type: Logistic ("LOGIT"), linear ("LM"), or Cox proportional hazards ("COX")
rankingTest Variables will be ranked based on: The z-score of the IDI ("zIDI"), the z-score ofthe NRI ("zNRI"), the IDI ("IDI"), the NRI ("NRI"), the NeRI ("NeRI"), the z-score of the model fit ("Ztest"), the AUC ("AUC"), the Somers’ rank correlation("Cstat"), or the Kendall rank correlation ("Kendall")
cateGroups A vector of percentiles to be used for the categorization procedure
raw.dataFrame A data frame similar to data, but with unadjusted data, used to get the meansand variances of the unadjusted data
description The name of the column in variableList that stores the variable description
uniType Type of univariate analysis: Binary classification ("Binary") or regression ("Re-gression")

96 uniRankVar
FullAnalysis If FALSE it will only order the features according to its z-statistics of the linearmodel
acovariates the list of covariates
timeOutcome the name of the Time to event feature
Details
This function will create valid dummy categorical variables if, and only if, data has been z-standardized. The p-values provided in cateGroups will be converted to its corresponding z-score,which will then be used to create the categories. If non z-standardized data were to be used, thecategorization analysis would return wrong results.
Value
orderframe A sorted list of model variables stored in a data frame
variableList The argument variableList
formula The argument formula
Outcome The argument Outcome
data The argument datacategorizationType
The argument categorizationType
type The argument type
rankingTest The argument rankingTest
cateGroups The argument cateGroups
raw.dataFrame The argument raw.dataFrame
description The argument description
uniType The argument uniType
Author(s)
Jose G. Tamez-Pena and Antonio Martinez-Torteya
References
Pencina, M. J., D’Agostino, R. B., & Vasan, R. S. (2008). Evaluating the added predictive ability ofa new marker: from area under the ROC curve to reclassification and beyond. Statistics in medicine27(2), 157-172.
See Also
update.uniRankVar, univariateRankVariables
univariateRankVariables 97
univariateRankVariables
Univariate analysis of features
Description
This function reports the mean and standard deviation for each feature in a model, and ranks themaccording to a user-specified score. Additionally, it does a Kolmogorov-Smirnov (KS) test on theraw and z-standardized data. It also reports the raw and z-standardized t-test score, the p-value ofthe Wilcoxon rank-sum test, the integrated discrimination improvement (IDI), the net reclassifica-tion improvement (NRI), the net residual improvement (NeRI), and the area under the ROC curve(AUC). Furthermore, it reports the z-value of the variable significance on the fitted model.
Usage
univariateRankVariables(variableList,formula,Outcome,data,categorizationType = c("Raw",
"Categorical","ZCategorical","RawZCategorical","RawTail","RawZTail","Tail","RawRaw"),
type = c("LOGIT", "LM", "COX"),rankingTest = c("zIDI",
"zNRI","IDI","NRI","NeRI","Ztest","AUC","CStat","Kendall"),
cateGroups = c(0.1, 0.9),raw.dataFrame = NULL,description = ".",uniType = c("Binary","Regression"),FullAnalysis=TRUE,acovariates = NULL,timeOutcome = NULL
)

98 univariateRankVariables
Arguments
variableList A data frame with the candidate variables to be ranked
formula An object of class formula with the formula to be fitted
Outcome The name of the column in data that stores the variable to be predicted by themodel
data A data frame where all variables are stored in different columnscategorizationType
How variables will be analyzed: As given in data ("Raw"); broken into thep-value categories given by cateGroups ("Categorical"); broken into the p-value categories given by cateGroups, and weighted by the z-score ("ZCate-gorical"); broken into the p-value categories given by cateGroups, weighted bythe z-score, plus the raw values ("RawZCategorical"); raw values, plus the tails("RawTail"); or raw values, weighted by the z-score, plus the tails ("RawZTail")
type Fit type: Logistic ("LOGIT"), linear ("LM"), or Cox proportional hazards ("COX")
rankingTest Variables will be ranked based on: The z-score of the IDI ("zIDI"), the z-score ofthe NRI ("zNRI"), the IDI ("IDI"), the NRI ("NRI"), the NeRI ("NeRI"), the z-score of the model fit ("Ztest"), the AUC ("AUC"), the Somers’ rank correlation("Cstat"), or the Kendall rank correlation ("Kendall")
cateGroups A vector of percentiles to be used for the categorization procedure
raw.dataFrame A data frame similar to data, but with unadjusted data, used to get the meansand variances of the unadjusted data
description The name of the column in variableList that stores the variable description
uniType Type of univariate analysis: Binary classification ("Binary") or regression ("Re-gression")
FullAnalysis If FALSE it will only order the features according to its z-statistics of the linearmodel
acovariates the list of covariates
timeOutcome the name of the Time to event feature
Details
This function will create valid dummy categorical variables if, and only if, data has been z-standardized. The p-values provided in cateGroups will be converted to its corresponding z-score,which will then be used to create the categories. If non z-standardized data were to be used, thecategorization analysis would return wrong results.
Value
A sorted data frame. In the case of a binary classification analysis, the data frame will have thefollowing columns:
Name Name of the raw variable or of the dummy variable if the data has been catego-rized
parent Name of the raw variable from which the dummy variable was created

univariateRankVariables 99
descrip Description of the parent variable, as defined in description
cohortMean Mean value of the variable
cohortStd Standard deviation of the variable
cohortKSD D statistic of the KS test when comparing a normal distribution and the distri-bution of the variable
cohortKSP Associated p-value to the cohortKSD
caseMean Mean value of cases (subjects with Outcome equal to 1)
caseStd Standard deviation of cases
caseKSD D statistic of the KS test when comparing a normal distribution and the distri-bution of the variable only for cases
caseKSP Associated p-value to the caseKSD
caseZKSD D statistic of the KS test when comparing a normal distribution and the distri-bution of the z-standardized variable only for cases
caseZKSP Associated p-value to the caseZKSD
controlMean Mean value of controls (subjects with Outcome equal to 0)
controlStd Standard deviation of controls
controlKSD D statistic of the KS test when comparing a normal distribution and the distri-bution of the variable only for controls
controlKSP Associated p-value to the controlsKSD
controlZKSD D statistic of the KS test when comparing a normal distribution and the distri-bution of the z-standardized variable only for controls
controlZKSP Associated p-value to the controlsZKSD
t.Rawvalue Normal inverse p-value (z-value) of the t-test performed on raw.dataFrame
t.Zvalue z-value of the t-test performed on data
wilcox.Zvalue z-value of the Wilcoxon rank-sum test performed on data
ZGLM z-value returned by the lm, glm, or coxph functions for the z-standardized vari-able
zNRI z-value returned by the improveProb function (Hmisc package) when evaluatingthe NRI
zIDI z-value returned by the improveProb function (Hmisc package) when evaluatingthe IDI
zNeRI z-value returned by the improvedResiduals function when evaluating the NeRI
ROCAUC Area under the ROC curve returned by the roc function (pROC package)
cStatCorr c index of Somers’ rank correlation returned by the rcorr.cens function (Hmiscpackage)
NRI NRI returned by the improveProb function (Hmisc package)
IDI IDI returned by the improveProb function (Hmisc package)
NeRI NeRI returned by the improvedResiduals function
kendall.r Kendall τ rank correlation coefficient between the variable and the binary out-come

100 univariateRankVariables
kendall.p Associated p-value to the kendall.r
TstudentRes.p p-value of the improvement in residuals, as evaluated by the paired t-test
WilcoxRes.p p-value of the improvement in residuals, as evaluated by the paired Wilcoxonrank-sum test
FRes.p p-value of the improvement in residual variance, as evaluated by the F-testcaseN_Z_Low_Tail
Number of cases in the low tailcaseN_Z_Hi_Tail
Number of cases in the top tailcontrolN_Z_Low_Tail
Number of controls in the low tailcontrolN_Z_Hi_Tail
Number of controls in the top tail
In the case of regression analysis, the data frame will have the following columns:
Name Name of the raw variable or of the dummy variable if the data has been catego-rized
parent Name of the raw variable from which the dummy variable was created
descrip Description of the parent variable, as defined in description
cohortMean Mean value of the variable
cohortStd Standard deviation of the variable
cohortKSD D statistic of the KS test when comparing a normal distribution and the distri-bution of the variable
cohortKSP Associated p-value to the cohortKSP
cohortZKSD D statistic of the KS test when comparing a normal distribution and the distri-bution of the z-standardized variable
cohortZKSP Associated p-value to the cohortZKSD
ZGLM z-value returned by the glm or Cox procedure for the z-standardized variable
zNRI z-value returned by the improveProb function (Hmisc package) when evaluatingthe NRI
NeRI NeRI returned by the improvedResiduals function
cStatCorr c index of Somers’ rank correlation returned by the rcorr.cens function (Hmiscpackage)
spearman.r Spearman ρ rank correlation coefficient between the variable and the outcome
pearson.r Pearson r product-moment correlation coefficient between the variable and theoutcome
kendall.r Kendall τ rank correlation coefficient between the variable and the outcome
kendall.p Associated p-value to the kendall.r
TstudentRes.p p-value of the improvement in residuals, as evaluated by the paired t-test
WilcoxRes.p p-value of the improvement in residuals, as evaluated by the paired Wilcoxonrank-sum test
FRes.p p-value of the improvement in residual variance, as evaluated by the F-test
update.uniRankVar 101
Author(s)
Jose G. Tamez-Pena
References
Pencina, M. J., D’Agostino, R. B., & Vasan, R. S. (2008). Evaluating the added predictive ability ofa new marker: from area under the ROC curve to reclassification and beyond. Statistics in medicine27(2), 157-172.
update.uniRankVar Update the univariate analysis using new data
Description
This function updates the results from an univariate analysis using a new data set
Usage
## S3 method for class 'uniRankVar'update(object,
...)
Arguments
object A list with the results from the uniRankVar function
... Additional parameters to be passed to the uniRankVar function, used to updatethe univariate analysis
Value
A list with the same format as the one yielded by the uniRankVar function
Author(s)
Jose G. Tamez-Pena
See Also
uniRankVar
102 updateModel.Bin
updateModel.Bin Update the IDI/NRI-based model using new data or new thresholdvalues
Description
This function will take the frequency-ranked set of variables and will generate a new model withterms that meet either the integrated discrimination improvement (IDI), or the net reclassificationimprovement (NRI), threshold criteria.
Usage
updateModel.Bin(Outcome,covariates = "1",pvalue = c(0.025, 0.05),VarFrequencyTable,variableList,data,type = c("LM", "LOGIT", "COX"),lastTopVariable = 0,timeOutcome = "Time",selectionType = c("zIDI","zNRI"),maxTrainModelSize = 0,zthrs = NULL)
Arguments
Outcome The name of the column in data that stores the variable to be predicted by themodel
covariates A string of the type "1 + var1 + var2" that defines which variables will alwaysbe included in the models (as covariates)
pvalue The maximum p-value, associated to either IDI or NRI, allowed for a term inthe model
VarFrequencyTable
An array with the ranked frequencies of the features, (e.g. the ranked.var valuereturned by the ForwardSelection.Model.Bin function)
variableList A data frame with two columns. The first one must have the names of the can-didate variables and the other one the description of such variables
data A data frame where all variables are stored in different columns
type Fit type: Logistic ("LOGIT"), linear ("LM"), or Cox proportional hazards ("COX")lastTopVariable
The maximum number of variables to be tested
timeOutcome The name of the column in data that stores the time to event (needed only for aCox proportional hazards regression model fitting)

updateModel.Res 103
selectionType The type of index to be evaluated by the improveProb function (Hmisc pack-age): z-score of IDI or of NRI
maxTrainModelSize
Maximum number of terms that can be included in the model
zthrs The z-thresholds estimated in forward selection
Value
final.model An object of class lm, glm, or coxph containing the final model
var.names A vector with the names of the features that were included in the final model
formula An object of class formula with the formula used to fit the final modelz.selectionType
A vector in which each term represents the z-score of the index defined inselectionType obtained with the Full model and the model without one term
Author(s)
Jose G. Tamez-Pena and Antonio Martinez-Torteya
See Also
updateModel.Res
updateModel.Res Update the NeRI-based model using new data or new threshold values
Description
This function will take the frequency-ranked set of variables and will generate a new model withterms that meet the net residual improvement (NeRI) threshold criteria.
Usage
updateModel.Res(Outcome,covariates = "1",pvalue = c(0.025, 0.05),VarFrequencyTable,variableList,data,type = c("LM", "LOGIT", "COX"),testType=c("Binomial", "Wilcox", "tStudent"),lastTopVariable = 0,timeOutcome = "Time",maxTrainModelSize = -1,p.thresholds = NULL)
104 updateModel.Res
Arguments
Outcome The name of the column in data that stores the variable to be predicted by themodel
covariates A string of the type "1 + var1 + var2" that defines which variables will alwaysbe included in the models (as covariates)
pvalue The maximum p-value, associated to the NeRI, allowed for a term in the modelVarFrequencyTable
An array with the ranked frequencies of the features, (e.g. the ranked.var valuereturned by the ForwardSelection.Model.Res function)
variableList A data frame with two columns. The first one must have the names of the can-didate variables and the other one the description of such variables
data A data frame where all variables are stored in different columns
type Fit type: Logistic ("LOGIT"), linear ("LM"), or Cox proportional hazards ("COX")
testType Type of non-parametric test to be evaluated by the improvedResiduals func-tion: Binomial test ("Binomial"), Wilcoxon rank-sum test ("Wilcox"), Student’st-test ("tStudent"), or F-test ("Ftest")
lastTopVariable
The maximum number of variables to be tested
timeOutcome The name of the column in data that stores the time to event (needed only for aCox proportional hazards regression model fitting)
maxTrainModelSize
Maximum number of terms that can be included in the model
p.thresholds The p.value thresholds estimated in forward selection
Value
final.model An object of class lm, glm, or coxph containing the final model
var.names A vector with the names of the features that were included in the final model
formula An object of class formula with the formula used to fit the final model
z.NeRI A vector in which each element represents the z-score of the NeRI, associatedto the testType, for each feature found in the final model
Author(s)
Jose G. Tamez-Pena and Antonio Martinez-Torteya
See Also
updateModel.Bin
Index
∗Topic BenchmarkingbarPlotCiError, 13benchmarking, 14
∗Topic Data_ConditioningfeatureAdjustment, 45nearestNeighborImpute, 72rankInverseNormalDataFrame, 85
∗Topic Data_InspectionheatMaps, 63listTopCorrelatedVariables, 68timeSerieAnalysis, 93uniRankVar, 94univariateRankVariables, 97update.uniRankVar, 101
∗Topic DatasetscancerVarNames, 31
∗Topic Feature_FilteringFilterUnivariate, 46mRMR.classic_FRESA, 71
∗Topic Feature_SelectiongetSignature, 58signatureDistance, 89
∗Topic Hypothesis_TestingEmpiricalSurvDiff, 42
∗Topic Model_CVFRESAScale, 56randomCV, 82
∗Topic Model_DiagnosisbootstrapValidation_Bin, 18bootstrapValidation_Res, 21
∗Topic Model_GenerationbackVarElimination_Bin, 8backVarElimination_Res, 10baggedModel, 11bootstrapVarElimination_Bin, 23bootstrapVarElimination_Res, 25BSWiMS.model, 26crossValidationFeatureSelection_Bin,
32
crossValidationFeatureSelection_Res,37
CVsignature, 41ForwardSelection.Model.Bin, 48ForwardSelection.Model.Res, 50FRESA.Model, 52KNN_method, 66LASSO, 67LM_RIDGE_MIN, 69NAIVE_BAYES, 71updateModel.Bin, 102updateModel.Res, 103
∗Topic Model_InspectionensemblePredict, 44getKNNpredictionFromFormula, 57getVar.Bin, 60getVar.Res, 61improvedResiduals, 65modelFitting, 70plot.bootstrapValidation_Bin, 73plot.bootstrapValidation_Res, 74plot.FRESA_benchmark, 75plotModels.ROC, 76predictionStats, 81reportEquivalentVariables, 87residualForFRESA, 88summary.bootstrapValidation_Bin,
90summary.fitFRESA, 91summaryReport, 92
∗Topic Model_Predictionpredict.fitFRESA, 77predict.FRESA_LASSO, 79predict.FRESA_NAIVEBAYES, 80predict.FRESA_RIDGE, 80predict.FRESAKNN, 78predict.FRESAsignature, 78
∗Topic packageFRESA.CAD-package, 3
105
106 INDEX
backVarElimination_Bin, 8, 11, 24backVarElimination_Res, 9, 10, 24, 26baggedModel, 11barPlotCiError, 13benchmarking, 14BinaryBenchmark, 75BinaryBenchmark (benchmarking), 14bootstrapValidation_Bin, 18, 23, 91bootstrapValidation_Res, 20, 21, 26, 91bootstrapVarElimination_Bin, 9, 11, 23,
26bootstrapVarElimination_Res, 9, 11, 24,
25, 41BSWiMS.model, 26
cancerVarNames, 31correlated_Remove (FilterUnivariate), 46crossValidationFeatureSelection_Bin,
32, 41crossValidationFeatureSelection_Res,
36, 37CVsignature, 41, 78, 79
EmpiricalSurvDiff, 42ensemblePredict, 12, 44
featureAdjustment, 45FilterUnivariate, 46ForwardSelection.Model.Bin, 36, 48, 52ForwardSelection.Model.Res, 36, 50, 50FRESA.CAD (FRESA.CAD-package), 3FRESA.CAD-package, 3FRESA.Model, 52FRESAScale, 56, 67
getKNNpredictionFromFormula, 57getSignature, 41, 58, 79getVar.Bin, 60, 63getVar.Res, 61, 61
heatMaps, 63
improvedResiduals, 41, 65
knn, 58KNN_method, 66, 78
LASSO, 67, 79LASSO_1SE (LASSO), 67LASSO_MIN (LASSO), 67
listTopCorrelatedVariables, 68LM_RIDGE_MIN, 69, 80, 81
modelFitting, 70, 91mRMR.classic_FRESA, 71
NAIVE_BAYES, 71, 80nearestNeighborImpute, 72, 77
OrdinalBenchmark (benchmarking), 14
plot (plot.bootstrapValidation_Bin), 73plot.bootstrapValidation_Bin, 20, 73, 74plot.bootstrapValidation_Res, 23, 74, 74plot.FRESA_benchmark, 75plotModels.ROC, 76predict (predict.fitFRESA), 77predict.fitFRESA, 58, 77predict.FRESA_LASSO, 79predict.FRESA_NAIVEBAYES, 80predict.FRESA_RIDGE, 80predict.FRESAKNN, 78predict.FRESAsignature, 78predictionStats, 81predictionStats_binary, 75predictionStats_binary
(predictionStats), 81predictionStats_ordinal
(predictionStats), 81predictionStats_regression
(predictionStats), 81
randomCV, 14, 16, 82, 82rankInverseNormalDataFrame, 57, 85RegresionBenchmark (benchmarking), 14reportEquivalentVariables, 87residualForFRESA, 88
signatureDistance, 41, 79, 89summary (summary.fitFRESA), 91summary.bootstrapValidation_Bin, 20, 90,
92summary.fitFRESA, 91summaryReport, 91, 92
timeSerieAnalysis, 93
uniRankVar, 94, 101univariate_correlation
(FilterUnivariate), 46

INDEX 107
univariate_Logit (FilterUnivariate), 46univariate_residual (FilterUnivariate),
46univariate_tstudent (FilterUnivariate),
46univariate_Wilcoxon (FilterUnivariate),
46univariateRankVariables, 96, 97update (update.uniRankVar), 101update.uniRankVar, 96, 101updateModel.Bin, 102, 104updateModel.Res, 103, 103