Embed Size (px)
Citation preview

Package ‘MIA’
Version 1.0Date 2016-01-14Title Matrix Integration AnalysisAuthor Jinyu Chen<[email protected]>, Shihua Zhang<[email protected]>Depends MATLAB ( ≥ R2013a)Description Detecting multi-dimensitional modules (md-modules) in diverse genomics data as
well as molecular network data using the methods in MIA package.URL http://page.amss.ac.cn/shihua.zhang/software.html
1

Here, we provide a guide for MIA package. It describes all theMATLAB functions in MIA indetail. For each method, these MATLAB functions mainly perform the tasks including realizinga specific algorithm, drawing figures and outputting text files about the identified md-modules.
2

1 jNMF
jNMF (joint Non-negativeMatrix Factorization) enables users to simultaneously factor two ormore types of genomic data sharing the same set of samples. Here, we adopt multiplicativeupdate algorithm to solve the following problem:
minW,Hi
N∑
i=1
‖Xi −WHi‖2F , s.t.W ≥ 0,Hi ≥ 0, i = 1, ..., N.
1.1 Algorithm
Run jNMF The main function for jNMF.
Description
This is the main function for jNMF, which integrates all the related functions to achieve it.
Usage
Run jNMF(Input);
Arguments
Input A structure variable. The details about its construction canbe found in Section 5.
Output
It saves all the results in the directory ‘./MIA/jNMF/jNMF Results/’.jNMF Results.mat The essential computed variables.jNMF RunRecords.txt The updated values of the objective function in each round
of running.jNMF Results.txt The numbers and indexes of features separated in comma.
Each row records the information for each identified md-module.Several folders Each folder contains the lists of all the identified md-modules
for one type of features as shown in Figure 2a and Figure 3a.Several figures As shown in Figure 2b and Figure 4.
jNMF PrepData Preprocess the input data.
Description
This function is used to preprocess the input data to ensure its non-negativity.
Usage
[X, isdouble] = jNMF PrepData(OX);
Arguments
OX A matrix.
Output
X A non-negative matrix, the transformation of dataOX.isdouble A binary variable (1 indicates changes have been made; 0 is for no
change, that is,X= OX).
jNMF comodule Obtain the md-modules.
3

Description
This function outputs the optimal factorization results through running jNMF for multipletimes, then identify md-modules based on the factorized matricesW , Hi (i = 1, 2, ...).
Usage
[W, H, Comodule, params] = jNMFcomodule(Input, params);
Arguments
Input A structure variable including two components:Input.data A non-negative matrix combingN data blocks sequentially to be
factorized, such asInput.data= [X1,X2, ...,XN ].Input.XBlockInd A matrix of sizeN × 2. The two elements of theith row give the
start and end column indexes inInput.datafor data matrixXi
(i = 1, ..., N).params A structure variable including six components:
params.isdouble A vector of sizeN × 1. Theith element indicates whether theithdata matrix is transformed to ensure its non-negativity (0 for nochange, and 1 for change).
params.K The number of md-modules users prefer to identify.params.nloop The repeating times of jNMF. To ensure the robust of this method,
this function repeats the algorithm for ‘params.nloop’ times.params.maxiter The maximal number of iterations for this algorithm.params.tol The precision for convergence of algorithm.params.thrdmodule A positive vector of size1×(N+1). Thresholds for selecting features
in N data blocks. The first one is to select samples.
Output
W, H Factorization results such thatInput.data≈ WH. W is the basis matrixof sizem×K andH is the weight matrix of sizeK × n, whereK = params.K.
Comodule Identified md-modules recorded in a(K×(N+1)) cell array.Comodule{i,j}records selected feature indexes of thejth type of variables in theithidentified md-module. The first column is for selected samples.
params Compared to‘params’ as input, there are something new added in it,including
params.records A (nloop×1) cell array.params.records{i} is a (iter× (N + 1))vector, where each row records the values of all the terms in theobjective function and the sum of them in each iteration.
params.iterNumList A (nloop×1) vector, where each element is the number of iterationsfor each round of running.
jNMF algorithm jNMF algorithm.
Description
This is jNMF algorithm.
Usage
[W, H, TerminalObj, iter] = jNMFalgorithm(X, XInd, params);
Arguments
X A non-negative input matrix of sizem× n combingN data matricessequentially to be factorized (e.g.,X = [X1,X2, ...,XN ]).
XInd A matrix of sizeN ×2. The two elements of theith row give the start
4

and end column indexes inX for data matrixXi (i = 1, ..., N).params A structure variable includingparams.K, params.maxiter, params.tol
defined the same as that in the function ‘jNMF comodule’.
Output
W, H Factorization results like those in function ‘jNMF comodule’.iter The number of iterations when the algorithm stops.TerminalObj A (iter × (N + 1)) matrix in which each row records the values of
all the terms in the objective function and the sum of them in eachiteration.
jNMF module Identify md-modules from factorized matrices.
Description
Based on the factorized matrixW orHi, identify module members for each type of features.
Usage
module = jNMFmodule(H, t, isdouble);
Arguments
H A (K ×m) non-negative matrix used for module identification.t A threshold value for selecting features.isdouble A binary variable (1 is for the number of features inmatrixH is double
than that of the original ones, and 0 is for no change).
Output
module A (K × 1) cell array. modulei,1 contains the feature indexes of theith module.
1.2 Output figures
jNMF plot X Provide the heatmaps of the original input matrices.
Description
Draw the heatmaps of the original input matrices (X1,X2, ...,XN ).
Usage
jNMF plot X(X, XInd, fig, figure title, colormaptype);
Arguments
X The input matrix combingN data matrices to be factorized (e.g.,X = [X1,X2, ...,XN ]).
XInd A matrix of sizeN ×2. The two elements of theith row give the startand end column indexes inX for data matrixXi (i = 1, ..., N).
fig A positive integer for figure index.figure title A string for the title of figure.colormaptype A string for the colormap of heatmaps. Options includes‘blue-yellow’,
‘green-red’, ‘yellow’, ‘blue-white-red’, ‘default’.
Output
The heatmaps for all the input data matrices as shown in Figure 4.
jNMF plot results Show the heatmaps of certain identified md-modules.
5

Description
Show the heatmaps of a selected identified md-module (circled in yellow lines).
Usage
jNMF plot results(X, XInd, FeatureType, fig, figuretitle, colormaptype, vectorForRank);
Arguments
X, XInd, fig, figuretitle, colormaptypeThey have the same definitions with those in functionjNMF plot X.
FeatureType A (1×N ) cell array.FeatureType{i} records the name ofith type offeatures (e.g.,FeatureType ={‘Gene expression’,‘microRNA expression’,‘CNV’}).
vectorForRank A structure variable containing four components:vectorForRank.w, vectorForRank.h
Two vectors for the selected md-module. For example, if one wants todemonstrate theith md-module,vectorForRank.wis theith column ofbasis matrixW andvectorForRank.his theith row of weight matrixH.
vectorForRank.comoduleA (1×(N + 1)) cell array.vectorForRank.comodule{i} records theith feature indexes of the selected md-module.
vectorForRank.hInd Similar with the input variable‘XInd’ to ‘X’ , it records the indexesfor ‘vectorForRank.h’.
Output
The heatmaps for a selected md-module to demonstrate its patterns as shown in Figure 4.
jNMF plot correlation Demonstrate the correlations between the original dataand reconstructed data.
Description
Demonstrate the correlations between the original dataXi and reconstructed datanewXi =WHi using boxplots.
Usage
corrMat = jNMF plot correlation(X, newX, XInd, newXInd, fig, figuretitle);
Arguments
X, XInd, fig, figuretitleThey have the same definitions with those in function ‘jNMF plot X’.
newX The reconstructed matrix combingN data matrices sequentially,that is,newX= [WH1,WH2, ...,WHN ].
newXInd Similar with the input variable‘XInd’ to ‘X’ , it records the indexesfor matrix newX.
Output
corrMat A matrix of sizem×N , wherem is the number of samples andN isthe input data matrices, respectively.corrMat(i,j) records the correlationbetween theith rows of the original data (Xj) and reconstructed data(WHj).
Boxplots for input data matricesX1,X2, ...,XN as shown in Figure 4.
jNMF plot distribution Demonstrate the module size distributions.
6
Description
This function provides the histograms for the size distributions of (N + 1) types of featuresin the identified md-modules.
Usage
jNMF plot distribution(nSample, XInd, Comodule, FeatureType, fig, figure title);
Arguments
XInd, FeatureType, fig, figuretitleThey are the same as those in function ‘jNMF plot results’.
nSample The number of samples.Comodule It is the same as that in function ‘jNMF comodule’.
Output
Histograms for the size distributions of (N+1) types of features in the identified md-modulesas shown in Figure 4.
1.3 Output into text files
Index2LabelForModuleContent Output the identified md-modules into text files.
Description
Output a number of text files, each of which records the selected feature names.
Usage
Index2LabelForModuleContent(ModuleIndex, FeatureLabel, TypeName, ResultsFile);
Arguments
ModuleIndex A (K × 1) cell array.ModuleIndex{i} records the indexes of theithidentified module for one type of features.
FeatureLabel A (n× 1) cell array recording all the names of one type of features.TypeName A string for the feature type (e.g.,TypeName = ‘Gene expression’).ResultsFile A string for the folder name to save these lists (e.g.,TypeName
= ‘Gene expression’, ResultsFile = ‘jNMFresults’, all the identifiedgene lists are saved in the directory:‘./jNMF results/GeneLists/’.
Output
A number of text files (e.g.,GeneList1.txt, GeneList2.txt, ....)
OutputModule2TXT Output the feature indexes of the identified md-modules.
Description
Output the feature indexes of the identified md-modules intoa text file.
Usage
OutputModule2TXT(Comodule, FeatureType, ResultsFile);
Arguments
Comodule It is the same as that in function ‘jNMF comodule’.ResultsFile A string for the name of this text file.
7

Output
A text file named asjNMF Results.txt(ResultsFile = ‘jNMFResults’), recording the numberand indexes of selected features separated by comma.
2 SNMNMF
SNMNMF(SparseNetwork-regularizedMultiple NMF ) can incorporate the interactions within(A11 ∈ R
n1×n1 , A22 ∈ Rn2×n2) and between the two genomics variables (A12 ∈ R
n1×n2) intothe jNMF framework for pairwise case (X1 ∈ R
p×n1 ,X2 ∈ Rp×n2). Users can choose which
networks they prefer to incorporate in the framework by setting the corresponding parameters.Besides, it also adds the sparsity constraints for basis matrix W and weight matricesH1 andH2. With the network-regularized constraints,SNMNMFmakes the variables linked in thesetwo networks more likely to be placed into the same module. With the sparsity constraints, ithelps us choose key variables. These constraints both lead to the identified md-modules morebiologically interpretable. This model is defined as follows:
minW,Hi
2∑
i=1
‖Xi −WHi‖2F −
∑
1≤i≤j≤2
λijTr(HiAijHTj )
+γ1‖W‖2F + γ2(∑
i
‖h(1)i ‖21 +
∑
j
‖h(2)j ‖21)
s.t. W ≥ 0,H1 ≥ 0,H2 ≥ 0.
whereh(1)i is theith column ofH1, andh(2)j is thejth column ofH2.
2.1 Algorithm
Run SNMNMF The main function for SNMNMF.
Description
This is the main function for SNMNMF which integrates all therelated functions to achieveit.
Usage
Run SNMNMF(Input);
Arguments
Input A structure variable (Section 5).
Output
It saves all the results in the directory‘./MIA/SNMNMF/SNMNMFResults/’, including‘SNMNMF Results.mat’, ‘SNMNMFRunRecords.txt’, ‘SNMNMFResults.txt’, several foldersand figures, which record the similar contents with those in function ‘Run jNMF’ of jNMFas shown in Figure 2, Figure 3 and Figure 4.
SNMNMF PrepData Preprocess the input data.
Description
This function is used to preprocess the input data to ensure the non-negativity.
Usage
[newInput, isdouble] = SNMNMFPrepData(Input);
8

Arguments
Input A structure variable including three components:Input.data A matrix combing two data blocks sequentially tobe factorized
(e.g.,Input.data= [X1,X2]).Input.XBlockInd A matrix of size2× 2. The two elements of theith row give the
start and end column indexes inInput.datafor data matrixXi
(i = 1, 2).Input.netAdj An adjacency matrix for the relationships between the features in
Input.data, that is, Input.netAdj= [A11, A12;AT12, A22].
Output
newInput A structure variable includingnewInput.data A non-negative matrix which is transformed from Input.data.newInput.XBlockInd A matrix of size2× 2 which is similar withInput.XBlockInd.newInput.netAdj An adjacency matrix transformed fromInput.netAdj.
isdouble A binary variable (1 indicates changes have been made, and 0 is forno change, that is,Input = newInput).
SNMNMF comodule Obtain the md-modules.
Description
This function computes the optimal factorization results through running SNMNMF for multipletimes, then identify the md-modules based on the factorizedmatricesW,Hi.
Usage
[W, H1, H2, Comodule, params] = SNMNMFcomodule(Input, params);
Arguments
Input A structure variable defined as that in function‘SNMNMF PrepData’,but theInput.datais a non-negative matrix.
params A structure variable, except forparams.isdouble, params.K, params.nloop,params.maxiter, params.thrdmodule, defined similar as those in thefunction ‘jNMF comodule’described above. There are five specificcomponents, including
params.thrXr, params.thrXcparameters referring to the basis matrixW-related term, the weightmatricesHi-related terms in the objective function to limit the growth
of W ,makeHi sparse, respectively.
params.thrNet11, params.thrNet12, params.thrNet22parameters referring to the networkA11, A12, A22 related constraintsin the objective function.
Output
W, H1, H2 Factorization results such thatInput.data≈ [WH1,WH2]. W isthe basis matrix of sizem×K,H1 is the weight matrix of sizeK×n1
andH2 is the weight matrix of sizeK × n2, whereK = params.K.Comodule Identified md-modules recorded in a(K×3) cell array, which has the
same definition as that in function‘jNMF comodule’.params Compared to ‘params’ as input, there are something new added in it,
includingparams.recordsandparams.iterNumListwhich are similarwith those in the function‘jNMF comodule’, whereN = 2.
9

SNMNMF algorithm SNMNMF algorithm.
Description
This implements the SNMNMF algorithm.
Usage
[W, H1, H2, TerminalObj, iter] = SNMNMFalgorithm(X1, X2, A11, A12, A22, params);
Arguments
X1, X2 The non-negative input matrices.A11, A12, A22 Adjacency matrices for the relationships within and between the
features inX1 andX2.params A structure variable includingparams.isdouble, params.K,
params.thrdmodule, params.thrXr, params.thrXc, params.thrNet11,params.thrNet12, params.thrNet22. They are the same as those infunction ‘SNMNMF comodule’.
Output
W, H1, H2 Factorization results like those in function ‘SNMNMFcomodule’.TerminalObj A(iter × 3) matrix each row of which records the values of all the
terms in the objective function and the sum of them in each iteration.
SNMNMF module Identify the md-modules from factorized matrix.
Description
Based on the factorized matrixW , H1 orH2, identify the md-module members for each typeof features.
Usage
module = SNMNMFmodule(H, t, isdouble);
Arguments
H, t, isdouble They are defined as those in function‘jNMF module’.Output
module Defined as that in function‘jNMF module’.
2.2 Output figures
SNMNMF plot X Provide the heatmaps for the original input matrices.
Description
Draw the heatmaps for the original input matrices (X1 andX2). The arguments and outputsof this function are similar with those in the function‘jNMF plot X’ of jNMF with N = 2.
Usage
SNMNMF plot X(X, XInd, fig, figure title, colormaptype);
SNMNMF plot results Show the heatmaps of a identified md-module.
Description
10

Show the heatmaps of a selected identified md-module (circled in yellow lines). The argumentsand outputs of this function are similar with those in the function ‘jNMF plot result’ with N = 2.
Usage
SNMNMF plot results(X, XInd, FeatureType, fig, figuretitle, colormaptype, vectorForRank);
SNMNMF plot correlation Demonstrate the correlations between the originaldata and the reconstructed one.
Description
Demonstrate the correlations between the original dataXi and the reconstructed onenewXi= WHi using boxplot (i = 1, 2). The arguments and outputs of this function are similar withthose in the function‘jNMF plot correlation’ with N = 2.
Usage
corrMat = SNMNMFplot correlation(X, newX, XInd, newXInd, fig, figuretitle);
SNMNMF plot distribution Demonstrate the module size distributions.
Description
This function provides the histograms for the size distributions of two types of features in theidentified md-modules. The arguments and outputs of this function are similar with those in thefunction ‘jNMF plot distribution’ with N = 2.
Usage
SNMNMF plot distribution(nSample, XInd, Comodule, FeatureType, fig, figure title);
2.3 Output text files
Index2LabelForModuleContent Output the identified md-modules into text files.
Description
This function is the same as that described in jNMF.
OutputModule2TXT Output the feature indexes of the identified md-modules.
Description
This function is the same as that in jNMF.
3 sMBPLS
sMBPLS(sparseMulti-Block PartialLeastSquare) extends the standard PLS method to discoverassociations between multiple input matrices (X1,X2, ...,XN ;N ≥ 1,Xi ∈ R
p×ni and aresponse matrix (Y ∈ R
p×m) in a sparse manner. It identifies md-modules in which a subset ofheterogeneous input features jointly explain a subset of the response variables. This problem isdefined as,
11

maxwi,q,bi
cov(t, u)−N∑
i=1
λi‖wi‖1 − τ‖q‖1
with ti = Xiwi, u = Y q, t =
N∑
i=1
biti
s.t.‖wi‖22 = 1, ‖q‖22 = 1,
N∑
i=1
b2i = 1.
3.1 Algorithm
Run sMBPLS The main function for sMBPLS.
Description
This is the main function for sMBPLS which integrates all therelated functions to achieve it.
Usage
Run sMBPLS(Input);
Arguments
Input A structure variable (Section 5).
Output
It saves all the results in the directory‘./MIA/sMBPLS/sMBPLSResults/’, includingsMBPLSResults.mat, sMBPLSRunRecords.txt, sMBPLSResults.txt,several folders and figures,which record the similar contents with those in function‘Run jNMF’ of jNMF as shown inFigure 2, Figure 3 and Figure 4.
meanc Preprocess the input matrices.
Description
This function centers the input data across the samples to enable the mean of each column ofthe input matrix to be zero.
Usage
[Zm,mz] = meanc(Z);
Arguments
Z A matrix.
Output
Zm The centered matrix.mz A row vector.mz(i) is the mean ofZ(:,i).
sMBPLScomodule Obtain the md-modules.
Description
This function returns all the md-modules by running SMBPLS for multiple times.
Usage
[nfactor, W, Q, WT, WU, TT, UU, sT, sU, XX, YY, Comodule, params] =sMBPLScomodule(X, Y, XInd, YInd, FeatureType, params);
12

Arguments
X The input matrix of size (p × n) combingN data blocks (e.g.,X = [X1, ...,XN ]).
Y The response matrix of size (p×m) combingM data blocks (e.g.,Y = [Y1, ..., YM ]). Generally,M = 1.
XInd A matrix of sizeN ×2. The two elements of theith row give the startand end column indexes inX for data matrixXi (i = 1, ..., N).
YInd A matrix of sizeM × 2. It is for Y defined similarly withXInd.FeatureType A (1×(N +M )) cell array. FeatureType{i} records the name ofith
type of features (e.g.,FeatureType ={‘microRNA expression’,‘CNV’,‘DNA Methylation’,‘Gene expression’}.
params A structure variable includingparams.nfactor A pre-defined number of identified md-modules.params.nfold A positive integer which is the number of foldsused for cross-validation
(CV) procedures. Generally, we setparams.nfold= 5 or 10.params.maxiter The maximal number of iterations for sMBPLSalgorithm.params.tol The precision for the convergence of sMBPLS algorithm.params.param A (l× 1) cell array restoring all the combinations of parameters tobe
selected.params.param{i} contains one group of parameters usedin the algorithm, including thrXc and thrYc (controlling the numberof selected features of X and Y in the identified md-modules),thrXrand thrYr (thrXr = thrYr, controlling the number of selectedsamplesin the identified md-modules), maxiter (maxiter = params.maxiter),tol (tol = params.tol).
Output
nfactor The number of identified md-modules (nfactor≤ params.nfactor).W A (n× nfactor) matrix,W(:,i) is the weight vector forX in ith md-module.Q A (m× nfactor) matrix,Q(:,i) is the weight vector forY in ith
md-module.WT A (N× nfactor) matrix,WT(:,i) is the super weight vector forX in
ith md-module.WU A (M× nfactor) matrix,WU(:,i) is the super weight vector forY in
ith md-module.TT A (p× (N× nfactor)) matrix,TT(:, N×(i−1)+j) is the score vector
for Xj in ith md-module (i = 1, ...,nfactor; j = 1, ..., N ).UU A (p× (M× nfactor)) matrix,UU(:,M × (i− 1) + j) is the score
vector forYj in ith md-module (i = 1, ...,nfactor; j = 1, ...,M ).Generally,M = 1.
sT A (p× nfactor)) matrix, sT(:, i) is the super score forX in ith md-module(i = 1, ...,nfactor).
sU A (p× nfactor)) matrix,sU(:, i) is the super score forY in ith md-module(i = 1, ...,nfactor).
XX, YY The new matrix after removing the signals of identifiedmd-modulesfrom X andY .
Comodule The md-modules are recorded in a (nfactor×(M +N +1)) cell arraywhich is similar to that in the function‘jNMF comodule’.
params Compared to ‘params’ as input, there are something new added in it,including
params.iterNumList A (nfactor×1) vector, where each element is the number of iterationsfor each round of running.
13

params.records A (nfactor×1) cell array.params.records{i} is a (iter×(M+N+2))matrix where each row records the values of all the terms in theobjective function and the sum of them in each iteration whenidentifytheith md-module, anditer = params.iterNumList(i), i = 1,...,nfactor.
params.randRowPartitionsA (params.nfold×1) cell array. For n-fold CV procedure,p samplesare partitioned intoparams.nfoldgroups equally.params.randRowPartitions{i}records the sample indexes in theith group (i = 1, ...,params.nfold).
params.cvscores A matrix whereparams.cvscores(i, j) is the cv score for theith groupof parameters when identify thejth md-module.
params.paramsidxusedA (nfactor×1) vector.params.paramsidxused(i)is the index ofselected parameters for identifying theith md-module.
sMBPLSalgorithm sMBPLS algorithm.
Description
This implements the sMBPLS algorithm.
Usage
[success, w, q, b, a, T, U, t, u, XX, YY, TerminalObj, iter]= sMBPLSalgorithm(X, Y, XInd, YInd, param);
Arguments
X, Y, XInd, YInd Defined the same as those in function‘sMBPLScomodule’.param A structure variable including six components:
param.maxiter, param.tolSame as those in function‘sMBPLScomodule’.
param.thrXc, param.thrYcTwo positive integers which are two thresholds for selecting featuresof X andY in the identified md-modules.
param.thrXr, param.thrYrparam.thrXr = param.thrYr. A positive integer which is a thresholdfor selecting samples in the identified md-modules.
Output
success An indicator to show if this algorithm runs successfully or not(1 for success, 0 for failure).
w, q Weight vectors forX,Y .b, a Super weight vectors forX,Y .T A (p×N ) matrix,T(:,i) is the score vector forXi (i = 1, ..., N ).U A (p ×M ) matrix,U(:,i) is the score vector forYi (i = 1, ...,M ).
Generally,M = 1.t, u Super score vectors forX,Y .XX, YY The new matrices after removing the signals of currentmd-modules
from X andY .iter The number of iterations to indicate when the algorithmstops.TerminalObj A (iter×(2 +N +M )) matrix in which each row records the values
of all the terms in the objective function and the sum of them in eachiteration.
14

sMBPLSparams Integrate all the parameters into an unified framework.
Description
This function is used to incorporate all the parameters intoa structure variable‘newparams’.
Usage
newparams = sMBPLSparams(params);
Arguments
params A structure variable includingparams.maxiter, params.tol, params.nfold, params.nfactor
They are the same as those in the function‘sMBPLScomodule’.params.thrXYrlist
This is a column vector recording the thresholds for selection samples.params.thrXclist
A (1×N ) cell array.params.thrXclist{i} is a column vector, whichincludes several thresholds for selection features in datamatrixXi
(i = 1, ..., N ).params.thrYclist
A (1×M ) cell array.params.thrYclist{i} is a column vector, whichincludes several thresholds for selection features inYi (i = 1, ...,M ).
Output
newparams A structure variable which is the same as the inputargument‘params’in ‘sMBPLScomodule’.
sMBPLSselectparam Select a group of proper parameters used in sMBPLSalgorithm.
Description
Using a cross-validation (CV) procedure to select a group ofproper parameters.
Usage
[paramidx, cv scores] = sMBPLSselectparam(X, Y, XInd, YInd, params);
Arguments
X, Y, XInd, YInd Defined as those in function‘sMBPLScomodule’.params A structure variable includingparams.param, params.randRowPartitions,
which are both the same as the output argument‘params’ in function‘sMBPLScomodule’.
Output
paramidx The index of selected optimal parameters in params.param.cv scores A column vector recording the CV scores for all groupsof parameters.
sMBPLSgetCVscore Calculate the CV score for one group of parameters.
Description
By using a n-fold cross-validation (CV) procedure for one group of parameters, it will obtainthe corresponding CV score to assess this group of parameters. The smaller the better.
Usage
cv score = sMBPLSgetCVscore(X, Y, XInd, YInd, param, randRowPartitions);
15
Arguments
X, Y, XInd, YInd, param Defined the same as those in function‘sMBPLSalgorithm’.randRowPartitions Defined the same as‘params.randRowPartitions’in the output of
function ‘sMBPLScomodule’.
Output
cv score A score for this group of parameters’param’ in the input arguments.
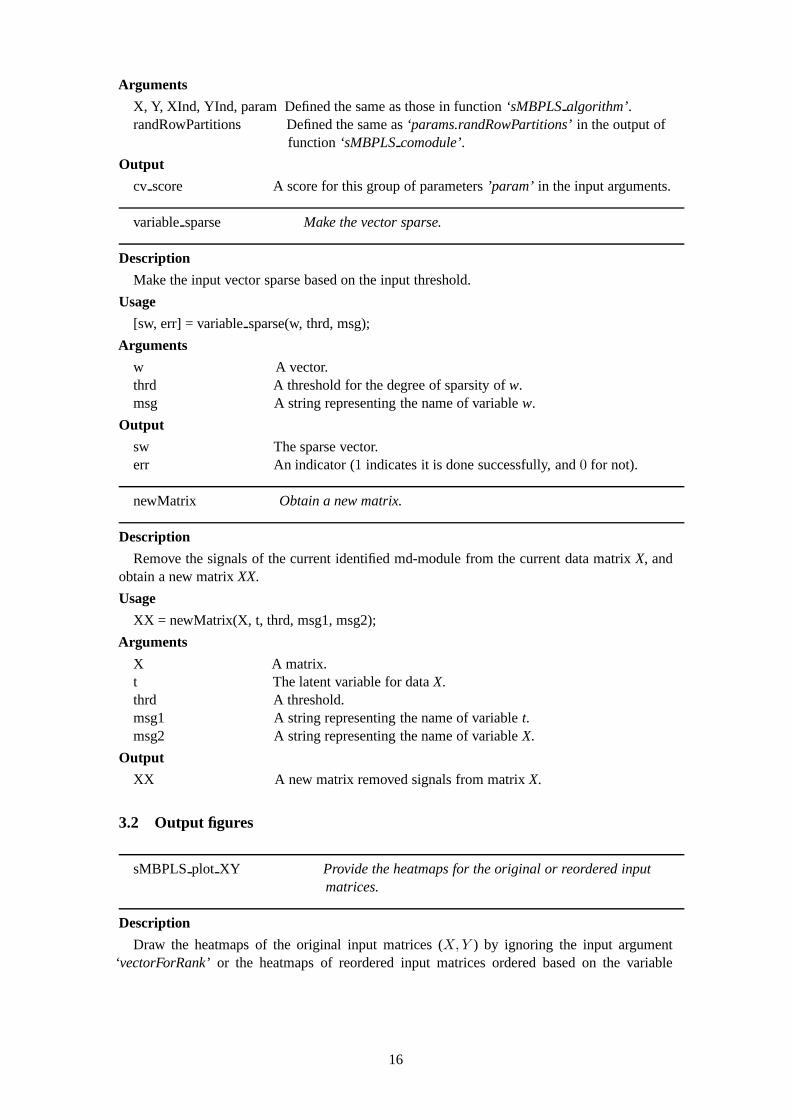
variablesparse Make the vector sparse.
Description
Make the input vector sparse based on the input threshold.
Usage
[sw, err] = variablesparse(w, thrd, msg);
Arguments
w A vector.thrd A threshold for the degree of sparsity ofw.msg A string representing the name of variablew.
Output
sw The sparse vector.err An indicator (1 indicates it is done successfully, and0 for not).
newMatrix Obtain a new matrix.
Description
Remove the signals of the current identified md-module from the current data matrixX, andobtain a new matrixXX.
Usage
XX = newMatrix(X, t, thrd, msg1, msg2);
Arguments
X A matrix.t The latent variable for dataX.thrd A threshold.msg1 A string representing the name of variablet.msg2 A string representing the name of variableX.
Output
XX A new matrix removed signals from matrixX.
3.2 Output figures
sMBPLSplot XY Provide the heatmaps for the original or reordered inputmatrices.
Description
Draw the heatmaps of the original input matrices (X,Y ) by ignoring the input argument‘vectorForRank’ or the heatmaps of reordered input matrices ordered based onthe variable
16

‘vectorForRank’where the signals of the identified md-module will be locatedin the four cornersof this heatmap.
Usage
sMBPLSplot XY(X, Y, XInd, YInd, fig, figure title, colormaptype, vectorForRank);
Arguments
X, Y, XInd, YInd Defined as those in the function‘sMBPLScomodule’.fig, figure title, colormaptype
Defined as those in the function‘jNMF plot X’ of jNMF.vectorForRank A structure variable including
vectorForRank.t The scores used for ordering samples. It isone column of matrixsTin the output of function‘sMBPLScomodule’.
vectorForRank.w, vectorForRank.qThe weight vectors forX,Y related to a specific md-module,respectively. They are respectively one column of matrixW, Qin theoutput of function‘sMBPLScomodule’.
Output
The heatmaps for the original or reordered input data matrices.
sMBPLSplot results Demonstrate the heatmaps of a specific md-module and thescatterplots for the correlation between the selected features.
Description
Show the heatmaps of a selected md-module (circled in yellowlines), and the scatterplots forthe correlations between the selected features.
Usage
sMBPLSplot results(X, Y, XInd, YInd, FeatureType, fig, figuretitle, colormaptype, vectorForRank);Arguments
X, Y, XInd, YInd, fig, figure title, colormaptypeDefined the same as those input arguments in‘sMBPLSplot XY’.
vectorForRank A structure variable including six components. Except for the threeones in the input argumentvectorForRankof ‘sMBPLSplot XY’,there are also
vectorForRank.T A (p ×N ) matrix. T (:, i) is the score vector forXi (i = 1, ..., N).vectorForRank.U A (p×M ) matrix.U(:, i) is the score vector forYi (i = 1, ...,M).vectorForRank.comodule
A (1×(N +M + 1)) cell array.vectorForRank.comodule{i} recordstheith feature indexes of a selected md-module. The first column isfor selected samples.
FeatureType A (1×(N +M )) cell array. FeatureType{i} records the name ofithtype of features (e.g.,FeatureType ={‘microRNA expression’,‘CNV’,‘DNA Methylation’,‘Gene expression’}.
Output
The heatmaps for certain selected md-module to demonstratethe patterns of this md-moduleas shown in Figure 4.
The scatterplots for the correlation between the selected features as shown in Figure 5.
sMBPLSplot distribution Demonstrate the module size distributions.
17

Description
This function provides histograms for the size distributions of all the components in theidentified md-modules.
Usage
sMBPLSplot distribution(nSample, Ind, Comodule, FeatureType, fig, figure title);
Arguments
Ind Ind = [XInd; YInd]. XInd, YIndare the same as those in function‘sMBPLScomodule’.
Comodule It is the same as that in the output of function‘sMBPLScomodule’.nSample, FeatureType, fig, figuretitle
Similar with those in function‘jNMF plot distribution’.
Output
Histograms for the size distributions of all the features inthe identified md-modules.
3.3 Output text files
Index2LabelForModuleContent Output the identified md-modules into text files.
Description
This function is the same as that described in jNMF.
OutputModule2TXT Output the feature indexes of the identified md-modules.
Description
This function is the same as that described in jNMF.
4 SNPLS
SNPLS(SparseNetwork-regularizedPLS) is designed for one input matrix (X ∈ Rp×n) and
one response matrix (Y ∈ Rp×m). It introduces network-regularized constraints, expressed as
adjacency matricesA ∈ Rn×n of a given interaction networkG1 for the features inX and/or
B ∈ Rm×m of another interaction networkG2 for Y . This problem is defined as,
maxg,d
cov(Xg, Y d)− λ1gTLXg − λ2d
TLY d− λ3‖g‖1 − λ4‖d‖1
s.t. gT g = 1, dTd = 1.
whereu = Xg, v = Y d,LX , LY are the symmetric Laplacian matrices of networkG1, G2,repsectively.
4.1 Algorithm
Run SNPLS The main function for SNPLS.
Description
This is the main function for SNPLS, which integrates all therelated functions to achieve it.
18

Usage
Run SNPLS(Input);
Arguments
Input A structure variable (Section 5).
Output
It saves all the results in the directory‘./MIA/SNPLS/SNPLSResults/’, includingSNPLSResults.mat, SNPLSRunRecords.txt, SNPLSResults.txt,several folders and figures, whichrecord the similar contents with those in function‘Run jNMF’ of jNMF as shown in Figure 2,Figure 3 and Figure 4.
SNPLScomodule Obtain the co-modules (md-modules).
Description
This function returns all the co-module (md-modules) by running SNPLS for multiple times.
Usage
[nfactor, G, D, U, V, XX, YY, Comodule, params] = SNPLScomodule(X, Y, A, B, FeatureType,params);
Arguments
X The input matrix of size (p × n).Y The response matrix of size (p×m).A The adjacency matrix for the interactions between the features inX,
whereA = (aij), aij = 1 if featuresi andj are linked;aij = 0,otherwise.
B The adjacency matrix defined similar withA for the features inY .FeatureType A (1×2) cell array. FeatureType{i} records the name ofith type
of features (e.g.,FeatureType ={‘microRNA expression’,‘Gene expression’}.params A structure variable including the components below:
params.nfactor, params.nfold, params.maxiter, params.tolDefined the same as those in the function‘sMBPLScomodule’.
params.param A (l × 1) cell array recording all the combinations of parameters tobe selected. params.parami contains one group of parameters used inthe algorithm, includingthrXc andthrYc(controlling the number ofselected features ofX andY in the identified md-modules)thrXNetandthrYNet(parameters for the network-regularized constraints inthe objective function),maxiter(maxiter = params.maxiter),tol (tol = params.tol).
params.thrdmodule A positive vector of size1×3 which stores the thresholds for selectingsamples and features inX andY .
Output
nfactor, XX, YY, ComoduleSimilar with those in the function‘sMBPLScomodule’withN = M = 1.
G A (n× nfactor) matrix,G(:,i) is the weight vector forX in theithmd-module.
D A (m× nfactor) matrix,D(:,i) is the weight vector forY in theithmd-module.
U A (p× nfactor)) matrix,U(:,i) is the super score forX in theithmd-module (i = 1, ...,nfactor).
19

V A (p× nfactor)) matrix,V(:,i) is the super score forY in theithmd-module (i = 1, ...,nfactor).
params Compared to‘params’ as input, there are new components includingparams.iterNumList, params.records, params.randRowPartitions,params.cvscores, params.paramsidxuseddefined the same as theoutput argument in the function‘sMBPLScomodule’.
SNPLSalgorithm SNPLS algorithm.
Description
This implements the SNPLS algorithm.
Usage
[success, g, d, u, v, XX, YY, TerminalObj, iter] = SNPLSalgorithm(X, Y, LX, LY, param);
Arguments
X, Y The same as those in function‘SNPLScomodule’.LX, LY Laplacian matrices of size (n× n) and (m×m) about the interaction
network for the features in dataX andY , respectively.param A structure variable including
params.tol, params.maxiterDefined the same as those in the function‘SNPLScomodule’.
param.thrXc, param.thrYcTwo non-negative numbers which are respectively related totheparametersλ3, λ4 in the objective function.
param.thrXNet, param.thrYNetTwo non-negative numbers.param.thrXNetis the parameterλ1 in theobjective function used in the network-regularized constraint aboutX. param.thrYNetis similar withparam.thrXNetused in the netowrkaboutY if available.
If param.thrXNet = param.thrYNet = 0, this algorithm reduces to sMBPLS for pairwise case.If param.thrXc = param.thrYc = param.thrXNet = param.thrYNet= 0, this algorithm reduces
to the standard PLS.
Output
success, TerminalObj, iter, XX, YYThey are the same as those in the function‘sMBPLSalgorithm’.
g, d Weight vectors forX andY .u, v Score vectors forX andY .
SNPLSparams Integrate all the parameters into an unified framework.
Description
This function is used to incorporate all the parameters intoa structure variable‘newparams’.
Usage
newparams = SNPLSparams(params);
Arguments
params A structure variable includingparams.tol, params.maxiter, params.nfold, params.nfactor, params.thrdmodule
Defined the same as those in the function‘SNPLScomodule’.params.thrXNetlist This is a column vector recording the parameters for thenetwork
20
constraint aboutX in the objective function.params.thrYNetlist This is a column vector recording the parameters for thenetwork
constraint aboutY in the objective function.params.thrXclist A column vector, which includes several thresholds forselecting
features in data matrixX.params.thrYclist A column vector, which includes several thresholds forselecting
features in data matrixY .
Output
newparams A structure variable defined the same as the input argument‘params’in the function‘SNPLScomodule’.
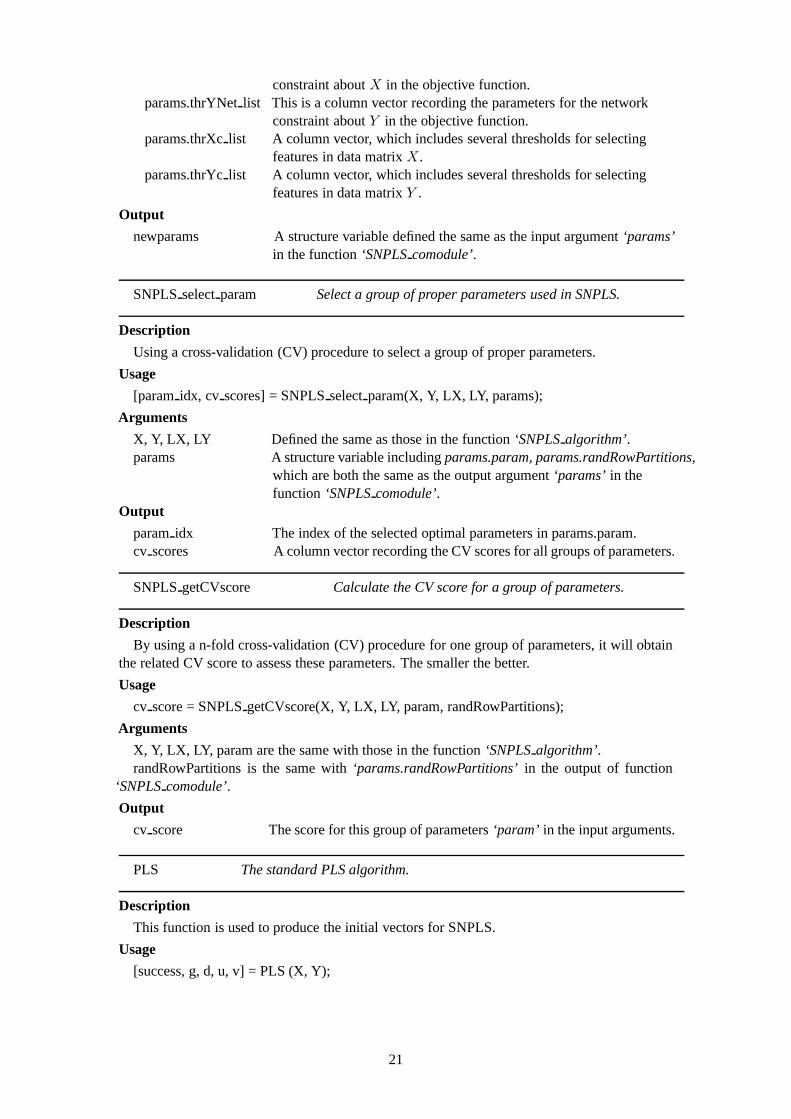
SNPLSselectparam Select a group of proper parameters used in SNPLS.
Description
Using a cross-validation (CV) procedure to select a group ofproper parameters.
Usage
[paramidx, cv scores] = SNPLSselectparam(X, Y, LX, LY, params);
Arguments
X, Y, LX, LY Defined the same as those in the function‘SNPLSalgorithm’.params A structure variable includingparams.param, params.randRowPartitions,
which are both the same as the output argument‘params’ in thefunction ‘SNPLScomodule’.
Output
paramidx The index of the selected optimal parameters in params.param.cv scores A column vector recording the CV scores for all groupsof parameters.
SNPLSgetCVscore Calculate the CV score for a group of parameters.
Description
By using a n-fold cross-validation (CV) procedure for one group of parameters, it will obtainthe related CV score to assess these parameters. The smallerthe better.
Usage
cv score = SNPLSgetCVscore(X, Y, LX, LY, param, randRowPartitions);
Arguments
X, Y, LX, LY, param are the same with those in the function‘SNPLSalgorithm’.randRowPartitions is the same with‘params.randRowPartitions’in the output of function
‘SNPLScomodule’.
Output
cv score The score for this group of parameters‘param’ in the input arguments.
PLS The standard PLS algorithm.
Description
This function is used to produce the initial vectors for SNPLS.
Usage
[success, g, d, u, v] = PLS (X, Y);
21

Arguments
X, Y Two input matrices for the PLS algorithm.
Output
success An indicator to indicate whether PLS performs successfully or not(1 for success and 0 for failure).
g, d The weight vectors for input dataX andY .u, v The score vectors for input dataX andY .
thresholding Make the input vector sparse.
Description
Make the input vector sparse based on the input thresholds.
Usage
sw = thresholding(w,thrd,msg);
Arguments
w A vector.thrd A threshold for the degree of sparsity ofw.msg A string for the name of variablew.
Output
sw The sparse vector.
4.2 Output figures
SNPLSplot XY Provide the heatmaps for the original or reordered input matrices.
Description
It is a similar function as ‘sMBPLSplot XY’ described in sMBPLS.
Usage
SNPLSplot XY(X, Y, fig, figure title, colormaptype, vectorForRank);
Arguments
X, Y The same as those in the function‘SNPLScomodule’.fig, figure title, colormaptype
Defined the same as those in the function‘jNMF plot X’of jNMF.vectorForRank A structure variable including
vectorForRank.u The scores used for ordering samples. It isone column of matrixUin the output of function‘SNPLScomodule’.
vectorForRank.g, vectorForRank.dThe weight vectors forX andY related to one identified md-module,respectively. They are respectively one column of matrixG, D in theoutputs of function‘SNPLScomodule’.
Output
The heatmaps for the original or reordered input data matrices.
SNPLSplot results Demonstrate the heatmaps of certain identified md-moduleand the scatterplots for the correlation between the selectedfeatures.
22

Description
It is a similar function with‘sMBPLSplot results’described in sMBPLS.
Usage
SNPLSplot results(X, Y, FeatureType, fig, figuretitle, colormaptype, vectorForRank);
Arguments
X, Y, fig, figure title, colormaptypeThe same as those of function‘SNPLSplot XY’.
vectorForRank A structure variable containingvectorForRank.g, vectorForRank.d, vectorForRank.u
Defined the same as those in the function‘SNPLSplot XY’.vectorForRank.comodule
A (1× 3) cell. It has the similar meaning with that in the function‘sMBPLSplot results’.
vectorForRank.v The score vector for dataY . It is one column of matrixV in the outputof function ‘SNPLScomodule’.
FeatureType Similar definition with that in the function‘sMBPLSplot results’with N = M = 1.
Output
The heatmaps for certain selected md-module to demonstratethe patterns of this md-module.The scatterplots for the correlation between the selected features.
SNPLSplot distribution Demonstrate the module size distributions.
Description
This function provides histograms for the size distributions of all the components in theidentified md-modules, which has the similar input arguments and output results.
Usage
SNPLSplot distribution(nSample, Ind, Comodule, FeatureType, fig, figure title);
4.3 Output text files
Index2LabelForModuleContent Output the identified md-modules into text files.
Description
This function is the same as that described in jNMF.
OutputModule2TXT Output the feature indexes of identified md-modules.
Description
This function is the same as that described in jNMF.
23
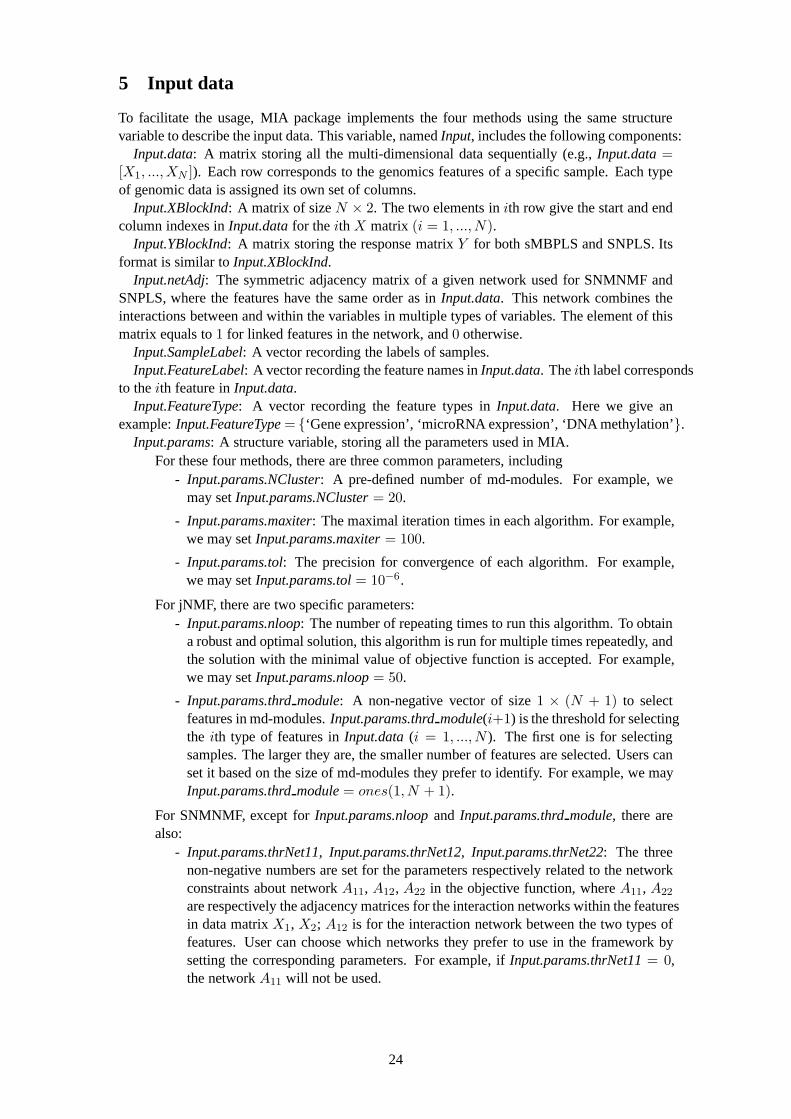
5 Input data
To facilitate the usage, MIA package implements the four methods using the same structurevariable to describe the input data. This variable, namedInput, includes the following components:
Input.data: A matrix storing all the multi-dimensional data sequentially (e.g., Input.data=[X1, ...,XN ]). Each row corresponds to the genomics features of a specificsample. Each typeof genomic data is assigned its own set of columns.
Input.XBlockInd: A matrix of sizeN × 2. The two elements inith row give the start and endcolumn indexes inInput.datafor theith X matrix (i = 1, ..., N).
Input.YBlockInd: A matrix storing the response matrixY for both sMBPLS and SNPLS. Itsformat is similar toInput.XBlockInd.
Input.netAdj: The symmetric adjacency matrix of a given network used for SNMNMF andSNPLS, where the features have the same order as inInput.data. This network combines theinteractions between and within the variables in multiple types of variables. The element of thismatrix equals to1 for linked features in the network, and0 otherwise.
Input.SampleLabel: A vector recording the labels of samples.Input.FeatureLabel: A vector recording the feature names inInput.data. Theith label corresponds
to theith feature inInput.data.Input.FeatureType: A vector recording the feature types inInput.data. Here we give an
example:Input.FeatureType= {‘Gene expression’, ‘microRNA expression’, ‘DNA methylation’}.Input.params: A structure variable, storing all the parameters used in MIA.
For these four methods, there are three common parameters, including- Input.params.NCluster: A pre-defined number of md-modules. For example, we
may setInput.params.NCluster= 20.
- Input.params.maxiter: The maximal iteration times in each algorithm. For example,we may setInput.params.maxiter= 100.
- Input.params.tol: The precision for convergence of each algorithm. For example,we may setInput.params.tol= 10−6.
For jNMF, there are two specific parameters:- Input.params.nloop: The number of repeating times to run this algorithm. To obtain
a robust and optimal solution, this algorithm is run for multiple times repeatedly, andthe solution with the minimal value of objective function isaccepted. For example,we may setInput.params.nloop= 50.
- Input.params.thrdmodule: A non-negative vector of size1 × (N + 1) to selectfeatures in md-modules.Input.params.thrdmodule(i+1) is the threshold for selectingthe ith type of features inInput.data(i = 1, ..., N ). The first one is for selectingsamples. The larger they are, the smaller number of featuresare selected. Users canset it based on the size of md-modules they prefer to identify. For example, we mayInput.params.thrdmodule= ones(1, N + 1).
For SNMNMF, except forInput.params.nloopand Input.params.thrdmodule, there arealso:
- Input.params.thrNet11, Input.params.thrNet12, Input.params.thrNet22: The threenon-negative numbers are set for the parameters respectively related to the networkconstraints about networkA11, A12, A22 in the objective function, whereA11, A22
are respectively the adjacency matrices for the interaction networks within the featuresin data matrixX1, X2; A12 is for the interaction network between the two types offeatures. User can choose which networks they prefer to use in the framework bysetting the corresponding parameters. For example, ifInput.params.thrNet11= 0,the networkA11 will not be used.
24

- Input.params.thrXr, Input.params.thrXc: The two non-negative numbers are set forthe row related (orW ), and column related (Hi) terms respectively in the objectivefunction. It controls the degree of sparsity of matrixW , H. For example, we maysetInput.params.thrXr= 10, Input.params.thrXc= 10.
For sMBPLS, there are:- Input.params.nfold: A positive number used forn-fold cross-validation (CV) procedure.
Generally, we setInput.params.nfold= 5 or= 10. This method applies CV procedureto select a proper group of parameters from all the combinations of these parameterlists described below.
- Input.params.thrXYrlist: A column vector with positive integers. They are candidatesfor thresholds in order to select samples in md-modules. Forexample, we may setInput.params.thrXYrlist = [20; 30].
- Input.params.thrXclist, Input.params.thrYclist: Two row vectors of size1×N, 1×M with positive integers to control the degree of sparsity forthe weight variables ofinput dataX, Y , respectively. For example, we may setInput.params.thrXclist =repmat({[20; 30]}, 1, N), Input.params.thrYclist = repmat({[20; 30]}, 1,M), whereN = size(Input.XBlockInd,1), M = size(Input.YBlockInd,1).
For SNPLS, there are:
- Input.params.nfold: It is the same as that in sMBPLS.
- Input.params.thrXclist, Input.params.thrYclist: They have the same meaning asthose in sMBPLS for the situation ofN = 1, M = 1. Thus, they are defined ascolumn vectors. For example, we may setInput.params.thrXclist = [0.01; 0.03; 0.05],Input.params.thrYclist = [0.1; 0.3; 0.5].
- Input.params.thrXNetlist, Input.params.thrYNetlist: The two column vectors withnon-negative values. They have the similar function withInput.params.thrNet11in SNMNMF. Input.params.thrXNetlist, Input.params.thrYNetlist are respectivelyfor the networks within the features in input dataX, and response dataY . Forexample, we may setInput.params.thrXNetlist = [1; 5]; Input.params.thrYNetlist= [1; 5].
- Input.params.thrdmodule: It is a non-negative matrix of size3 × 2. The firstcolumnInput.params.thrdmodule(i, 1) is the threshold for selecting theith featurein Input.data(i = 1, 2, 3). And the second columnInput.params.thrdmodule(i, 2)is a percentage in case of no features selected using the threshold. The first row isfor selecting samples. The larger the thresholds are, the smaller number of featuresare selected. Users can set it based on the size of md-modulesthey prefer to identify.For example, we may setInput.params.thrdmodule= [1, 0.5; 1, 0.5; 1, 0.5].
In addition, for the components that are not used in certain methods (e.g.,Input.YBlockIndinjNMF and SNMNMF andInput.netAdjin jNMF and sMBPLS), users can set them null or justignore them.
With this data structure, MIA is able to partitionInput.datainto corresponding data matricesas input for each method automatically.
Next, we provide an example for constructing the input data used in SNMNMF. Supposethat one wants to identify 50 microRNA-gene co-modules by integrate gene expression profiles(X1 ∈ R
385×12456) and micro-RNA expression profiles (X2 ∈ R385×559) across the same set
of samples, as well as the gene interaction networkG1, gene-microRNA interaction networkG2. The networkG1 can be expressed by the adjacency matrixA11 = (aij)12456×12456, whereaij = 1 if gene i and genej is linked in the networkG1. Similarly, G2 is expressed by the
25

adjacency matrixA12 ∈ R12456×559. If the microRNA interaction network is not available, the
corresponding adjacency matrixA22 is defined asA22 = zeros(559, 559).Then, we could define the input dataInput as below:
Input.data= [X1,X2];Input.XBlockInd= [1, 12456; 12457, 13015];Input.YBlockInd= [ ];Input.netAdj= [A11, A12;A12
T , A22];Input.SampleLabel= {‘TCGA-24-1105-01A’;...;‘TCGA-13-0793-01A’};Input.FeatureLabel= {‘SFRS8’;...;‘SCN3A’;‘hsa-mir-488’;...;‘hsa-mir-874’};Input.FeatureType= {‘Gene’,‘miRNA’};Input.params.NCluster= 50;Input.params.maxiter= 100;Input.params.tol= 10−6;Input.params.nloop= 5;Input.params.thrdmodule = [1,0.5;1,0.5;1,0.5];Input.params.thrNet11= 10−4; Input.params.thrNet12= 0.01; Input.params.thrNet22= 0;Input.params.thrXr= 10; Input.params.thrXc= 10;
Figure 1: Illustration of an example of the input data forSNMNMF.
26

a
b
c
d
Figure 2: An overview of the output results forSNMNMF. The details about each part are shownin Figure 3 and Figure 4.
Figure 3: The details about the output files shown in Figure 2.(a) In each folder, there are anumber of text files, each of which records one type of components in one identified co-modules.(c) A MATLAB data file storing the computation results, including the factorized matricesW,H1,H2, the 50 identified co-modules, and the parameters used in this method. (d) Thefirst text file records the feature indexes of all the identified md-modules, in which the first threenumbers are the number of samples, genes, microRNAs in one identified md-modules, and thenext three columns show the indexes of selected samples, genes and microRNA, respectively.Each list are included in the square brackets. The second text file records some informationduring the iterations. The first line shows the parameters used in SNMNMF. The rest linesshow the changes of objective function during multiple-round running. It just records the resultsbetter than the previous round.bestObjstores values of the terms in the objective function in the‘ iloop’th round, andsumObj is the sum of these terms.
27

0 20 40 60 800
9
18
Samples
Fre
quency
0 50 100 1500
6
12
Gene
0 5 100
6
12
miRNA
Module size distributionsCorrelations between original
space and reconstructed space
Original data Identified comodule 1X1 X2X1 X2 X1 X2
Gene subset(2 x 70)
miRNA subset(2 x 5)
Sa
mple
su
bset (2
x 5
6)
Figure 4: An example for the output figures in Figure 2b.
Original dataX1 X3X2 Y
Reordered data 1
X1
CNV subset (2 x 20)
Sam
ple
(2 x
13)
X2
Methylation subset (2 x 13)
X3
miRNA subset (2 x 16)
Y1
Gene subset (2 x 13)
-0.41 0.43
-0.41
0.43
t1
u1
-0.41 0.42
-0.41
0.42
t2-0.41 0.55
-0.41
0.55
t3
Identified comodule 1
Figure 5: An example for the output figures for sMBPLS.
28

6 Guide for the MIA users without a MATLAB license
Guide:
1. Operating System requirements: Windows 64-bit.
2. Download and install the Windows 64-bit version of the MATLAB Runtime for R2015bfrom the MathWorks Web site by navigating tohttp://www.mathworks.com/products/compiler/mcr/index.html.
3. Prepare the input data and store them in the path “./MIA/InputData/”. In this folder, weprovide the input data for each method as examples. For each method, there are two Excel files(one is for input data and another one is for input parameters), each of which includes severalsheets. Users need to arrange their data in the same way as those example Excel files in thisfolder we provided. Note that, each sheet is renamed as the corresponding variable name asdescribed in our manuscript.
4. Open the Command Prompt (cmd.exe). Set the current path as where the MIA package islocated, e.g., “D:/MIA”.
5. Produce MATLAB data files (*.mat) by running PreInputData.exe. Type the command asbelow:
D:\MIA>PreInputData.exe ./InputData/DataForjNMF.xlsx ./InputData/ParametersForjNMF.xlsx./InputData/InputDataForjNMF.mat jNMF
orD:\MIA>PreInputData.exe ./InputData/DataForSNMNMF.xlsx ./InputData/ParametersForSNMNMF.xlsx
./InputData/InputDataForSNMNMF.mat SNMNMFor
D:\MIA>PreInputData.exe ./InputData/DataForsMBPLS.xlsx ./InputData/ParametersForsMBPLS.xlsx./InputData/InputDataForsMBPLS.mat sMBPLS
orD:\MIA>PreInputData.exe ./InputData/DataForSNPLS.xlsx ./InputData/ParametersForSNPLS.xlsx
./InputData/InputDataForSNPLS.mat SNPLS
The first two parameters are the file names storing input data and parameters; the next parameteris the output file name. The last one is the selected method. The produced new data files (e.g.,“InputDataForjNMF.mat”) are saved in the path “./MIA/InputData/”.
6. Run MIA.exe. Type the command as below:D:\MIA> MIA.exe ./InputData/InputDataForjNMF.mat jNMF
orD:\MIA> MIA.exe ./InputData/InputDataForSNMNMF.mat SNMNMF
orD:\MIA> MIA.exe ./InputData/InputDataForsMBPLS.mat sMBPLS
orD:\MIA> MIA.exe ./InputData/InputDataForSNPLS.mat SNPLS
The first one is about the input data file and the second one is about the selected method. Foreach method, the results are saved their own directory. For example, the results of running jNMFare saved in “./MIA/jNMF/jNMFResults/”.
29


![IEEE TRANSACTIONS ON AUTOMATIC CONTROL, VOL. 55, …lsc.amss.ac.cn/~jif/paper/[J73].pdfAcademy of Sciences, Beijing 100190, China (e-mail: litao@amss.ac.cn; jif@iss.ac.cn). Color versions](https://img.pdfslide.net/doc/110x75/60734d8bff5dd113f451f086/ieee-transactions-on-automatic-control-vol-55-lscamssaccnjifpaperj73pdf.jpg)