Embed Size (px)
Citation preview

Package ‘profileR’April 19, 2018
Title Profile Analysis of Multivariate Data in R
Type Package
Description A suite of multivariate methods and data visualizationtools to implement profile analysis and cross-validation techniques described inDavison & Davenport (2002) <DOI: 10.1037/1082-989X.7.4.468>, Bulut (2013), and other published and unpublished resources.The package includes routines to perform criterion-related profile analysis, profile analysisvia multidimensional scaling, moderated profile analysis, profile analysis by group, and awithin-person factor model to derive score profiles.
Version 0.3-5
Date 2018-4-10
Author Okan Bulut <[email protected]>, Christopher David Desjardins
Maintainer Christopher David Desjardins <[email protected]>
Depends ggplot2, RColorBrewer, reshape, lavaan, R (>= 3.0.0)
License GPL (>= 2)
LazyData true
RoxygenNote 6.0.1
NeedsCompilation no
Repository CRAN
Date/Publication 2018-04-19 20:57:36 UTC
R topics documented:profileR-package . . . . . . . . . . . . . . . . . . . . . . . . . . . . . . . . . . . . . . 2anova.critpat . . . . . . . . . . . . . . . . . . . . . . . . . . . . . . . . . . . . . . . . . 3bacc2001 . . . . . . . . . . . . . . . . . . . . . . . . . . . . . . . . . . . . . . . . . . 3cpa . . . . . . . . . . . . . . . . . . . . . . . . . . . . . . . . . . . . . . . . . . . . . . 4EEGS . . . . . . . . . . . . . . . . . . . . . . . . . . . . . . . . . . . . . . . . . . . . 5interest . . . . . . . . . . . . . . . . . . . . . . . . . . . . . . . . . . . . . . . . . . . . 6IPMMc . . . . . . . . . . . . . . . . . . . . . . . . . . . . . . . . . . . . . . . . . . . 7
1

2 profileR-package
leisure . . . . . . . . . . . . . . . . . . . . . . . . . . . . . . . . . . . . . . . . . . . . 8mod_data . . . . . . . . . . . . . . . . . . . . . . . . . . . . . . . . . . . . . . . . . . 8mpa . . . . . . . . . . . . . . . . . . . . . . . . . . . . . . . . . . . . . . . . . . . . . 9nutrient . . . . . . . . . . . . . . . . . . . . . . . . . . . . . . . . . . . . . . . . . . . 10pams . . . . . . . . . . . . . . . . . . . . . . . . . . . . . . . . . . . . . . . . . . . . . 10paos . . . . . . . . . . . . . . . . . . . . . . . . . . . . . . . . . . . . . . . . . . . . . 11pbg . . . . . . . . . . . . . . . . . . . . . . . . . . . . . . . . . . . . . . . . . . . . . 12pcv . . . . . . . . . . . . . . . . . . . . . . . . . . . . . . . . . . . . . . . . . . . . . . 13plot.critpat . . . . . . . . . . . . . . . . . . . . . . . . . . . . . . . . . . . . . . . . . . 15plot.prof . . . . . . . . . . . . . . . . . . . . . . . . . . . . . . . . . . . . . . . . . . . 15pr . . . . . . . . . . . . . . . . . . . . . . . . . . . . . . . . . . . . . . . . . . . . . . 16print.critpat . . . . . . . . . . . . . . . . . . . . . . . . . . . . . . . . . . . . . . . . . 17profileplot . . . . . . . . . . . . . . . . . . . . . . . . . . . . . . . . . . . . . . . . . . 17PS . . . . . . . . . . . . . . . . . . . . . . . . . . . . . . . . . . . . . . . . . . . . . . 18spouse . . . . . . . . . . . . . . . . . . . . . . . . . . . . . . . . . . . . . . . . . . . . 19summary.critpat . . . . . . . . . . . . . . . . . . . . . . . . . . . . . . . . . . . . . . . 20wprifm . . . . . . . . . . . . . . . . . . . . . . . . . . . . . . . . . . . . . . . . . . . . 20
Index 22
profileR-package Profile Analysis of Multivariate Data in R
Description
The package profileR provides a set of multivariate methods and data visualization tools to im-plement profile analysis and cross-validation techniques described in Davison & Davenport (2002),Bulut (2013), and other resources.This package includes routines to perform criterion-related profileanalysis, profile analysis via multidimensional scaling, moderated profile analysis, profile analysisby group, and a within-person factor model to derive score profiles.
Author(s)
Okan Bulut <[email protected]>
Christopher David Desjardins <[email protected]>
References
Bulut, O. (2013). Between-person and within-person subscore reliability: Comparison of unidi-mensional and multidimensional IRT models. (Doctoral dissertation). University of Minnesota.University of Minnesota, Minneapolis, MN. (AAT 3589000).
Davison, M. L., & Davenport, E. C. (2002). Identifying criterion-related patterns of predictor scoresusing multiple regression. Psychological Methods, 7(4), 468-484.
Davison, M. L., Kim, S-K., & Close, C. W. (2009). Factor analytic modeling of within personvariation in score profiles. Multivariate Behavioral Research, 44, 668-87.

anova.critpat 3
anova.critpat Anova Tables
Description
Computes an analysis of variance table for a criterion-related profile analysis
Usage
## S3 method for class 'critpat'anova(object, ...)
Arguments
object an object containing the results returned by a model fitting cpa.... additional objects of the same type.
See Also
cpa
bacc2001 Baccalaureate and Beyond Longitudinal Study 2000
Description
Simulated data based on the Baccalaureate and Beyond Longitudinal Study 2000/2001 based on thevalues presented in Tables 1 and 2 in Davison & Davenport (unpublished).
Usage
bacc2001
Format
A data frame with 1080 rows and 4 variables:
stem Are you a STEM major? 1: yes; 0: nomajor College majorgpa GPAsatq SAT quantitativesatv SAT verbal
Source
https://nces.ed.gov/pubsearch/pubsinfo.asp?pubid=2003174

4 cpa
cpa Criterion-Related Profile Analysis
Description
Implements the criterion-related profile analysis described in Davison & Davenport (2002).
Usage
cpa(formula, data, k = 100, na.action = "na.fail", family = "gaussian",weights = NULL)
Arguments
formula An object of class formula of the form response ~ terms.
data An optional data frame, list or environment containing the variables in the model.
k Corresponds to the scalar constant and must be greater than 0. Defaults to 100.
na.action How should missing data be handled? Function defaults to failing if missingdata are present.
family A description of the error distribution and link function to be used in the model.See family.
weights An option vector of weights to be used in the fitting process.
Details
The cpa function requires two arguments: criterion and predictors. The function returns the criterion-related profile analysis described in Davison & Davenport (2002). Missing data are presently han-dled by specifying na.action = "na.omit", which performs listwise deletion and na.action = "na.fail",the default, which causes the function to fail. The following S3 generic functions are available:summary(),anova(), print(), and plot(). These functions provide a summary of the analysis(namely, R2 and the level a nd pattern components); perform ANOVA of the R2 for the pattern, thelevel, and the overall model; provide output similar to lm(), and plots the pattern effect.
Value
An object of class critpat is returned, listing the following components:
• lvl.comp - the level component
• pat.comp - the pattern component
• b - the unstandardized regression weights
• bstar - the mean centered regression weights
• xc - the scalar constant times bstar
• k - the scale constant
• Covpc - the pattern effect

EEGS 5
• Ypred - the predicted values
• r2 - the proportion of variability attributed to the different components
• F.table - the associated F-statistic table
• F.statistic - the F-statistics
• df - the df used in the test
• pvalue - the p-values for the test
References
Davison, M., & Davenport, E. (2002). Identifying criterion-related patterns of predictor scores usingmultiple regression. Psychological Methods, 7(4), 468-484. DOI: 10.1037/1082-989X.7.4.468.
See Also
pcv
Examples
## Not run:data(IPMMc)mod <- cpa(R ~ A + H + S + B, data = IPMMc)print(mod)summary(mod)plot(mod)anova(mod)
## End(Not run)
EEGS Entrance Examination for Graduate Studies
Description
The EEGS is a subset of the Entrance Examination for Graduate Studies. There are three subscores inEEGS: Quantitative 1, Quantitative 2, and Verbal. In order to show the utility of subscore reliabilitymethod in this package, each subtest was separated into two parallel forms.
Format
Form1_Q1 First form of Quantitative 1
Form2_Q1 Second form of Quantitative 1
Form1_Q2 First form of Quantitative 2
Form2_Q2 Second form of Quantitative 2
Form1_V First form of Verbal
Form2_V Second form of Verbal

6 interest
interest Fabricated cognitive, personality, and vocational interest inventory
Description
The data come from a fabricated cognitive, personality, and vocational interested inventory. Thisdata set can be used to demonstrate regression and structural equation modeling.
Usage
interest
Format
A data frame with 250 rows and 33 variables:
gender 1 is female and 2 is male
educ Years of education
age Age, in years
vocab Vocabulary test
reading Reading comprehension
sentcomp Sentence completion
mathmtcs Mathematics
geometry Geometry
analyrea Analytical reasoning
socdom Social dominance
sociabty Sociability
stress Stress reaction
worry Worry scale
impulsve Impulsivity
thrillsk Thrill-seeking
carpentr Carpentry
forestr Forest ranger
morticin Mortician
policemn Police
fireman Fireman
salesrep Sales representative
teacher Teacher
busexec Business executive
stockbrk Stock broker

IPMMc 7
artist Artist
socworkr Social worker
truckdvr Truck driver
doctor Doctor
clergymn Clergyman
lawyer Lawyer
actor Actor
archtct Architect
landscpr Landscaper
Source
http://psych.colorado.edu/~carey/Courses/PSYC7291/ClassDataSets.htm
IPMMc Inventory of Personality and Mood Manifestation
Description
The IPMMc data frame has 6 rows and 5 columns. See Davison and Davenport (2002) for moreinformation.
Format
This data frame contains the following columns:
A Anxiety
H Hypochondriasis
S Schizophrenia
B Bipolar Disorder
R The Neurotic versus Psychotic Criterion Variable, where Neurotic (= 1) or Psychotic (= 0)
Source
Davison, M. L., & Davenport, E. C. (2002). Identifying criterion-related patterns of predictor scoresusing multiple regression. Psychological Methods, 7(4), 468-484.
References
Davison, M. L., & Davenport, E. C. (2002). Identifying criterion-related patterns of predictor scoresusing multiple regression. Psychological Methods, 7(4), 468-484.

8 mod_data
leisure Leisure Activity Rankings
Description
The leisure dataset includes leisure activity rankings for three different groups: politicians, admin-istrators, and belly-dancers. Rankings are provided in four categories: Reading, Dancing, WatchingTV, and Skiing. See Tabachnik and Fidell (1996) for more details.
Source
Tabachnick, B. G., & Fidell, L. S. (1996). Using multivariate statistics (3rd ed.). New York: HarperCollins.
Examples
## Not run:data(leisure)
## End(Not run)
mod_data Moderated profile analysis dummy data
Description
Randomly generated data to test the mpa function.
Format
This data frame contains the following columns:
dv Dependent variable
pred1 Predictor variable 1
pred2 Predictor variable 2
mod The moderator variable
Source
This data set was randomly generated to demonstrate how to use the mpa function.
See Also
mpa

mpa 9
mpa Moderated Profile Analysis
Description
Implements the moderated profile analysis approach developed by Davison & Davenport (unpub-lished)
Usage
mpa(formula, data, moderator, k = 100, na.action = "na.fail")
Arguments
formula An object of class formula of the form response ~ terms.
data An optional data frame, list or environment containing the variables in the model.
moderator Name of the moderator variable.
k Corresponds to the scalar constant and must be greater than 0. Defaults to 100.
na.action How should missing data be handled? Function defaults to failing if missingdata are present.
Details
The function returns the criterion-related moderated profile analysis described in Davison & Dav-enport (unpublished). Missing data are presently handled by specifying na.action = "na.omit",which performs listwise deletion and na.action = "na.fail", the default, which causes thefunction to fail. The following S3 generic functions are not yet available but will be in future im-plementations. summary(),anova(), print(), and plot(). These functions provide a summary ofthe analysis (namely, R2 and the level and pattern components); perform ANOVA of the R2 for thepattern, the level, and the overall model; provide output similar to lm(), and plots the pattern effect.WORKS ONLY WITH TWO GROUPS!
Value
A list containing the following components:
• call - The model call
• output - The output from the moderated criterion-related profile analysis
• f.table - The corrected F-table for assessing differences in patterns.
• moder.model - The standard moderated regression model
References
Davison, M., & Davenport, E. (unpublished). Comparing Criterion-Related Patterns of PredictorVariables across Populations Using Moderated Regression.
10 pams
See Also
cpa
Examples
## Not run:data(mod_data)mod <- mpa(gpa ~ satv * major + satq * major, moderator = "major", data = bacc2001)summary(mod$output)mod$f.tablesummary(mod$moder.model)
## End(Not run)
nutrient USDA Women’s Health Survey
Description
In 1985, the United States Department of Agriculture (USDA) commissioned a study of women’snutrition. Nutrient intake was measured for a random sample of 737 women aged 25-50 years. Fivenutritional components were measured: calcium, iron, protein, vitamin A and vitamin C.
Format
calcium Calcium amount
iron Iron amount
protein Protein amount
a Vitamin A amount
c Vitamin C amount
pams Profile Analysis via Multidimensional Scaling
Description
The pams function implements profile analysis via multidimensional scaling as described by Davi-son, Davenport, and Bielinski (1995) and Davenport, Ding, and Davison (1995).
Usage
pams(data, dim)

paos 11
Arguments
data A data matrix or data frame; rows represent individuals, columns representscores; missing scores are not allowed.
dim Number of dimensions to be extracted from the data.
Details
The pams function computes similarity/dissimilarity indices based on Euclidean distances betweenthe scores provided in the data, and then extracts dimensional coordinates for each score usingmultidimensional scaling. A weight matrix, level parameters, and fit measures are computed foreach subject in the data.
Value
• dimensional.configuration - A matrix that provides prototypical profiles of dimensionsextracted from the data.
• weights.matrix - A matrix that includes the subject correspondence weights for all dimen-sions, level parameters, and the subject fit measure which is the proportion of variance in thesubject’s actual profiles accounted for by the prototypical profiles.
References
Davenport, E. C., Ding, S., & Davison, M. L. (1995). PAMS: SAS Template.
Davison, M. L., Davenport, E. C., & Bielinski, J. (1995). PAMS: SPSS Template.
See Also
cpa, pr
Examples
## Not run:data(PS)result <- pams(PS[,2:4], dim=2)result
## End(Not run)
paos Profile Analysis for One Sample with Hotelling’s T-Square
Description
The paos function implements profile analysis for one sample using Hotelling’s T-square.
Usage
paos(data, scale = TRUE)

12 pbg
Arguments
data A data matrix or data frame; rows represent individuals, columns represent vari-ables.
scale If TRUE (default), variables are standardized by dividing their standard devia-tions.
Details
The paos function runs profile analysis for one sample based on the Hotelling’s T-square test andtests the two htypothesis. First, the null hypothesis that all the ratios of the variables in the data areequal to 1. After rejecting the first hypothesis, a secondary null hypothesis that all of the ratios ofthe variables in the data equal to one another (not necessarily equal to 1) is tested.
Value
A summary table is returned, listing the following two hypothesis:
• Hypothesis 1 - Ratios of the means of the variables over the hypothesized mean are equal to1.
• Hypothesis 2 - All of the ratios are equal to each other.
See Also
cpa, pr
Examples
## Not run:data(nutrient)paos(nutrient, scale=TRUE)
## End(Not run)
pbg Profile Analysis by Group: Testing Parallelism, Equal Levels, andFlatness
Description
The pbg function implements three hypothesis tests. These tests are whether the profiles are parallel,have equal levels, and are flat across groups defined by the grouping variable. If parallelism isrejected, the other two tests are not necessary. In that case, flatness may be assessed within eachgroup, and various within- and between-group contrasts may be analyzed.
Usage
pbg(data, group, original.names = FALSE, profile.plot = FALSE)
pcv 13
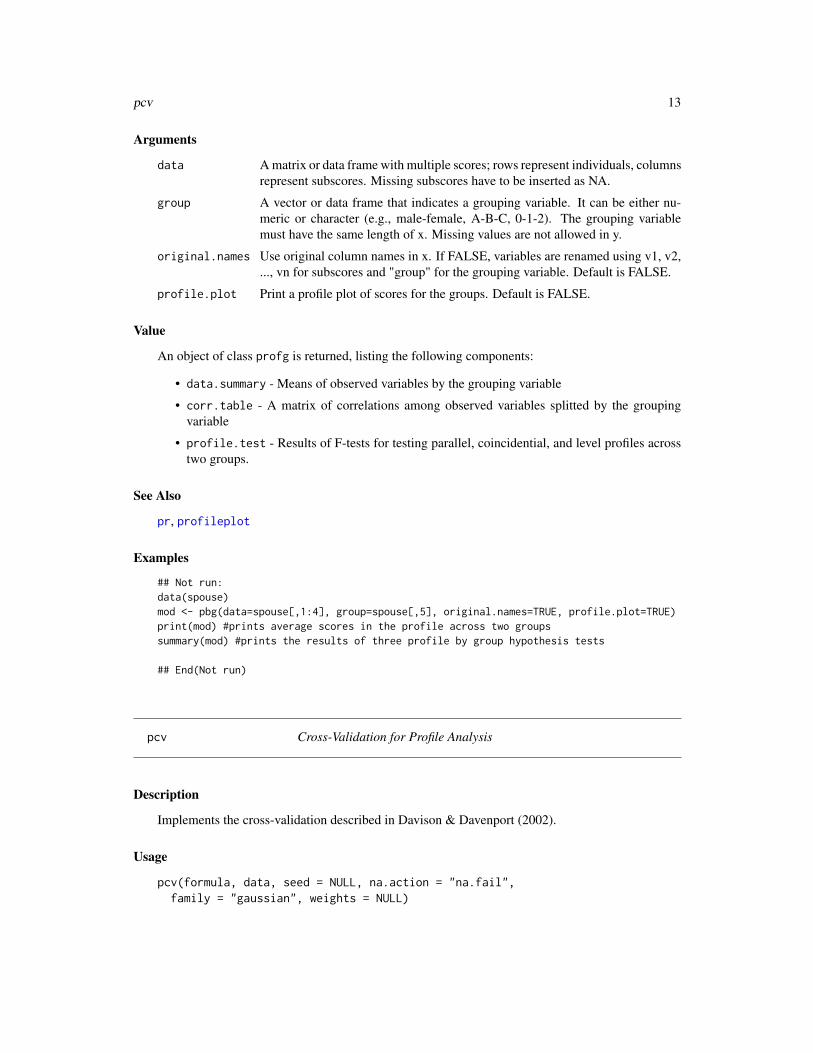
Arguments
data A matrix or data frame with multiple scores; rows represent individuals, columnsrepresent subscores. Missing subscores have to be inserted as NA.
group A vector or data frame that indicates a grouping variable. It can be either nu-meric or character (e.g., male-female, A-B-C, 0-1-2). The grouping variablemust have the same length of x. Missing values are not allowed in y.
original.names Use original column names in x. If FALSE, variables are renamed using v1, v2,..., vn for subscores and "group" for the grouping variable. Default is FALSE.
profile.plot Print a profile plot of scores for the groups. Default is FALSE.
Value
An object of class profg is returned, listing the following components:
• data.summary - Means of observed variables by the grouping variable
• corr.table - A matrix of correlations among observed variables splitted by the groupingvariable
• profile.test - Results of F-tests for testing parallel, coincidential, and level profiles acrosstwo groups.
See Also
pr, profileplot
Examples
## Not run:data(spouse)mod <- pbg(data=spouse[,1:4], group=spouse[,5], original.names=TRUE, profile.plot=TRUE)print(mod) #prints average scores in the profile across two groupssummary(mod) #prints the results of three profile by group hypothesis tests
## End(Not run)
pcv Cross-Validation for Profile Analysis
Description
Implements the cross-validation described in Davison & Davenport (2002).
Usage
pcv(formula, data, seed = NULL, na.action = "na.fail",family = "gaussian", weights = NULL)

14 pcv
Arguments
formula An object of class formula of the form response ~ terms.
data An optional data frame, list or environment containing the variables in the model.
seed Should a seed be set? Function defaults to a random seed.
na.action How should missing data be handled? Function defaults to failing if missingdata are present.
family A description of the error distribution and link function to be used in the model.See family.
weights An option vector of weights to be used in the fitting process.
Details
The pcv function requires two arguments: criterion and predictor. The criterion corresonds tothe dependent variable and the predictor corresponds to the matrix of predictor variables. Thefunction performs the cross-validation technique described in Davison & Davenport (2002) andan object of class critpat is returned. There the following s3 generic functions are available:summary(),anova(), print(), and plot(). These functions provide a summary of the cross-validation (namely, R2); performs ANOVA of the R2 based on the split for the level, pattern, andoverall; provide output similar to lm(); and plot the estimated parameters for the random split.Missing data are presently handled by specifying na.action = "na.omit", which performs list-wise deletion and na.action = "na.fail", the default, which causes the function to fail. A seedmay also be set for reproducibility by setting the seed.
Value
An object of class critpat is returned, listing the f ollowing components:
• R2.full, test of the null hypothesis that R2 = 0
• R2.pat, test that the R2_pattern = 0
• R2.level, test that the R2_level = 0
• R2.full.lvl, test that the R2_full = R2_level = 0
• R2.full.pat, test that the R2_full = R2_pattern = 0
References
Davison, M., & Davenport, E. (2002). Identifying criterion-related patterns of predictor scores usingmultiple regression. Psychological Methods, 7(4), 468-484. DOI: 10.1037/1082-989X.7.4.468.
See Also
cpa,print.critpat,summary.critpat,anova.critpat,plot.critpat

plot.critpat 15
plot.critpat Plot criterion-related profile
Description
Plots the criterion-related level and pattern profiles for each observation
Usage
## S3 method for class 'critpat'plot(x, ...)
Arguments
x critpat object resulting from cpa
... additional arguments affecting the plot produced.
See Also
cpa
plot.prof Plots a pattern and level reliability
Description
Plots the pattern vs. level reliability returned from the pr function of class prof.
Usage
## S3 method for class 'prof'plot(x, ...)
Arguments
x an object returned from the pr function
... additional objects of the same type.
See Also
pr

16 pr
pr Pattern and Level Reliability via Profile Analysis
Description
The pr function uses subscores from two parallel test forms and computes profile reliability coeffi-cients as described in Bulut (2013).
Usage
pr(form1, form2)
Arguments
form1, form2 Two data matrices or data frames; rows represent individuals, columns representsubscores. Both forms should have the same individuals and subscores in thesame order. Missing subscores have to be inserted as NA.
Details
Profile pattern and level reliability coefficients are based on the profile analysis approach describedin Davison and Davenport (2002) and Bulut (2013). Using the parallel test forms or multiple ad-ministration of the same test form, pattern and level reliability coefficients are computed. Patternreliability is an indicator of variability between the subscores of an examinee and the level reliabilityis an indicator of the average subscore variation among all examinees. For details, see Bulut(2013)
Value
An object of class prof is returned, listing the following components:
• reliability - Within-in person, between-person, and overall subscore reliability
• pattern.level - A matrix of all pattern and level values obtained from the subscores
References
Bulut, O. (2013). Between-person and within-person subscore reliability: Comparison of unidi-mensional and multidimensional IRT models. (Doctoral dissertation). University of Minnesota.University of Minnesota, Minneapolis, MN. (AAT 3589000).
Davison, M. L., & Davenport, E. C. (2002). Identifying criterion-related patterns of predictorscores using multiple regression. Psychological Methods, 7(4), 468-484. DOI: 10.1037/1082-989X.7.4.468
See Also
plot.prof

print.critpat 17
Examples
## Not run:data(EEGS)result <- pr(EEGS[,c(1,3,5)],EEGS[,c(2,4,6)])print(result)plot(result)## End(Not run)
print.critpat Print a criterion-related profile analysis
Description
Prints the default output from fitting the cpa function.
Usage
## S3 method for class 'critpat'print(x, ...)
Arguments
x object of class critpat returned from the cpa function
... additional objects of the same type.
See Also
cpa
profileplot Score Profile Plot
Description
The profileplot function creates a profile plot for a matrix or dataframe with multiple scores orsubscores using ggplot function in ggplot2 package.
Usage
profileplot(form, person.id, standardize = TRUE, interval = 10,by.pattern = TRUE, original.names = TRUE)

18 PS
Arguments
form A matrix or dataframe including two or more subscores.
person.id A vector that includes person ID values (Optional).
standardize If not FALSE, all scores are rescaled with a mean of 0 and standard deviation of1. Default is TRUE.
interval The number of equal intervals from the mimimum score to the meximum score.Default is 10. Ignored when by.pattern=FALSE.
by.pattern If TRUE, the function creates a profile plot with level and pattern values usingggplot2. Otherwise, the function creates a profile plot showing profile scores ofpersons using the base graphics in R. Default is TRUE.
original.names Use the original column names in the data. Otherwise, columns are renamed asv1,v2,.... Default is TRUE.
Value
The profileplot functions returns a score profile plot from either ggplot or the base graphics inR.
See Also
ggplot, PS
Examples
## Not run:data(PS)myplot <- profileplot(PS[,2:4], person.id = PS$Person,by.pattern = TRUE, original.names = TRUE)myplot
data(leisure)leis.plot <- profileplot(leisure[,2:4],standardize=TRUE,by.pattern=FALSE)leis.plot
## End(Not run)
PS A Hypothetical Personality Scale from Davison, Kim, and Close(2009)
Description
The PS shows score profiles of six respondents to a hypothetical personality scale. It includes threetypes of profile patterns: Linearly increasing, inverted V, and linearly decreasing.

spouse 19
Format
Person Person IDNEU Neurotic scale scorePSY Psychotic scale scoreCD Character disorder scale score
Source
Davison, M. L., Kim, S-K., & Close, C. W. (2009). Factor analytic modeling of within personvariation in score profiles. Multivariate Behavioral Research, 44, 668-87.
References
Davison, M. L., Kim, S-K., & Close, C. W. (2009). Factor analytic modeling of within personvariation in score profiles. Multivariate Behavioral Research, 44, 668-87.
spouse Love and Marriage Survey for Spouses
Description
The spouse data come from a study of love and marriage. A sample of 30 husbands and their wiveswere asked to respond to the following questions:
• Question 1: What is the level of passionate love you feel for your partner?• Question 2: What is the level of passionate love that your partner feels for you?• Question 3: What is the level of companionate love that you feel for your partner?• Question 4: What is the level of companionate love that your partner feels for you?
The responses to all four questions are on a five-point Likert scale where 1 indicates "none at all"and 5 indicates "tremendous amount".
Format
item1 Question 1 with a score ranging from 1 to 5.item2 Question 2 with a score ranging from 1 to 5.item3 Question 3 with a score ranging from 1 to 5.item4 Question 4 with a score ranging from 1 to 5.spouse Spouse type. It is either "Husband" or "Wife"
Examples
## Not run:data(spouse)
## End(Not run)

20 wprifm
summary.critpat Summary of criterion-related profile analysis
Description
Provides a summary of the criterion-related profile analysis
Usage
## S3 method for class 'critpat'summary(object, ...)
Arguments
object object of class critpat
... additional arguments affecting the summary produced.
See Also
cpa
wprifm Within-Person Random Intercept Factor Model
Description
Within-Person Random Intercept Factor Model
Usage
wprifm(data, scale = FALSE, save_model = FALSE)
Arguments
data Data.frame containing the manifest variables.
scale Should the data be scaled? Default = FALSE
save_model Should the temporary lavaan model syntax be saved. Default = FALSE
Details
This function performs the within-person random intercept factor model described in Davison, Kim,and Close (2009). For information about this model, please see this reference. This function returnsan object of lavaan class and thus any generics defined for lavaan will work on this object. Thisfunction provides a simple wrapper for lavaan.

wprifm 21
Value
an object of class lavaan
References
Davison, M., Kim, S.-K., Close, C. (2009). Factor analytic modeling of within person variation inscore profiles. Multivariate Behavioral Research, 44(5), 668 - 687. DOI: 10.1080/00273170903187665
Examples
data <- HolzingerSwineford1939[,7:ncol(HolzingerSwineford1939)]wprifm(data, scale = TRUE)

Index
∗Topic datasetsEEGS, 5IPMMc, 7leisure, 8mod_data, 8nutrient, 10PS, 18spouse, 19
∗Topic datasetbacc2001, 3interest, 6
∗Topic methodspcv, 13pr, 16
∗Topic methodcpa, 4mpa, 9
∗Topic packageprofileR-package, 2
anova.critpat, 3, 14
bacc2001, 3
cpa, 3, 4, 10–12, 14, 15, 17, 20
EEGS, 5
family, 4, 14formula, 4, 9, 14
ggplot, 17, 18
interest, 6IPMMc, 7
leisure, 8
mod_data, 8mpa, 8, 9
nutrient, 10
pams, 10paos, 11pbg, 12pcv, 5, 13plot.critpat, 14, 15plot.prof, 15, 16pr, 11–13, 15, 16print.critpat, 14, 17profileplot, 13, 17profileR-package, 2PS, 18, 18
spouse, 19summary.critpat, 14, 20
wprifm, 20
22