Embed Size (px)
Citation preview
1
Summary Report
Paediatric Intensive Care Audit Network
Annual Report 2020
Data collection period
January 2017–December 2019
2 PICANet 2020 annual summary report
Organisation key A Addenbrooke’s Hospital, Cambridge C Noah’s Ark Children’s Hospital for Wales, Cardiff D Royal Manchester Children’s Hospital E1 Great Ormond Street Hospital, London (PICU/NICU) E2 Great Ormond Street Hospital, London (CICU) F Evelina London Children’s Hospital H King’s College Hospital, London I Leeds General Infirmary K2 Freeman Hospital, Newcastle upon Tyne K3 Great North Children’s Hospital, Newcastle upon Tyne L Royal Stoke University Hospital M Nottingham Children’s Hospital, Queens Medical Centre, Nottingham N John Radcliffe Hospital, Oxford O Royal Brompton Hospital, London P Alder Hey Children’s Hospital, Liverpool Q Sheffield Children’s Hospital R Southampton Children’s Hospital S James Cook University Hospital, Middlesbrough T St George’s Hospital, London U St Mary’s Hospital, London V Birmingham Children’s Hospital W Bristol Royal Hospital for Children X1 Glenfield Hospital, Leicester X2 Leicester Royal Infirmary Y Royal Hospital for Sick Children, Edinburgh Z The Royal London Hospital ZA Royal Hospital for Children, Glasgow ZB Royal Belfast Hospital for Sick Children ZC Children’s Health Ireland at Crumlin, Dublin (formerly Our Lady’s Children’s Hospital, Crumlin) ZD Children’s Health Ireland at Temple Street, Dublin (formerly Temple Street Children’s University Hospital) ZE Harley Street Clinic, London ZF The Portland Hospital, London T001 Children’s Acute Transport Service (CATS) T002 Embrace: Yorkshire & Humber Infant & Children’s Transport Service T003 North West and North Wales Paediatric Transport Service (NWTS) T004 South Thames Retrieval Service (STRS) T005 KIDS Intensive Care and Decision Support T008 Southampton Oxford Retrieval Team (SORT) T010 Northern Ireland Specialist Transport and Retrieval (NISTAR) Paediatric T020 Scotland Specialist Transport and Retrieval (ScotSTAR) T022 Irish Paediatric Acute Transport Service (IPATS) T024 Wales and West Acute Transport for Children (WATCh) T026 North East Children’s Transport and Retrieval Service (NECTAR) T027 Children’s Medical Emergency Transport Service (CoMET) T028 Heartlink ECMO Children’s Service
Published in the UK by the Paediatric Intensive Care Audit Network (PICANet). This work is copyright. Apart from
any use as permitted under the Copyright, Designs and Patents Act 1988, no part may be reproduced by any
process without permission from PICANet.
Requests and enquiries concerning reproduction rights should be directed to PICANet at:
PICANet, School of Medicine, University of Leeds, Clarendon Way, Leeds, LS2 9JT
Telephone 0113 343 8125 Email [email protected]
In all cases, PICANet must be acknowledged as the source when reproducing or quoting any part of this
publication. Please use the following format when citing this report: Paediatric Intensive Care Audit Network
Annual Report 2020 (published February 2021): Universities of Leeds and Leicester
For this report content is © 2021 University of Leeds, University of Leicester and the Healthcare Quality
Improvement Partnership.
The ISBN number for this publication is 978-0-85316-362-6.
3
Contents
Acknowledgements ................................................................................................................ 5
Introduction ............................................................................................................................ 7
Key findings ........................................................................................................................... 8
Recommendations ............................................................................................................... 11
How we present our results .................................................................................................. 13
Headline figures: Admission numbers and bed days ............................................................ 14
Headline figures: Admission rates by country of residence .................................................. 18
Headline figures: Death in PICU .......................................................................................... 20
Headline figures: Unplanned extubation............................................................................... 22
Headline figures: Referral for transport ................................................................................ 24
Headline figures: Bed occupancy during ‘normal hours’ and ‘out of hours’ ........................... 26
Metric 1: Case ascertainment and timeliness of data submission ......................................... 30
Metric 2: Retrieval mobilisation times ................................................................................... 36
Metric 3: Number of nurses providing clinical care per bed .................................................. 40
Metric 4: Emergency readmissions within 48 hours.............................................................. 42
Metric 5: Mortality in PICU ................................................................................................... 46
References .......................................................................................................................... 49
Additional information .......................................................................................................... 51
For the Tables, Figures and Appendices relating to this report, please visit the PICANet
website www.picanet.org.uk.

Acknowledgements 5
Acknowledgements The Paediatric Intensive Care Audit Network (PICANet) gathers information on all patients
admitted to paediatric intensive care units (PICUs) in the UK and Republic of Ireland, in
conjunction with centralised transport services (CTS).
We are indebted to the efforts of all the audit clerks, secretaries, nurses and doctors who
support and contribute to PICANet from their own PICUs and CTS. We are particularly
grateful for everyone’s support and contributions this year despite the significant challenges
of the Covid-19 pandemic over the past 12 months.
PICANet also continues to rely on the expertise and support from the Paediatric Critical Care
Society (PCCS), the PICANet Steering Group and members of the Clinical Advisory Group
who provide an essential link between PICANet and the clinical care teams. We would like to
acknowledge this support, which enables the PICANet audit to continue to be a success.
The PICANet Audit is commissioned by the Healthcare Quality Improvement Partnership
(HQIP) as part of the National Clinical Audit and Patient Outcomes Programme (NCAPOP),
the Welsh Health Specialised Services, NHS Lothian/National Services Division NHS
Scotland, the Royal Belfast Hospital for Sick Children, The National Office of Clinical Audit
(NOCA) for the Republic of Ireland and HCA Healthcare UK. HQIP is led by a consortium of
the Academy of Medical Royal Colleges, the Royal College of Nursing and National Voices.
Its aim is to promote quality improvement in patient outcomes, and in particular, to increase
the impact that clinical audit, outcome review programmes and registries have on healthcare
quality in England and Wales. HQIP holds the contract to commission, manage and develop
the NCAPOP, comprising around 40 projects covering care provided to people with a wide
range of medical, surgical and mental health conditions. The programme is funded by NHS
England, the Welsh Government and, with some individual projects, other devolved
administrations and crown dependencies.
http://www.hqip.org.uk/national-programmes

Introduction 7
Introduction This is the seventeenth annual PICANet clinical audit report documenting paediatric critical
care activity which occurred in the United Kingdom (UK) and Republic of Ireland (ROI)
between 2017 and 2019. This report forms part of PICANet’s contracted obligations,
providing key information to monitor the delivery and quality of care in relation to agreed
standards and evaluate clinical outcomes to inform national policy in paediatric critical care.
Information on five key metrics related to Paediatric Intensive Care services is provided: case
ascertainment including timeliness of data submission, retrieval mobilisation times, number
of qualified nurses per bed, emergency readmissions within 48 hours and mortality in PICU.
Whilst outlier analysis is only mandated for mortality, PICANet provides an additional
monitoring function for mortality within each unit through the availability of real-time ‘RSPRT’
plots. We encourage units to continue to use this functionality to monitor performance.
Although this Summary Report offers an overview of the key findings and recommendations,
readers are guided to the full set of tables and figures which have been released
simultaneously and comprehensively describe admissions, referrals and transport activity
within PICUs over the last three years. Individual tables and figures can be downloaded in
electronic form from the main PICANet website www.picanet.org.uk.
We also remain committed to the continued development of the PICANet web platform and
underlying database to enhance the user experience and to ensure that all key performance
data for units can be visualised through an online dashboard.
Professor Liz Draper
Dr Richard Feltbower,
Principal Investigators
8 PICANet 2020 annual summary report
Key findings ▪ The number of admissions per year to paediatric intensive care across the UK and
Republic of Ireland showed a slow and steady increase over the period 2017–2019
from 19,869 to 20,383. This increase was mainly driven by a 22% increase in
admissions in Scotland between 2017 (n=1390) and 2019 (n=1697) and a small
increase in English NHS units and in the Republic of Ireland. Numbers of admissions
in Wales and Northern Ireland remained steady.
▪ Units across the UK and ROI delivered on average around 142,000 bed days per
year between 2017–2019. There was a steady increase in bed days over the period
specifically in Wales, Scotland and the ROI.
▪ Admission rates to paediatric intensive care varied by country, ranging from 132 per
100,000 children in the Republic of Ireland to rates of 165 and 168 in Northern Ireland
and Scotland, respectively.
▪ The likelihood of dying whilst being treated within PICUs was very low throughout the
three-year period, with 96.5% of admissions discharged alive. Deaths within PICU
comprise around one in every six of all children’s deaths in the UK and one in every
five in the ROI.
▪ Annual rates of reported unplanned extubation varied between 3.7 and 5.0 for every
1,000 days of invasive ventilation throughout the reporting period. Two fifths of all
units reported a decrease in the number of unplanned extubations over the three
years 2017 to 2019.
▪ Over the period 2017 to 2019 specialist PIC transport services accepted 16,623
(92.3%) of referrals for urgent transfer to PIC. Rates of refusal ranged from 0% to
12.8% for those transport teams providing a 24 hour service.
▪ Once again, reported rates of bed occupancy remain high in PICUs. During the
PICANet staffing census week intensive care bed occupancy rates were 100% in
Scotland and over 80% in England (NHS), Wales, Northern Ireland and the Republic
of Ireland. High dependency bed occupancy ‘in normal hours’ was reported at 86% in
England (NHS) and lower rates were reported in the devolved nations and the
Republic of Ireland. ‘Out of hours’ bed occupancy was similarly high with reported
rates of 100% Intensive Care (IC) bed occupancy for Scotland, above 90% for
Northern Ireland and the Republic of Ireland and around 80% for Wales and England
(NHS). For high dependency (HD) care ‘out of hours’ bed occupancy was reported as
over 75% for England and Wales. Lower rates were reported for the other devolved
nations and the Republic of Ireland.
▪ At least 95% of admissions reported to PICANet from nine PICUs in 2019 were
confirmed after a validation exercise was undertaken, with six of these units reporting
more than 99% of cases.
▪ 85% of units across the UK and Republic of Ireland (excluding Northern Ireland)
provided complete and timely admissions’ data to PICANet within three months of
discharge. Nine units achieved completeness within three months for at least 98% of
their admissions. One unit completed fewer than 50% of their admission records
within this timescale.
▪ Of the 4,245 journeys carried out for children requiring urgent transport to a PICU,
just under three fifths (58.8%) were started within 30 minutes and three quarters
(76.5%) started within one hour of the decision being made. Just over 1 in 20
journeys (6.3%) started more than three hours after this decision.

Key findings 9
▪ One quarter of PICUs (25%) met the PICS standard for nursing staff of 7.01 WTEs
(whole time equivalents) when all staff providing clinical care (including non-
registered health care staff: Bands 2–4) are included. However, if recorded vacancies
were filled to unit nurse establishment figures half of PICUs (48%) would meet this
standard. Nevertheless, as in previous years, the annual PICANet census shows that
units ensure their staffing levels are appropriate for the number of children on the unit
and their care requirements.
▪ Overall rates of emergency readmission within 48 hours of discharge remained the
same across the reporting period, at around 1.7%. However, these ranged from 1.6%
in England and the Republic of Ireland to 2.1% in Northern Ireland.
▪ No negative statistical outliers were identified for mortality rates for any unit between
2017 and 2019.

Recommendations 11
Recommendations
1. Monitor bed occupancy levels in close liaison with commissioners and Operational
Delivery Networks (ODNs) to ensure adequate critical care beds are available to meet
demand.
Action: Paediatric Intensive Care Units (PICUs), commissioners and ODNs.
2. Review the timeliness and quality of their submission of data to PICANet, to ensure
compliance with the PICS standards.
Action: PICUs and Paediatric Intensive Care (PIC) Centralised Transport Services.
3. Investigate events where their retrieval mobilisation times do not meet the 30-minute
NHS England target and develop a strategy to ensure optimal compliance.
Action: PIC Centralised Transport Service teams.
4. Ensure adequate staff availability for the PIC Centralised Transport Service by reviewing
PICANet data with commissioners.
Action: PIC Centralised Transport Service teams and commissioners.
5. Review and improve national recruitment and retention initiatives of PIC nurses and the
use of non-registered health care staff to support qualified nurses in delivering clinical
care, to ensure that all PICUs have appropriate staffing levels.
Action: national nursing professional bodies, NHS Trusts and Health Boards and Health
Education bodies in the UK and RoI.
6. Ensure that the data collected to monitor unplanned extubation rates complies with the
agreed PICANet definition. PICUs with the lowest rates of unplanned extubations should
be encouraged to share examples of best practice to reduce variation between units.
Action: PICUs.
7. Work should be carried out to develop a more robust risk-adjustment score for in-PICU
mortality.
Action: Paediatric Critical Care Society-Study Group, PICU clinicians.

How we present our results 13
How we present our results Results are presented in tables and figures. In general, data are presented for children aged
0–15 years, however data are also presented in separate tables for patients who are 16
years and older and treated on PICU. Each specific measure of interest is explained in the
results and metrics sections of this report under the heading “What are we measuring?”
We look at a wide range of measures including the number of admissions, how many days
patients are in PICU, the types of treatments patients receive and clinical outcomes such as
death. We present data according to age, sex, country of admission, treating PICU as well as
country of residence and where the child is living.
Rates
We present certain information in the form of rates, enabling comparisons to be made
between countries even though the population size in each country is different. Rates are
usually presented as the number per 1,000 or per 100,000 of the relevant population.
When we want to compare two rates we divide one rate by the other, to get a relative rate.
For example, if we wanted to compare the admission rate in Scotland to that in England then
we would divide the Scottish admission rate by the English admission rate. If the two rates
were the same then the relative rate would be one. If the Scottish rate was higher than the
English rate then the relative rate would be greater than one. If the Scottish rate was lower
than the English rate then the relative rate would be less than one. This measure allows us to
talk about the Scottish rate in comparison (or relative) to the English rate.
Deaths
We measure how poorly children were at the point when they were admitted to PICU using
the Paediatric Index of Mortality 3 (PIM3)3. This takes into account many factors (such as
whether the child was admitted as an emergency and whether they needed help breathing)
to estimate how likely each child is of dying.
When comparing deaths in PICU, we calculate the risk-adjusted standardised mortality ratio
(SMR). This compares the number of deaths that have happened in a PICU and how many
deaths we expected to happen given how poorly children were when they were admitted to
PICU. We also use ‘funnel plots’ to compare individual PICUs in terms of mortality which is a
way of displaying and comparing the risk-adjusted SMR on the same graph. These plots tell
us what range of values we might expect to see for the SMR in each PICU, given that we
expect a certain amount of variation as these calculations are based on a very small number
of deaths. Further details on funnel plots and how to interpret them are provided in the
“Metric 5: Mortality in PICU” section.
14 PICANet 2020 annual summary report
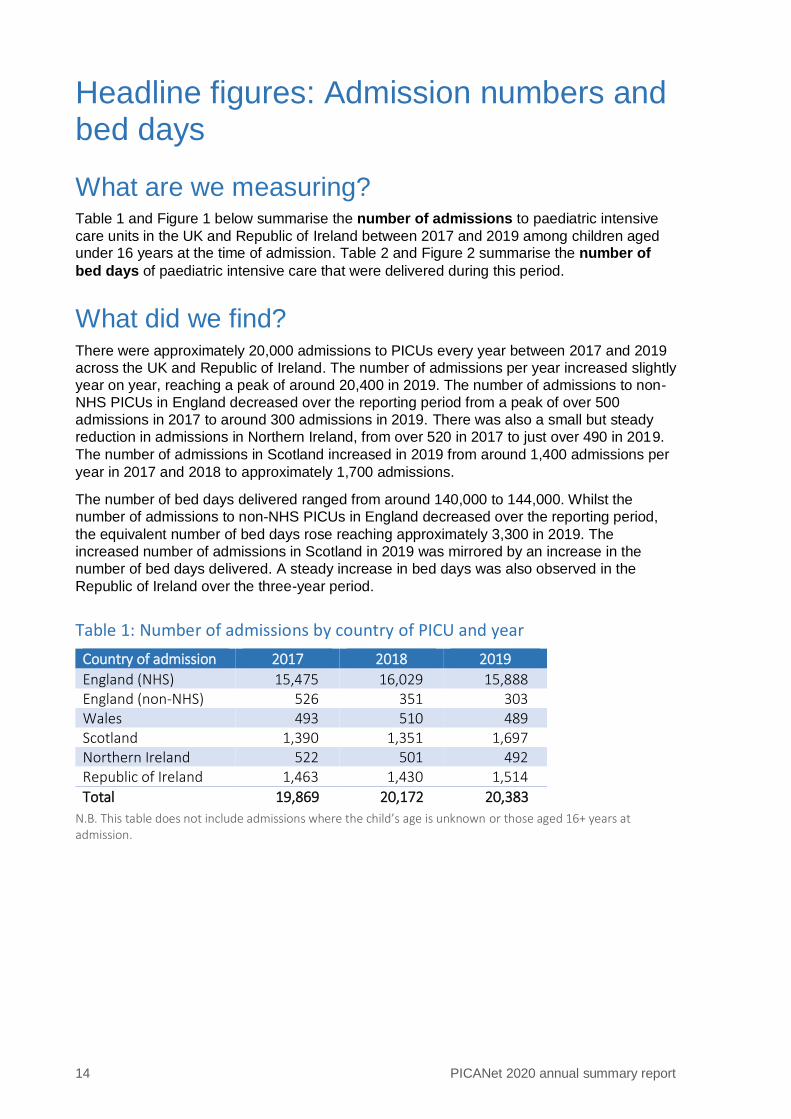
Headline figures: Admission numbers and bed days
What are we measuring? Table 1 and Figure 1 below summarise the number of admissions to paediatric intensive
care units in the UK and Republic of Ireland between 2017 and 2019 among children aged under 16 years at the time of admission. Table 2 and Figure 2 summarise the number of
bed days of paediatric intensive care that were delivered during this period.
What did we find? There were approximately 20,000 admissions to PICUs every year between 2017 and 2019
across the UK and Republic of Ireland. The number of admissions per year increased slightly
year on year, reaching a peak of around 20,400 in 2019. The number of admissions to non-
NHS PICUs in England decreased over the reporting period from a peak of over 500
admissions in 2017 to around 300 admissions in 2019. There was also a small but steady
reduction in admissions in Northern Ireland, from over 520 in 2017 to just over 490 in 2019.
The number of admissions in Scotland increased in 2019 from around 1,400 admissions per
year in 2017 and 2018 to approximately 1,700 admissions.
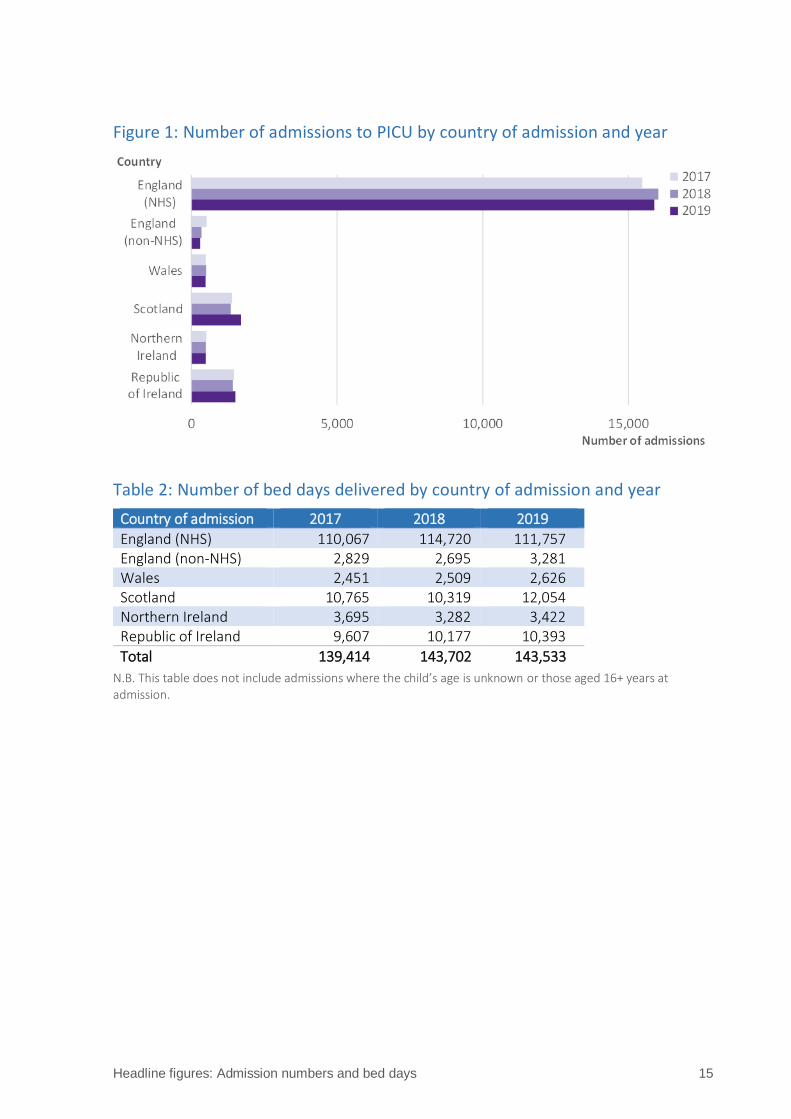
The number of bed days delivered ranged from around 140,000 to 144,000. Whilst the
number of admissions to non-NHS PICUs in England decreased over the reporting period,
the equivalent number of bed days rose reaching approximately 3,300 in 2019. The
increased number of admissions in Scotland in 2019 was mirrored by an increase in the
number of bed days delivered. A steady increase in bed days was also observed in the
Republic of Ireland over the three-year period.
Table 1: Number of admissions by country of PICU and year
Country of admission 2017 2018 2019
England (NHS) 15,475 16,029 15,888 England (non-NHS) 526 351 303 Wales 493 510 489 Scotland 1,390 1,351 1,697 Northern Ireland 522 501 492 Republic of Ireland 1,463 1,430 1,514
Total 19,869 20,172 20,383
N.B. This table does not include admissions where the child’s age is unknown or those aged 16+ years at admission.
Headline figures: Admission numbers and bed days 15
Figure 1: Number of admissions to PICU by country of admission and year
Table 2: Number of bed days delivered by country of admission and year
Country of admission 2017 2018 2019
England (NHS) 110,067 114,720 111,757 England (non-NHS) 2,829 2,695 3,281 Wales 2,451 2,509 2,626 Scotland 10,765 10,319 12,054 Northern Ireland 3,695 3,282 3,422 Republic of Ireland 9,607 10,177 10,393
Total 139,414 143,702 143,533
N.B. This table does not include admissions where the child’s age is unknown or those aged 16+ years at admission.
16 PICANet 2020 annual summary report
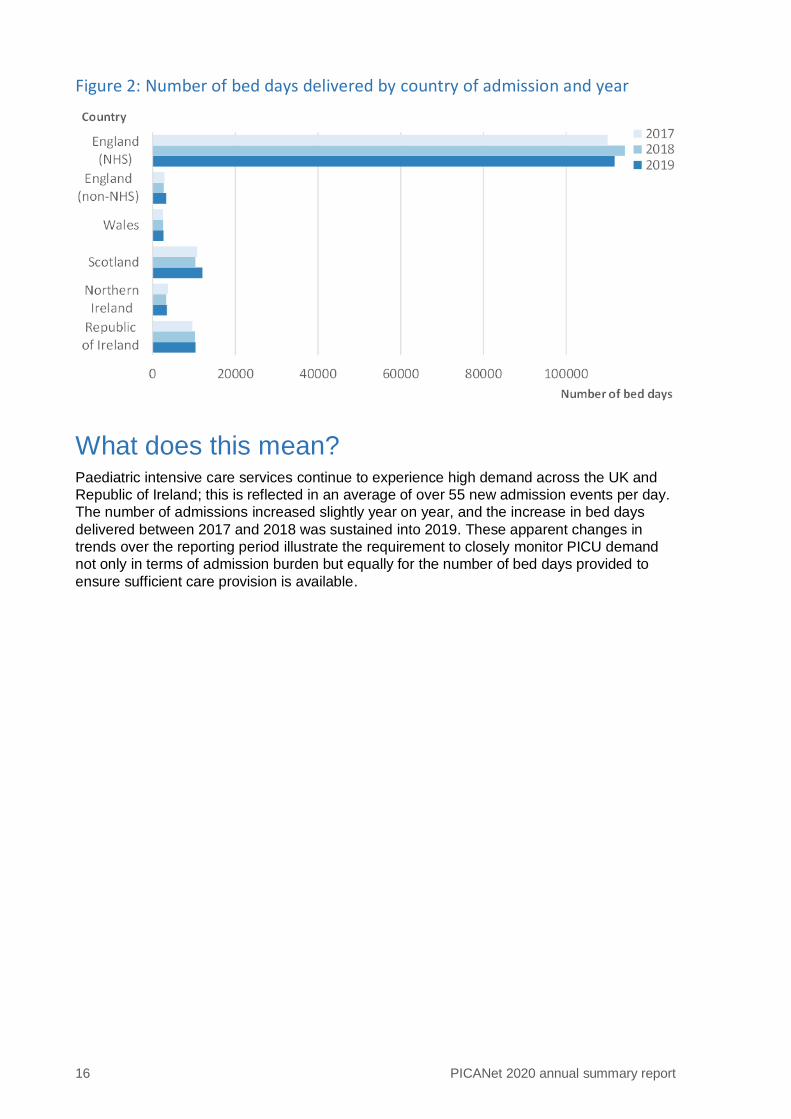
Figure 2: Number of bed days delivered by country of admission and year
What does this mean? Paediatric intensive care services continue to experience high demand across the UK and
Republic of Ireland; this is reflected in an average of over 55 new admission events per day.
The number of admissions increased slightly year on year, and the increase in bed days
delivered between 2017 and 2018 was sustained into 2019. These apparent changes in
trends over the reporting period illustrate the requirement to closely monitor PICU demand
not only in terms of admission burden but equally for the number of bed days provided to
ensure sufficient care provision is available.
Headline figures: Admission numbers and bed days 17
Further details
Definitions and methods
Every admission to a PICU in the UK and the Republic of Ireland is counted for each year,
2017–2019. If a child has been readmitted during that period this will be counted as a
separate admission. A ‘bed day’ is counted if a child is in a PICU bed for a day or part of a
day which occurs within the reporting period (i.e. between 1 January 2017 and 31 December
2019).
We have only provided figures for children less than 16 years old (the normal age limit for
admission to PICU). All designated PICUs across the UK and ROI provided data to PICANet
including the two private providers of PIC based in England up to the end of 2019.
Why is this important?
The number of admissions and the number of bed days tell us how busy the PICUs are and
helps the commissioners, who provide funding for paediatric intensive care, to work out how
many staff and beds are required to meet the demand. This is important, as too few beds
might mean that a child may not receive intensive care when they need it, or there may be a
delay. Although it is unlikely, if the commissioners overestimate demand, it is possible that
staff and beds would be under-utilised, which would be a waste of resources.
The data regarding PICU admissions and bed days delivered have been used by the recent
Paediatric Critical Care Review for England1.
18 PICANet 2020 annual summary report
Headline figures: Admission rates by country of residence
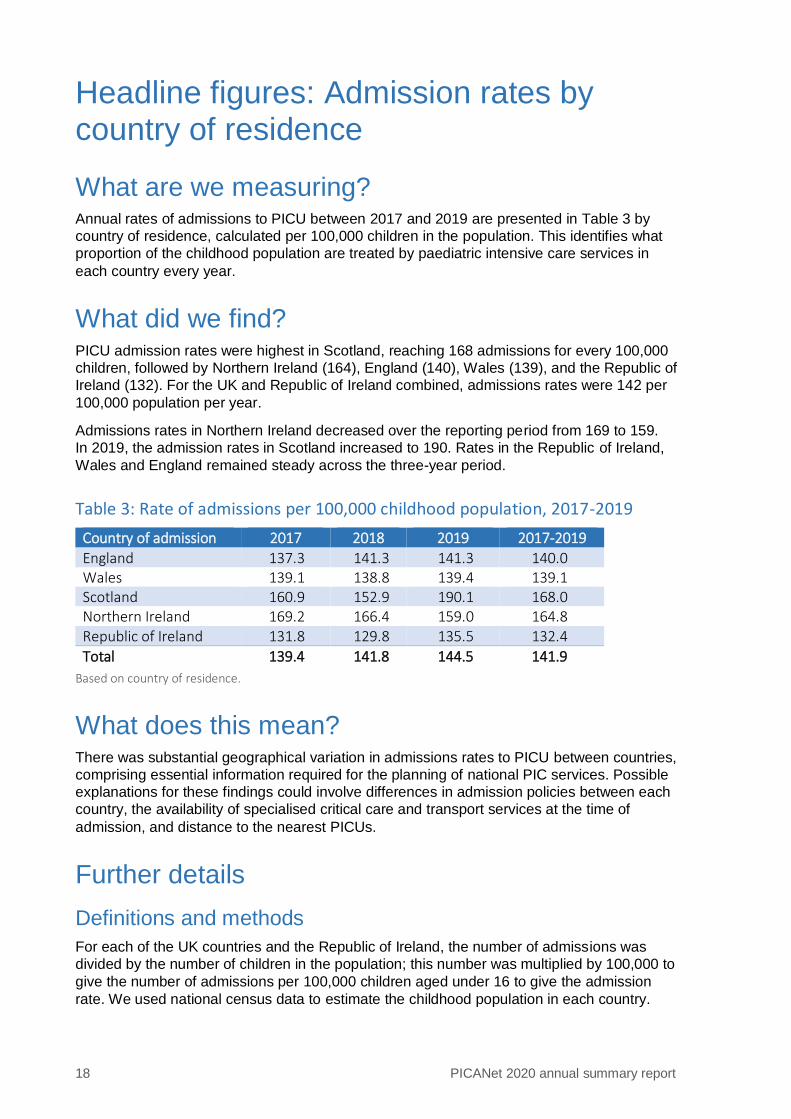
What are we measuring? Annual rates of admissions to PICU between 2017 and 2019 are presented in Table 3 by
country of residence, calculated per 100,000 children in the population. This identifies what
proportion of the childhood population are treated by paediatric intensive care services in
each country every year.
What did we find? PICU admission rates were highest in Scotland, reaching 168 admissions for every 100,000
children, followed by Northern Ireland (164), England (140), Wales (139), and the Republic of
Ireland (132). For the UK and Republic of Ireland combined, admissions rates were 142 per
100,000 population per year.
Admissions rates in Northern Ireland decreased over the reporting period from 169 to 159.
In 2019, the admission rates in Scotland increased to 190. Rates in the Republic of Ireland,
Wales and England remained steady across the three-year period.
Table 3: Rate of admissions per 100,000 childhood population, 2017-2019
Country of admission 2017 2018 2019 2017-2019
England 137.3 141.3 141.3 140.0 Wales 139.1 138.8 139.4 139.1 Scotland 160.9 152.9 190.1 168.0 Northern Ireland 169.2 166.4 159.0 164.8 Republic of Ireland 131.8 129.8 135.5 132.4
Total 139.4 141.8 144.5 141.9
Based on country of residence.
What does this mean? There was substantial geographical variation in admissions rates to PICU between countries,
comprising essential information required for the planning of national PIC services. Possible
explanations for these findings could involve differences in admission policies between each
country, the availability of specialised critical care and transport services at the time of
admission, and distance to the nearest PICUs.
Further details
Definitions and methods
For each of the UK countries and the Republic of Ireland, the number of admissions was
divided by the number of children in the population; this number was multiplied by 100,000 to
give the number of admissions per 100,000 children aged under 16 to give the admission
rate. We used national census data to estimate the childhood population in each country.
Headline figures: Admission rates by country of residence 19
Why is this important?
It is important for each country participating in PICANet to know the rate of admission to
paediatric intensive care to allow them to plan services effectively. The variation in admission
rates could be investigated to understand if these are real geographical differences (e.g.
proximity to PICU, level of urbanicity) or explained by differences in clinical practise or
commissioning in the populations for each nation.
20 PICANet 2020 annual summary report
Headline figures: Death in PICU
What are we measuring? All deaths that occur after admission but prior to discharge from PICU are recorded and
reported here for children under 16 who were admitted between 2017 and 2019. Deaths are
presented based on the country of admission (i.e. PICU location) as deaths must be
registered in the country where the person died.
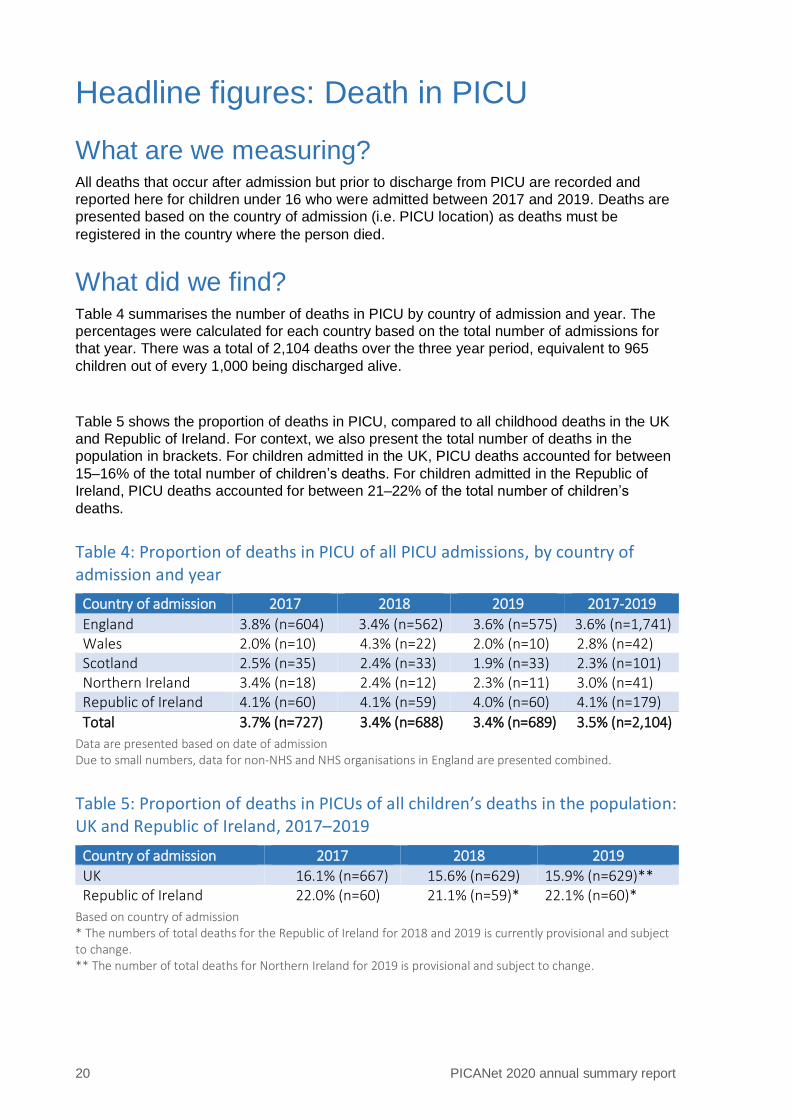
What did we find? Table 4 summarises the number of deaths in PICU by country of admission and year. The
percentages were calculated for each country based on the total number of admissions for
that year. There was a total of 2,104 deaths over the three year period, equivalent to 965
children out of every 1,000 being discharged alive.
Table 5 shows the proportion of deaths in PICU, compared to all childhood deaths in the UK
and Republic of Ireland. For context, we also present the total number of deaths in the
population in brackets. For children admitted in the UK, PICU deaths accounted for between
15–16% of the total number of children’s deaths. For children admitted in the Republic of
Ireland, PICU deaths accounted for between 21–22% of the total number of children’s
deaths.
Table 4: Proportion of deaths in PICU of all PICU admissions, by country of admission and year
Country of admission 2017 2018 2019 2017-2019
England 3.8% (n=604) 3.4% (n=562) 3.6% (n=575) 3.6% (n=1,741) Wales 2.0% (n=10) 4.3% (n=22) 2.0% (n=10) 2.8% (n=42) Scotland 2.5% (n=35) 2.4% (n=33) 1.9% (n=33) 2.3% (n=101) Northern Ireland 3.4% (n=18) 2.4% (n=12) 2.3% (n=11) 3.0% (n=41) Republic of Ireland 4.1% (n=60) 4.1% (n=59) 4.0% (n=60) 4.1% (n=179)
Total 3.7% (n=727) 3.4% (n=688) 3.4% (n=689) 3.5% (n=2,104)
Data are presented based on date of admission Due to small numbers, data for non-NHS and NHS organisations in England are presented combined.
Table 5: Proportion of deaths in PICUs of all children’s deaths in the population: UK and Republic of Ireland, 2017–2019
Country of admission 2017 2018 2019
UK 16.1% (n=667) 15.6% (n=629) 15.9% (n=629)** Republic of Ireland 22.0% (n=60) 21.1% (n=59)* 22.1% (n=60)*
Based on country of admission * The numbers of total deaths for the Republic of Ireland for 2018 and 2019 is currently provisional and subject to change. ** The number of total deaths for Northern Ireland for 2019 is provisional and subject to change.
Headline figures: Death in PICU 21
What does this mean? Risk of death in paediatric intensive care is low with 96.5% of patients being discharged alive
between 2017 and 2019. Deaths in PICU account for about one in every six of all children’s
deaths in the UK and about one in every five children’s deaths in the Republic of Ireland in
any given year.
Further details
Definitions and methods
We have recorded the number of deaths in PIC by year and by country of admission for 2017
to 2019. The percentages in Table 4 are based on the number of admissions to PICUs over
this period, not the number of individual children (i.e. if the same child had two admissions in
the same time period, this would count as two admissions). In Table 5, we present deaths on PICUs (2017–2019) as a proportion of all child deaths (0–15 years) in the UK and the
Republic of Ireland.
Why is this important?
Death on PICU is rare and the rate of PICU death has fallen steadily since PICANet started
collecting data in 2002. It is important to record the number of deaths to facilitate the
investigation of mortality trends over time. It also highlights any differences in death rates
between countries. Where there are very small numbers of deaths, caution should be applied
when making comparisons as apparently large differences may happen by chance.
22 PICANet 2020 annual summary report
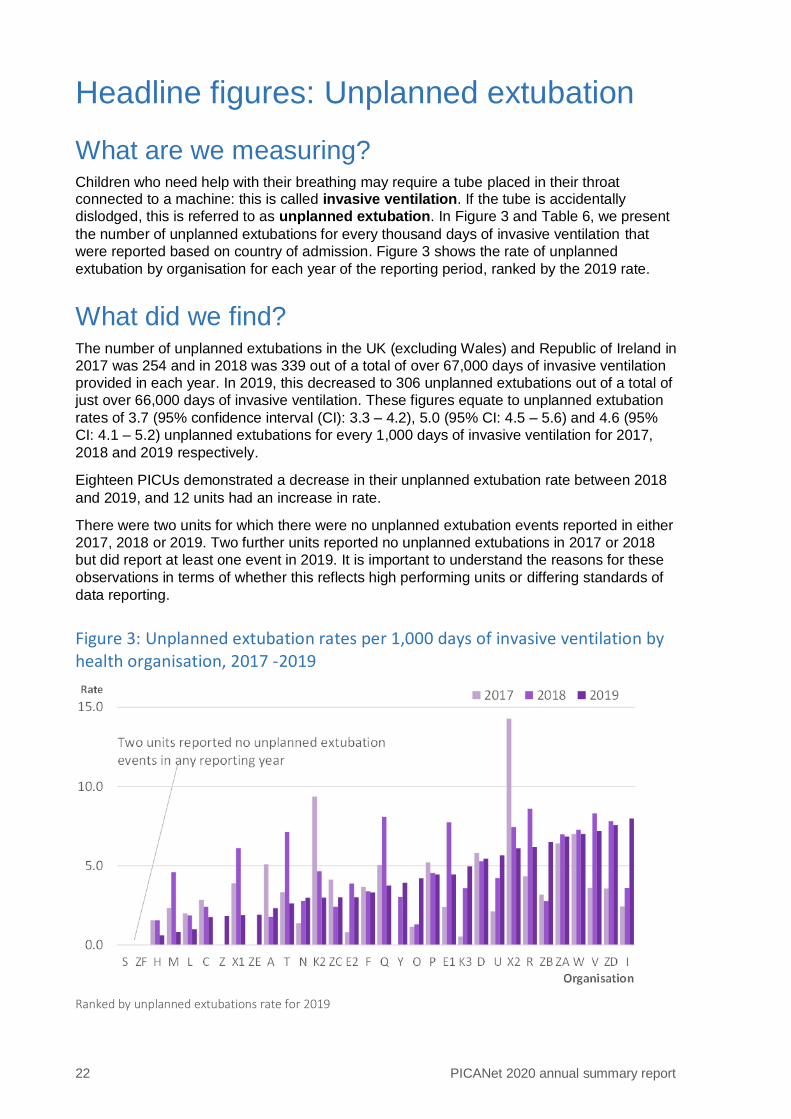
Headline figures: Unplanned extubation
What are we measuring? Children who need help with their breathing may require a tube placed in their throat connected to a machine: this is called invasive ventilation. If the tube is accidentally
dislodged, this is referred to as unplanned extubation. In Figure 3 and Table 6, we present
the number of unplanned extubations for every thousand days of invasive ventilation that
were reported based on country of admission. Figure 3 shows the rate of unplanned
extubation by organisation for each year of the reporting period, ranked by the 2019 rate.
What did we find? The number of unplanned extubations in the UK (excluding Wales) and Republic of Ireland in
2017 was 254 and in 2018 was 339 out of a total of over 67,000 days of invasive ventilation
provided in each year. In 2019, this decreased to 306 unplanned extubations out of a total of
just over 66,000 days of invasive ventilation. These figures equate to unplanned extubation
rates of 3.7 (95% confidence interval (CI): 3.3 – 4.2), 5.0 (95% CI: 4.5 – 5.6) and 4.6 (95%
CI: 4.1 – 5.2) unplanned extubations for every 1,000 days of invasive ventilation for 2017,
2018 and 2019 respectively.
Eighteen PICUs demonstrated a decrease in their unplanned extubation rate between 2018
and 2019, and 12 units had an increase in rate.
There were two units for which there were no unplanned extubation events reported in either
2017, 2018 or 2019. Two further units reported no unplanned extubations in 2017 or 2018
but did report at least one event in 2019. It is important to understand the reasons for these
observations in terms of whether this reflects high performing units or differing standards of
data reporting.
Figure 3: Unplanned extubation rates per 1,000 days of invasive ventilation by health organisation, 2017 -2019
Ranked by unplanned extubations rate for 2019
Headline figures: Unplanned extubation 23
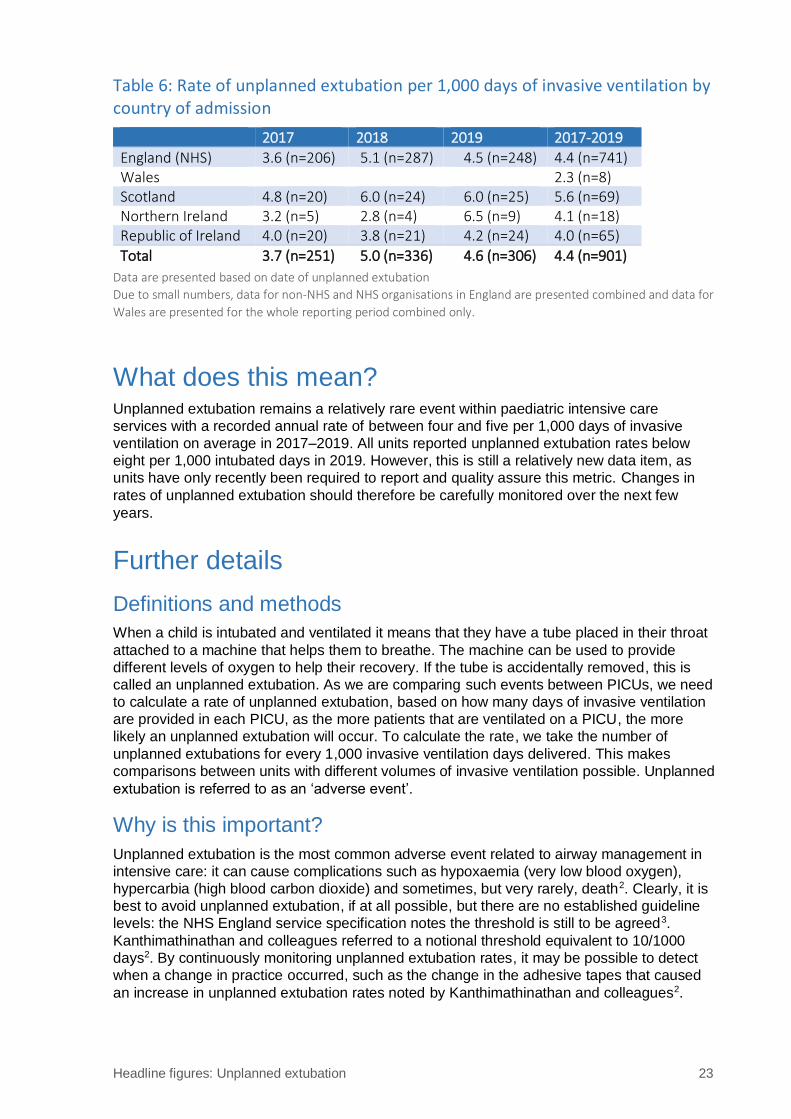
Table 6: Rate of unplanned extubation per 1,000 days of invasive ventilation by country of admission
2017 2018 2019 2017-2019
England (NHS) 3.6 (n=206) 5.1 (n=287) 4.5 (n=248) 4.4 (n=741) Wales 2.3 (n=8) Scotland 4.8 (n=20) 6.0 (n=24) 6.0 (n=25) 5.6 (n=69) Northern Ireland 3.2 (n=5) 2.8 (n=4) 6.5 (n=9) 4.1 (n=18) Republic of Ireland 4.0 (n=20) 3.8 (n=21) 4.2 (n=24) 4.0 (n=65)
Total 3.7 (n=251) 5.0 (n=336) 4.6 (n=306) 4.4 (n=901)
Data are presented based on date of unplanned extubation
Due to small numbers, data for non-NHS and NHS organisations in England are presented combined and data for
Wales are presented for the whole reporting period combined only.
What does this mean? Unplanned extubation remains a relatively rare event within paediatric intensive care
services with a recorded annual rate of between four and five per 1,000 days of invasive
ventilation on average in 2017–2019. All units reported unplanned extubation rates below
eight per 1,000 intubated days in 2019. However, this is still a relatively new data item, as
units have only recently been required to report and quality assure this metric. Changes in
rates of unplanned extubation should therefore be carefully monitored over the next few
years.
Further details
Definitions and methods
When a child is intubated and ventilated it means that they have a tube placed in their throat
attached to a machine that helps them to breathe. The machine can be used to provide
different levels of oxygen to help their recovery. If the tube is accidentally removed, this is
called an unplanned extubation. As we are comparing such events between PICUs, we need
to calculate a rate of unplanned extubation, based on how many days of invasive ventilation
are provided in each PICU, as the more patients that are ventilated on a PICU, the more
likely an unplanned extubation will occur. To calculate the rate, we take the number of
unplanned extubations for every 1,000 invasive ventilation days delivered. This makes
comparisons between units with different volumes of invasive ventilation possible. Unplanned
extubation is referred to as an ‘adverse event’.
Why is this important?
Unplanned extubation is the most common adverse event related to airway management in
intensive care: it can cause complications such as hypoxaemia (very low blood oxygen),
hypercarbia (high blood carbon dioxide) and sometimes, but very rarely, death2. Clearly, it is
best to avoid unplanned extubation, if at all possible, but there are no established guideline
levels: the NHS England service specification notes the threshold is still to be agreed3.
Kanthimathinathan and colleagues referred to a notional threshold equivalent to 10/1000
days2. By continuously monitoring unplanned extubation rates, it may be possible to detect
when a change in practice occurred, such as the change in the adhesive tapes that caused
an increase in unplanned extubation rates noted by Kanthimathinathan and colleagues2.
24 PICANet 2020 annual summary report
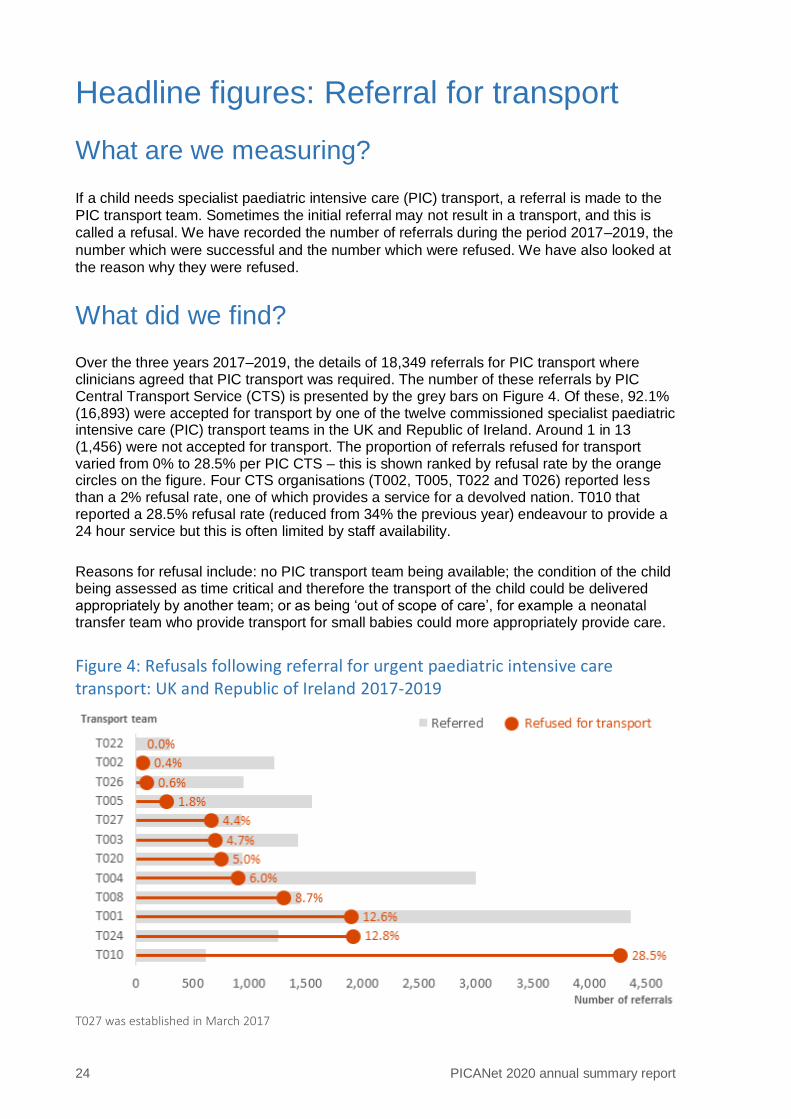
Headline figures: Referral for transport
What are we measuring?
If a child needs specialist paediatric intensive care (PIC) transport, a referral is made to the
PIC transport team. Sometimes the initial referral may not result in a transport, and this is
called a refusal. We have recorded the number of referrals during the period 2017–2019, the
number which were successful and the number which were refused. We have also looked at
the reason why they were refused.
What did we find?
Over the three years 2017–2019, the details of 18,349 referrals for PIC transport where clinicians agreed that PIC transport was required. The number of these referrals by PIC Central Transport Service (CTS) is presented by the grey bars on Figure 4. Of these, 92.1% (16,893) were accepted for transport by one of the twelve commissioned specialist paediatric intensive care (PIC) transport teams in the UK and Republic of Ireland. Around 1 in 13 (1,456) were not accepted for transport. The proportion of referrals refused for transport varied from 0% to 28.5% per PIC CTS – this is shown ranked by refusal rate by the orange circles on the figure. Four CTS organisations (T002, T005, T022 and T026) reported less than a 2% refusal rate, one of which provides a service for a devolved nation. T010 that reported a 28.5% refusal rate (reduced from 34% the previous year) endeavour to provide a 24 hour service but this is often limited by staff availability.
Reasons for refusal include: no PIC transport team being available; the condition of the child being assessed as time critical and therefore the transport of the child could be delivered appropriately by another team; or as being ‘out of scope of care’, for example a neonatal transfer team who provide transport for small babies could more appropriately provide care.
Figure 4: Refusals following referral for urgent paediatric intensive care transport: UK and Republic of Ireland 2017-2019
T027 was established in March 2017
Headline figures: Referral for transport 25
What does this mean? When a transport team receives a referral, and the specialist PIC doctor agrees that the child
requires transfer from the original admitting hospital to a PICU in another hospital, they also
need to confirm that the PICU has a bed available to care for the child. If a bed is not
available at the nearest PICU, the PIC transport team will seek an available bed in an
alternative PICU. Over the period 2017–2019, the specialist PIC transport service were able
to provide a response to over 92% of requests for transport.
When the transport team refuse the referral because they are already busy with other
transfers, urgent referrals may be passed to another PIC transport team, or the child may
remain at the local hospital with ongoing provision of support and advice about treatment
being provided by the specialist PIC transport doctor, until a staffed transport team is
available.
PIC transport may also be provided for children who are transferred from one PICU to
another, to another specialist service, a hospice or home.
All children requiring PIC transport (agreed by the PIC specialist doctor) will be cared for and
transferred by a PIC transport service or another transport provider.
Further details
Definitions and methods
We have recorded how many children have a referral for a specialist PIC transport team to
collect them and transfer them to a PICU. Where the transport does not happen, PICANet
record the reasons given by the transport teams. T028 is an ECMO transport team, not a
commissioned specialist PIC transport team and therefore excluded from this headline figure.
Why is this important?
Although only a small proportion of referrals were not accepted for urgent transfer to PIC it is
important to investigate the reason for any refusals. Almost half of refusals were due to the
lack of availability of a PIC team. These requests may be passed to another PIC specialist
transport team or the child may remain in the care of their local hospital under close
supervision from the PIC team until transport can be mobilised. However this may result in
the child being moved to a PICU in another part of the country.
Delays in receiving intensive care may have clinical implications and can cause stress for the
patients and their carers.
Sometimes the PIC transport team advise that the local hospital transfer the child themselves
to urgently access specialist treatment e.g. a child with a serious head injury. This is
recorded by PICANet as a time critical transfer. In cases where the PIC transport team
assess that the specialist transport required is out of their scope of care, the transport is
provided by another specialist transport team (e.g. a neonatal team providing transport for an
extremely preterm infant). For some teams the ability to respond to an urgent referral ‘out of
hours’ may at times be limited by staff availability.
The ability of a PIC transport team to transfer a child to a PICU also depends on there being
a PIC bed available.
26 PICANet 2020 annual summary report
Headline figures: Bed occupancy during ‘normal hours’ and ‘out of hours’
What are we measuring? The annual staffing study for PICANet collects information about the number of open beds in
PICUs that were occupied at midday on a weekday and a weekend day, during the week
beginning 11 November 2019 in the UK and Republic of Ireland. The number of open beds is
the number of intensive care (IC) and high dependency (HD) beds on a PICU for whom staff
were available.
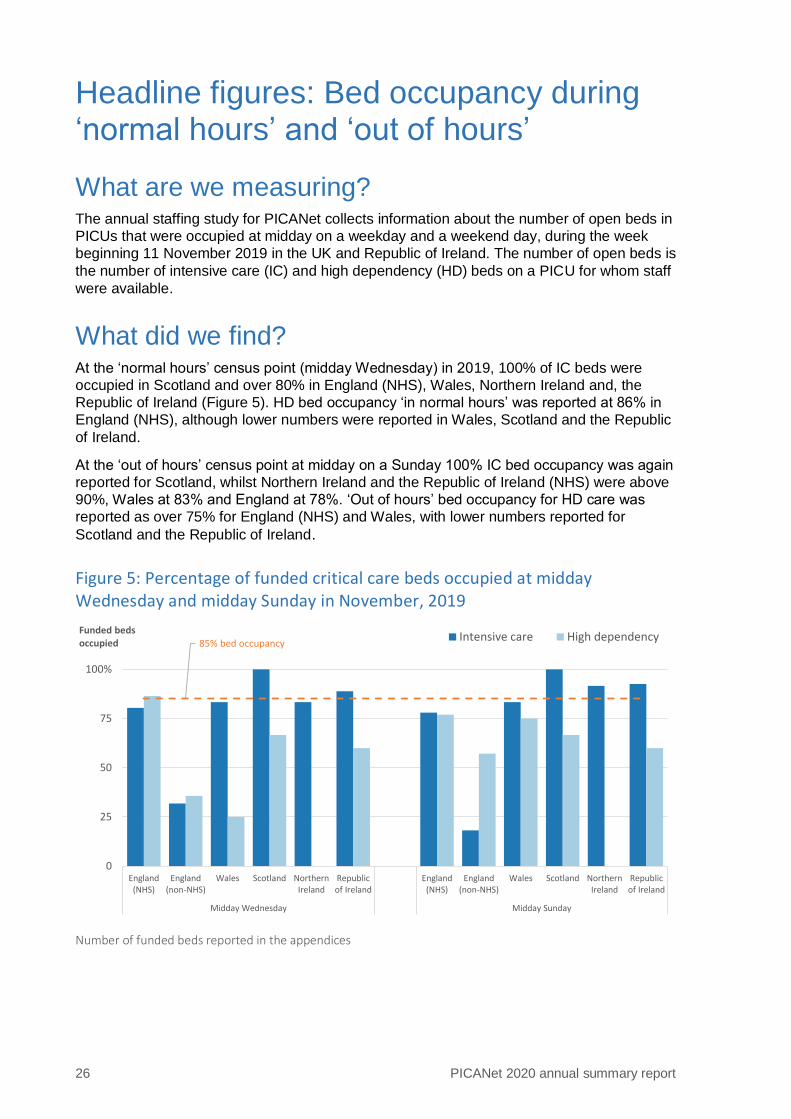
What did we find? At the ‘normal hours’ census point (midday Wednesday) in 2019, 100% of IC beds were
occupied in Scotland and over 80% in England (NHS), Wales, Northern Ireland and, the
Republic of Ireland (Figure 5). HD bed occupancy ‘in normal hours’ was reported at 86% in
England (NHS), although lower numbers were reported in Wales, Scotland and the Republic
of Ireland.
At the ‘out of hours’ census point at midday on a Sunday 100% IC bed occupancy was again
reported for Scotland, whilst Northern Ireland and the Republic of Ireland (NHS) were above
90%, Wales at 83% and England at 78%. ‘Out of hours’ bed occupancy for HD care was
reported as over 75% for England (NHS) and Wales, with lower numbers reported for
Scotland and the Republic of Ireland.
Figure 5: Percentage of funded critical care beds occupied at midday Wednesday and midday Sunday in November, 2019
Number of funded beds reported in the appendices
85% bed occupancy
0
25
50
75
100%
England(NHS)
England(non-NHS)
Wales Scotland NorthernIreland
Republicof Ireland
England(NHS)
England(non-NHS)
Wales Scotland NorthernIreland
Republicof Ireland
Midday Wednesday Midday Sunday
Funded beds occupied
Intensive care High dependency
Headline figures: Bed occupancy during ‘normal hours’ and ‘out of hours’ 27
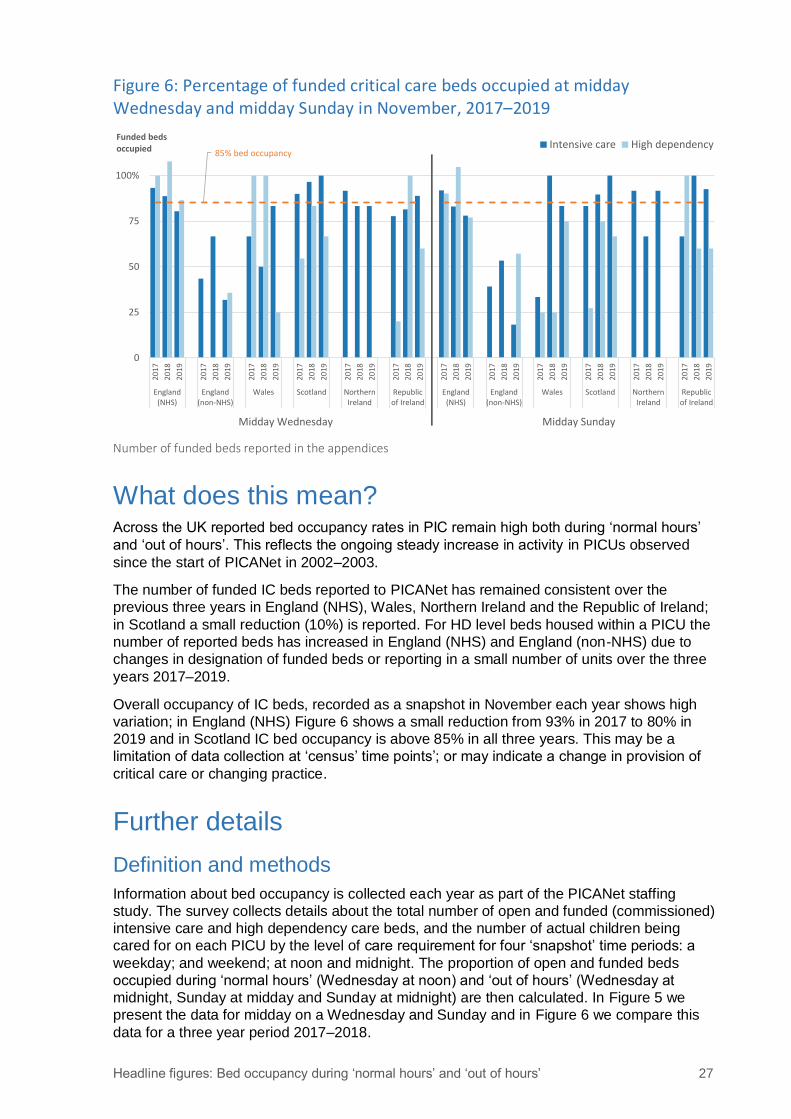
Figure 6: Percentage of funded critical care beds occupied at midday Wednesday and midday Sunday in November, 2017–2019
Number of funded beds reported in the appendices
What does this mean? Across the UK reported bed occupancy rates in PIC remain high both during ‘normal hours’
and ‘out of hours’. This reflects the ongoing steady increase in activity in PICUs observed
since the start of PICANet in 2002–2003.
The number of funded IC beds reported to PICANet has remained consistent over the
previous three years in England (NHS), Wales, Northern Ireland and the Republic of Ireland;
in Scotland a small reduction (10%) is reported. For HD level beds housed within a PICU the
number of reported beds has increased in England (NHS) and England (non-NHS) due to
changes in designation of funded beds or reporting in a small number of units over the three
years 2017–2019.
Overall occupancy of IC beds, recorded as a snapshot in November each year shows high
variation; in England (NHS) Figure 6 shows a small reduction from 93% in 2017 to 80% in
2019 and in Scotland IC bed occupancy is above 85% in all three years. This may be a
limitation of data collection at ‘census’ time points’; or may indicate a change in provision of
critical care or changing practice.
Further details
Definition and methods
Information about bed occupancy is collected each year as part of the PICANet staffing
study. The survey collects details about the total number of open and funded (commissioned)
intensive care and high dependency care beds, and the number of actual children being
cared for on each PICU by the level of care requirement for four ‘snapshot’ time periods: a
weekday; and weekend; at noon and midnight. The proportion of open and funded beds
occupied during ‘normal hours’ (Wednesday at noon) and ‘out of hours’ (Wednesday at
midnight, Sunday at midday and Sunday at midnight) are then calculated. In Figure 5 we
present the data for midday on a Wednesday and Sunday and in Figure 6 we compare this
data for a three year period 2017–2018.
85% bed occupancy
0
25
50
75
100%
20
17
20
18
20
19
20
17
20
18
20
19
20
17
20
18
20
19
20
17
20
18
20
19
20
17
20
18
20
19
20
17
20
18
20
19
20
17
20
18
20
19
20
17
20
18
20
19
20
17
20
18
20
19
20
17
20
18
20
19
20
17
20
18
20
19
20
17
20
18
20
19
England(NHS)
England(non-NHS)
Wales Scotland NorthernIreland
Republicof Ireland
England(NHS)
England(non-NHS)
Wales Scotland NorthernIreland
Republicof Ireland
Funded beds occupied Intensive care High dependency
Midday Wednesday Midday Sunday
28 PICANet 2020 annual summary report
Additional data for ‘out of hours’ bed occupancy is reported in the Tables and Figures section
of the PICANet Annual Report.
Why is this important?
Information about levels of bed occupancy is important for both the commissioners and
providers of PIC to ensure that there is adequate provision of paediatric critical care beds.
PICANet data was used to model and plan bed capacity in advance of the first wave of
Covid-19. The NHS England recent paediatric critical care review also used this information
to inform their review of the service. PICS standard L3 – 704 (2015) states that average bed
occupancy on the unit exceeding 85% for more than two successive months should be
specifically reviewed. The unit should be monitoring occupancy and there should be
evidence of escalation within the Hospital and involvement of Health Boards/Commissioners
if occupancy exceeds 85% for more than two successive months. Bed occupancy is also
used as an NHS Services Quality Dashboard measure (PICO 5a).

30 PICANet 2020 annual summary report
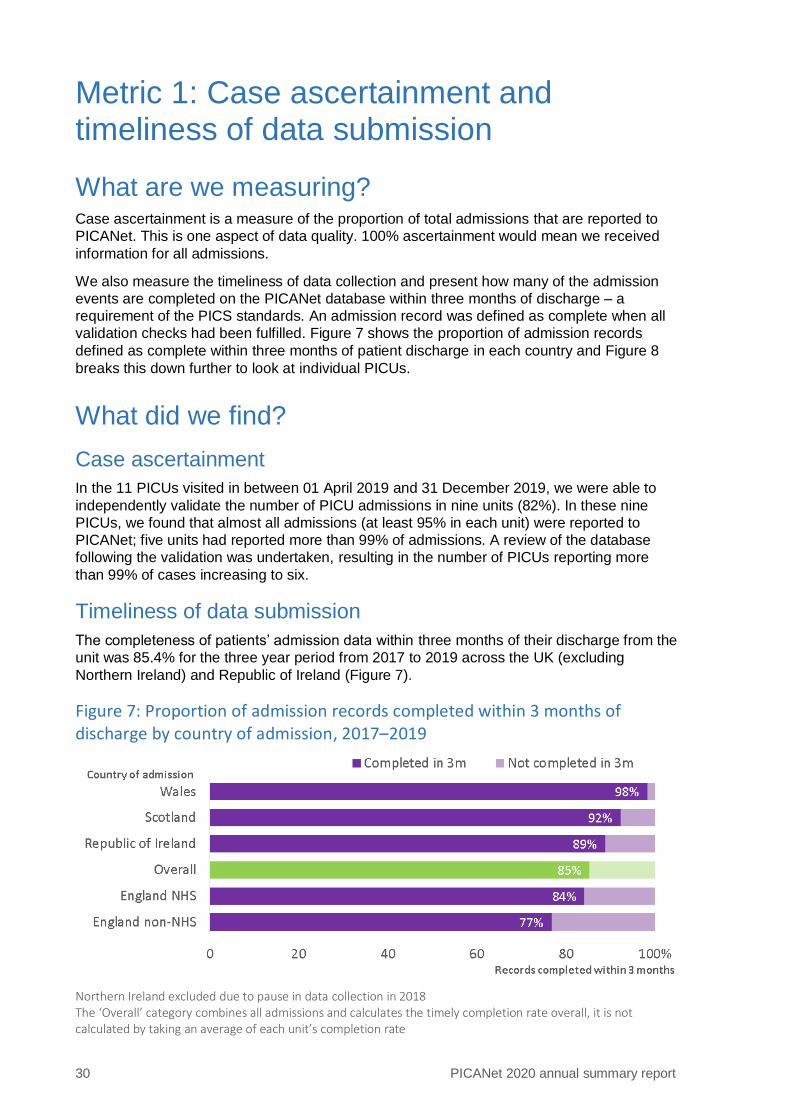
Metric 1: Case ascertainment and timeliness of data submission
What are we measuring? Case ascertainment is a measure of the proportion of total admissions that are reported to
PICANet. This is one aspect of data quality. 100% ascertainment would mean we received
information for all admissions.
We also measure the timeliness of data collection and present how many of the admission
events are completed on the PICANet database within three months of discharge – a
requirement of the PICS standards. An admission record was defined as complete when all
validation checks had been fulfilled. Figure 7 shows the proportion of admission records
defined as complete within three months of patient discharge in each country and Figure 8
breaks this down further to look at individual PICUs.
What did we find?
Case ascertainment
In the 11 PICUs visited in between 01 April 2019 and 31 December 2019, we were able to
independently validate the number of PICU admissions in nine units (82%). In these nine
PICUs, we found that almost all admissions (at least 95% in each unit) were reported to
PICANet; five units had reported more than 99% of admissions. A review of the database
following the validation was undertaken, resulting in the number of PICUs reporting more
than 99% of cases increasing to six.
Timeliness of data submission
The completeness of patients’ admission data within three months of their discharge from the
unit was 85.4% for the three year period from 2017 to 2019 across the UK (excluding
Northern Ireland) and Republic of Ireland (Figure 7).
Figure 7: Proportion of admission records completed within 3 months of discharge by country of admission, 2017–2019
Northern Ireland excluded due to pause in data collection in 2018 The ‘Overall’ category combines all admissions and calculates the timely completion rate overall, it is not calculated by taking an average of each unit’s completion rate
Metric 1: Case ascertainment and timeliness of data submission 31
Northern Ireland was excluded when the reporting period was considered as a whole
because data submission had to be paused in 2018 due to the introduction of the General
Data Protection Regulation (GDPR) such that the unit could not submit within the required
timelines.
Wales had the highest rate of timely completion at 98%, followed by Scotland at 92% and
Republic of Ireland at 89%. Within England, 84% of NHS PICUs and 77% of non-NHS PICUs
completed within 3 months.
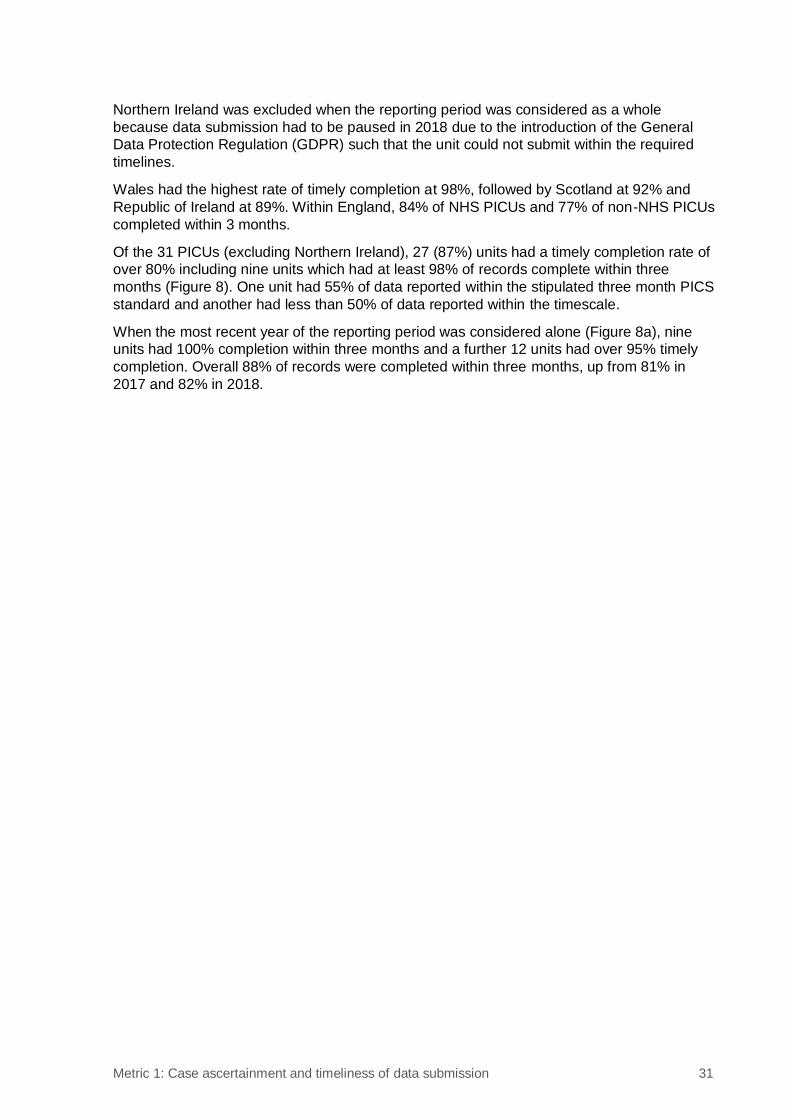
Of the 31 PICUs (excluding Northern Ireland), 27 (87%) units had a timely completion rate of
over 80% including nine units which had at least 98% of records complete within three
months (Figure 8). One unit had 55% of data reported within the stipulated three month PICS
standard and another had less than 50% of data reported within the timescale.
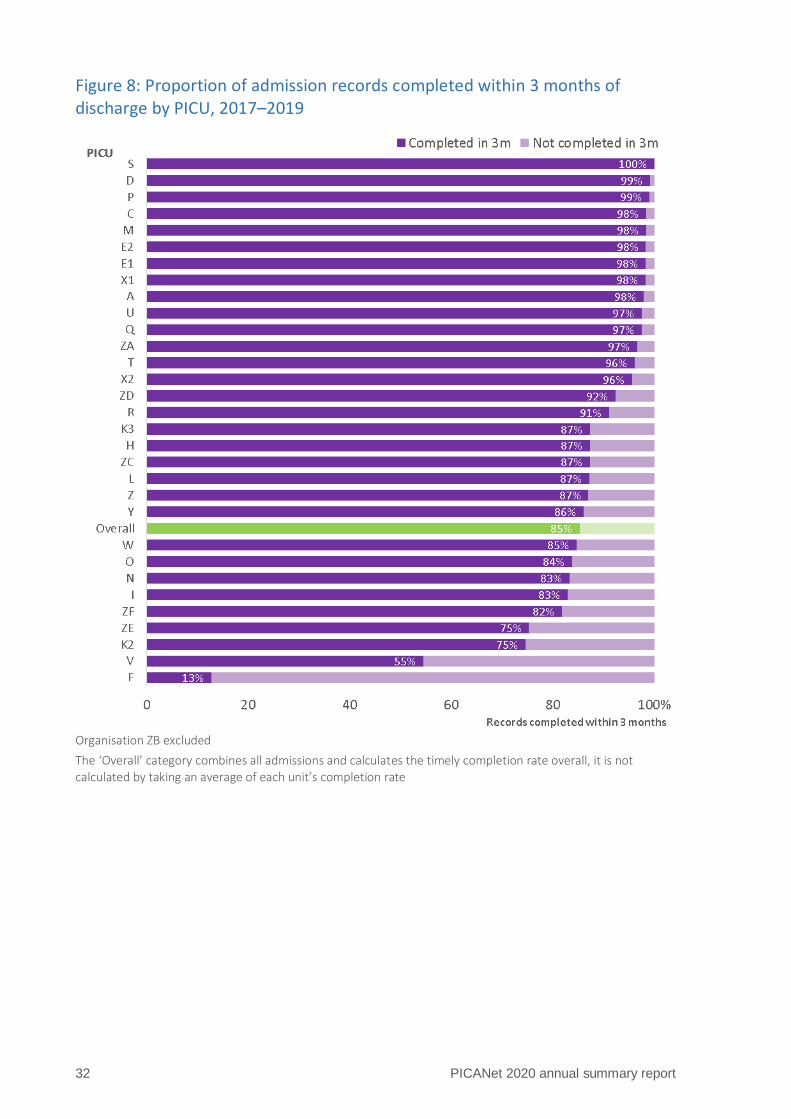
When the most recent year of the reporting period was considered alone (Figure 8a), nine
units had 100% completion within three months and a further 12 units had over 95% timely
completion. Overall 88% of records were completed within three months, up from 81% in
2017 and 82% in 2018.
32 PICANet 2020 annual summary report
Figure 8: Proportion of admission records completed within 3 months of discharge by PICU, 2017–2019
Organisation ZB excluded
The ‘Overall’ category combines all admissions and calculates the timely completion rate overall, it is not calculated by taking an average of each unit’s completion rate
Metric 1: Case ascertainment and timeliness of data submission 33
Figure 8a: Proportion of admission records completed within 3 months of discharge by PICU, 2019
What does this mean? High levels of case ascertainment ensure that we are confident our findings will be
representative of the events and care processes that take place in PICUs. PICUs in England,
Wales, Scotland and the Republic of Ireland had high or very high standards of timeliness of
submission of admission data. This is reflected in most units reporting the majority of their
data within 3 months of patient discharge, although there were a small number of units which
exhibited low rates of timely completion.
34 PICANet 2020 annual summary report
Further details
Definitions and methods
Every PICU receives a validation visit from the PICANet research nurse on a rolling
programme. At those visits, the numbers of admissions recorded locally are compared with
the numbers held on the PICANet database. Any discrepancies are followed up by the PICU.
This is called an ascertainment check. Not every PICU is visited each year, so our
ascertainment check is based on those PICUs that have received a visit in the most recent
year of the reporting period. We also monitor the timeliness of data completion,
benchmarking against the PICS standard for reporting admissions to PICANet within three
months of discharge from the unit.
Why is this important?
We want to base our analyses on all admissions to be sure that we can interpret our
findings appropriately. If a significant proportion of admissions is missing we cannot be as
confident about our conclusions. For example, if a number of admissions of children who had
died on PICU were missing, we may make the wrong conclusion when comparing
standardised mortality ratios (SMRs) between PICUs. Our high ascertainment rate therefore
means that we can be confident about our findings.
As well as ensuring we collect data on as many admissions as possible, we also want to
ensure that data are collected in a timely manner, that data are accurate and that all relevant
data are available for analysis.

36 PICANet 2020 annual summary report
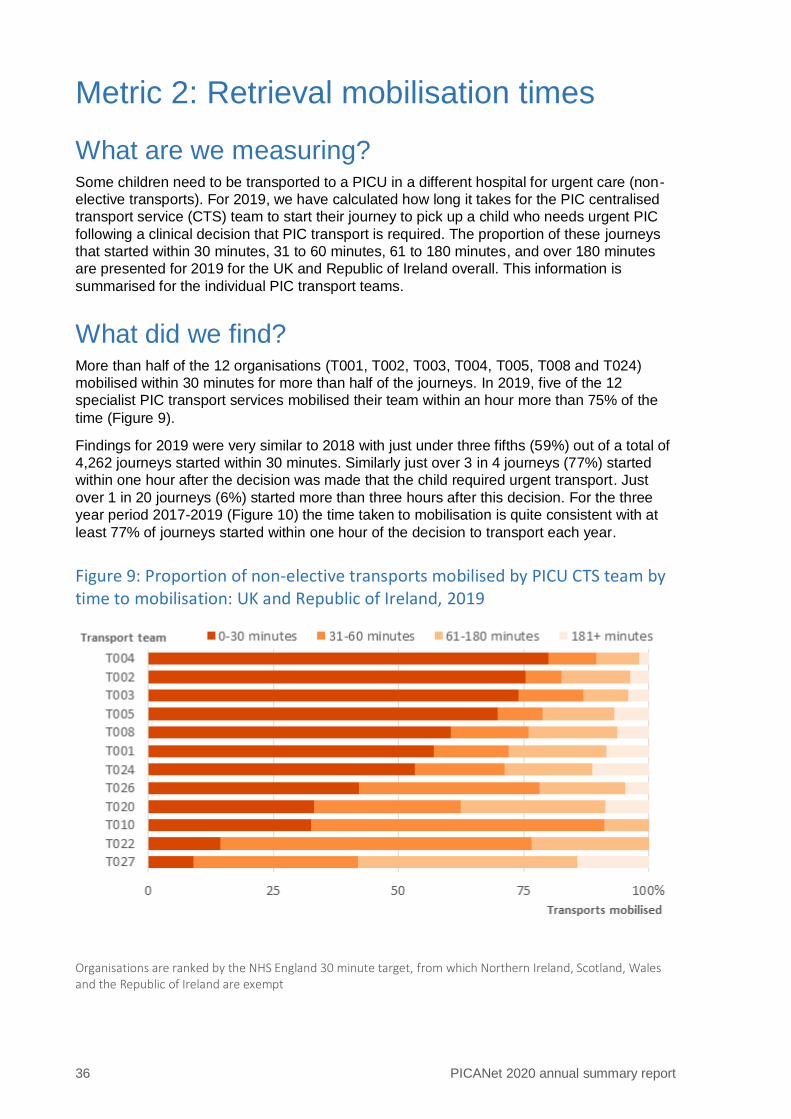
Metric 2: Retrieval mobilisation times
What are we measuring? Some children need to be transported to a PICU in a different hospital for urgent care (non-
elective transports). For 2019, we have calculated how long it takes for the PIC centralised
transport service (CTS) team to start their journey to pick up a child who needs urgent PIC
following a clinical decision that PIC transport is required. The proportion of these journeys
that started within 30 minutes, 31 to 60 minutes, 61 to 180 minutes, and over 180 minutes
are presented for 2019 for the UK and Republic of Ireland overall. This information is
summarised for the individual PIC transport teams.
What did we find? More than half of the 12 organisations (T001, T002, T003, T004, T005, T008 and T024)
mobilised within 30 minutes for more than half of the journeys. In 2019, five of the 12
specialist PIC transport services mobilised their team within an hour more than 75% of the
time (Figure 9).
Findings for 2019 were very similar to 2018 with just under three fifths (59%) out of a total of
4,262 journeys started within 30 minutes. Similarly just over 3 in 4 journeys (77%) started
within one hour after the decision was made that the child required urgent transport. Just
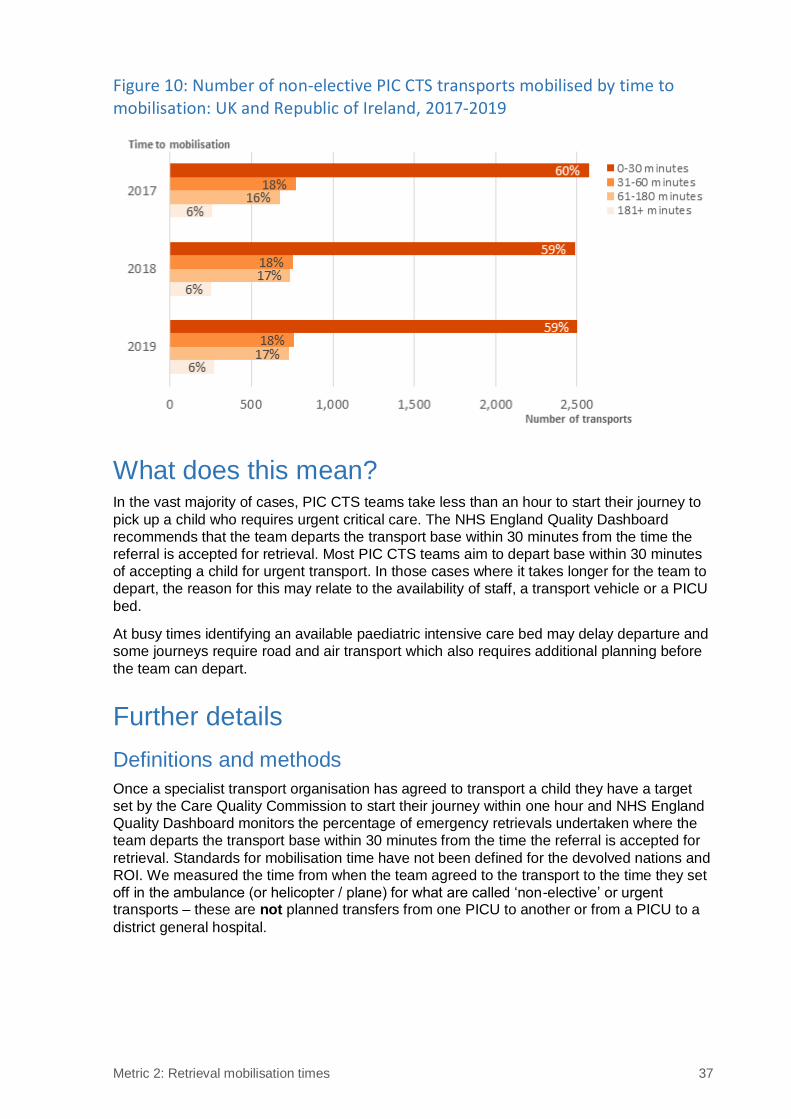
over 1 in 20 journeys (6%) started more than three hours after this decision. For the three
year period 2017-2019 (Figure 10) the time taken to mobilisation is quite consistent with at
least 77% of journeys started within one hour of the decision to transport each year.
Figure 9: Proportion of non-elective transports mobilised by PICU CTS team by time to mobilisation: UK and Republic of Ireland, 2019
Organisations are ranked by the NHS England 30 minute target, from which Northern Ireland, Scotland, Wales and the Republic of Ireland are exempt
Metric 2: Retrieval mobilisation times 37
Figure 10: Number of non-elective PIC CTS transports mobilised by time to mobilisation: UK and Republic of Ireland, 2017-2019
What does this mean? In the vast majority of cases, PIC CTS teams take less than an hour to start their journey to
pick up a child who requires urgent critical care. The NHS England Quality Dashboard
recommends that the team departs the transport base within 30 minutes from the time the
referral is accepted for retrieval. Most PIC CTS teams aim to depart base within 30 minutes
of accepting a child for urgent transport. In those cases where it takes longer for the team to
depart, the reason for this may relate to the availability of staff, a transport vehicle or a PICU
bed.
At busy times identifying an available paediatric intensive care bed may delay departure and
some journeys require road and air transport which also requires additional planning before
the team can depart.
Further details
Definitions and methods
Once a specialist transport organisation has agreed to transport a child they have a target
set by the Care Quality Commission to start their journey within one hour and NHS England
Quality Dashboard monitors the percentage of emergency retrievals undertaken where the
team departs the transport base within 30 minutes from the time the referral is accepted for
retrieval. Standards for mobilisation time have not been defined for the devolved nations and
ROI. We measured the time from when the team agreed to the transport to the time they set
off in the ambulance (or helicopter / plane) for what are called ‘non-elective’ or urgent transports – these are not planned transfers from one PICU to another or from a PICU to a
district general hospital.
38 PICANet 2020 annual summary report
Why is this important?
Any delay in receiving intensive care could put the sick child at risk, as the referring hospital
may not have the resources to look after a critically ill child. Delays in getting the team
mobilised may just mean that it is very busy, e.g. during periods of ‘winter pressures’.
Persistent delays may mean that there are insufficient resources in the transport organisation
or there are some other organisational issues that need to be addressed. By measuring the
time it takes to mobilise the transport team continuously over a long period of time PICANet
are able to monitor and report back on PIC CTS performance, enabling the transport
organisations to make changes to improve the quality of their service if appropriate.
The time it takes the PIC centralised transport service (CTS) team to start their journey to
pick up a child who needs urgent PIC care and the time taken by the team to travel, from the
journey start point to the child’s bedside in the referring hospital, are added together to
provide a measure called the ‘time to bedside’.
Reaching the bedside of a critically ill child within three hours of agreeing the child requires
urgent PIC care is a key target for Paediatric Critical Care Transport teams (PCCTs) to
achieve in the United Kingdom. Whilst timely access to specialist care is necessary for these
children, a study from England and Wales, undertaken by DEPICT4 showed no evidence that
reducing the time-to-bedside target for PIC CTS teams will improve the survival of critically ill
children.

40 PICANet 2020 annual summary report
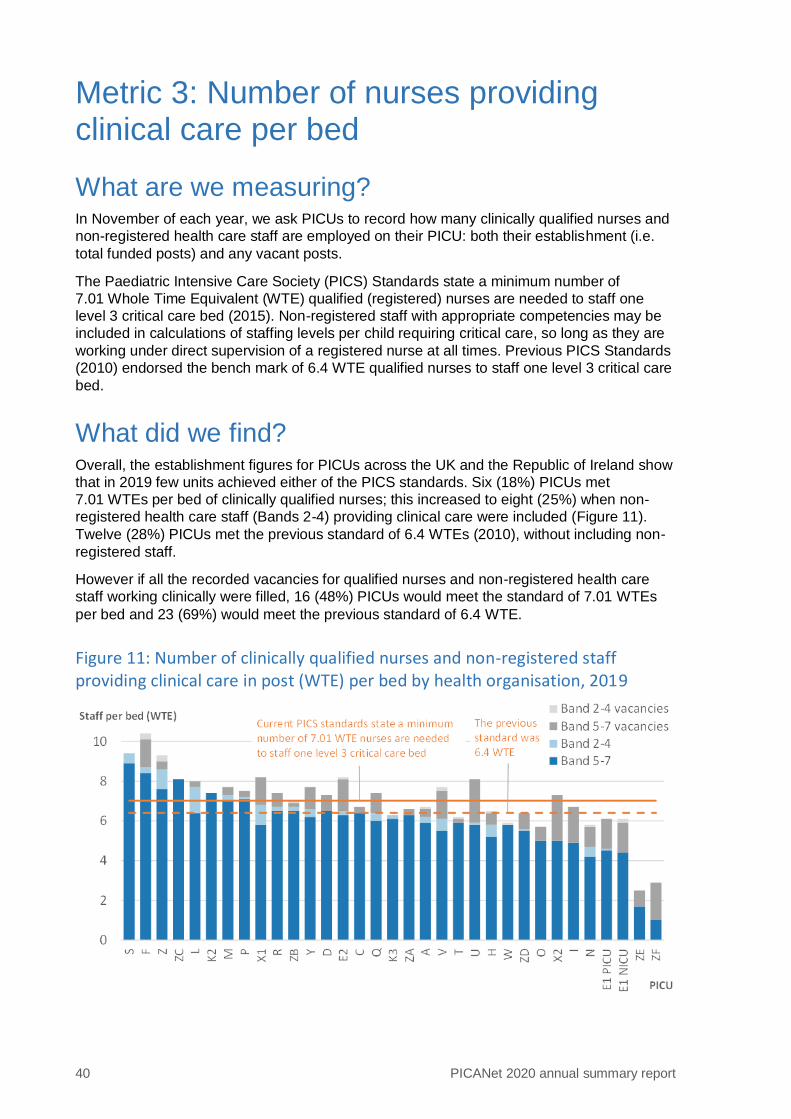
Metric 3: Number of nurses providing clinical care per bed
What are we measuring? In November of each year, we ask PICUs to record how many clinically qualified nurses and
non-registered health care staff are employed on their PICU: both their establishment (i.e.
total funded posts) and any vacant posts.
The Paediatric Intensive Care Society (PICS) Standards state a minimum number of
7.01 Whole Time Equivalent (WTE) qualified (registered) nurses are needed to staff one
level 3 critical care bed (2015). Non-registered staff with appropriate competencies may be
included in calculations of staffing levels per child requiring critical care, so long as they are
working under direct supervision of a registered nurse at all times. Previous PICS Standards
(2010) endorsed the bench mark of 6.4 WTE qualified nurses to staff one level 3 critical care
bed.
What did we find? Overall, the establishment figures for PICUs across the UK and the Republic of Ireland show
that in 2019 few units achieved either of the PICS standards. Six (18%) PICUs met
7.01 WTEs per bed of clinically qualified nurses; this increased to eight (25%) when non-
registered health care staff (Bands 2-4) providing clinical care were included (Figure 11).
Twelve (28%) PICUs met the previous standard of 6.4 WTEs (2010), without including non-
registered staff.
However if all the recorded vacancies for qualified nurses and non-registered health care
staff working clinically were filled, 16 (48%) PICUs would meet the standard of 7.01 WTEs
per bed and 23 (69%) would meet the previous standard of 6.4 WTE.
Figure 11: Number of clinically qualified nurses and non-registered staff providing clinical care in post (WTE) per bed by health organisation, 2019
Metric 3: Number of nurses providing clinical care per bed 41
What does this mean? Based on the data provided by UK and Republic of Ireland PICUs in November 2019, a
quarter of PICUs met the recommended standard of the Paediatric Intensive Care Society.
The addition of bands 2-4 delivering clinical care has enabled two additional PICUs to meet
this standard. However, despite few PICUs meeting these standards, staffing data from the
census shows that the units ensure that their staffing levels are appropriate for the number of
children on the unit and their care requirements. This may be achieved by unit staff working
flexibly, undertaking additional shifts or using bank or agency staff. These data should be
used to inform the future planning of PIC.
Further details
Definition and methods
Each year PICANet carries out a staffing study to monitor staffing levels within PICUs and to
audit the appropriate standards of the Paediatric Intensive Care Society: currently the PICS
Quality Standards for the Care of Critically Ill Children (5th Edition, December 2015). Staffing
data are collected in the November of each year: for the week beginning 11 November in
2019, we present the percentage of PICUs meeting the recommended level of nurse staffing
per funded critical care bed.
The recommended number of nurses required (or nurse staffing establishment), in order to
provide the appropriate levels of care for the number and given dependency of the bed, is
calculated according to the PICS Standards for Intensive Care (one nurse to one bed) and
high dependency (one nurse for every two beds).
Why is this important?
PICUs need to be able to monitor whether they have adequate nursing staff available to run
their unit efficiently. PICS Standard L3-207 and guidance from the PICS Nurse Workforce
Planning document for Level 3 Paediatric Critical Care Units, October 2016 states that ‘the
minimum number of qualified nurses required to staff one level 3 critical care bed is a
minimum of 7.01 WTE’. Non-registered staff (health care assistants) with appropriate
competencies may be included in calculations of staffing levels per child requiring critical
care so long as they are working under direct supervision of a registered nurse at all times.
The availability of specialist PIC nurses is affected by many factors external to PIC including
nursing salaries and the cost of living in capital cities. Staff recruitment and retention is
currently under review as part of the paediatric critical care review. Some PICUs are
developing the role of band 2–4 health care assistants to support qualified staff in delivering
clinical care in critical care units. There is also additional concern about the effect of the
ongoing Covid-19 pandemic on staff retention and recruitment in intensive care.
42 PICANet 2020 annual summary report
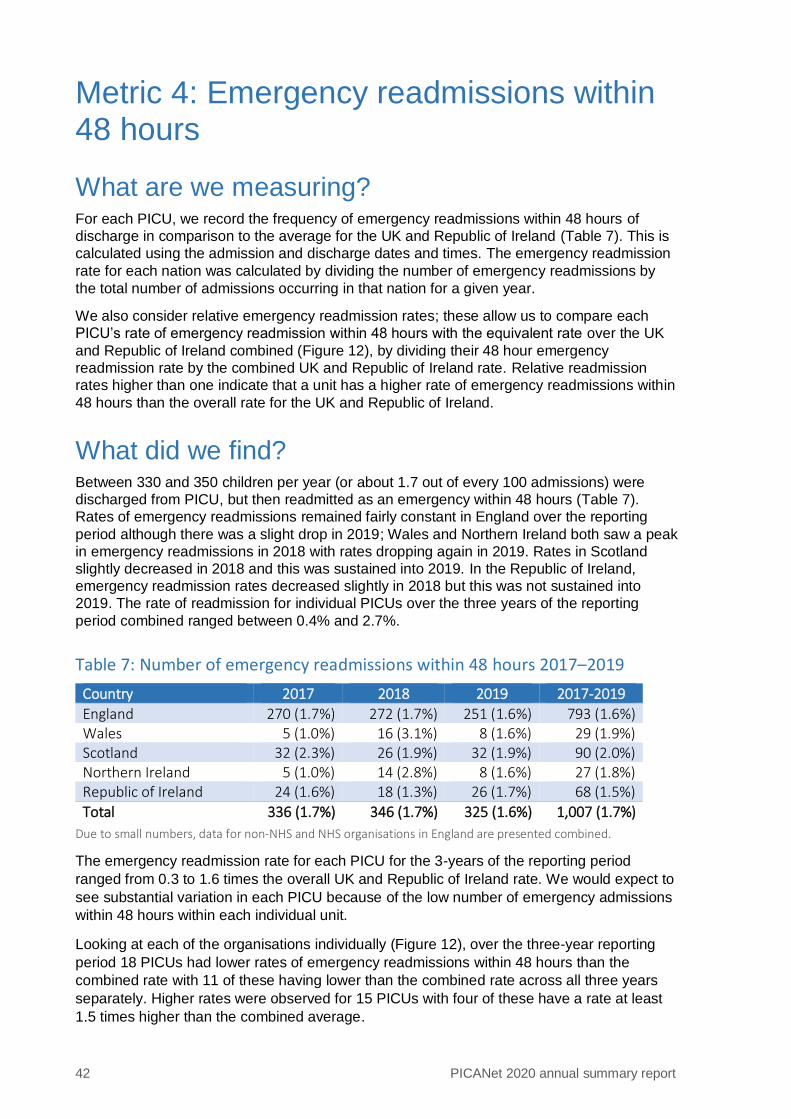
Metric 4: Emergency readmissions within 48 hours
What are we measuring? For each PICU, we record the frequency of emergency readmissions within 48 hours of
discharge in comparison to the average for the UK and Republic of Ireland (Table 7). This is
calculated using the admission and discharge dates and times. The emergency readmission
rate for each nation was calculated by dividing the number of emergency readmissions by
the total number of admissions occurring in that nation for a given year.
We also consider relative emergency readmission rates; these allow us to compare each
PICU’s rate of emergency readmission within 48 hours with the equivalent rate over the UK
and Republic of Ireland combined (Figure 12), by dividing their 48 hour emergency
readmission rate by the combined UK and Republic of Ireland rate. Relative readmission
rates higher than one indicate that a unit has a higher rate of emergency readmissions within
48 hours than the overall rate for the UK and Republic of Ireland.
What did we find? Between 330 and 350 children per year (or about 1.7 out of every 100 admissions) were
discharged from PICU, but then readmitted as an emergency within 48 hours (Table 7).
Rates of emergency readmissions remained fairly constant in England over the reporting
period although there was a slight drop in 2019; Wales and Northern Ireland both saw a peak
in emergency readmissions in 2018 with rates dropping again in 2019. Rates in Scotland
slightly decreased in 2018 and this was sustained into 2019. In the Republic of Ireland,
emergency readmission rates decreased slightly in 2018 but this was not sustained into
2019. The rate of readmission for individual PICUs over the three years of the reporting
period combined ranged between 0.4% and 2.7%.
Table 7: Number of emergency readmissions within 48 hours 2017–2019
Country 2017 2018 2019 2017-2019
England 270 (1.7%) 272 (1.7%) 251 (1.6%) 793 (1.6%) Wales 5 (1.0%) 16 (3.1%) 8 (1.6%) 29 (1.9%) Scotland 32 (2.3%) 26 (1.9%) 32 (1.9%) 90 (2.0%) Northern Ireland 5 (1.0%) 14 (2.8%) 8 (1.6%) 27 (1.8%) Republic of Ireland 24 (1.6%) 18 (1.3%) 26 (1.7%) 68 (1.5%)
Total 336 (1.7%) 346 (1.7%) 325 (1.6%) 1,007 (1.7%)
Due to small numbers, data for non-NHS and NHS organisations in England are presented combined.
The emergency readmission rate for each PICU for the 3-years of the reporting period
ranged from 0.3 to 1.6 times the overall UK and Republic of Ireland rate. We would expect to
see substantial variation in each PICU because of the low number of emergency admissions
within 48 hours within each individual unit.
Looking at each of the organisations individually (Figure 12), over the three-year reporting
period 18 PICUs had lower rates of emergency readmissions within 48 hours than the
combined rate with 11 of these having lower than the combined rate across all three years
separately. Higher rates were observed for 15 PICUs with four of these have a rate at least
1.5 times higher than the combined average.
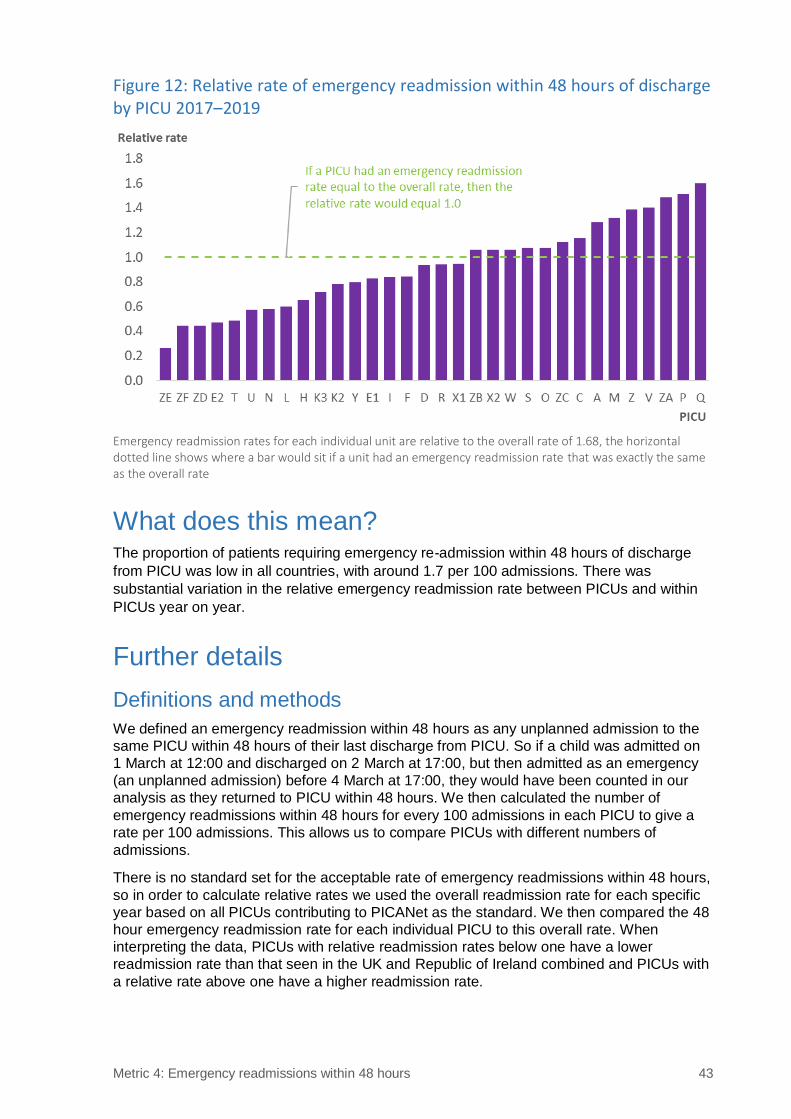
Metric 4: Emergency readmissions within 48 hours 43
Figure 12: Relative rate of emergency readmission within 48 hours of discharge by PICU 2017–2019
Emergency readmission rates for each individual unit are relative to the overall rate of 1.68, the horizontal dotted line shows where a bar would sit if a unit had an emergency readmission rate that was exactly the same as the overall rate
What does this mean? The proportion of patients requiring emergency re-admission within 48 hours of discharge
from PICU was low in all countries, with around 1.7 per 100 admissions. There was
substantial variation in the relative emergency readmission rate between PICUs and within
PICUs year on year.
Further details
Definitions and methods
We defined an emergency readmission within 48 hours as any unplanned admission to the
same PICU within 48 hours of their last discharge from PICU. So if a child was admitted on
1 March at 12:00 and discharged on 2 March at 17:00, but then admitted as an emergency
(an unplanned admission) before 4 March at 17:00, they would have been counted in our
analysis as they returned to PICU within 48 hours. We then calculated the number of
emergency readmissions within 48 hours for every 100 admissions in each PICU to give a
rate per 100 admissions. This allows us to compare PICUs with different numbers of
admissions.
There is no standard set for the acceptable rate of emergency readmissions within 48 hours,
so in order to calculate relative rates we used the overall readmission rate for each specific
year based on all PICUs contributing to PICANet as the standard. We then compared the 48
hour emergency readmission rate for each individual PICU to this overall rate. When
interpreting the data, PICUs with relative readmission rates below one have a lower
readmission rate than that seen in the UK and Republic of Ireland combined and PICUs with
a relative rate above one have a higher readmission rate.
44 PICANet 2020 annual summary report
Why is this important?
Emergency readmission within 48 hours is an undesirable outcome. From an individual
child’s perspective, it suggests that their health has deteriorated in a short space of time and
that they require further intensive care treatment. This will cause stress to the child, their
families and their carers. For a busy PICU, each admission also creates additional demand
on a service that usually operates close to capacity.
It should be noted that although emergency readmission is used as a quality indicator, we
cannot say that the sole or primary readmission was a reflection of the care provided.
PICANet is therefore unable to assess whether the child was discharged too early, or into the
wrong care environment, or whether the need for future intensive care was not foreseen.
Relative rates of emergency readmission within 48 hours compared with the overall rate for
the UK and Republic of Ireland show considerable variation year on year, although some of
this variation could be due to small numbers of emergency readmissions within 48 hours in
each PICU. This suggests that emergency readmission rates should be monitored on an
ongoing basis.

46 PICANet 2020 annual summary report
Metric 5: Mortality in PICU
What are we measuring? Mortality (death) rates are assessed for every PICU based on a statistical approach that
accounts for the severity of the child’s illness at the time of admission. This method is known
as risk adjustment. The number of children who actually die (the ‘observed’ number) is
compared to the number we predict to die (the ‘expected’ number, based on their clinical
characteristics at the time of admission) to derive the risk-adjusted Standardised Mortality
Ratio (SMR). The risk-adjustment method used to calculate expected mortality was the
Paediatric Index of Mortality 3 (PIM3)4, which has been recalibrated, based on the data within
this reporting period. Further details on recalibration can be found in the Tables and Figures
document.
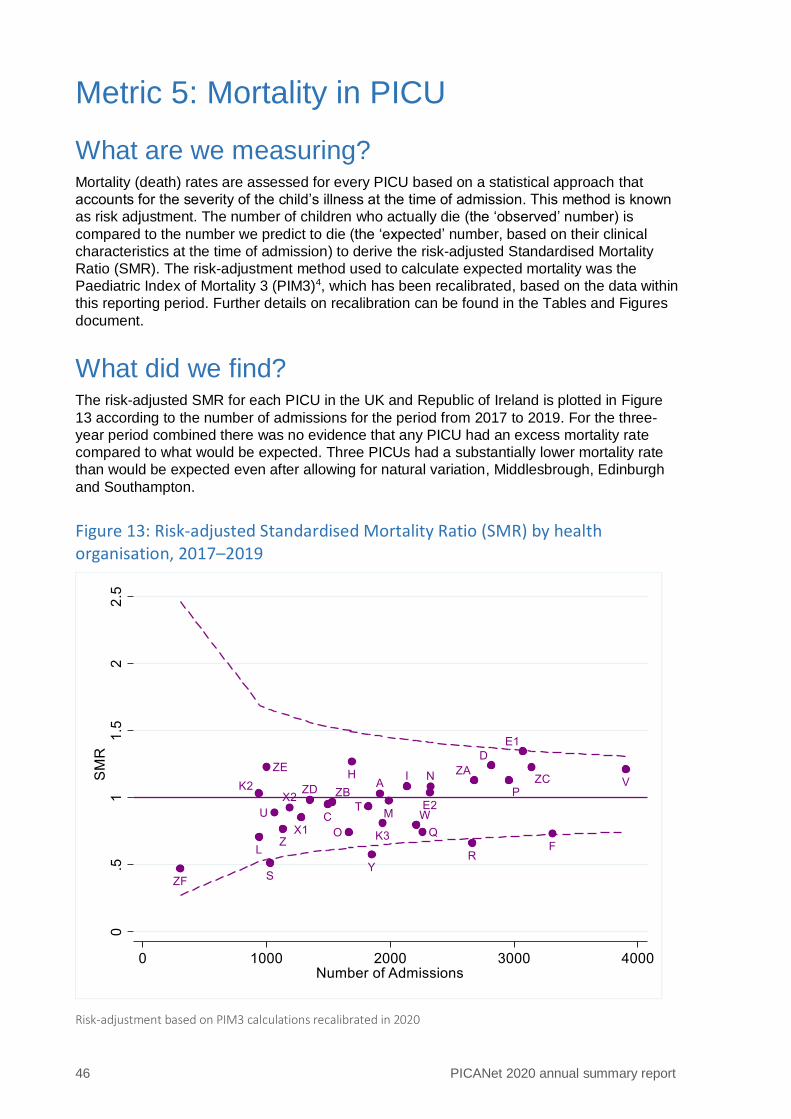
What did we find? The risk-adjusted SMR for each PICU in the UK and Republic of Ireland is plotted in Figure
13 according to the number of admissions for the period from 2017 to 2019. For the three-
year period combined there was no evidence that any PICU had an excess mortality rate
compared to what would be expected. Three PICUs had a substantially lower mortality rate
than would be expected even after allowing for natural variation, Middlesbrough, Edinburgh
and Southampton.
Figure 13: Risk-adjusted Standardised Mortality Ratio (SMR) by health organisation, 2017–2019
Risk-adjustment based on PIM3 calculations recalibrated in 2020
Metric 5: Mortality in PICU 47
What does this mean? After allowing for the level of sickness of the patient at the time of admission, no PICUs had a
higher than expected mortality rate when the three-year reporting period was considered,
and three PICUs had a substantially lower than expected mortality rate.
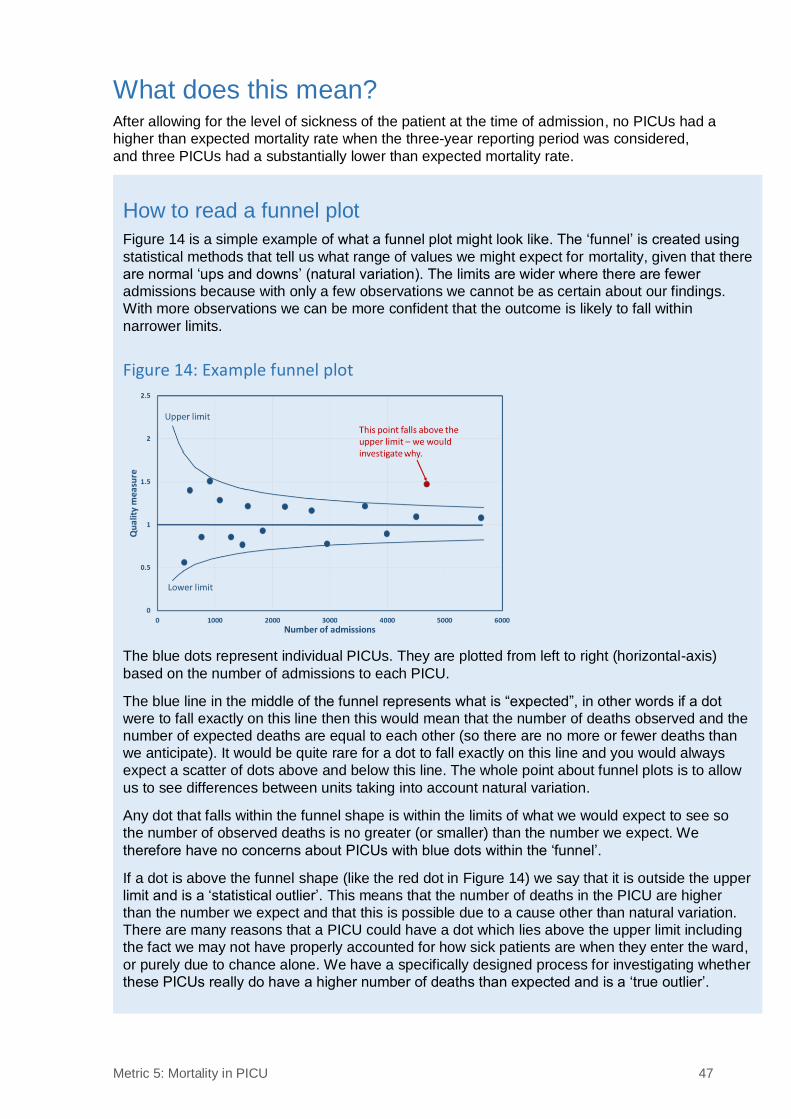
How to read a funnel plot
Figure 14 is a simple example of what a funnel plot might look like. The ‘funnel’ is created using
statistical methods that tell us what range of values we might expect for mortality, given that there
are normal ‘ups and downs’ (natural variation). The limits are wider where there are fewer
admissions because with only a few observations we cannot be as certain about our findings.
With more observations we can be more confident that the outcome is likely to fall within
narrower limits.
Figure 14: Example funnel plot
The blue dots represent individual PICUs. They are plotted from left to right (horizontal-axis)
based on the number of admissions to each PICU.
The blue line in the middle of the funnel represents what is “expected”, in other words if a dot
were to fall exactly on this line then this would mean that the number of deaths observed and the
number of expected deaths are equal to each other (so there are no more or fewer deaths than
we anticipate). It would be quite rare for a dot to fall exactly on this line and you would always
expect a scatter of dots above and below this line. The whole point about funnel plots is to allow
us to see differences between units taking into account natural variation.
Any dot that falls within the funnel shape is within the limits of what we would expect to see so
the number of observed deaths is no greater (or smaller) than the number we expect. We
therefore have no concerns about PICUs with blue dots within the ‘funnel’.
If a dot is above the funnel shape (like the red dot in Figure 14) we say that it is outside the upper
limit and is a ‘statistical outlier’. This means that the number of deaths in the PICU are higher
than the number we expect and that this is possible due to a cause other than natural variation.
There are many reasons that a PICU could have a dot which lies above the upper limit including
the fact we may not have properly accounted for how sick patients are when they enter the ward,
or purely due to chance alone. We have a specifically designed process for investigating whether
these PICUs really do have a higher number of deaths than expected and is a ‘true outlier’.
48 PICANet 2020 annual summary report
Further details
Definitions and methods
Clinical data collected on admission are used in a statistical model to predict the probability
that each child might die in PICU: the worse a patient’s clinical condition is on admission, the
higher the probability that they might die. These probabilities are added up for each PICU to
give an overall expected number of deaths in any one period. We then count the actual
(observed) number of deaths and calculate what is known as a Standardised Mortality Ratio
(SMR) by dividing the observed number of deaths by the expected number. We then use the
funnel plot to assess the level of mortality in the PICUs against what is expected.
Why is this important?
Although death whilst receiving care on a PICU is extremely rare, it is important to assess
whether more (or fewer) deaths than expected occur, as this can indicate that there is
something different happening in a PICU. It only represents a statistical measure of mortality
and it is very important to use this as an indicator that further investigation is required, not as
a true measure of the quality of care delivered.
References 49
References 1. NHS England and NHS Improvement (2019). Paediatric Critical Care and Surgery in
Children Review. Available at https://www.england.nhs.uk/commissioning/spec-
services/npc-crg/paediatric-critical-care-and-surgery-in-children-review/. Last
accessed [18 Nov 2020]
2. Kanthimathinathan, H.K., Durward, A., Nyman, A., et al. (2015) Unplanned extubation
in a paediatric intensive care unit: prospective cohort study. Intensive Care Med 41,
1299–1306. https://doi.org/10.1007/s00134-015-3872-4
3. NHS England (2015). Level 3 – Paediatric Critical Care (PCC) Service Specification.
Available at https://www.england.nhs.uk/commissioning/wp-
content/uploads/sites/12/2015/01/e07-sa-paed-inten-care.pdf. Last accessed [18 Nov
2020]
4. Seaton, S.E., Ramnarayan, P., Davies, P., et al. (2020) Does time taken by paediatric
critical care transport teams to reach the bedside of critically ill children affect
survival? A retrospective cohort study from England and Wales. BMC Pediatr 20,
301. https://doi.org/10.1186/s12887-020-02195-6
5. Straney, L., Clements, A., Parslow, R.C., et al. (2013) Paediatric index of mortality 3:
an updated model for predicting mortality in pediatric intensive care. Pediatr Crit Care
Med;14(7):673-81 https://doi.org/10.1097/PCC.0b013e31829760cf

Additional information 51
Additional information
Background PICANet was established in 2001 with funding from the Department of Health and started
collecting data from English and Welsh paediatric intensive care units in November 2002.
The PICUs at the Royal Hospital for Sick Children, Edinburgh and the Royal Hospital for
Children, Glasgow started submitting data in December 2004 and March 2007 respectively.
The Royal Belfast Hospital for Sick Children joined in April 2008 and Children's Health,
Ireland, Crumlin and Children's Health, Ireland, Temple Street, both based in Dublin, have
submitted anonymised data to PICANet since 2009 and 2010, respectively. The Harley
Street Clinic PICU started contributing data in September 2010, and the PICU at the Portland
Hospital from October 2013, allowing both these non-NHS units to compare their
performance against the national benchmark provided by PICANet.
A full list of participating PICUs can be found in Appendix A.
Governance PICANet continues to receive support from the NHS Health Research Authority
Confidentiality Advisory Group (NHS HRA CAG) (formerly the NIGB) to collect personally
identifiable data without consent on infants and children admitted to paediatric intensive care.
See https://www.hra.nhs.uk/documents/2143/piag-register-master-2019_LzQaqan.xls
Ethics approval has been granted by the Trent Medical Research Ethics Committee, ref.
18/EM/0267.
PICANet supports transparency in its data processing and has patient information sheets
and posters on display in PICUs and issues a Privacy Notice and Fair Processing Statement
on its website outlining the legal basis for processing of data under the General Data
Protection Regulations (May 2018). Details can be found at https://www.picanet.org.uk/.
PICANet receives support and advice from a Clinical Advisory Group (CAG) drawing on the
expertise of doctors and nurses working within the speciality and a Steering Group (SG),
whose membership includes Health Services Researchers, representatives from the Royal
Colleges of Paediatrics and Child Health, Nursing and Anaesthetics, a lay member and
commissioners. Appendices B and C provide a full list of CAG and SG members. Additional
support from the clinical community is provided through the UK Paediatric Intensive Care
Society.
Commissioning The following organisations commission paediatric intensive care in the UK:
▪ England: NHS England Specialised Services
▪ Wales: Welsh Health Specialised Service Committee (WHSSC)
▪ Scotland: National Services Division of NHS National Services Scotland
▪ Northern Ireland: Health and Social Care Board
In the Republic of Ireland, Children’s Health Ireland, Crumlin and Children’s Health Ireland,
Temple Street are both voluntary hospitals, funded by the Health Service Executive.
52 PICANet 2020 annual summary report
Methods
Basic methodology
Most critically ill children who need complex clinical care and life support are treated in
Paediatric Intensive Care Units (PICUs). These children may have had complex surgery, an
accident or a severe infection and may arrive in the PICU from an operating theatre,
emergency department or from a hospital ward. In some cases they may have been
transferred from another hospital and, rarely, admitted directly from home.
PICANet is an audit that collects personal, organisational and clinical data on all children with
a clinically determined need for paediatric intensive care in the UK and Ireland, to compare
outcomes and activity between PICUs and specialist transport organisations and also
between health regions and nations.
Data are stored on a secure database. Each organisation is able to view and download their
own data and reports on their data quality and activity as well as comparative national data.
An annual report is produced each autumn that includes a summary of what has happened
to children admitted to PICU including why they were admitted, where they were admitted
from, how long they stayed, what treatments they received and their outcome at the time of
discharge. Comparisons between PICUs are made to assess how well they perform against
established clinical standards and guidelines.
In addition to the annual report, PICANet provides technical and statistical support for the
use of its data for local audit and research, regional and national commissioning, national
and international research and to provide baseline information for clinical intervention trials.
Participating organisations and data submission
PICANet has collected data from all PICUs in England and Wales since 2002. The two
PICUs in Scotland, one from Northern Ireland and two from the Republic of Ireland, along
with two non-NHS units based in London have joined PICANet at different times so that
coverage is now for the whole of the UK and the Republic of Ireland. There are 32 PICUs
and 12 specialist transport organisations currently submitting data to PICANet.
Data are submitted by individual PICUs prospectively, using our secure web-based data
collection application with real-time online validation reporting, systematic monthly validation
review by our research nurse and regular on-site validation visits. Data submission can
involve direct entry of patient data or an upload of a data file from an existing clinical
information system. PICANet provides full documentation on data definitions, which have
been developed in collaboration with our Clinical Advisory Group, as well as technical
specifications for IT and database professionals. In addition, standardised data collection
forms are supplied to all organisations where there is no in-house provision for data
collection.
Data collected
PICANet collects three core datasets:
Admission data contains demographic details of each child including their name*, date of
birth**, NHS/CHI number, address* and ethnic group; it also records where children are
admitted from, their date of admission and clinical diagnoses, some physiological parameters
on admission including blood gases, blood pressure, medical history and ventilation status.
Data on outcome and discharge details are included. The medical interventions received on
each day by each child are recorded as part of the audit and to help NHS organisations in
England to supply information on the cost of their activity.
Additional information 53
Referral data for all children where clinicians agree a paediatric intensive care bed and/or
paediatric intensive care transport is required includes details of the referring hospital,
demographic details of the child, grade of the referring doctor or nurse, the outcome of the
referral, the transport team involved and the destination PICU.
Transport data for all children transported to a PICU from their original admitting hospital or
who are transported by a specialist PIC transport service but are not admitted to a PICU
includes patient details as well as information about their presenting physiology. Details of
the composition of the transport team, journey times, any interventions carried out and critical
incidents are also recorded.
Additional data collection takes place to understand more about staffing on PICU:
Staffing data are collected each year in November to monitor staffing levels within PICUs as
well as the PICS standards relating to staffing requirements.
* Not collected for data from Northern Ireland or the Republic of Ireland
** Limited to month and year for Northern Ireland
Analytical techniques
Statistical techniques used include simple cross tabulations, the calculation of crude and risk-
adjusted SMRs and 95% confidence intervals; the construction of crude and risk-adjusted
funnel plots of SMRs; and local provision of Risk Adjusted Resetting Sequential Probability
Ratio Test (RA-RSPRT) plots to assess real-time performance related to in-PICU mortality.
Risk adjusted SMRs were calculated using the latest version of the Paediatric Index of
Mortality (PIM33) recalibrated based on data within the current reporting period.
Assessing case ascertainment, data quality and validation
PICANet Web allows PICU staff to obtain reports on their own data to check monthly
admissions totals. In addition, during validation visits by the PICANet research nurse a cross
check is carried out against records held on PICU (such as admission books, or in-house
data collection systems) and PICANet Web. These checks allow us to assess case
ascertainment and the on-site validation visits are a core element of our data quality
assurance process.
Data are validated online via PICANet Web using logic and range checks as well as flagging
missing data items. The Modulus 11 algorithm is used to validate the NHS number based on
a check digit – this is a standard method of ensuring the NHS number is a true NHS number
and improves our ability to trace patients through the PICANet database and in linked
healthcare data.
Collaborative working supporting policy, commissioning, research and clinical trials
PICANet has become established as the definitive source of data on paediatric intensive
care activity in the UK and Ireland. Its data have been used to plan PIC services, model
demand, assess interventions and outcomes and provide data to underpin research to
facilitate the development of new standards for critical care provision for children. PICANet
has provided baseline data for the development of the I-KID, SANDWICH and FEVER trials,
all of which have been funded and will make use of the routinely collected PICANet data
using the custom data download facility. This allows local control over the data. We are also
working closely with a number of other funded studies, including DEPICT, ENACT, FIRST-
ABC, LAUNCHES-QI, Neuro-PACK, OXY-PICU, PERMIT, PREVAIL and QualDash.
54 PICANet 2020 annual summary report
Small number policy
Publication of PICANet data is subject to scrutiny of small numbers. When small numbers of
admissions are involved, other data items may become identifiable i.e. a living individual may
be identified from the data. This is still the case in aggregated data where small groups of
individuals are presented. These are reviewed and in some cases, categories are combined
or cells anonymised where necessary.
Outlier policy
When unusual performance is detected following routine or bespoke analysis, which
suggests that a PICU is an outlier, PICANet follow the established procedure outlined in our
outlier policy, which relates specifically to assessment of risk-adjusted mortality.
Historically there have been three specific occasions where PICUs have been identified as
outliers with excess risk-adjusted mortality. In two of these cases this was attributable to data
quality issues and when corrected, the outliers fell within normal limits. In one case this was
not attributable to data quality and resulted in internal and external reviews.
Links with the clinical community, patients and their families
PICANet has until recently had an active PICU Families Group comprising both Lay
representatives (parents of children who are currently or have previously received paediatric
intensive care) and a multidisciplinary group of health professionals including Family Liaison
Sisters, critical care nurses, audit staff, PIC consultants and members of the PICANet team.
Availability of Lay representatives has become difficult over recent years and so we are
developing a Lay stakeholder group encompassing any PIC or disease specific support
group that deals with parent or child PIC related issues to feed into the future development of
PICANet. In addition, we have a standing lay representative on our Steering Group and work
closely with the charity Well Child. To date, all communications we have had from
patients/parents have been very positive, supporting PICANet and its work and requesting
further information.
PICANet has the support of the Paediatric Intensive Care Society and the associated PICS
Study Group, the PICANet Clinical Advisory Group and the Clinical Reference group which
oversees Paediatric Critical Care and PCC transport.
Additional information 55
Glossary
CAG Clinical Advisory Group
CCG Clinical Commissioning Group
CHI Community Health Index
CTS Central Transport Services
EC Enhanced care
ECLS Extracorporeal life support
ECMO Extracorporeal membrane oxygenation
GDPR General Data Protection Regulation
HD High dependency
HFNCT High flow nasal cannula therapy
HQIP Healthcare Quality Improvement Partnership
HRA Health Research Authority
HRG Healthcare Resource Group
IC Intensive Care
NCAPOP National Clinical Audit and Patient Outcomes Programme
NHS National Health Service
NOCA National Office of Clinical Audit
PIC Paediatric Intensive Care
PICANet Paediatric Intensive Care Audit
PICS Paediatric Intensive Care Society
PCCS Paediatric Critical Care Society
PICU Paediatric Intensive Care Unit
PIM3 Paediatric Index of Mortality 3
RA-RSPRT Risk Adjusted Resetting Sequential Probability Ratio Test
ROI Republic of Ireland
SG Steering Group
SMR Standardised mortality ratio
UK United Kingdom
WHSSC Welsh Health Specialised Service Committee
WTE Whole time equivalent

Richard Feltbower
Hannah Buckley
Sophie Butler
Victoria Hiley
Lee Norman
Benjamin Fox
PICANet
Leeds Institute for Data Analytics
School of Medicine
University of Leeds
Clarendon Way
Leeds
LS2 9JT
Elizabeth Draper
Caroline Lamming
Lyn Palmer
Martin Perkins
Sarah Seaton
PICANet
Department of Health Sciences
University of Leicester
George Davies Centre
University Road
Leicester
LE1 7RH
University of Leicester
University of Leeds
www.picanet.org.uk