Embed Size (px)
Citation preview

RegionVoting IntentionSocial ClassAgeSexMid-Don'tConser
SouthlandsNorthknowOtherLibDemLabourvativeDEC2C1AB65+35-6425-3418-24FemaleMaleTotal
70461767930378152560397508480567445381109033719211088922000Unweighted base
7136126753059116654237854543755246540198939321710289722000Weighted base
41538039213056107390286338236318294315611178826155721187Absolutely certain (10)58%62%58%43%61%64%72%76%62%54%58%63%78%62%45%38%60%59%59%to vote
3032371410152921212232249581814386198(9)4%5%5%4%11%9%5%5%4%5%6%5%2%6%5%6%4%6%5%
4431353641232132528381986520175356109(8)6%5%5%12%5%7%6%3%5%6%7%4%2%7%5%8%5%6%5%
25112915281914111722168242212313566(7)4%2%4%5%3%5%4%4%2%4%4%3%2%2%6%6%3%4%3%
20141218-31671810612816184202546(6)3%2%2%6%-2%3%2%3%2%1%2%2%2%4%2%2%3%2%
503248611211291329373431106334237357130(5)7%5%7%20%13%6%5%4%5%8%6%7%2%6%9%10%7%6%7%
738222725562-114310818(4)1%1%1%1%2%1%1%1%1%1%1%*-1%1%1%1%1%1%
111513948109128127416810211839(3)2%2%2%3%4%5%2%2%2%2%2%2%1%2%2%4%2%2%2%
856911343484-95561219(2)1%1%1%3%1%1%1%1%1%1%1%1%-1%1%2%1%1%1%
947887-----70657252251068146139120259Certain not to vote (1)13%13%13%-----13%15%13%11%6%11%21%21%14%12%13%
911911--810156541584122729Don't know1%2%1%4%--1%3%3%1%1%1%4%1%1%1%2%1%1%
7.807.987.827.768.578.779.089.237.977.557.818.109.008.116.866.487.827.907.86Mean
0.120.130.130.140.260.170.080.090.150.150.140.150.130.090.200.260.100.110.07Standard error
Page 1
BBC PollFieldwork:- 30th May - 4th June 2001
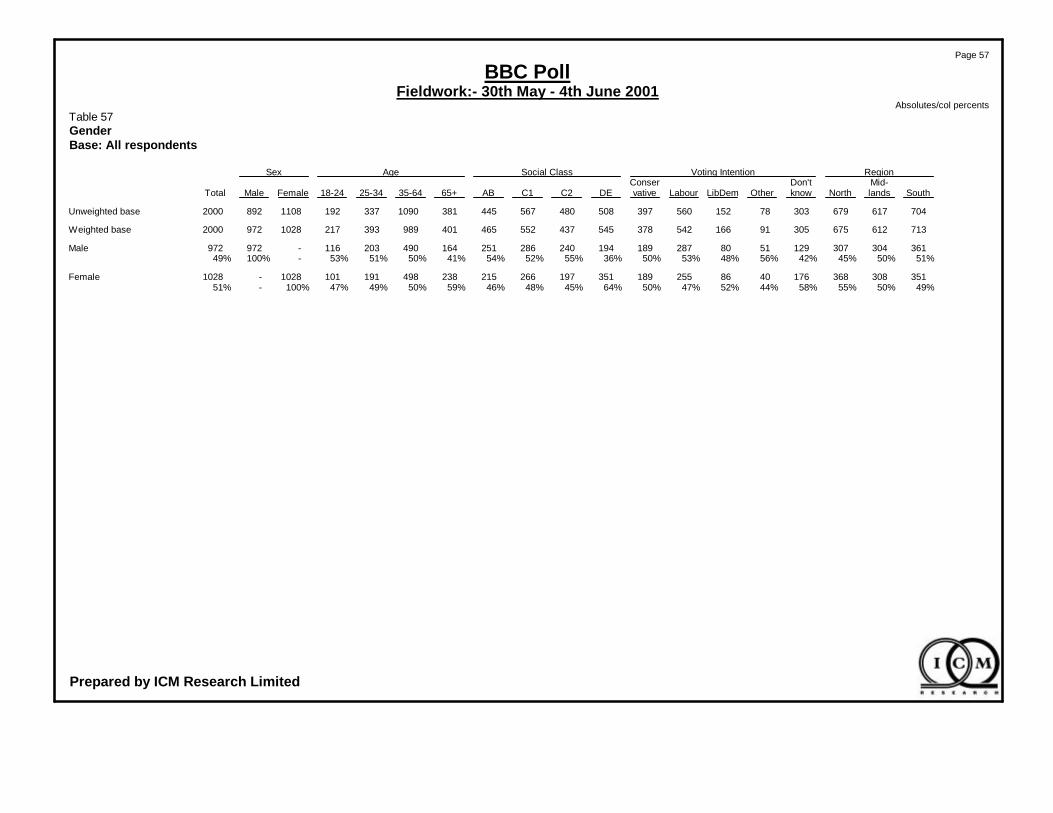
Absolutes/col percentsTable 1Q.1 The general election is to be held on June 7th. Many people we have spoken to have said they willnot vote, while others have said they will vote. Can you tell me how certain it is that you would go and vote?Base: All respondents
Prepared by ICM Research Limited

RegionVoting IntentionSocial ClassAgeSexMid-Don'tConser
SouthlandsNorthknowOtherLibDemLabourvativeDEC2C1AB65+35-6425-3418-24FemaleMaleTotal
70461767930378152560397508480567445381109033719211088922000Unweighted base
7136126753059116654237854543755246540198939321710289722000Weighted base
150125103----37810574871131021945132189189378Conservative21%20%15%----100%19%17%16%24%26%20%13%15%18%19%19%
168174199---542-170123154959626711860255287542Labour24%28%30%---100%-31%28%28%20%24%27%30%28%25%29%27%
783950--166--31246447319622178680166Liberal Democrat/11%6%7%--100%--6%6%12%10%8%10%6%8%8%8%8%Liberal
2-26-29---8910241671121629Scottish National*-4%-31%---1%2%2%1%1%2%2%*1%2%1%Party/SNP
-19--19---64722114210919Plaid Cymru-3%--21%---1%1%1%**1%1%1%1%1%1%
1184-22---6484378514822Green Party1%1%1%-25%---1%1%1%1%1%1%2%2%1%1%1%
322-6---2-3242--256UKIP***-7%---*-1%*1%*--***
266-14---5316294-21214Other*1%1%-16%---1%1%*1%*1%1%-*1%1%
27910-----1271217215219232447Not registered4%2%2%-----2%2%2%4%*2%5%4%2%2%2%
636774-----575758332289603411293205Decided not to vote9%11%11%-----10%13%11%7%6%9%15%16%11%10%10%
312-----112312-4437Don‘t know why won’t***-----***1%**-2%***vote
966796-----7452696492134257143116259Refused13%11%14%-----13%12%13%14%23%14%6%3%14%12%13%
10994102305----70797779391467346176129305Don't know15%15%15%100%----13%18%14%17%10%15%19%21%17%13%15%
Page 2
BBC PollFieldwork:- 30th May - 4th June 2001
Absolutes/col percentsTable 2Q.2/3 Voting IntentionBase: All respondents
Prepared by ICM Research Limited

RegionVoting IntentionSocial ClassAgeSexMid-Don'tConser
SouthlandsNorthknowOtherLibDemLabourvativeDEC2C1AB65+35-6425-3418-24FemaleMaleTotal
408381398-781525603973062763452602296631891066205671187Unweighted base
414373390-911665423783322413342702446022141165706071177Weighted base
150125103----37810574871131021945132189189378Conservative36%34%26%----100%31%31%26%42%42%32%24%27%33%31%32%
168174199---542-170123154959626711860255287542Labour41%47%51%---100%-51%51%46%35%39%44%55%51%45%47%46%
783950--166--31246447319622178680166Liberal Democrat/19%10%13%--100%--9%10%19%17%13%16%10%15%15%13%14%Liberal
2-26-29---8910241671121629Scottish National*-7%-31%---2%4%3%1%2%3%3%1%2%3%2%Party/SNP
-19--19---64722114210919Plaid Cymru-5%--21%---2%2%2%1%1%2%2%2%2%2%2%
1184-22---6484378514822Green Party3%2%1%-25%---2%2%2%1%1%1%4%4%2%1%2%
322-6---2-3242--256UKIP1%**-7%---1%-1%1%2%*--*1%1%
266-14---5316294-21214Other1%2%2%-16%---1%1%*2%1%1%2%-*2%1%
Page 3
BBC PollFieldwork:- 30th May - 4th June 2001
Absolutes/col percentsTable 3Q.2/3 Voting IntentionBase: All respondents expressing an intention to vote
Prepared by ICM Research Limited

RegionVoting IntentionSocial ClassAgeSexMid-Don'tConser
SouthlandsNorthknowOtherLibDemLabourvativeDEC2C1AB65+35-6425-3418-24FemaleMaleTotal
354339338-62127491351263232298238213584152825275041031Unweighted base
356333328-72142470333284199288247225530173904805381018Weighted base
14011281----333936177103941754222166167333Conservative39%34%25%----100%33%31%27%42%42%33%25%25%35%31%33%
140159171---470-14510213389872419349210260470Labour39%48%52%---100%-51%51%46%36%39%45%54%54%44%48%46%
643344--142--27195342308020117369142Liberal Democrat/18%10%13%--100%--9%10%19%17%13%15%12%13%15%13%14%Liberal
2-21-23---6610141261101323Scottish National1%-7%-32%---2%3%3%1%2%2%3%1%2%3%2%Party/SNP
-16--16---5462210227916Plaid Cymru-5%--22%---2%2%2%1%1%2%1%2%1%2%2%
964-18---3483356512618Green Party2%2%1%-25%---1%2%3%1%1%1%3%5%3%1%2%
122-4---2-124---134UKIP**1%-6%---1%-*1%2%---*1%*
155-11---43-4262-11011Other*1%1%-15%---1%1%-2%1%1%1%-*2%1%
Page 4
BBC PollFieldwork:- 30th May - 4th June 2001
Absolutes/col percentsTable 4Q.2/3 Voting IntentionBase: All respondents expressing an intention to vote and saying likely to vote
Prepared by ICM Research Limited
Q.26-28 Voting in 1997 General ElectionNot
Don'tregis-know whytered/DecidedRefer-
Don’tdidn‘ttoo youngnot toendumPlaidLiberalConser-knowRefusedvoteto votevoteOtherPartyCymruSNPDemocratLabourvativeTotal
3013428858519510141215993671497Unweighted base
25114268610125614191655443341460Weighted base
3-4142771--2129227333Conservative11%-17%16%27%27%23%--13%5%68%23%
2-1237203-421336215470Labour7%-46%43%20%11%-30%12%8%67%5%32%
3-1811111-77308142Liberal Democrat/14%-3%9%11%3%18%9%-47%6%2%10%Liberal
3-12-1--13-3-23Scottish National12%-4%2%-5%--69%-1%-2%Party/SNP
-----2-9--6-16Plaid Cymru-----6%-60%--1%-1%
---216---44-18Green Party---2%1%24%---3%1%-1%
-----2-----24UKIP-----7%-----1%*
-1-2-11--23111Other-1%-2%-5%14%--1%1%*1%
410027143---215144248Refused14%87%9%9%14%12%---13%9%13%17%
111451427-3-4265536195Don't know42%12%21%17%27%-45%-19%16%10%11%13%
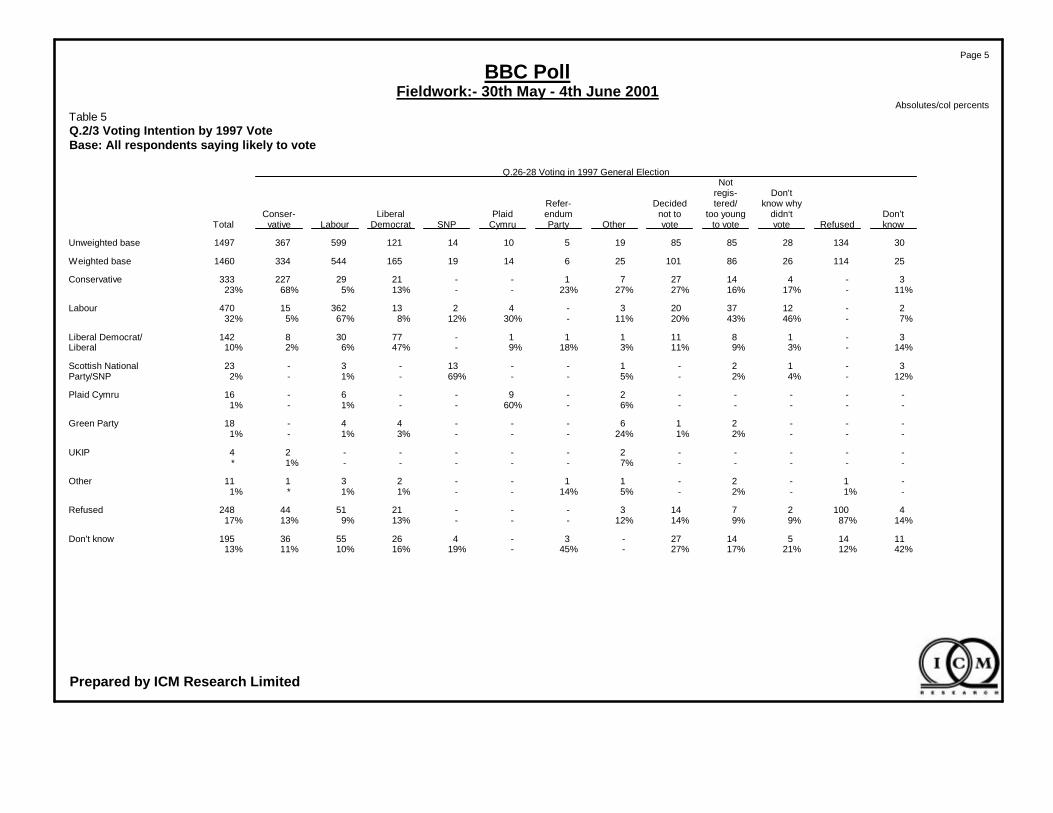
Page 5
BBC PollFieldwork:- 30th May - 4th June 2001
Absolutes/col percentsTable 5Q.2/3 Voting Intention by 1997 VoteBase: All respondents saying likely to vote
Prepared by ICM Research Limited

RegionVoting IntentionSocial ClassAgeSexMid-Don'tConser
SouthlandsNorthknowOtherLibDemLabourvativeDEC2C1AB65+35-6425-3418-24FemaleMaleTotal
70461767930378152560397508480567445381109033719211088922000Unweighted base
7136126753059116654237854543755246540198939321710289722000Weighted base
15914311539---37811280991271052185935207211417Conservative22%23%17%13%---100%21%18%18%27%26%22%15%16%20%22%21%
19118922562--542-18414117510410629213473297307604Labour27%31%33%20%--100%-34%32%32%22%26%30%34%34%29%32%30%
88446126-166--3530715733110262410389192Liberal Democrat/12%7%9%9%-100%--6%7%13%12%8%11%7%11%10%9%10%Liberal
2-30329---91110251872151732Scottish National*-4%1%31%---2%2%2%1%1%2%2%1%1%2%2%Party/SNP
-20-119---65722115211920Plaid Cymru-3%-*21%---1%1%1%**1%1%1%1%1%1%
1294222---6486398515924Green Party2%1%1%1%25%---1%1%1%1%1%1%2%2%1%1%1%
322-6---2-3242--256UKIP***-7%---*-1%*1%*--***
267114---53172104-21315Other*1%1%*16%---1%1%*1%*1%1%-*1%1%
27910-----1271217215219232447Not registered4%2%2%-----2%2%2%4%*2%5%4%2%2%2%
636774-----575758332289603411293205Decided not to vote9%11%11%-----10%13%11%7%6%9%15%16%11%10%10%
312-----112312-4437Don‘t know why won’t***-----***1%**-2%***vote
9768963----7453716493135267146116261Refused14%11%14%1%----13%12%13%14%23%14%7%3%14%12%13%
665548168----44473543257745229276168Don't know9%9%7%55%----8%11%6%9%6%8%11%10%9%8%8%
Page 6
BBC PollFieldwork:- 30th May - 4th June 2001
Absolutes/col percentsTable 6Q.2/4 Voting Intention (including Squeeze)Base: All respondents
Prepared by ICM Research Limited

RegionVoting IntentionSocial ClassAgeSexMid-Don'tConser
SouthlandsNorthknowOtherLibDemLabourvativeDEC2C1AB65+35-6425-3418-24FemaleMaleTotal
448418453132781525603973313103852932427332151297046151319Unweighted base
456412444134911665423783582733743062596702421416516601311Weighted base
15914311539---37811280991271052185935207211417Conservative35%35%26%29%---100%31%29%26%41%41%33%24%25%32%32%32%
19118922562--542-18414117510410629213473297307604Labour42%46%51%46%--100%-51%52%47%34%41%44%55%52%46%46%46%
88446126-166--3530715733110262410389192Liberal Democrat/19%11%14%19%-100%--10%11%19%19%13%16%11%17%16%14%15%Liberal
2-30329---91110251872151732Scottish National*-7%3%31%---2%4%3%1%2%3%3%1%2%3%2%Party/SNP
-20-119---65722115211920Plaid Cymru-5%-1%21%---2%2%2%*1%2%2%2%2%1%2%
1294222---6486398515924Green Party3%2%1%1%25%---2%2%2%2%1%1%3%3%2%1%2%
322-6---2-3242--256UKIP1%**-7%---*-1%1%2%*--*1%*
267114---53172104-21315Other*1%2%1%16%---1%1%*2%1%1%1%-*2%1%
Page 7
BBC PollFieldwork:- 30th May - 4th June 2001
Absolutes/col percentsTable 7Q.2/4 Voting Intention (including Squeeze)Base: All respondents expressing an intention to vote
Prepared by ICM Research Limited
RegionVoting IntentionSocial ClassAgeSexMid-Don'tConser
SouthlandsNorthknowOtherLibDemLabourvativeDEC2C1AB65+35-6425-3418-24FemaleMaleTotal
3843643799662127491351282257328260223634174965915361127Unweighted base
38935936999721424703333042233182712365791961055425741116Weighted base
1461249027---333986485113951954723177183360Conservative38%34%24%27%---100%32%29%27%41%40%34%24%22%33%32%32%
15816819146--470-155115150969425610858242274516Labour41%47%52%47%--100%-51%52%47%35%40%44%55%55%45%48%46%
72385321-142--30255751319224168875163Liberal Democrat/19%11%14%22%-100%--10%11%18%19%13%16%12%15%16%13%15%Liberal
2-25323---7810151462121427Scottish National1%-7%4%32%---2%4%3%*2%2%3%2%2%3%2%Party/SNP
-17-116---5562210328917Plaid Cymru-5%-1%22%---2%2%2%1%1%2%2%2%1%2%2%
964-18---3483356512618Green Party2%2%1%-25%---1%2%3%1%1%1%3%4%2%1%2%
122-4---2-124---134UKIP***-6%---1%-*1%2%---*1%*
155-11---43-4262-11011Other*1%1%-15%---1%1%-2%1%1%1%-*2%1%
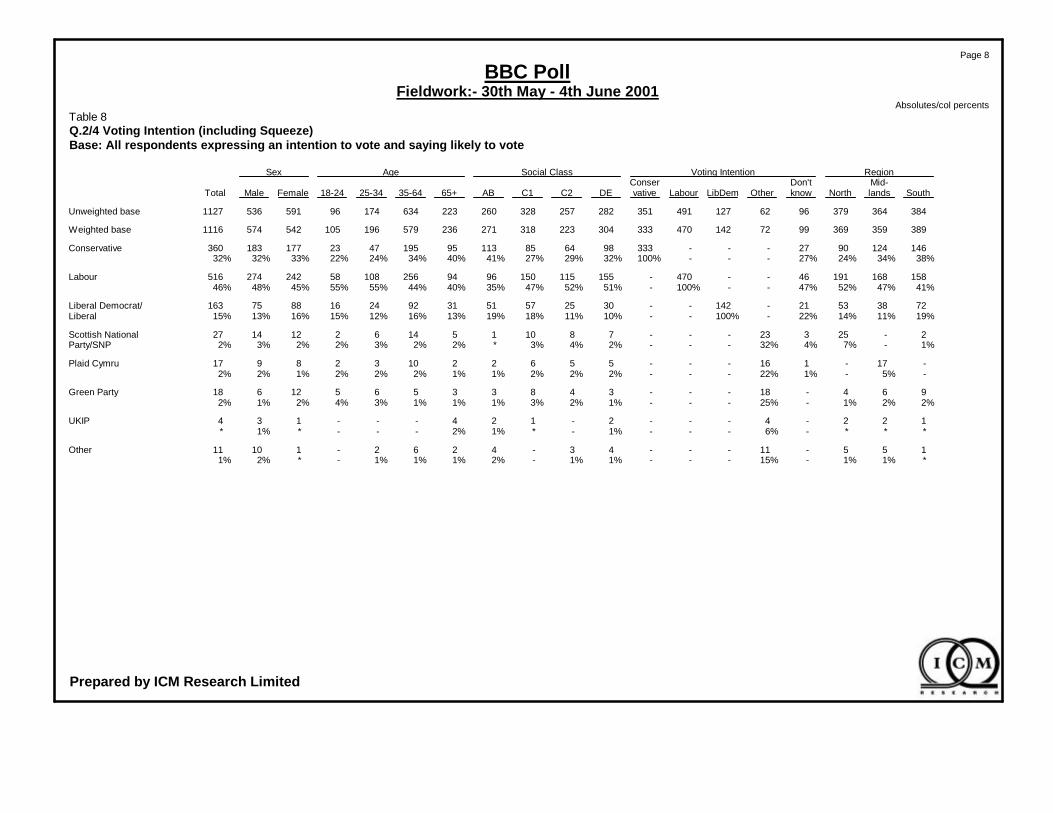
Page 8
BBC PollFieldwork:- 30th May - 4th June 2001
Absolutes/col percentsTable 8Q.2/4 Voting Intention (including Squeeze)Base: All respondents expressing an intention to vote and saying likely to vote
Prepared by ICM Research Limited

Q.26-28 Voting in 1997 General ElectionNot
Don'tregis-know whytered/DecidedRefer-
Don’tdidn‘ttoo youngnot toendumPlaidLiberalConser-knowRefusedvoteto votevoteOtherPartyCymruSNPDemocratLabourvativeTotal
3013428858519510141215993671497Unweighted base
25114268610125614191655443341460Weighted base
3-5173171--2336237360Conservative11%-21%20%31%27%23%--14%7%71%25%
3-1241273-421638919516Labour13%-46%47%27%11%-30%12%10%71%6%35%
312812141-873310163Liberal Democrat/14%1%9%9%12%3%63%9%-53%6%3%11%Liberal
3-12-1--14-5127Scottish National12%-4%2%-5%--74%-1%*2%Party/SNP
-----2-9--7-17Plaid Cymru-----6%-60%--1%-1%
---216---44-18Green Party---2%1%24%---3%1%-1%
-----2-----24UKIP-----7%-----1%*
-1-2-11--23111Other-1%-2%-5%14%--1%1%*1%
410137143---215245251Refused14%88%12%9%14%12%---13%10%13%17%
9122715---311161994Don't know36%11%8%8%15%---14%6%3%6%6%
Page 9
BBC PollFieldwork:- 30th May - 4th June 2001
Absolutes/col percentsTable 9Q.2/4 Voting Intention (including Squeeze) by 1997 VoteBase: All respondents saying likely to vote
Prepared by ICM Research Limited

RegionVoting IntentionSocial ClassAgeSexMid-Don'tConser
SouthlandsNorthknowOtherLibDemLabourvativeDEC2C1AB65+35-6425-3418-24FemaleMaleTotal
24621520764417927920517015718815312436710176337331668Unweighted base
23920521766478626919318313918115813033612273316345661Weighted base
2618251231637-1216212014281413353569Conservative11%9%12%18%7%19%14%-7%12%12%12%11%8%11%18%11%10%10%
463438141945-3925213834204929195562117Labour19%16%18%22%41%52%-20%14%15%21%21%16%15%24%26%18%18%18%
9298892912-1528579647164501515028126152279Liberal Democrat/38%48%41%44%26%-57%44%43%46%39%41%38%45%41%37%40%44%42%Liberal
22241121951357361931161228Scottish National1%1%11%2%2%3%7%2%7%4%4%2%4%6%2%1%5%3%4%Party/SNP
-4----4-113--4-1224Plaid Cymru-2%----2%-1%*1%--1%-1%1%1%1%
1565126116541165135381826Green Party6%3%2%2%4%7%4%3%3%3%6%4%4%4%4%4%2%5%4%
751--1110322528114812UKIP3%2%*--1%1%5%2%2%1%3%2%3%1%1%1%2%2%
1145-31312103155114-11920Refused5%2%2%-7%1%1%6%6%2%*3%4%3%3%-3%3%3%
413530861541363422292128521796046106Don't know17%17%14%12%13%17%15%19%18%16%16%13%22%16%14%12%19%13%16%
Page 10
BBC PollFieldwork:- 30th May - 4th June 2001
Absolutes/col percentsTable 10Q.5 If the voting paper required you to give two votes in order of preference,which party would you put as your second choice?Base: All ‘Version A’ respondents expressing an intention to vote
Prepared by ICM Research Limited

RegionVoting IntentionSocial ClassAgeSexMid-Don'tConser
SouthlandsNorthknowOtherLibDemLabourvativeDEC2C1AB65+35-6425-3418-24FemaleMaleTotal
3643123111434179279205250236277224191533156107533454987Unweighted base
3503043321474786269193270216272229199484196108508479987Weighted base
14110213253204214251989210085611957545180195375Resign as leader40%33%40%36%42%49%53%26%36%42%37%37%31%40%38%41%35%41%38%
12611611960162670122936710694761775849180180361Remain as leader36%38%36%41%34%30%26%63%34%31%39%41%38%37%30%45%35%38%37%
463---2-3271543-9413Refused1%2%1%---1%-1%1%3%*3%1%2%-2%1%1%
79807934111856207655584956108591513999238Don't know23%26%24%23%24%21%21%10%28%25%21%21%28%22%30%14%27%21%24%
Page 11
BBC PollFieldwork:- 30th May - 4th June 2001
Absolutes/col percentsTable 11Q.6 If the Conservatives lose the election, do you think William Hague should resign as leaderof the Conservatives or do you think he should remain as leader?Base: All ‘Version A’ respondents
Prepared by ICM Research Limited

Conservative VotingVoting
EverConser-votedvative
NeverConser-thisvotedvative,election
Conser-not this- inclvativeelectionSqueezeTotal
539222226987Unweighted base
549223214987Weighted base
21410258375Resign as leader39%46%27%38%
15575130361Remain as leader28%34%61%37%
13--13Refused2%--1%
1674626238Don't know30%21%12%24%
Page 12
BBC PollFieldwork:- 30th May - 4th June 2001
Absolutes/col percentsTable 12Q.6 If the Conservatives lose the election, do you think William Hague should resign as leaderof the Conservatives or do you think he should remain as leader?Base: All ‘Version A’ respondents
Prepared by ICM Research Limited

RegionVoting IntentionSocial ClassAgeSexMid-Don'tConser
SouthlandsNorthknowOtherLibDemLabourvativeDEC2C1AB65+35-6425-3418-24FemaleMaleTotal
3643123111434179279205250236277224191533156107533454987Unweighted base
3503043321474786269193270216272229199484196108508479987Weighted base
6673612872974235534595249108271682118200Ken Clarke19%24%18%19%14%34%28%12%20%16%22%23%25%22%14%15%16%25%20%
13127421691178561664181532Iain Duncan Smith4%4%2%3%5%1%2%5%4%3%3%2%3%3%3%4%4%3%3%
79647622172060664649675735116501884134218Michael Portillo22%21%23%15%36%23%22%34%17%23%24%25%18%24%25%16%17%28%22%
51425828414373939404626337221259457151Ann Widdecombe14%14%18%19%8%17%14%20%14%19%17%11%16%15%11%23%18%12%15%
4673-32544352112251217Someone else1%2%2%2%-3%1%3%1%2%1%2%1%2%1%2%1%3%2%
38183616343082020242915422611454893None of these11%6%11%11%6%5%11%4%7%9%9%13%8%9%13%10%9%10%9%
232--121213-33-1436Refused*1%1%--1%1%*1%1%1%-1%1%-1%1%1%1%
99868445141458419359625556117643217891269Don't know28%28%25%31%30%17%22%21%34%28%23%24%28%24%33%29%35%19%27%
Page 13
BBC PollFieldwork:- 30th May - 4th June 2001
Absolutes/col percentsTable 13Q.7 If Mr Hague were to resign, who do you think would be the best person to lead theConservative party - Ken Clarke, Iain Duncan Smith, Michael Portillo or Ann Widdecombe?Base: All ‘Version A’ respondents
Prepared by ICM Research Limited

Conservative VotingVoting
EverConser-votedvative
NeverConser-thisvotedvative,election
Conser-not this- inclvativeelectionSqueezeTotal
539222226987Unweighted base
549223214987Weighted base
1166024200Ken Clarke21%27%11%20%
12101032Iain Duncan Smith2%4%5%3%
985170218Michael Portillo18%23%33%22%
763243151Ann Widdecombe14%14%20%15%
66517Someone else1%3%2%2%
64171293None of these12%8%6%9%
5116Refused1%**1%
1724749269Don't know31%21%23%27%
Page 14
BBC PollFieldwork:- 30th May - 4th June 2001
Absolutes/col percentsTable 14Q.7 If Mr Hague were to resign, who do you think would be the best person to lead theConservative party - Ken Clarke, Iain Duncan Smith, Michael Portillo or Ann Widdecombe?Base: All ‘Version A’ respondents
Prepared by ICM Research Limited

RegionVoting IntentionSocial ClassAgeSexMid-Don'tConser
SouthlandsNorthknowOtherLibDemLabourvativeDEC2C1AB65+35-6425-3418-24FemaleMaleTotal
3643123111434179279205250236277224191533156107533454987Unweighted base
3503043321474786269193270216272229199484196108508479987Weighted base
977976311533110950527971371305233102150252Vote to join28%26%23%21%32%39%41%5%19%24%29%31%18%27%27%31%20%31%26%
21118421595284112117218314515412813129511766331279610Vote not to join60%60%65%65%59%48%45%89%68%67%56%56%66%61%60%61%65%58%62%
124---11-22342-1527Refused*1%1%---*1%-1%1%1%2%1%-1%1%*1%
4139382041238113717372727562786948118Don't know12%13%11%14%10%14%14%6%14%8%14%12%13%12%14%8%14%10%12%
Page 15
BBC PollFieldwork:- 30th May - 4th June 2001
Absolutes/col percentsTable 15Q.8 If there were to be a referendum would you vote to join the Single European Currency or vote not to join?Base: All ‘Version A’ respondents
Prepared by ICM Research Limited

Conservative VotingVoting
EverConser-votedvative
NeverConser-thisvotedvative,election
Conser-not this- inclvativeelectionSqueezeTotal
539222226987Unweighted base
549223214987Weighted base
1756513252Vote to join32%29%6%26%
284137189610Vote not to join52%61%88%62%
5117Refused1%1%1%1%
862111118Don't know16%9%5%12%
Page 16
BBC PollFieldwork:- 30th May - 4th June 2001
Absolutes/col percentsTable 16Q.8 If there were to be a referendum would you vote to join the Single European Currency or vote not to join?Base: All ‘Version A’ respondents
Prepared by ICM Research Limited

RegionVoting IntentionSocial ClassAgeSexMid-Don'tConser
SouthlandsNorthknowOtherLibDemLabourvativeDEC2C1AB65+35-6425-3418-24FemaleMaleTotal
3643123111434179279205250236277224191533156107533454987Unweighted base
3503043321474786269193270216272229199484196108508479987Weighted base
12287964019381322371599382521575442138167306Vote to join35%29%29%28%41%44%49%12%26%27%34%36%26%32%28%39%27%35%31%
18416920090253410215615913414711311326911160282271553Vote not to join53%56%60%61%53%39%38%81%59%62%54%49%57%56%57%56%55%57%56%
112----11-1222--4-4Refused**1%----**-*1%1%*--1%-*
4347351631435123823313232563068440125Don't know12%15%11%11%6%17%13%6%14%11%11%14%16%12%16%6%17%8%13%
Page 17
BBC PollFieldwork:- 30th May - 4th June 2001
Absolutes/col percentsTable 17Q.9 What if the government were to come out in favour of joining the Single European Currency arguingthat Britain would be better off? How do you think you might vote then? Would you vote to join the single Europeancurrency or vote not to join?Base: All ‘Version A’ respondents
Prepared by ICM Research Limited

RegionVoting IntentionSocial ClassAgeSexMid-Don'tConser
SouthlandsNorthknowOtherLibDemLabourvativeDEC2C1AB65+35-6425-3418-24FemaleMaleTotal
3643123111434179279205250236277224191533156107533454987Unweighted base
3503043321474786269193270216272229199484196108508479987Weighted base
837570242881495344636751121322499129228Conservative24%25%21%16%5%9%3%77%20%20%23%29%25%25%16%22%19%27%23%
119901222814192204107749060611616742150180331Labour34%30%37%19%30%22%82%2%40%34%33%26%31%33%34%39%30%38%34%
28222010433621111272112291613313970Liberal Democrat/8%7%6%7%8%38%2%1%4%5%10%9%6%6%8%12%6%8%7%Liberal
--421-----22-4--134Scottish National--1%1%2%-----1%1%-1%--*1%*Party/SNP
-4--4---2-3--4--414Plaid Cymru-1%--9%---1%-1%--1%--1%**
13321---34---43-256Green Party*1%1%1%2%---1%2%---1%1%-*1%1%
1---1-----1-1---1-1UKIP*---2%-----*-*---*-*
1599554245571781952151934Other4%3%3%3%10%4%1%2%2%2%3%7%4%4%3%2%3%4%3%
14691-1-45612581721181128Refused4%2%3%*-1%-2%2%3%4%2%4%4%1%1%3%2%3%
90969675152232298472685758126712718893282Don't know26%31%29%51%32%25%12%15%31%34%25%25%29%26%36%25%37%19%29%
Page 18
BBC PollFieldwork:- 30th May - 4th June 2001
Absolutes/col percentsTable 18Q.10 Which party do you trust most to take the right decisions about Britain's relations with Europe?Base: All ‘Version A’ respondents
Prepared by ICM Research Limited
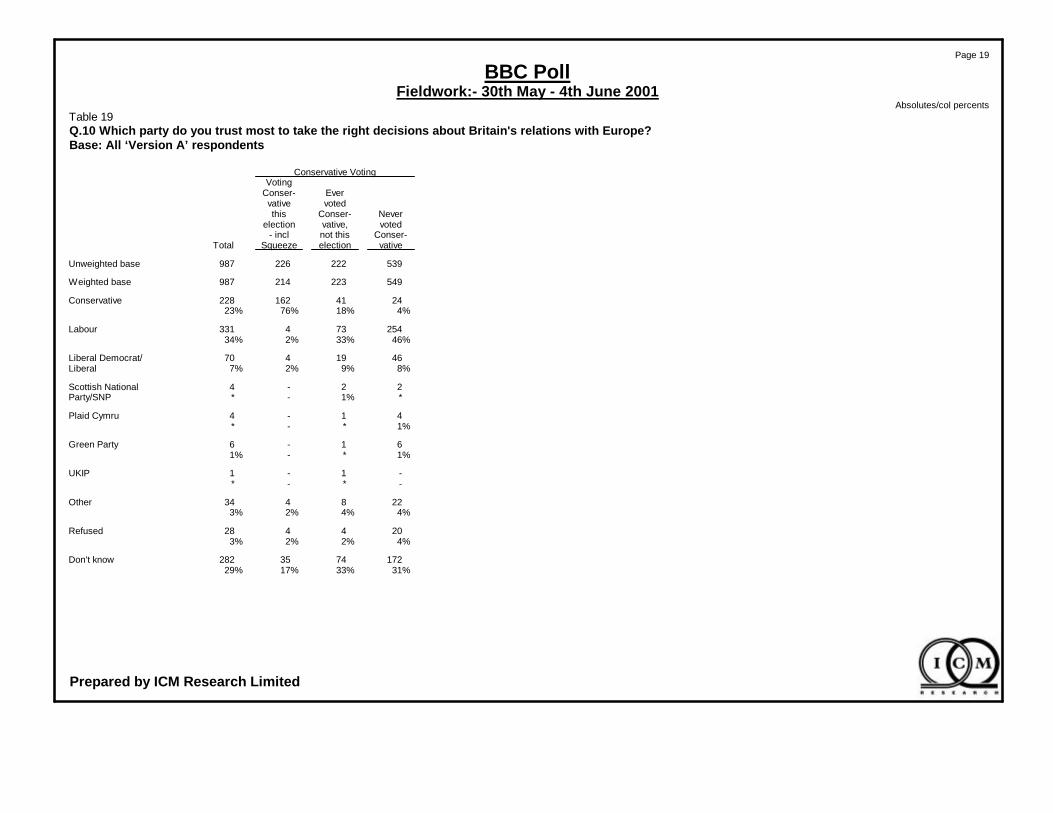
Conservative VotingVoting
EverConser-votedvative
NeverConser-thisvotedvative,election
Conser-not this- inclvativeelectionSqueezeTotal
539222226987Unweighted base
549223214987Weighted base
2441162228Conservative4%18%76%23%
254734331Labour46%33%2%34%
4619470Liberal Democrat/8%9%2%7%Liberal
22-4Scottish National*1%-*Party/SNP
41-4Plaid Cymru1%*-*
61-6Green Party1%*-1%
-1-1UKIP-*-*
228434Other4%4%2%3%
204428Refused4%2%2%3%
1727435282Don't know31%33%17%29%
Page 19
BBC PollFieldwork:- 30th May - 4th June 2001
Absolutes/col percentsTable 19Q.10 Which party do you trust most to take the right decisions about Britain's relations with Europe?Base: All ‘Version A’ respondents
Prepared by ICM Research Limited

RegionVoting IntentionSocial ClassAgeSexMid-Don'tConser
SouthlandsNorthknowOtherLibDemLabourvativeDEC2C1AB65+35-6425-3418-24FemaleMaleTotal
3643123111434179279205250236277224191533156107533454987Unweighted base
3503043321474786269193270216272229199484196108508479987Weighted base
248195217106356820010915613818418210432414786304355660Continue to be a member71%64%65%72%75%79%74%57%58%64%68%79%52%67%75%79%60%74%67%
6671632291539597147522959110191110297199Withdraw19%23%19%15%20%17%14%31%26%22%19%13%30%23%10%11%20%20%20%
-12-----1-2-21--3-3Refused-*1%-----*-1%-1%*--1%-*
3638511933312542313418344930119927125Don't know10%12%15%13%5%4%12%13%15%14%13%8%17%10%16%11%19%6%13%
Page 20
BBC PollFieldwork:- 30th May - 4th June 2001
Absolutes/col percentsTable 20Q.11 Do you think Britain should continue to be a member of the European Union or should it withdraw?Base: All ‘Version A’ respondents
Prepared by ICM Research Limited
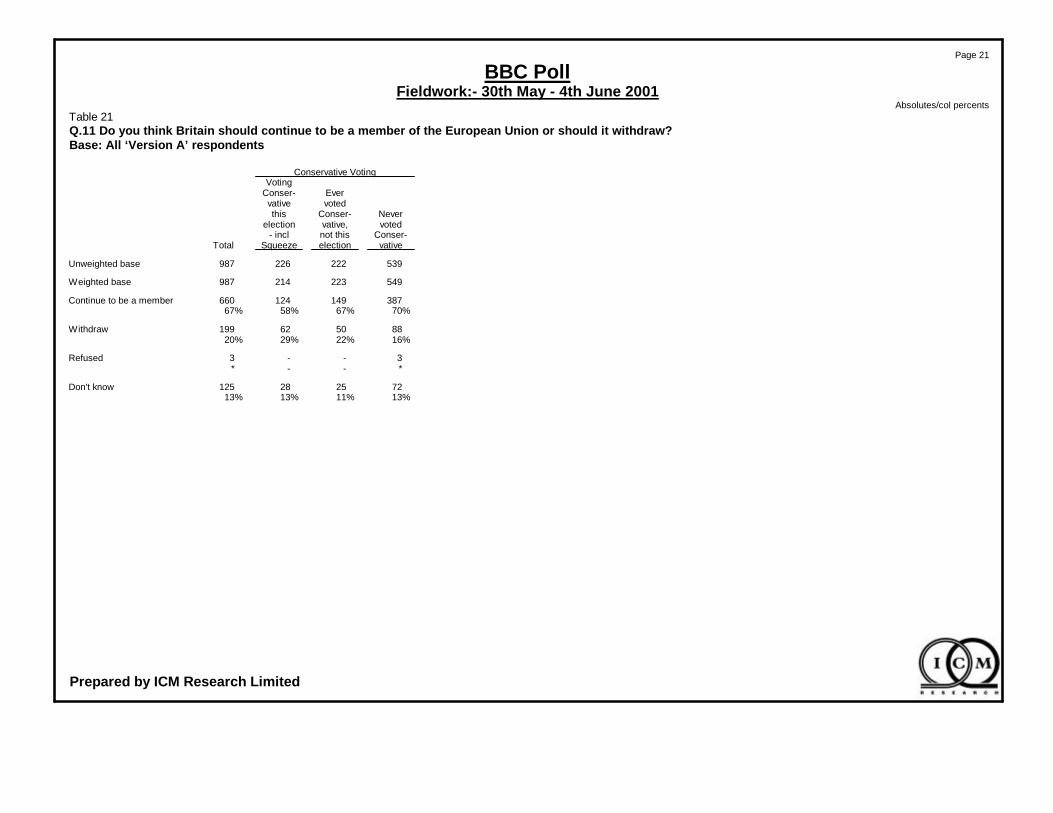
Conservative VotingVoting
EverConser-votedvative
NeverConser-thisvotedvative,election
Conser-not this- inclvativeelectionSqueezeTotal
539222226987Unweighted base
549223214987Weighted base
387149124660Continue to be a member70%67%58%67%
885062199Withdraw16%22%29%20%
3--3Refused*--*
722528125Don't know13%11%13%13%
Page 21
BBC PollFieldwork:- 30th May - 4th June 2001
Absolutes/col percentsTable 21Q.11 Do you think Britain should continue to be a member of the European Union or should it withdraw?Base: All ‘Version A’ respondents
Prepared by ICM Research Limited

RegionVoting IntentionSocial ClassAgeSexMid-Don'tConser
SouthlandsNorthknowOtherLibDemLabourvativeDEC2C1AB65+35-6425-3418-24FemaleMaleTotal
3643123111434179279205250236277224191533156107533454987Unweighted base
3503043321474786269193270216272229199484196108508479987Weighted base
It doesn't really matter which party is in power, in the end things go on much the same
18318818910927451279515513116411010426613159292268560Agree52%62%57%74%58%52%47%49%57%61%60%48%52%55%67%54%57%56%57%
1621131333420411409610582102119862126050208199407Disagree46%37%40%23%42%48%52%50%39%38%37%52%43%44%31%46%41%42%41%
--1-------1-1---1-1Refused--*-------*-1%---*-*
6494--2210251864-71118Don't know2%1%3%3%--1%1%4%1%2%*4%1%2%-1%2%2%
Page 22
BBC PollFieldwork:- 30th May - 4th June 2001
Absolutes/col percentsTable 22Q.12 Agreement with statements - It doesn't really matter which party is in power, in the end things go on much the sameBase: All ‘Version A’ respondents
Prepared by ICM Research Limited

Likelihood ofVoting
Notlikely/less
likely toLikely tovote (1-vote (7-
6)10)Total
225749987Unweighted base
243731987Weighted base
It doesn't really matter which party is in power, in the end things go on much the same
188363560Agree77%50%57%
49355407Disagree20%49%41%
-11Refused-**
61118Don't know2%2%2%
Page 23
BBC PollFieldwork:- 30th May - 4th June 2001
Absolutes/col percentsTable 23Q.12 Agreement with statements - It doesn't really matter which party is in power, in the end things go on much the sameBase: All ‘Version A’ respondents
Prepared by ICM Research Limited

RegionVoting IntentionSocial ClassAgeSexMid-Don'tConser
SouthlandsNorthknowOtherLibDemLabourvativeDEC2C1AB65+35-6425-3418-24FemaleMaleTotal
3643123111434179279205250236277224191533156107533454987Unweighted base
3503043321474786269193270216272229199484196108508479987Weighted base
It is obvious who is going to win the election
21216719274286018510215411615714310928811361246324570Agree60%55%58%50%59%70%69%53%57%54%58%62%55%59%58%56%48%68%58%
1251221256717267485998610582781767544236136372Disagree36%40%38%46%35%30%28%44%37%40%39%36%39%36%38%41%46%28%38%
13161663-1061614104122094271845Don't know4%5%5%4%6%-4%3%6%7%4%2%6%4%4%3%5%4%5%
Page 24
BBC PollFieldwork:- 30th May - 4th June 2001
Absolutes/col percentsTable 24Q.12 Agreement with statements - It is obvious who is going to win the electionBase: All ‘Version A’ respondents
Prepared by ICM Research Limited

Likelihood ofVoting
Notlikely/less
likely toLikely tovote (1-vote (7-
6)10)Total
225749987Unweighted base
243731987Weighted base
It is obvious who is going to win the election
128440570Agree53%60%58%
97267372Disagree40%36%38%
182545Don't know8%3%5%
Page 25
BBC PollFieldwork:- 30th May - 4th June 2001
Absolutes/col percentsTable 25Q.12 Agreement with statements - It is obvious who is going to win the electionBase: All ‘Version A’ respondents
Prepared by ICM Research Limited
RegionVoting IntentionSocial ClassAgeSexMid-Don'tConser
SouthlandsNorthknowOtherLibDemLabourvativeDEC2C1AB65+35-6425-3418-24FemaleMaleTotal
3643123111434179279205250236277224191533156107533454987Unweighted base
3503043321474786269193270216272229199484196108508479987Weighted base
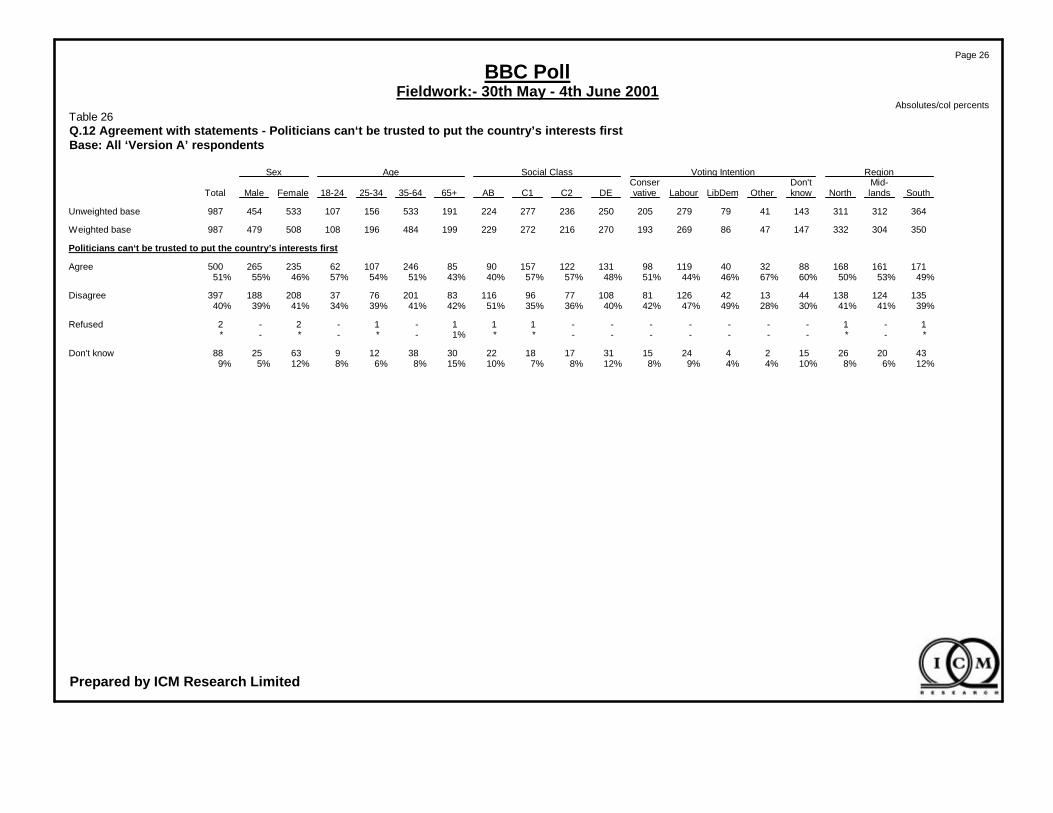
Politicians can‘t be trusted to put the country’s interests first
17116116888324011998131122157908524610762235265500Agree49%53%50%60%67%46%44%51%48%57%57%40%43%51%54%57%46%55%51%
135124138441342126811087796116832017637208188397Disagree39%41%41%30%28%49%47%42%40%36%35%51%42%41%39%34%41%39%40%
1-1-------111-1-2-2Refused*-*-------**1%-*-*-*
43202615242415311718223038129632588Don't know12%6%8%10%4%4%9%8%12%8%7%10%15%8%6%8%12%5%9%
Page 26
BBC PollFieldwork:- 30th May - 4th June 2001
Absolutes/col percentsTable 26Q.12 Agreement with statements - Politicians can‘t be trusted to put the country’s interests firstBase: All ‘Version A’ respondents
Prepared by ICM Research Limited

Likelihood ofVoting
Notlikely/less
likely toLikely tovote (1-vote (7-
6)10)Total
225749987Unweighted base
243731987Weighted base
Politicians can‘t be trusted to put the country’s interests first
157337500Agree65%46%51%
66326397Disagree27%45%40%
-22Refused-**
206688Don't know8%9%9%
Page 27
BBC PollFieldwork:- 30th May - 4th June 2001
Absolutes/col percentsTable 27Q.12 Agreement with statements - Politicians can‘t be trusted to put the country’s interests firstBase: All ‘Version A’ respondents
Prepared by ICM Research Limited

RegionVoting IntentionSocial ClassAgeSexMid-Don'tConser
SouthlandsNorthknowOtherLibDemLabourvativeDEC2C1AB65+35-6425-3418-24FemaleMaleTotal
3643123111434179279205250236277224191533156107533454987Unweighted base
3503043321474786269193270216272229199484196108508479987Weighted base
11711913267193311453958710879391899249182186368They wouldn't improve34%39%40%46%42%38%42%28%35%40%39%34%20%39%47%45%36%39%37%services like the NHS
and schools
69524421719533153263848368726168283165They are too extreme20%17%13%14%15%22%20%16%19%12%14%21%18%18%13%15%16%17%17%
978197331629905171647663551235937136138274William Hague would be28%27%29%23%34%34%33%26%26%30%28%28%28%25%30%34%27%29%28%a bad Prime Minister
4224351234641271728283555925644100None of these12%8%10%8%7%4%2%21%10%8%10%12%18%11%4%1%11%9%10%
53-----1225-521-549Refused2%1%-----*1%1%2%-2%*1%-1%1%1%
202625131171523191811292895472371Don't know6%8%7%9%2%2%2%8%9%9%7%5%14%6%5%4%9%5%7%
Page 28
BBC PollFieldwork:- 30th May - 4th June 2001
Absolutes/col percentsTable 28Q.13 Which of these reasons for being reluctant to vote Conservative do you have most sympathy with?Base: All ‘Version A’ respondents
Prepared by ICM Research Limited
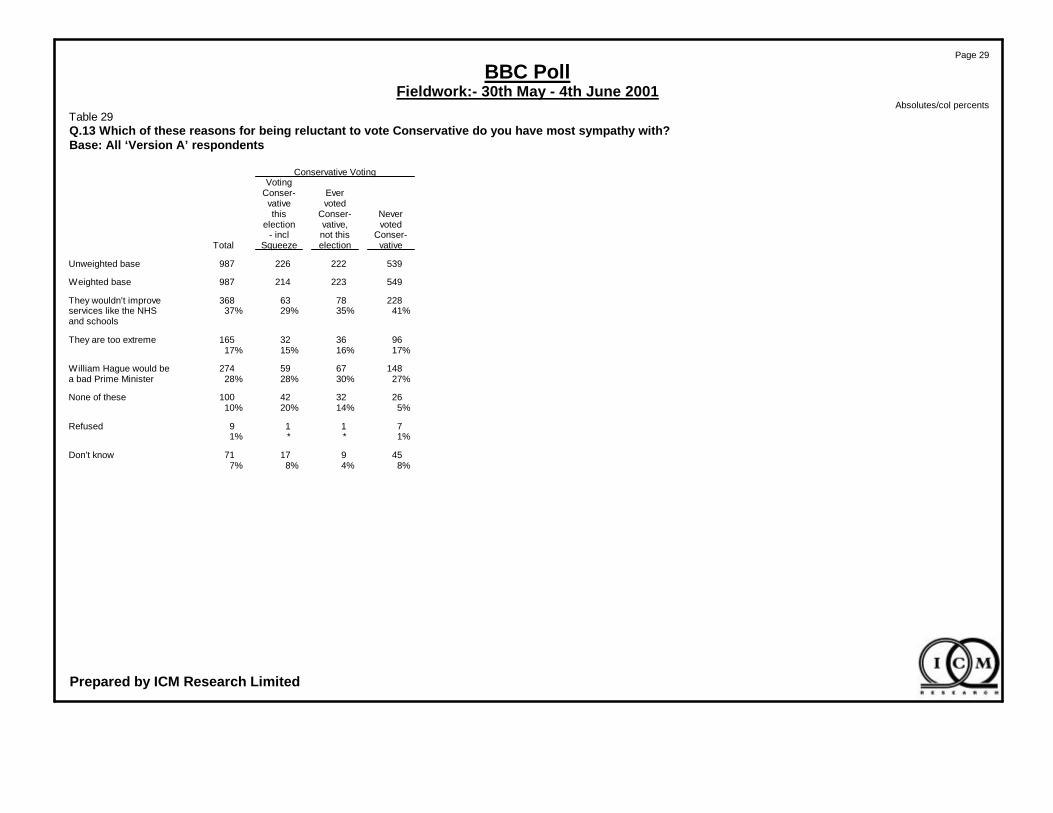
Conservative VotingVoting
EverConser-votedvative
NeverConser-thisvotedvative,election
Conser-not this- inclvativeelectionSqueezeTotal
539222226987Unweighted base
549223214987Weighted base
2287863368They wouldn't improve41%35%29%37%services like the NHS
and schools
963632165They are too extreme17%16%15%17%
1486759274William Hague would be27%30%28%28%a bad Prime Minister
263242100None of these5%14%20%10%
7119Refused1%**1%
4591771Don't know8%4%8%7%
Page 29
BBC PollFieldwork:- 30th May - 4th June 2001
Absolutes/col percentsTable 29Q.13 Which of these reasons for being reluctant to vote Conservative do you have most sympathy with?Base: All ‘Version A’ respondents
Prepared by ICM Research Limited

RegionVoting IntentionSocial ClassAgeSexMid-Don'tConser
SouthlandsNorthknowOtherLibDemLabourvativeDEC2C1AB65+35-6425-3418-24FemaleMaleTotal
3643123111434179279205250236277224191533156107533454987Unweighted base
3503043321474786269193270216272229199484196108508479987Weighted base
19919520794264415412717013716812711530512062312290601Should do57%64%62%64%55%51%57%66%63%64%62%55%58%63%61%57%61%60%61%
12688105451839965873638994631546240152167319Should not do36%29%32%31%39%45%36%30%27%29%33%41%32%32%32%37%30%35%32%
1--------1---1--1-1Refused*--------*---*--*-*
24212183320827151592025147442266Don't know7%7%6%5%6%4%7%4%10%7%6%4%10%5%7%6%9%5%7%
Page 30
BBC PollFieldwork:- 30th May - 4th June 2001
Absolutes/col percentsTable 30Q.14 Would you say that the government should or should not get rid of all taxation on savings?Base: All ‘Version A’ respondents
Prepared by ICM Research Limited

Conservative VotingVoting
EverConser-votedvative
NeverConser-thisvotedvative,election
Conser-not this- inclvativeelectionSqueezeTotal
539222226987Unweighted base
549223214987Weighted base
312150139601Should do57%67%65%61%
1926166319Should not do35%27%31%32%
1--1Refused*--*
4512966Don't know8%5%4%7%
Page 31
BBC PollFieldwork:- 30th May - 4th June 2001
Absolutes/col percentsTable 31Q.14 Would you say that the government should or should not get rid of all taxation on savings?Base: All ‘Version A’ respondents
Prepared by ICM Research Limited

RegionVoting IntentionSocial ClassAgeSexMid-Don'tConser
SouthlandsNorthknowOtherLibDemLabourvativeDEC2C1AB65+35-6425-3418-24FemaleMaleTotal
3643123111434179279205250236277224191533156107533454987Unweighted base
3503043321474786269193270216272229199484196108508479987Weighted base
16415113059173310312112311511295902467534200245445Should do47%50%39%40%36%39%38%63%46%53%41%42%45%51%38%31%39%51%45%
1511191526125461375510376124120761889464218204422Should not do43%39%46%42%54%54%51%29%38%35%46%52%38%39%48%59%43%43%43%
2-1----21111-3--123Refused1%-*----1%****-1%--***
3334492656291543243613334627118928116Don't know9%11%15%18%10%7%11%8%16%11%13%6%16%10%14%10%17%6%12%
Page 32
BBC PollFieldwork:- 30th May - 4th June 2001
Absolutes/col percentsTable 32Q.14 Would you say that the government should or should not put all new asylum seekers into detention centres?Base: All ‘Version A’ respondents
Prepared by ICM Research Limited

Conservative VotingVoting
EverConser-votedvative
NeverConser-thisvotedvative,election
Conser-not this- inclvativeelectionSqueezeTotal
539222226987Unweighted base
549223214987Weighted base
203111131445Should do37%50%61%45%
2659364422Should not do48%42%30%43%
1-23Refused*-1%*
801918116Don't know15%8%8%12%
Page 33
BBC PollFieldwork:- 30th May - 4th June 2001
Absolutes/col percentsTable 33Q.14 Would you say that the government should or should not put all new asylum seekers into detention centres?Base: All ‘Version A’ respondents
Prepared by ICM Research Limited

RegionVoting IntentionSocial ClassAgeSexMid-Don'tConser
SouthlandsNorthknowOtherLibDemLabourvativeDEC2C1AB65+35-6425-3418-24FemaleMaleTotal
20220324668377328119216115319714011836611453367284651Unweighted base
21720722668448027218617613419314812933511967335316650Weighted base
577079-202296698247403759973417103104206You always vote that26%34%35%-45%27%35%37%47%35%21%25%45%29%28%26%31%33%32%way and you would
always vote that way
1049693-15371489462559977531505833146147293You think it is the48%46%41%-33%46%54%51%36%41%51%52%41%45%48%50%44%47%45%best party
191322-5172011141021973484262854You really prefer9%6%10%-12%21%7%6%8%7%11%6%5%10%7%6%8%9%8%another party, but it
has no chance ofwinning in yourconstituency
11---1---1-1-1--111Refused**---2%---*-1%-*--***
36273268449101721332411532012593696Don't know17%13%14%100%10%5%3%6%10%16%17%16%8%16%16%19%18%12%15%
Page 34
BBC PollFieldwork:- 30th May - 4th June 2001
Absolutes/col percentsTable 34Q.15 Will this party get your vote because...?Base: All ‘Version B’ respondents expressing an intention to vote
Prepared by ICM Research Limited

RegionVoting IntentionSocial ClassAgeSexMid-Don'tConser
SouthlandsNorthknowOtherLibDemLabourvativeDEC2C1AB65+35-6425-3418-24FemaleMaleTotal
161423-5162111131122753783292453Unweighted base
191322-5172011141021973484262854Weighted base
126-1233333-341-449Conservative5%15%26%-24%10%15%24%18%31%14%-42%13%14%-16%16%16%
515-181-2-52-81-7310Labour25%5%21%-17%49%4%-17%-26%23%-25%17%-28%9%18%
636-121034353311-251015Liberal Democrat/31%25%29%-23%11%48%24%27%29%25%39%46%31%-37%20%37%29%Liberal
-------------------Scottish National-------------------Party/SNP
22--11-2--22-2-2134Plaid Cymru9%18%--17%8%-15%--11%19%-7%-42%4%11%7%
-22--13--22--121134Green Party-16%9%--5%16%--21%9%--3%25%21%3%11%7%
-------------------UKIP-------------------
112---22112--21-313Other5%7%7%---8%15%6%9%8%--7%12%-10%3%6%
3----2-22--2-22--33Refused19%----11%-15%13%--19%-5%20%--12%6%
122-1121311-131-5-5Don't know7%15%8%-19%7%10%7%19%10%6%-13%9%12%-19%-9%
Page 35
BBC PollFieldwork:- 30th May - 4th June 2001
Absolutes/col percentsTable 35Q.16 Which is the party you really prefer?Base: All ‘Version B’ respondents expressing an intention to vote who prefer another partythat has no chance of winning
Prepared by ICM Research Limited

RegionVoting IntentionSocial ClassAgeSexMid-Don'tConser
SouthlandsNorthknowOtherLibDemLabourvativeDEC2C1AB65+35-6425-3418-24FemaleMaleTotal
3403053681603773281192258244290221190557181855754381013Unweighted base
36230834215844802721862762212802362035041981085204931013Weighted base
240202218105296019010319514018614012533314063346314661Should do66%66%64%66%67%74%70%56%71%63%66%59%62%66%71%58%67%64%65%
76667530101554563643647446115322474143217Should not do21%21%22%19%24%19%20%30%13%19%23%31%23%23%16%22%14%29%21%
--1--1----1-1---1-1Refused--*--1%----*-*---*-*
4640492445292645392923315626229936135Don't know13%13%14%15%9%6%11%14%16%17%10%10%15%11%13%20%19%7%13%
Page 36
BBC PollFieldwork:- 30th May - 4th June 2001
Absolutes/col percentsTable 36Q.17 Would you say that the government should or should not bring the railways back into public ownership?Base: All ‘Version B’ respondents
Prepared by ICM Research Limited

RegionVoting IntentionSocial ClassAgeSexMid-Don'tConser
SouthlandsNorthknowOtherLibDemLabourvativeDEC2C1AB65+35-6425-3418-24FemaleMaleTotal
3403053681603773281192258244290221190557181855754381013Unweighted base
36230834215844802721862762212802362035041981085204931013Weighted base
2071861978424641927716812315714112229711159301288590Should do57%60%58%53%55%79%71%41%61%56%56%60%60%59%56%55%58%58%58%
1301021185915137196808010783551797441166184350Should not do36%33%34%37%34%16%26%52%29%36%38%35%27%35%38%38%32%37%35%
-22--1-12-1122--224Refused-1%1%--1%-1%1%-**1%*--***
2519261653912261915112326128511970Don't know7%6%7%10%11%4%3%6%9%8%5%5%12%5%6%7%10%4%7%
Page 37
BBC PollFieldwork:- 30th May - 4th June 2001
Absolutes/col percentsTable 37Q.17 Would you say that the government should or should not increase taxes and spend the money on schools?Base: All ‘Version B’ respondents
Prepared by ICM Research Limited

RegionVoting IntentionSocial ClassAgeSexMid-Don'tConser
SouthlandsNorthknowOtherLibDemLabourvativeDEC2C1AB65+35-6425-3418-24FemaleMaleTotal
3403053681603773281192258244290221190557181855754381013Unweighted base
36230834215844802721862762212802362035041981085204931013Weighted base
108748439811697972546279551166035131135266Should do30%24%25%25%18%13%25%43%26%24%22%33%27%23%30%32%25%27%26%
22520522610033641849016915119713812034912166322333655Should not do62%66%66%63%76%80%68%49%61%68%71%59%59%69%61%61%62%68%65%
1----------1-1--1-1Refused*----------*-*--*-*
29293320352017351721182839177652590Don't know8%9%10%12%6%7%7%9%13%8%7%8%14%8%8%7%13%5%9%
Page 38
BBC PollFieldwork:- 30th May - 4th June 2001
Absolutes/col percentsTable 38Q.17 Would you say that the government should or should not get private companies to run NHS hospitals?Base: All ‘Version B’ respondents
Prepared by ICM Research Limited
RegionVoting IntentionSocial ClassAgeSexMid-Don'tConser
SouthlandsNorthknowOtherLibDemLabourvativeDEC2C1AB65+35-6425-3418-24FemaleMaleTotal
3403053681603773281192258244290221190557181855754381013Unweighted base
36230834215844802721862762212802362035041981085204931013Weighted base
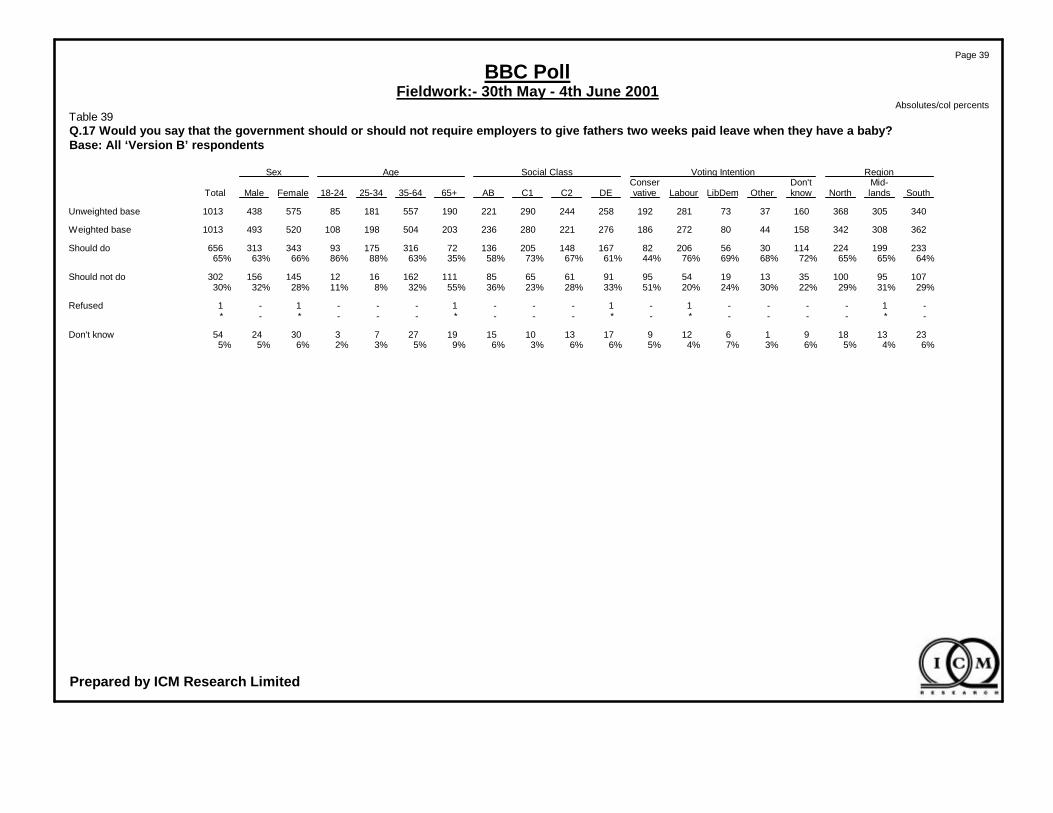
2331992241143056206821671482051367231617593343313656Should do64%65%65%72%68%69%76%44%61%67%73%58%35%63%88%86%66%63%65%
107951003513195495916165851111621612145156302Should not do29%31%29%22%30%24%20%51%33%28%23%36%55%32%8%11%28%32%30%
-1----1-1---1---1-1Refused-*----*-*---*---*-*
23131891612917131015192773302454Don't know6%4%5%6%3%7%4%5%6%6%3%6%9%5%3%2%6%5%5%
Page 39
BBC PollFieldwork:- 30th May - 4th June 2001
Absolutes/col percentsTable 39Q.17 Would you say that the government should or should not require employers to give fathers two weeks paid leave when they have a baby?Base: All ‘Version B’ respondents
Prepared by ICM Research Limited

RegionVoting IntentionSocial ClassAgeSexMid-Don'tConser
SouthlandsNorthknowOtherLibDemLabourvativeDEC2C1AB65+35-6425-3418-24FemaleMaleTotal
3403053681603773281192258244290221190557181855754381013Unweighted base
36230834215844802721862762212802362035041981085204931013Weighted base
1238099431016717894597772571406639158144302Should do34%26%29%27%23%20%26%42%34%27%27%31%28%28%34%36%30%29%30%
1961882028932581778514113417413611131010558275310585Should not do54%61%59%56%73%71%65%46%51%60%62%58%55%62%53%54%53%63%58%
111---1-21---21-213Refused***---*-1%*---**-***
4339412627232338282928355225108439123Don't know12%13%12%17%4%9%9%12%14%13%10%12%17%10%13%10%16%8%12%
Page 40
BBC PollFieldwork:- 30th May - 4th June 2001
Absolutes/col percentsTable 40Q.17 Would you say that the government should or should not get private companies to run more state schools?Base: All ‘Version B’ respondents
Prepared by ICM Research Limited
RegionVoting IntentionSocial ClassAgeSexMid-Don'tConser
SouthlandsNorthknowOtherLibDemLabourvativeDEC2C1AB65+35-6425-3418-24FemaleMaleTotal
3403053681603773281192258244290221190557181855754381013Unweighted base
36230834215844802721862762212802362035041981085204931013Weighted base
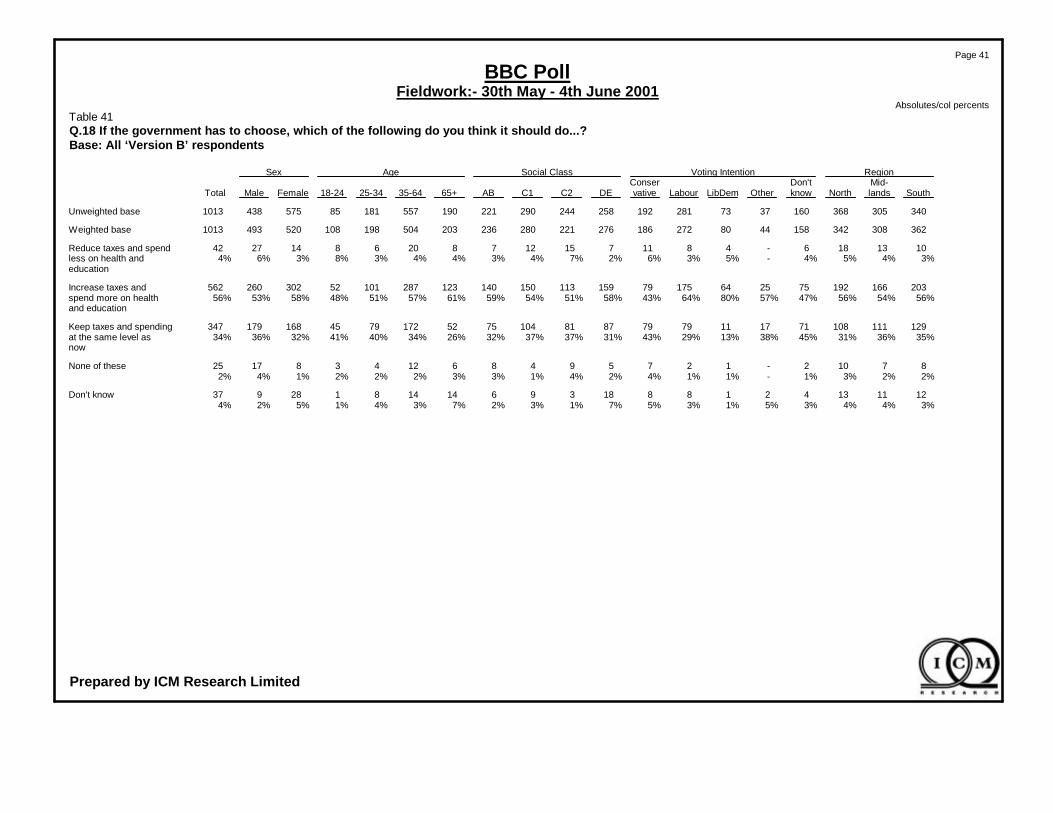
1013186-481171512782068142742Reduce taxes and spend3%4%5%4%-5%3%6%2%7%4%3%4%4%3%8%3%6%4%less on health and
education
2031661927525641757915911315014012328710152302260562Increase taxes and56%54%56%47%57%80%64%43%58%51%54%59%61%57%51%48%58%53%56%spend more on health
and education
1291111087117117979878110475521727945168179347Keep taxes and spending35%36%31%45%38%13%29%43%31%37%37%32%26%34%40%41%32%36%34%at the same level as
now
87102-12759486124381725None of these2%2%3%1%-1%1%4%2%4%1%3%3%2%2%2%1%4%2%
121113421881839614148128937Don't know3%4%4%3%5%1%3%5%7%1%3%2%7%3%4%1%5%2%4%
Page 41
BBC PollFieldwork:- 30th May - 4th June 2001
Absolutes/col percentsTable 41Q.18 If the government has to choose, which of the following do you think it should do...?Base: All ‘Version B’ respondents
Prepared by ICM Research Limited

RegionVoting IntentionSocial ClassAgeSexMid-Don'tConser
SouthlandsNorthknowOtherLibDemLabourvativeDEC2C1AB65+35-6425-3418-24FemaleMaleTotal
3403053681603773281192258244290221190557181855754381013Unweighted base
36230834215844802721862762212802362035041981085204931013Weighted base
79514316125387154245243428924188785173They are too close to22%17%12%10%27%6%14%38%20%11%18%18%21%18%12%17%17%17%17%Labour
49173821410241724263025124531165154105They would raise taxes13%6%11%13%8%13%9%9%9%12%11%10%6%9%16%15%10%11%10%
182189201981653177781541301581319430511557302270572They have no chance of50%61%59%62%37%66%65%42%56%59%56%55%47%60%58%53%58%55%56%winning
1917267581088122517192977184462None of these5%6%7%4%11%10%4%4%3%6%9%7%9%6%3%7%3%9%6%
1-3-----3--1112-314Refused*-1%-----1%--1%**1%-***
333332177423123329162035351910603998Don't know9%11%9%10%17%5%8%6%12%13%6%8%17%7%10%9%11%8%10%
Page 42
BBC PollFieldwork:- 30th May - 4th June 2001
Absolutes/col percentsTable 42Q.19 Which of these reasons for being reluctant to vote Liberal Democrat do you have most sympathy with?Base: All ‘Version B’ respondents
Prepared by ICM Research Limited

RegionVoting IntentionSocial ClassAgeSexMid-Don'tConser
SouthlandsNorthknowOtherLibDemLabourvativeDEC2C1AB65+35-6425-3418-24FemaleMaleTotal
3403053681603773281192258244290221190557181855754381013Unweighted base
36230834215844802721862762212802362035041981085204931013Weighted base
3031315134910371226162542178543892Very closely (4)8%10%9%3%3%3%18%5%14%6%9%7%12%8%8%8%10%8%9%
180144164792135186541231241281148523910658259228488Fairly closely (3)50%47%48%50%49%43%68%29%45%56%46%48%42%47%54%53%50%46%48%
937598451432277166478172521394727123143266Not very closely (2)26%24%28%28%31%40%10%39%24%21%29%30%26%28%24%25%24%29%26%
394533165844231313123246415145165116Not at all closely (1)11%14%10%10%12%10%1%23%11%14%11%10%12%13%7%13%10%13%11%
131---213111311-235Refused*1%*---1%*1%***2%*1%-*1%1%
18111713224815614111319121301646Don't know5%3%5%8%4%3%2%4%5%3%5%5%7%4%6%1%6%3%5%
2.592.552.592.512.452.413.052.182.652.542.562.552.602.532.672.562.652.502.58Mean
0.050.050.040.060.130.090.040.060.060.050.050.050.070.040.060.090.040.040.03Standard error
Page 43
BBC PollFieldwork:- 30th May - 4th June 2001
Absolutes/col percentsTable 43Q.20 How closely do you think the Labour party looks after the interests of working class people?Base: All ‘Version B’ respondents
Prepared by ICM Research Limited

RegionVoting IntentionSocial ClassAgeSexMid-Don'tConser
SouthlandsNorthknowOtherLibDemLabourvativeDEC2C1AB65+35-6425-3418-24FemaleMaleTotal
3403053681603773281192258244290221190557181855754381013Unweighted base
36230834215844802721862762212802362035041981085204931013Weighted base
4842361461445938224618267216116857125Very closely (4)13%13%10%9%15%18%16%5%14%10%17%8%13%14%8%10%13%12%12%
1981661999229511926615012715113510526512569275289563Fairly closely (3)55%54%58%58%66%63%70%36%55%57%54%57%52%53%63%63%53%59%56%
62485529210215437374448318230228877165Not very closely (2)17%15%16%18%5%13%8%29%13%16%16%20%15%16%15%20%17%16%16%
273526105234825182224195596434689Not at all closely (1)8%11%8%7%12%3%1%26%9%8%8%10%9%11%5%5%8%9%9%
121---2-2-11121-214Refused*1%*---1%-1%-****1%-***
2616261313108231816112129171442367Don't know7%5%7%8%3%4%4%4%8%8%6%5%10%6%8%1%9%5%7%
2.792.742.772.762.863.003.072.212.802.762.842.652.772.742.822.792.782.762.77Mean
0.040.050.040.060.140.080.030.070.050.050.050.050.060.040.050.080.040.040.03Standard error
Page 44
BBC PollFieldwork:- 30th May - 4th June 2001
Absolutes/col percentsTable 44Q.21 How closely do you think the Labour party looks after the interests of middle class people?Base: All ‘Version B’ respondents
Prepared by ICM Research Limited

RegionVoting IntentionSocial ClassAgeSexMid-Don'tConser
SouthlandsNorthknowOtherLibDemLabourvativeDEC2C1AB65+35-6425-3418-24FemaleMaleTotal
3403053681603773281192258244290221190557181855754381013Unweighted base
36230834215844802721862762212802362035041981085204931013Weighted base
93771034612211053081727743521206536155118273They will make big26%25%30%29%28%26%38%16%29%33%27%18%26%24%33%34%30%24%27%improvements to
services like the NHSand schools
5851582079841748344935398226197196167They can be trusted to16%17%17%13%17%11%31%9%17%16%18%15%19%16%13%18%14%19%16%run the economy
14212112772163774709482110103492227939190200390There is no credible39%39%37%46%36%46%27%38%34%37%39%44%24%44%40%36%37%41%38%alternative
33372910482482017273528531534851100None of these9%12%9%6%9%10%1%26%7%8%10%15%14%11%7%3%9%10%10%
122----13-2-211-225Refused*1%1%----*1%-1%-1%*1%-***
36202310468212916142031261210532679Don't know10%6%7%6%9%7%3%11%11%7%5%8%16%5%6%9%10%5%8%
Page 45
BBC PollFieldwork:- 30th May - 4th June 2001
Absolutes/col percentsTable 45Q.22 Which of these reasons for being keen to vote Labour do you have most sympathy with?Base: All ‘Version B’ respondents
Prepared by ICM Research Limited

RegionVoting IntentionSocial ClassAgeSexMid-Don'tConser
SouthlandsNorthknowOtherLibDemLabourvativeDEC2C1AB65+35-6425-3418-24FemaleMaleTotal
3403053681603773281192258244290221190557181855754381013Unweighted base
36230834215844802721862762212802362035041981085204931013Weighted base
66566117312921455325442459229178796183Improved18%18%18%11%8%15%34%7%20%15%19%18%22%18%15%16%17%19%18%
16613217179214313066120123132948421310963244225469Stayed about the same46%43%50%50%49%54%48%36%44%55%47%40%41%42%55%58%47%46%46%
1131131005519223910390598791671835027172155327Got worse31%37%29%34%43%28%14%55%33%27%31%38%33%36%25%25%33%31%32%
168118-3113117610717101171734Don't know4%2%3%5%-4%4%2%4%3%2%4%3%3%5%1%3%3%3%
Page 46
BBC PollFieldwork:- 30th May - 4th June 2001
Absolutes/col percentsTable 46Q.23 Over the last four years would you say that the health service has improved, got worse or stayed about the same?Base: All ‘Version B’ respondents
Prepared by ICM Research Limited

RegionVoting IntentionSocial ClassAgeSexMid-Don'tConser
SouthlandsNorthknowOtherLibDemLabourvativeDEC2C1AB65+35-6425-3418-24FemaleMaleTotal
3403053681603773281192258244290221190557181855754381013Unweighted base
36230834215844802721862762212802362035041981085204931013Weighted base
22517920592255511914715412716516411532510366293316609Go Up62%58%60%58%57%69%44%79%56%57%59%69%57%64%52%61%56%64%60%
1121041055119211342888769363621517335169151320Stay the Same31%34%31%32%43%26%49%15%32%34%33%27%30%30%37%33%33%31%32%
4591--527262-99-11717Go Down1%2%2%*--2%1%3%1%2%1%-2%4%-2%1%2%
-21---1-2--1-21-213Refused-1%*---*-1%--*-*1%-***
22182315-413924161672618127451863Don't know6%6%7%9%-5%5%5%9%7%6%3%13%4%6%6%9%4%6%
Page 47
BBC PollFieldwork:- 30th May - 4th June 2001
Absolutes/col percentsTable 47Q.24 If Labour were to win the election do you think that taxes would go up, go down, or stay the same?Base: All ‘Version B’ respondents
Prepared by ICM Research Limited

RegionVoting IntentionSocial ClassAgeSexMid-Don'tConser
SouthlandsNorthknowOtherLibDemLabourvativeDEC2C1AB65+35-6425-3418-24FemaleMaleTotal
3403053681603773281192258244290221190557181855754381013Unweighted base
36230834215844802721862762212802362035041981085204931013Weighted base
129120138571536142598977119102872036631160227387Gordon Brown36%39%40%36%35%44%52%32%32%35%43%43%43%40%33%29%31%46%38%
424248141111402042293922177524166369132John Prescott12%14%14%9%26%14%15%11%15%13%14%9%8%15%12%15%12%14%13%
402831154726242624232615501915544599Jack Straw11%9%9%9%9%9%9%13%9%11%8%11%7%10%10%14%10%9%10%
332425126919182317231919391410414182David Blunkett9%8%7%8%14%11%7%10%8%8%8%8%9%8%7%9%8%8%8%
1251-1233-4125-1358Someone else*1%1%1%-1%1%1%1%-1%1%1%1%-1%1%1%1%
42373717310102833203626246317116451115None of these11%12%11%11%6%12%4%15%12%9%13%11%12%12%9%10%12%10%11%
2411---231-31122166Refused1%1%*1%---1%1%*-1%1%*1%2%*1%1%
73525842573333575337373867562213449183Don't know20%17%17%26%10%9%12%18%21%24%13%16%19%13%28%20%26%10%18%
Page 48
BBC PollFieldwork:- 30th May - 4th June 2001
Absolutes/col percentsTable 48Q.25 If Mr Blair were to resign, who do you think would be the best person to lead the Labour party?Base: All ‘Version B’ respondents
Prepared by ICM Research Limited

RegionVoting IntentionSocial ClassAgeSexMid-Don'tConser
SouthlandsNorthknowOtherLibDemLabourvativeDEC2C1AB65+35-6425-3418-24FemaleMaleTotal
70461767930378152560397508480567445381109033719211088922000Unweighted base
7056176783018214357838055243754846340798439121810289722000Weighted base
1591321255351520256100751081331262234819216199416Conservative23%21%18%17%6%11%3%67%18%17%20%29%31%23%12%9%21%21%21%
2172382638923394353522916718913215137115638361356717Labour31%39%39%29%29%28%75%9%42%38%34%28%37%38%40%18%35%37%36%
683536245579172424504132792097564139Liberal Democrat10%6%5%8%7%40%2%5%4%5%9%9%8%8%5%4%7%7%7%
-116410-2-765-2133-9917SNP-*2%1%12%-*-1%1%1%-*1%1%-1%1%1%
-13--813-525128126713Plaid Cymru-2%--10%1%1%-1%1%1%*1%1%*1%1%1%1%
41-311-1-411114-246Referendum Party1%*-1%1%1%-*-1%****1%-***
611101101269531081143101626Other1%2%1%*12%**2%2%1%*2%2%1%1%2%1%2%1%
1027110454714423780747449211358536147130277Decided not to vote14%12%15%18%8%10%7%10%15%17%14%11%5%14%22%17%14%13%14%
765249347948184033594453044987899177Not registered / too11%8%7%11%9%6%8%5%7%8%11%10%1%3%11%45%8%10%9%young to vote
91612812145109117416108211738Don‘t know why didn’t1%3%2%3%1%2%2%1%2%2%2%1%1%2%2%4%2%2%2%vote
523949162--14128353651731148554139Refused7%6%7%5%2%--*7%6%6%8%13%7%3%2%8%6%7%
139131534448109932651191735Don't know2%1%2%5%4%3%1%1%1%2%2%2%1%3%1%*2%2%2%
Page 49
BBC PollFieldwork:- 30th May - 4th June 2001
Absolutes/col percentsTable 49Q.26-28 Voting in 1997 General ElectionBase: All respondents
Prepared by ICM Research Limited

RegionVoting IntentionSocial ClassAgeSexMid-Don'tConser
SouthlandsNorthknowOtherLibDemLabourvativeDEC2C1AB65+35-6425-3418-24FemaleMaleTotal
201172193963661241-1501431651089732310640309257566Unweighted base
2051762191074270231-17213917211611130514044316284600Weighted base
58575335103447-46344840371092018088168Yes28%33%24%32%23%49%20%-27%24%28%35%34%36%14%3%25%31%28%
140115161643235182-124100120727218711541226190416No68%66%73%59%77%50%79%-72%72%70%62%65%61%82%94%71%67%69%
4--1-----111-21-124Refused2%--1%-----1%1%1%-1%1%-*1%1%
3358-11-343316329312Don't know2%2%2%7%-1%1%-1%3%1%2%1%2%2%4%3%1%2%
Page 50
BBC PollFieldwork:- 30th May - 4th June 2001
Absolutes/col percentsTable 50Q.29 Thinking back before the 1997 general election was there ever an election at which you voted Conservative?Base: All ‘Version A’ respondents who haven‘t voted Conservative in the past and don’t intend to voteConservative this time (except those too young to have voted last time)
Prepared by ICM Research Limited

RegionVoting IntentionSocial ClassAgeSexMid-Don'tConser
SouthlandsNorthknowOtherLibDemLabourvativeDEC2C1AB65+35-6425-3418-24FemaleMaleTotal
70461767930378152560397508480567445381109033719211088922000Unweighted base
7136126753059116654237854543755246540198939321710289722000Weighted base
85607146817603246467847---21710111621718 - 2412%10%11%15%9%10%11%8%8%10%14%10%---100%10%12%11%
151112131732322118517410113187--393-19120339325 - 3421%18%19%24%25%13%22%13%14%23%24%19%--100%-19%21%20%
145112128742237109547892105109-385--19019438535 - 4420%18%19%24%24%22%20%14%14%21%19%24%-39%--19%20%19%
1241061115017358768587810897-341--16517634145 - 5417%17%16%16%19%21%16%18%11%18%20%21%-35%--16%18%17%
76929522724717286615758-263--14312026355 - 6411%15%14%7%8%15%13%19%16%14%10%13%-27%--14%12%13%
13213013939153196102204587366401---23816440165+19%21%21%13%16%19%18%27%37%13%13%14%100%---23%17%20%
Page 51
BBC PollFieldwork:- 30th May - 4th June 2001
Absolutes/col percentsTable 51Which of the following age groups do you fall into?Base: All respondents
Prepared by ICM Research Limited
RegionVoting IntentionSocial ClassAgeSexMid-Don'tConser
SouthlandsNorthknowOtherLibDemLabourvativeDEC2C1AB65+35-6425-3418-24FemaleMaleTotal
70461767930378152560397508480567445381109033719211088922000Unweighted base
7136126753059116654237854543755246540198939321710289722000Weighted base
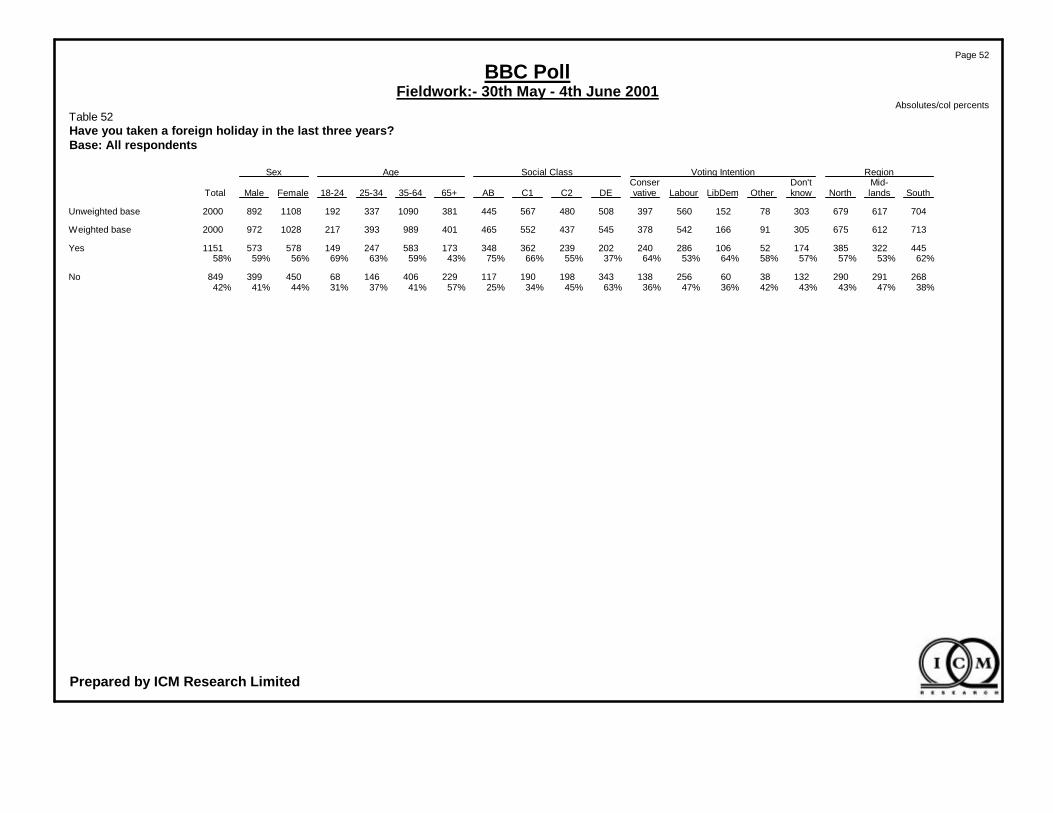
445322385174521062862402022393623481735832471495785731151Yes62%53%57%57%58%64%53%64%37%55%66%75%43%59%63%69%56%59%58%
268291290132386025613834319819011722940614668450399849No38%47%43%43%42%36%47%36%63%45%34%25%57%41%37%31%44%41%42%
Page 52
BBC PollFieldwork:- 30th May - 4th June 2001
Absolutes/col percentsTable 52Have you taken a foreign holiday in the last three years?Base: All respondents
Prepared by ICM Research Limited
RegionVoting IntentionSocial ClassAgeSexMid-Don'tConser
SouthlandsNorthknowOtherLibDemLabourvativeDEC2C1AB65+35-6425-3418-24FemaleMaleTotal
70461767930378152560397508480567445381109033719211088922000Unweighted base
7136126753059116654237854543755246540198939321710289722000Weighted base
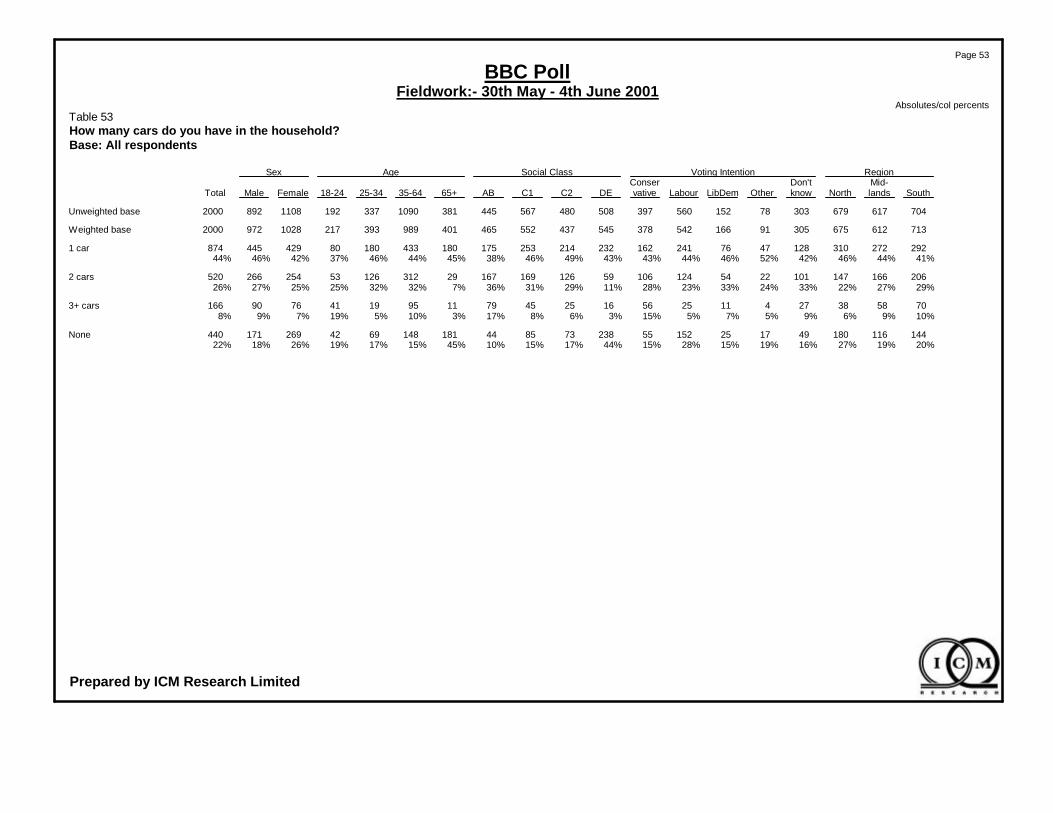
2922723101284776241162232214253175180433180804294458741 car41%44%46%42%52%46%44%43%43%49%46%38%45%44%46%37%42%46%44%
20616614710122541241065912616916729312126532542665202 cars29%27%22%33%24%33%23%28%11%29%31%36%7%32%32%25%25%27%26%
705838274112556162545791195194176901663+ cars10%9%6%9%5%7%5%15%3%6%8%17%3%10%5%19%7%9%8%
144116180491725152552387385441811486942269171440None20%19%27%16%19%15%28%15%44%17%15%10%45%15%17%19%26%18%22%
Page 53
BBC PollFieldwork:- 30th May - 4th June 2001
Absolutes/col percentsTable 53How many cars do you have in the household?Base: All respondents
Prepared by ICM Research Limited

RegionVoting IntentionSocial ClassAgeSexMid-Don'tConser
SouthlandsNorthknowOtherLibDemLabourvativeDEC2C1AB65+35-6425-3418-24FemaleMaleTotal
70461767930378152560397508480567445381109033719211088922000Unweighted base
7136126753059116654237854543755246540198939321710289722000Weighted base
2151592038925511631032531061259320424410227330247577130%26%30%29%27%30%30%27%46%24%23%20%51%25%26%13%32%25%29%
3513443561605591272196219245304283170557239855295221051249%56%53%53%60%55%50%52%40%56%55%61%42%56%61%39%51%54%53%
82687128714665143527551151193057107114221312%11%11%9%7%8%12%13%8%12%14%11%4%12%8%26%10%12%11%
56353726411352021314532662213954741284+8%6%5%8%5%7%6%5%4%7%8%7%1%6%5%18%5%8%6%
8793--689347772781523Refused1%1%1%1%--1%2%2%1%1%2%2%1%*3%1%2%1%
2.132.072.042.001.982.252.032.041.812.322.162.071.692.181.952.621.942.232.08Mean
0.090.070.100.050.140.270.080.070.090.170.070.040.110.080.050.080.040.100.05Standard error
Page 54
BBC PollFieldwork:- 30th May - 4th June 2001
Absolutes/col percentsTable 54How many adults live in the household aged 18 or over?Base: All respondents
Prepared by ICM Research Limited

RegionVoting IntentionSocial ClassAgeSexMid-Don'tConser
SouthlandsNorthknowOtherLibDemLabourvativeDEC2C1AB65+35-6425-3418-24FemaleMaleTotal
70461767930378152560397508480567445381109033719211088922000Unweighted base
7136126753059116654237854543755246540198939321710289722000Weighted base
37126628615745842381658924231427814540260110328595923Working full time (30+52%43%42%51%50%51%44%44%16%55%57%60%3%55%66%51%32%61%46%hrs a week)
776680476226839425973497137483217747223Working part time (8-2911%11%12%15%6%13%13%10%8%14%13%11%2%14%12%15%17%5%11%hrs a week)
3754582511853127029311847437347376149Not working but seeking5%9%9%8%12%5%10%3%13%7%6%4%1%7%9%16%7%8%7%work or temporarily
unemployed/sick
2272262517729531831633441081341203772374941450254704Not working/Not seeking32%37%37%25%31%32%34%43%63%25%24%26%94%24%12%19%44%26%35%work/Including retired
Page 55
BBC PollFieldwork:- 30th May - 4th June 2001
Absolutes/col percentsTable 55Working StatusBase: All respondents
Prepared by ICM Research Limited

RegionVoting IntentionSocial ClassAgeSexMid-Don'tConser
SouthlandsNorthknowOtherLibDemLabourvativeDEC2C1AB65+35-6425-3418-24FemaleMaleTotal
70461767930378152560397508480567445381109033719211088922000Unweighted base
7136126753059116654237854543755246540198939321710289722000Weighted base
1871822007125551091541691071411532402763222301269570Owned outright (without26%30%30%23%27%33%20%41%31%24%26%33%60%28%8%10%29%28%28%mortgage)
312257272155348124513810820028225022493225102404437841Own with a mortgage or44%42%40%51%37%48%45%37%20%46%51%54%6%50%57%47%39%45%42%loan
1069513139191313436182825513971237240188144332Rented from the council15%16%19%13%21%8%25%9%33%19%10%3%24%12%18%19%18%15%17%
93675834131543446943634433826043114104218Rented from someone13%11%9%11%14%9%8%12%13%10%11%9%8%8%15%20%11%11%11%else
1411147-311817511591559211838Rent free2%2%2%2%-2%2%2%3%1%2%1%2%2%1%4%2%2%2%
Page 56
BBC PollFieldwork:- 30th May - 4th June 2001
Absolutes/col percentsTable 56TenureBase: All respondents
Prepared by ICM Research Limited
RegionVoting IntentionSocial ClassAgeSexMid-Don'tConser
SouthlandsNorthknowOtherLibDemLabourvativeDEC2C1AB65+35-6425-3418-24FemaleMaleTotal
70461767930378152560397508480567445381109033719211088922000Unweighted base
7136126753059116654237854543755246540198939321710289722000Weighted base
3613043071295180287189194240286251164490203116-972972Male51%50%45%42%56%48%53%50%36%55%52%54%41%50%51%53%-100%49%
35130836817640862551893511972662152384981911011028-1028Female49%50%55%58%44%52%47%50%64%45%48%46%59%50%49%47%100%-51%
Page 57
BBC PollFieldwork:- 30th May - 4th June 2001
Absolutes/col percentsTable 57GenderBase: All respondents
Prepared by ICM Research Limited

RegionVoting IntentionSocial ClassAgeSexMid-Don'tConser
SouthlandsNorthknowOtherLibDemLabourvativeDEC2C1AB65+35-6425-3418-24FemaleMaleTotal
70461767930378152560397508480567445381109033719211088922000Unweighted base
7136126753059116654237854543755246540198939321710289722000Weighted base
493220152102230---101136210164061101A7%5%3%5%3%6%4%8%---22%3%6%3%7%4%6%5%
1551061046413377383---365532047731175190365B22%17%15%21%14%22%13%22%---78%13%21%20%14%17%20%18%
20716018577296415487--552-7327013178266286552C129%26%27%25%32%39%28%23%--100%-18%27%33%36%26%29%28%
15113215479202412374-437--5823210146197240437C221%21%23%26%22%15%23%20%-100%--15%23%26%21%19%25%22%
5775703710115937202---29109451812775202D8%12%10%12%11%7%11%10%37%---7%11%11%8%12%8%10%
9410714233172011168343---1741122928224119343E13%17%21%11%19%12%20%18%63%---43%11%7%13%22%12%17%
Page 58
BBC PollFieldwork:- 30th May - 4th June 2001
Absolutes/col percentsTable 58Social ClassBase: All respondents
Prepared by ICM Research Limited

RegionVoting IntentionSocial ClassAgeSexMid-Don'tConser
SouthlandsNorthknowOtherLibDemLabourvativeDEC2C1AB65+35-6425-3418-24FemaleMaleTotal
70461767930378152560397508480567445381109033719211088922000Unweighted base
7136126753059116654237854543755246540198939321710289722000Weighted base
--17934309511452395730359334169584179Scotland--26%11%33%6%9%4%10%9%10%7%9%9%9%8%9%9%9%
--88911334103321171623341912484088North--13%3%1%8%6%3%6%5%3%4%6%3%5%6%5%4%4%
--23628221635173566245461204425121114236North West--35%9%2%12%12%13%13%13%11%10%12%12%11%12%12%12%12%
--17331575128543849323587331810469173Yorks & Humberside--26%10%5%4%10%7%10%9%9%7%9%9%8%8%10%7%9%
-141-1424543436413232257333117369141East Midlands-23%-5%3%3%10%9%7%9%6%7%6%7%8%5%7%7%7%
-179-3849513359394635458828189782179West Midlands-29%-12%4%6%9%9%11%9%8%7%11%9%7%8%9%8%9%
-103-12205271128233517185914125152103Wales-17%-4%23%3%5%3%5%5%6%4%5%6%4%5%5%5%5%
-189-318214148592848544290371987102189Eastern-31%-10%9%12%8%13%11%6%9%12%11%9%9%9%8%10%9%
248--311115814156446978351116536128119248Greater London35%--10%13%9%15%11%10%10%13%17%9%11%17%17%12%12%12%
284--48534477857668575641444828145139284South East40%--16%6%20%9%21%11%15%15%16%16%15%12%13%14%14%14%
181--291284031384152503290382178103181South West25%--10%1%17%7%8%7%9%9%11%8%9%10%9%8%11%9%
Page 59
BBC PollFieldwork:- 30th May - 4th June 2001
Absolutes/col percentsTable 59Region (Sample)Base: All respondents
Prepared by ICM Research Limited
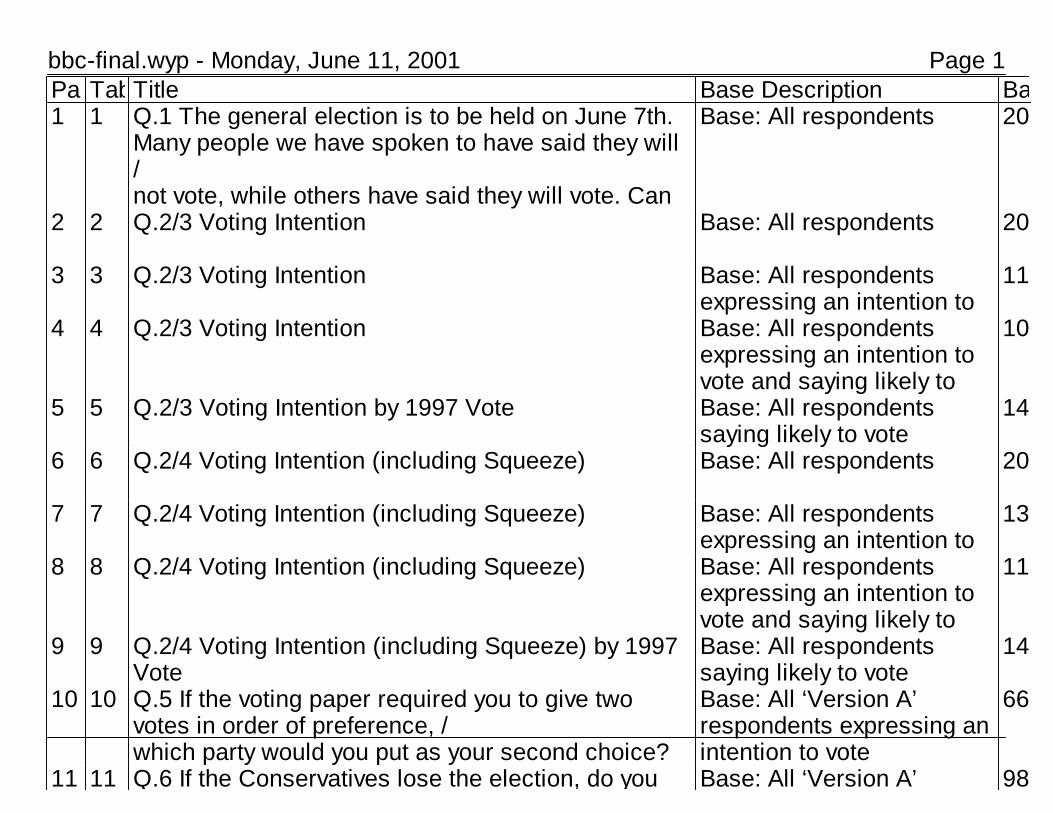
Page 1bbc-final.wyp - Monday, June 11, 2001PageTableTitle Base Description Base1 1 Q.1 The general election is to be held on June 7th.
Many people we have spoken to have said they will /not vote, while others have said they will vote. Can
Base: All respondents 2000
2 2 Q.2/3 Voting Intention Base: All respondents 2000
3 3 Q.2/3 Voting Intention Base: All respondents expressing an intention to
1187
4 4 Q.2/3 Voting Intention Base: All respondents expressing an intention to vote and saying likely to
1031
5 5 Q.2/3 Voting Intention by 1997 Vote Base: All respondents saying likely to vote
1497
6 6 Q.2/4 Voting Intention (including Squeeze) Base: All respondents 2000
7 7 Q.2/4 Voting Intention (including Squeeze) Base: All respondents expressing an intention to
1319
8 8 Q.2/4 Voting Intention (including Squeeze) Base: All respondents expressing an intention to vote and saying likely to
1127
9 9 Q.2/4 Voting Intention (including Squeeze) by 1997 Vote
Base: All respondents saying likely to vote
1497
10 10 Q.5 If the voting paper required you to give two votes in order of preference, /which party would you put as your second choice?
Base: All ‘Version A’ respondents expressing anintention to vote
668
11 11 Q.6 If the Conservatives lose the election, do you Base: All ‘Version A’ 987

Page 2bbc-final.wyp - Monday, June 11, 2001PageTableTitle Base Description Base18 18 Q.10 Which party do you trust most to take the right
decisions about Britain's relations with Europe?Base: All ‘Version A’ respondents
987
19 19 Q.10 Which party do you trust most to take the right decisions about Britain's relations with Europe?
Base: All ‘Version A’ respondents
987
20 20 Q.11 Do you think Britain should continue to be a member of the European Union or should it
Base: All ‘Version A’ respondents
987
21 21 Q.11 Do you think Britain should continue to be a member of the European Union or should it
Base: All ‘Version A’ respondents
987
22 22 Q.12 Agreement with statements - It doesn't really matter which party is in power, in the end things go on much the same /It doesn't really matter which party is in power, in the
Base: All ‘Version A’ respondents
987
23 23 Q.12 Agreement with statements - It doesn't really matter which party is in power, in the end things go on much the same /It doesn't really matter which party is in power, in the
Base: All ‘Version A’ respondents
987
24 24 Q.12 Agreement with statements - It is obvious who is going to win the election /It is obvious who is going to win the election
Base: All ‘Version A’ respondents
987
25 25 Q.12 Agreement with statements - It is obvious who is going to win the election /It is obvious who is going to win the election
Base: All ‘Version A’ respondents
987
26 26 Q.12 Agreement with statements - Politicians can‘t be trusted to put the country’s interests first /Politicians can‘t be trusted to put the country’s
Base: All ‘Version A’ respondents
987
27 27 Q.12 Agreement with statements - Politicians can‘t Base: All ‘Version A’ 987
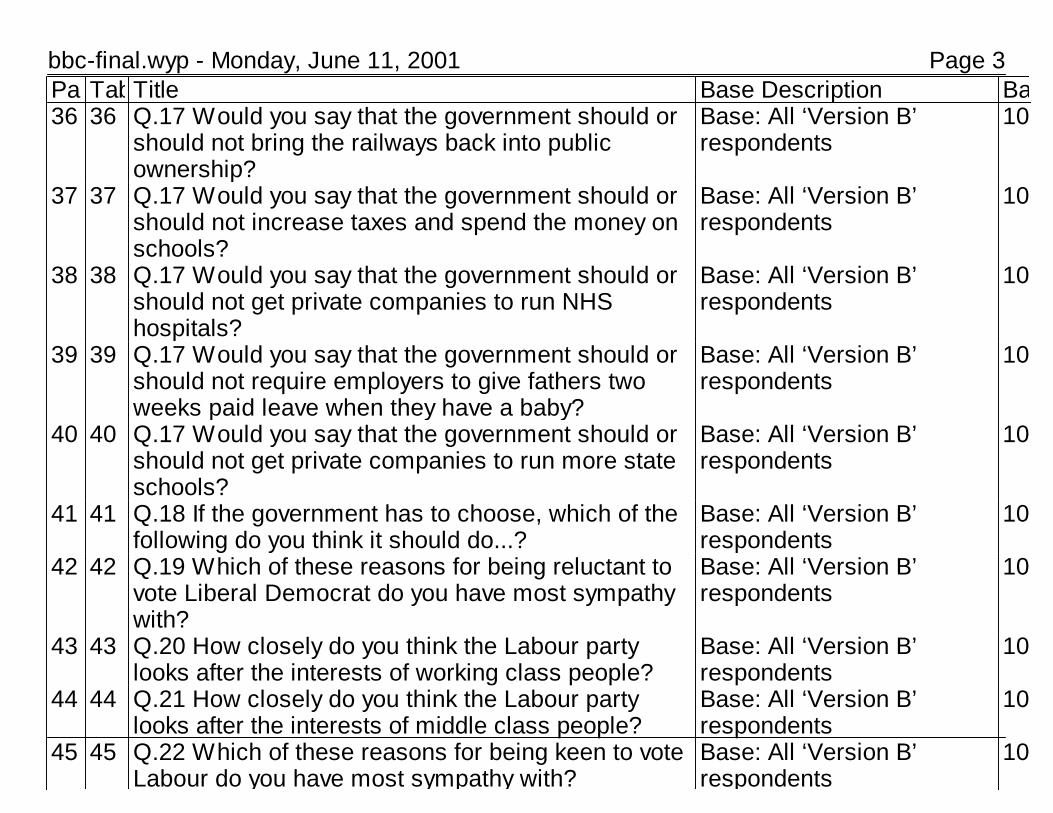
Page 3bbc-final.wyp - Monday, June 11, 2001PageTableTitle Base Description Base36 36 Q.17 Would you say that the government should or
should not bring the railways back into public ownership?
Base: All ‘Version B’ respondents
1013
37 37 Q.17 Would you say that the government should or should not increase taxes and spend the money on schools?
Base: All ‘Version B’ respondents
1013
38 38 Q.17 Would you say that the government should or should not get private companies to run NHS hospitals?
Base: All ‘Version B’ respondents
1013
39 39 Q.17 Would you say that the government should or should not require employers to give fathers two weeks paid leave when they have a baby?
Base: All ‘Version B’ respondents
1013
40 40 Q.17 Would you say that the government should or should not get private companies to run more state schools?
Base: All ‘Version B’ respondents
1013
41 41 Q.18 If the government has to choose, which of the following do you think it should do...?
Base: All ‘Version B’ respondents
1013
42 42 Q.19 Which of these reasons for being reluctant to vote Liberal Democrat do you have most sympathy with?
Base: All ‘Version B’ respondents
1013
43 43 Q.20 How closely do you think the Labour party looks after the interests of working class people?
Base: All ‘Version B’ respondents
1013
44 44 Q.21 How closely do you think the Labour party looks after the interests of middle class people?
Base: All ‘Version B’ respondents
1013
45 45 Q.22 Which of these reasons for being keen to vote Labour do you have most sympathy with?
Base: All ‘Version B’ respondents
1013

Page 4bbc-final.wyp - Monday, June 11, 2001PageTableTitle Base Description Base56 56 Tenure Base: All respondents 2000
57 57 Gender Base: All respondents 2000
58 58 Social Class Base: All respondents 2000
59 59 Region (Sample) Base: All respondents 2000


![BBC VOICES RECORDINGS€¦ · BBC Voices Recordings) ) ) ) ‘’ -”) ” (‘)) ) ) *) , , , , ] , ,](https://img.pdfslide.net/doc/110x75/5f8978dc43c248099e03dd05/bbc-voices-recordings-bbc-voices-recordings-aa-a-a-a-.jpg)