Embed Size (px)
Citation preview

Capital Expenditures Monthly ReportPage: 1 of 44
Run Date: December 10, 2019
Report as of November 30, 2019
Project Id DescriptionProject
YearAdopted Budget
Amended Budget
Actual Costs to Report Date
Available Balance
% Spent
Tax Supported (including Transit)Public WorksRegional StreetsStreets Renewals1804100414 King Edward-Legion/Dublin 2014 2,050,000 2,658,910 2,589,137 69,773 97.381804101514 Sturgeon/Murray Rndabt 2014 - 5,421,000 5,169,058 251,942 95.351804101614 Downtown Regional Streets 2014 - 2,196,750 2,124,833 71,917 96.731803000115 Design for Build Canada Fund M 2015 5,200,000 - - - 0.001804100515 St. James - Maroons / Ness 2015 2,900,000 2,719,575 2,422,275 297,300 89.071804100615 St. James - Ness / Portage 2015 2,100,000 1,954,175 1,672,822 281,353 85.601804102015 Plessis/Gunn-Intersectn Improv 2015 1,500,000 2,148,125 1,568,431 579,694 73.011804101216 Archibald/Watt-#80Narin 2016 1,500,000 1,375,125 1,344,528 30,597 97.771804101316 Watt-Chalmers/Nairin 2016 850,000 1,112,238 937,758 174,480 84.311804101616 Pembina-Grant/Osborne 2016 11,700,000 12,421,975 9,883,506 2,538,469 79.561804102116 St. James-Maroons/Portage 2016 7,300,000 3,908,046 3,530,948 377,098 90.351804102216 St. James-Sargent/Ellice 2016 2,000,000 1,993,500 1,394,334 599,166 69.941804200216 Sidewk /Curb Renew-Dntn Reg St 2016 1,500,000 3,595,125 3,557,805 37,320 98.961804000117 Regional and Local Streets Ren 2017 - 616,780 - 616,780 0.001804100217 Empress-St. Matthews/Portage 2017 19,900,000 22,777,450 15,748,323 7,029,127 69.141804100317 Salter-Inkster/Cathedral 2017 3,900,000 3,887,325 1,879,451 2,007,874 48.351804100417 Pembina-Killarney/De Vos 2017 7,700,000 7,674,975 5,138,691 2,536,284 66.951804100517 Pembina SB-Dalhousie/De Vos 2017 500,000 498,375 391,246 107,129 78.501804100617 Pembina-Cloutier/Ducharme 2017 800,000 800,000 505,177 294,823 63.151804100717 St. James-Sargent/Ellice 2017 4,700,000 5,491,225 3,189,524 2,301,701 58.081804100817 McGillivray-Fennel/Waverley 2017 2,000,000 1,993,500 1,439,233 554,267 72.201804100917 Donald-Notre Dame/Portage 2017 2,800,000 2,917,900 2,568,820 349,080 88.041804101017 Ellice-Erin/Arlington 2017 8,600,000 7,892,050 6,102,426 1,789,624 77.321804101217 Provencher-Des Meurons/Archiba 2017 1,700,000 1,077,475 558,778 518,697 51.861804101317 Garry-Assiniboine/Princess 2017 16,800,000 14,261,000 10,376,657 3,884,343 72.761804101417 Ness-Moray/Braintree 2017 200,000 281,350 215,858 65,492 76.721804101517 Princess-William/Donald 2017 300,000 849,025 779,517 69,508 91.811804101617 Broadway-Portage/Sherbrook 2017 800,000 797,400 399,992 397,408 50.16

Capital Expenditures Monthly ReportPage: 2 of 44
Run Date: December 10, 2019
Report as of November 30, 2019
Project Id DescriptionProject
YearAdopted Budget
Amended Budget
Actual Costs to Report Date
Available Balance
% Spent
1804101717 Lag-Dugald/Regent 2017 700,000 697,725 541,700 156,025 77.641804101817 McPhillips-College/Mountain 2017 500,000 498,375 250,538 247,837 50.271804101917 Paving Granular Shoulders 2017 250,000 249,188 161,137 88,051 64.661804102117 McGillivray-Pembina/Fennel 2017 - 1,993,500 1,111,547 881,953 55.761804200117 Sidewalk/Curb Renewals-Reg St 2017 500,000 498,375 473,088 25,287 94.931804200217 Sidewalk/Curb Renew-Dtwn RegSt 2017 1,500,000 498,375 488,468 9,907 98.011804200417 Downtown Reg St 2017 - 996,750 814,551 182,199 81.721804300117 PC-15-R-03, 15-R-05, 13-R-08 2017 - 100,000 23,416 76,584 23.421806100617 LSR 17/16-R-06B AECOM 2017 1,884,976 1,878,850 1,454,927 423,922 77.441804000118 Regional and Local Streets Ren 2018 - 5,236,643 - 5,236,643 0.001804100218 Pembina NB-Ducharme/Cloutier 2018 2,800,000 2,790,900 1,635,475 1,155,425 58.601804100219 Colony-Ellice/Portage-NBCF 2018 1,800,000 1,800,000 921,916 878,084 51.221804100318 McPhillips-Logan/Jarvis 2018 6,600,000 7,258,550 6,848,336 410,214 94.351804100319 Memr Blvd NB-St Mry/Portg-NBCF 2018 1,000,000 1,000,000 615,462 384,538 61.551804100418 Portage & Main Rehabilitation 2018 2,000,000 1,993,500 - 1,993,500 0.001804100419 York-Osborne/Memorial-NBCF 2018 800,000 800,000 512,859 287,141 64.111804100518 McGregor-Selkirk/Mountain 2018 7,600,000 7,575,300 5,385,440 2,189,860 71.091804100818 McPhillips-Swailes/Leila 2018 700,000 877,725 863,583 14,142 98.391804100819 Ellice-Arlington/Maryland-NBCF 2018 3,100,000 3,100,000 1,749,806 1,350,194 56.451804100919 Inkster-Milner/Fife-NBCF 2018 4,600,000 4,600,000 3,939,618 660,382 85.641804101018 Roblin-Assiniboine/Shaftesbury 2018 5,300,000 5,282,775 4,232,961 1,049,814 80.131804101019 Main-McAdam/Kildonan Golf-NBCF 2018 6,500,000 6,500,000 4,685,778 1,814,222 72.091804101118 Fermor-St Anne's/Archibald 2018 13,600,000 15,080,500 13,373,678 1,706,822 88.681804101119 Fermor-Lag/Plessis-NBCF 2018 9,800,000 21,986,000 8,235,063 13,750,937 37.461804101318 Paving Granular Shoulders 2018 250,000 250,000 157,575 92,425 63.031804101418 Reg St Renew-Various Locations 2018 52,000 52,000 - 52,000 0.001804200418 Downtown Reg St 2018 1,000,000 996,750 773,683 223,067 77.621804300118 PC-Regional & Local St Renewal 2018 - 100,000 23,680 76,320 23.681804300218 PC-Regional&LocalSt Renewal #2 2018 - 100,000 54,359 45,641 54.361806101318 LSR 18-R-05B Morrison 2018 2,000,000 3,189,500 2,717,180 472,320 85.191804101219 Coryd WB-Cordova-Lanark-NBCF 2019 2,200,000 2,200,000 1,425,016 774,984 64.771804101319 Memor Blvd-Yrk-St Mary Av-NBCF 2019 1,600,000 1,600,000 1,238,464 361,536 77.40

Capital Expenditures Monthly ReportPage: 3 of 44
Run Date: December 10, 2019
Report as of November 30, 2019
Project Id DescriptionProject
YearAdopted Budget
Amended Budget
Actual Costs to Report Date
Available Balance
% Spent
1804101419 Mem Blvd SB-Portg-St MryA-NBCF 2019 400,000 400,000 297,633 102,367 74.411804101519 Cory EB-Borbnk-Brock St-NBCF 2019 1,100,000 1,100,000 896,445 203,555 81.491804101619 Roblin WB-Shft-Assin PrkD-NBCF 2019 4,900,000 4,900,000 3,807,234 1,092,766 77.701804101719 Dwtn-Brodway-Osborne-Main-NBCF 2019 300,000 640,000 66,486 573,514 10.391804101819 Dwtn-Portg-Main-Memorial-NBCF 2019 100,000 213,000 31,518 181,482 14.801804101919 Dwtn-Donld-St MryAv-Gertr-NBCF 2019 400,000 853,000 66,260 786,740 7.771804102019 Dwtn-Fort NB-Grham-Brodwy-NBCF 2019 200,000 427,000 49,202 377,798 11.521804102119 Dwtn-Hgrv NB-Prtag-Ellice-NBCF 2019 100,000 213,000 13,792 199,208 6.481804102219 Dwtn-Hgrv NB-Brodway-York-NBCF 2019 100,000 213,000 14,494 198,506 6.801804102319 Dwtn-SmthNB-NtrDme-Midtwn-NBCF 2019 200,000 427,000 90,998 336,002 21.311804102419 Dwtn-Carltn St-Prtg-Ellic-NBCF 2019 100,000 214,000 7,081 206,919 3.311804102519 Staffrd-Corydn-Pembina-NBCF 2019 500,000 1,038,000 217,830 820,170 20.991804102619 Taylor Ave-Wilton-Pembina-NBCF 2019 250,000 519,000 81,941 437,059 15.791804102719 Corydn EB-Watrloo-Cambrdg-NBCF 2019 150,000 312,000 52,331 259,669 16.771804102819 Corydon-Cambridg-Staffrd-NBCF 2019 400,000 831,000 153,150 677,850 18.431804102919 Watt St-Chalmers-Munroe-NBCF 2019 400,000 640,000 24,044 615,956 3.761804103019 Munroe-Raleigh-Henderson-NBCF 2019 550,000 880,000 34,247 845,753 3.891804103119 Johnson W-Levis to Hendsn-NBCF 2019 300,000 480,000 20,829 459,171 4.341804103219 Erin St-Ntr Dame-Wolever-NBCF 2019 500,000 1,346,000 3,889 1,342,111 0.291804103319 Wall St-St Mattws-Ntr Dme-NBCF 2019 500,000 1,346,000 3,827 1,342,173 0.281804103419 Sargt Ave-ArlingtontoErin-NBCF 2019 300,000 808,000 3,977 804,023 0.491804103519 Archibld-St Cathrne-Eliza-NBCF 2019 1,050,000 1,035,000 - 1,035,000 0.001804103619 Archibld-Plinget-Doucet-NBCF 2019 200,000 200,000 - 200,000 0.001804103719 RoblinBlvd-Dieppe-PTH101-NBCF 2019 400,000 800,000 - 800,000 0.001804103819 PortgeAv EB-St Charls to David 2019 250,000 250,000 - 250,000 0.001804103919 LagBlvd NB-RegntAve W to Almy 2019 100,000 100,000 - 100,000 0.001804104019 Paving Granular Shoulders 2019 250,000 250,000 - 250,000 0.001804104119 Reg St Renew-Various Locations 2019 38,000 38,000 - 38,000 0.001804100120 Dublin Av-NtrDm to StJams-NBCF 2020 - 6,700,000 - 6,700,000 0.001804100220 St.Jams St-Dublln to Sask-NBCF 2020 - 2,700,000 - 2,700,000 0.001804100420 St.JamsSt-NtrDmetoOmndsCr-NBCF 2020 - 500,000 - 500,000 0.00Total Streets Renewals 201,974,976 245,474,653 156,135,644 89,339,009 63.61

Capital Expenditures Monthly ReportPage: 4 of 44
Run Date: December 10, 2019
Report as of November 30, 2019
Project Id DescriptionProject
YearAdopted Budget
Amended Budget
Actual Costs to Report Date
Available Balance
% Spent
Active Transportation Facilities1832001009 North Winnipeg Parkway 2009 5,000 405,000 31,828 373,172 7.861832000211 New Regional Sidewalks 2011 250,000 250,000 222,759 27,241 89.101832000311 Active Transportation Corridor 2011 500,000 500,000 398,728 101,272 79.751832000113 Rec Walkways & Bike Paths 2013 500,000 659,787 408,192 251,596 61.871833000213 CPR Yards Func Crossing Study 2013 3,500,000 4,100,000 4,096,343 3,657 99.911832000114 Rec Walkways & Bike Paths 2014 500,000 498,425 210,437 287,988 42.221832000314 Active Transportation Corridor 2014 1,000,000 997,655 978,639 19,016 98.091832000115 Rec Walkways & Bike Paths 2015 1,000,000 996,750 447,327 549,423 44.881832000315 New Non - Regional Sidewalks 2015 150,000 149,438 93,304 56,133 62.441832000415 Bicycle Corridors 2015 1,000,000 997,170 774,615 222,555 77.681833000115 Transportation Master Plan 2015 250,000 140,000 110,744 29,256 79.101806101816 Rec Walkways & Bk Path Renew 2016 500,000 500,000 476,484 23,516 95.301832000116 Rec Walkways & Bike Paths 2016 1,300,000 1,294,750 498,560 796,190 38.511832000216 New Regional Sidewalks 2016 1,000,000 996,750 843,976 152,774 84.671832000316 New Non - Regional Sidewalks 2016 300,000 298,500 287,887 10,613 96.441832000416 Bicycle Corridors 2016 1,500,000 1,479,000 1,068,484 410,516 72.241806102017 Rec Walkways and Bk Path Renew 2017 500,000 498,375 494,299 4,076 99.181832000117 Pedestrian & Cycling Program 2017 4,700,000 3,691,075 2,797,730 893,345 75.801832000217 Pedestrian & Cycling Grade Sep 2017 1,000,000 1,000,000 698,577 301,423 69.861832000417 Ped & Cycle-Chief Peguis Trail 2017 - 7,200,000 6,354,248 845,752 88.251832000517 Bike Lane-McDermot (Phase 1) 2017 - 2,300,000 1,892,330 407,670 82.281832000617 McDermot/Bannatyne (Phase 2) M 2017 2,250,000 4,000,000 3,388,815 611,185 84.721832000717 Bike Lane-Chevrier & Waverley 2017 - 8,180,000 7,843,321 336,679 95.881806101918 Rec Walkways and Bk Path Renew 2018 500,000 498,375 450,324 48,051 90.361832000118 Pedestrian & Cycling Program 2018 3,150,000 3,150,000 1,269,346 1,880,654 40.301833000218 Parking & St Enhance-Exchange 2018 1,500,000 1,500,000 349,016 1,150,984 23.271806101919 Rec Walkways and Bk Path Renew 2019 500,000 500,000 92,111 407,889 18.421832000119 Pedestrian & Cycling Program 2019 3,023,676 3,023,676 123,591 2,900,085 4.091833000119 Transportation Master Plan 2019 250,000 250,000 - 250,000 0.001833000219 Air Force Way Realign-Phase 2 2019 - - - - 0.00

Capital Expenditures Monthly ReportPage: 5 of 44
Run Date: December 10, 2019
Report as of November 30, 2019
Project Id DescriptionProject
YearAdopted Budget
Amended Budget
Actual Costs to Report Date
Available Balance
% Spent
Total Active Transportation Facilities 30,628,676 50,054,726 36,702,015 13,352,710 73.32
Street Improvements1803000112 Plessis Road Twinning and Grad 2012 87,500,000 86,665,000 83,764,155 2,900,845 96.651803000213 Polo Park-Infrastructure Imp M 2013 40,000,000 45,300,000 36,464,043 8,835,957 80.491803000117 Kenaston-McGillivray/Bishop 2017 2,200,000 2,192,850 1,263,045 929,805 57.601803000217 Lag & Sage Creek-SB Left Turn 2017 500,000 685,375 627,996 57,379 91.631803000617 Kenaston-Ness/Taylor 2017 100,000 100,000 80,319 19,681 80.321804101218 Kenaston-Ness/Taylor 2018 200,000 200,000 163,653 36,347 81.831803000319 Marion St Improv-FuncDesStudy 2019 916,538 916,538 1,178 915,360 0.13Total Street Improvements 131,416,538 136,059,763 122,364,389 13,695,374 89.93
Traffic Engineering Improvements1831200115 Transportation Mngmt Centre 2015 3,000,000 3,660,000 3,349,920 310,080 91.531831000117 Traffic Engineer Improve P 2017 1,000,000 1,000,000 596,387 403,613 59.641831000118 Traffic Engineer Improve P 2018 1,100,000 1,100,000 725,053 374,947 65.911831100118 Traffic Signals Improvements 2018 215,000 215,000 174,199 40,801 81.021831200118 Permanent Traffic Monitoring 2018 770,000 770,000 287,191 482,809 37.301831000119 Traffic Engineer Improve P 2019 1,575,000 4,075,000 333,599 3,741,401 8.191831100119 Traffic Signals Improvements 2019 1,030,000 1,030,000 783,851 246,149 76.101831100219 Traffic Signals Loops 2019 250,000 250,000 90,753 159,247 36.301831200119 Permanent Traffic Monitoring 2019 945,000 945,000 - 945,000 0.00Total Traffic Engineering Improvements 9,885,000 13,045,000 6,340,953 6,704,047 48.61
Developer Paybacks1807000117 Developer Payback-Various Loc 2017 5,000,000 5,648,203 4,148,023 1,500,180 73.441807000118 Developer Payback-Various Loc 2018 10,137,000 10,137,000 6,792,133 3,344,867 67.001807000518 Tuxedo Yards Development 2018 2,444,000 2,444,000 2,396,078 47,922 98.04Total Developer Paybacks 17,581,000 18,229,203 13,336,235 4,892,968 73.16
Sidewalk and Curb Repair1804200315 Detectable Warning Surf Reg St 2015 100,000 99,625 32,110 67,515 32.231804200116 Sidewk/Curb Renew - Reg St 2016 500,000 498,375 490,944 7,431 98.51

Capital Expenditures Monthly ReportPage: 6 of 44
Run Date: December 10, 2019
Report as of November 30, 2019
Project Id DescriptionProject
YearAdopted Budget
Amended Budget
Actual Costs to Report Date
Available Balance
% Spent
1804200316 Detectable Warning Surf Reg St 2016 100,000 99,675 94,971 4,704 95.281804200317 Detectable Warning Surf Reg St 2017 100,000 99,675 88,152 11,523 88.441804200118 Sidewalk/Curb Renewals-Reg St 2018 500,000 498,375 358,078 140,297 71.851804200218 Sidewalk/Curb Renew-Dtwn RegSt 2018 500,000 498,375 419,533 78,842 84.181804200318 Detectable Warning Surf Reg St 2018 100,000 99,675 56,059 43,616 56.241804200119 Sidewalk/Curb Renewals-Reg St 2019 500,000 500,000 310,622 189,378 62.121804200219 Detectable Warning Surf Reg St 2019 100,000 100,000 43,696 56,304 43.701804200319 Sidewalk/Curb Renew-Dtwn RegSt 2019 1,500,000 1,500,000 305,344 1,194,656 20.36Total Sidewalk and Curb Repair 4,000,000 3,993,775 2,199,508 1,794,267 55.07
Total Regional Streets 395,486,190 466,857,120 337,078,744 129,778,376 72.20
Local StreetsStreet Renewals1806100116 16-LI-01 Granular Imp 2016 2,000,000 1,993,500 1,959,644 33,856 98.301806100216 LSR 16-R-01 Morrison 2016 5,935,176 4,364,979 4,165,423 199,557 95.431806100516 LSR 16-R-04 AECOM 2016 2,962,166 2,813,661 2,655,785 157,876 94.391806100816 LSR 16-R-07 WSP 2016 1,500,000 1,495,125 1,388,264 106,861 92.851806100117 LSR 17/16-R-02 Morrison 2017 807,588 664,963 624,153 40,810 93.861806100217 LSR 17/16-R-03 MMM 2017 2,516,472 2,508,293 2,176,012 332,282 86.751806100317 LSR 17/16-R-03B MMM 2017 639,036 636,959 479,007 157,953 75.201806100417 LSR 17/16-R-04 AECOM 2017 577,800 740,591 673,778 66,813 90.981806100517 LSR 17/16-R-05B AECOM 2017 1,322,408 1,678,110 1,670,502 7,608 99.551806100717 LSR 17-R-01 IN-HOUSE 2017 2,866,000 3,718,000 3,543,356 174,644 95.301806100817 LSR 17-R-02 MMM 2017 4,326,000 4,311,940 3,392,110 919,831 78.671806100917 LSR 17-R-03 AECOM 2017 4,803,720 5,484,108 5,337,096 147,012 97.321806101017 LSR 17-R-04 MMM 2017 4,844,000 4,528,257 4,301,060 227,197 94.981806101117 LSR 17-R-05 AECOM 2017 5,772,000 1,572,984 1,514,177 58,807 96.261806101217 LSR 17-R-06 MMM 2017 4,802,000 2,899,140 2,873,819 25,321 99.131806101317 LSR 17/16-R-07-WSP 2017 1,500,000 2,372,125 2,076,459 295,666 87.541806101417 17-LI-01 WSP - Granular Imp 2017 1,520,000 995,060 971,889 23,171 97.671806101517 Ind St 17-RI-01 2017 9,384,000 9,053,502 8,691,078 362,424 96.001806101617 Residential TBO A 2017 1,750,000 1,744,312 1,116,380 627,932 64.00

Capital Expenditures Monthly ReportPage: 7 of 44
Run Date: December 10, 2019
Report as of November 30, 2019
Project Id DescriptionProject
YearAdopted Budget
Amended Budget
Actual Costs to Report Date
Available Balance
% Spent
1806101717 Residential TBO B 2017 1,750,000 1,744,312 1,017,877 726,436 58.351806101817 Residential TBO C 2017 1,500,000 1,500,000 1,394,488 105,512 92.971806102117 LSR 17-R-05B AECOM 2017 - 4,540,257 4,474,957 65,300 98.561806102217 LSR 17-R-06B MMM 2017 - 2,214,628 1,820,060 394,568 82.181806102317 LSR - McDermot-Arlington/Furby 2017 - 300,000 282,094 17,906 94.031806100118 LSR - Rue Des Trappistes 2018 1,609,100 923,869 813,910 109,959 88.101806100119 LSR 18-RI-01 AECOM 2018 5,730,000 5,230,000 2,719,281 2,510,719 51.991806100218 LSR 18-RI-01 AECOM 2018 9,000,000 8,970,750 8,703,017 267,733 97.021806100219 LSR 18-RI-02 WSP 2018 3,130,000 3,045,000 2,628,532 416,468 86.321806100318 LSR 18-RI-02 WSP 2018 7,000,000 2,977,250 2,426,349 550,901 81.501806100418 LSR 18-R-02A AECOM 2018 5,000,000 5,733,750 5,106,616 627,134 89.061806100518 LSR 18-R-03 Morrison 2018 3,000,000 5,373,250 4,976,769 396,481 92.621806100618 LSR 18-R-04 WSP 2018 3,000,000 4,895,250 4,386,225 509,025 89.601806100718 LSR 18-R-05 Morrison 2018 2,000,000 2,993,500 2,313,281 680,219 77.281806100818 LSR 18-R-06 WSP 2018 4,500,000 5,021,375 4,660,487 360,888 92.811806100918 LSR 18-R-07 Morrison 2018 3,000,000 5,578,250 5,204,106 374,144 93.291806101218 LSR 18-R-01 In-House 2018 2,500,000 5,678,200 5,496,679 181,521 96.801806101418 LSR 18-R-08- Waverley St 2018 3,000,000 5,195,125 1,174,324 4,020,801 22.601806101518 Residential TBO A 2018 1,750,000 1,744,312 1,350,820 393,493 77.441806101618 Residential TBO B 2018 1,750,000 1,744,312 1,298,592 445,721 74.451806101718 Residential TBO C 2018 1,500,000 1,500,000 1,210,671 289,329 80.711806102018 LSR - Assiniboine Park Dr 2018 - 330,000 301,789 28,211 91.451806102118 LSR 18-R-02B AECOM 2018 - 2,378,599 2,006,876 371,723 84.371806100419 LSR 19-R-02 A KGS 2019 700,000 3,050,000 1,353,592 1,696,408 44.381806100519 LSR 19-R-03 A WSP 2019 700,000 3,050,000 2,708,101 341,899 88.791806100619 LSR 19-R-04 B AECOM 2019 461,000 4,878,000 1,802,337 3,075,663 36.951806100719 LSR 19-R-05 Dillon 2019 461,000 2,400,000 1,266,118 1,133,882 52.751806100819 LSR 19-R-06 Dillon 2019 - - - - 0.001806100919 LSR 19-R-03 B WSP 2019 700,000 2,550,000 1,296,747 1,253,253 50.851806101019 LSR 19-R-03 C WSP 2019 - 148,500 - 148,500 0.001806101119 LSR 19-R-04 A AECOM 2019 461,000 120,000 104,069 15,931 86.721806101219 LSR 19-R-02 B KGS 2019 700,000 3,425,000 1,281,939 2,143,061 37.43

Capital Expenditures Monthly ReportPage: 8 of 44
Run Date: December 10, 2019
Report as of November 30, 2019
Project Id DescriptionProject
YearAdopted Budget
Amended Budget
Actual Costs to Report Date
Available Balance
% Spent
1806101319 Residential TBO A 2019 1,500,000 1,500,000 1,322,584 177,416 88.171806101419 Residential TBO B 2019 1,500,000 1,500,000 1,217,843 282,157 81.191806101719 Granular Road - Road Oiling 2019 500,000 500,000 24,115 475,885 4.821806101819 Granular Lane Improvements 2019 700,000 700,000 248,166 451,834 35.451806102019 AssinPkDr-ComissryRd to ZooDr 2019 800,000 800,000 633,123 166,877 79.141806102119 LSR 19-R-01(A) In-House 2019 690,000 3,386,500 2,652,792 733,708 78.331806102219 LSR 19-R-01(B) In-House 2019 - - - - 0.001806200119 Sidewalk Renewals Local Street 2019 800,000 800,000 765,145 34,855 95.64Total Street Renewals 131,220,466 161,995,603 132,054,462 29,941,141 81.52
Lane Renewals1806300216 Lane Renewals-16-RL-01B WSP 2016 3,003,616 3,703,854 3,250,159 453,695 87.751806300117 Lane Renewals - 17-RL-01A WSP 2017 2,981,000 3,121,312 2,897,878 223,434 92.841806300217 Lane Renewals - 17-RL-01B WSP 2017 2,981,000 2,971,312 2,420,810 550,502 81.471806101118 18-LI-01 WSP - Granular Imp 2018 1,000,000 996,750 946,309 50,441 94.941806300118 Lane Renewals - 18-RL-01A 2018 2,796,300 3,203,202 3,116,017 87,185 97.281806300218 Lane Renewals - 18-RL-01B 2018 2,796,300 3,379,902 3,100,523 279,379 91.731806300318 Lane Renewals - 18-RL-01C 2018 2,796,300 3,087,202 2,824,502 262,700 91.491806300119 Alley Package - 19-RL-01 2019 182,500 182,500 162,054 20,446 88.801806300319 Alley Package - 19-RL-03 2019 182,500 182,500 182,388 112 99.94Total Lane Renewals 18,719,516 20,828,534 18,900,639 1,927,895 90.74
Sidewalks1806200116 Sidewalk Renewals Local Street 2016 2,400,000 2,392,200 2,259,492 132,708 94.451806200117 Sidewalk Renewals Local Street 2017 800,000 797,400 644,419 152,981 80.821806200118 Sidewalk Renewals Local Street 2018 800,000 797,400 412,572 384,828 51.74Total Sidewalks 4,000,000 3,987,000 3,316,484 670,516 83.18
Waterway Crossings and Grade Separations Various1805001413 Waverley Street at CN Mainline 2013 156,282,000 156,282,000 75,906,434 80,375,566 48.571805001414 Louise Bridge (Red River) 2014 2,581,000 2,581,000 700,994 1,880,006 27.161805001514 Ness Ave Culvert (Sturgeon Cr) 2014 11,000,000 8,500,000 8,278,213 221,787 97.391805001715 Lyndale Drive-Retaining Wall M 2015 6,200,000 4,800,000 4,694,709 105,291 97.81

Capital Expenditures Monthly ReportPage: 9 of 44
Run Date: December 10, 2019
Report as of November 30, 2019
Project Id DescriptionProject
YearAdopted Budget
Amended Budget
Actual Costs to Report Date
Available Balance
% Spent
1805001916 Fermor Ave Bridge (Seine R) M 2016 10,900,000 14,500,000 12,765,502 1,734,498 88.041805002016 Sask Ave Culvert (Sturgn Crk)M 2016 10,000,000 7,000,000 6,032,174 967,826 86.171805001317 Kenstn/Rt90 Wide & StJamsBridg 2017 5,408,000 5,408,000 2,308,231 3,099,769 42.681805000118 Waterway Crossing & Grade Sep 2018 3,000,000 3,000,000 2,608,372 391,628 86.951805002118 Dublin Av Bridge (Omands Crk)M 2018 1,400,000 4,700,000 663,319 4,036,681 14.111805000119 Waterway Crossing & Grade Sep 2019 3,000,000 3,000,271 1,265,928 1,734,343 42.191805002419 Sherwin Road Bridge (Omand's) 2019 700,000 700,000 21,357 678,643 3.05Total Waterway Crossings and Grade Separations Various
210,471,000 210,471,271 115,245,233 95,226,038 54.76
Disraeli Bridge1805001117 Disraeli Bridges-Future Pmnt 2017 18,325,000 17,895,000 17,821,965 73,035 99.591805001118 Disraeli Bridges-Future Pmnt 2018 18,250,000 18,250,000 16,816,709 1,433,291 92.151805001119 Disraeli Bridges-Future Pmnt 2019 14,780,000 14,780,000 11,862,460 2,917,540 80.26Total Disraeli Bridge 51,355,000 50,925,000 46,501,134 4,423,866 91.31
Total Local Streets 415,765,982 448,207,408 316,017,952 132,189,456 70.51
Other Street ProjectsNew Transportation1801000314 Chief Peguis Trail -Main/Rt 90 2014 1,500,000 4,000,000 3,858,602 141,398 96.471801000414 William Clement Parkway 2014 800,000 1,600,000 1,532,182 67,818 95.761801000217 Chief Peguis Trail-Future Pmnt 2017 7,185,000 6,778,678 6,718,678 60,000 99.111801000218 Chief Peguis Trail-Future Pmnt 2018 7,230,000 7,230,000 7,146,794 83,206 98.851801000219 Chief Peguis Trail-Future Pmnt 2019 7,263,000 7,263,000 6,583,659 679,341 90.65Total New Transportation 23,978,000 26,871,678 25,839,916 1,031,763 96.16
Land Acquisition1834000116 Land Acq - Transp Right of Way 2016 300,000 300,000 76,940 223,060 25.65Total Land Acquisition 300,000 300,000 76,940 223,060 25.65
Land Drainage Sewer1813000117 Land Drainage Sewer-Reg/Loc St 2017 1,000,000 998,200 491,462 506,738 49.23Total Land Drainage Sewer 1,000,000 998,200 491,462 506,738 49.23
Capital Expenditures Monthly ReportPage: 10 of 44
Run Date: December 10, 2019
Report as of November 30, 2019
Project Id DescriptionProject
YearAdopted Budget
Amended Budget
Actual Costs to Report Date
Available Balance
% Spent
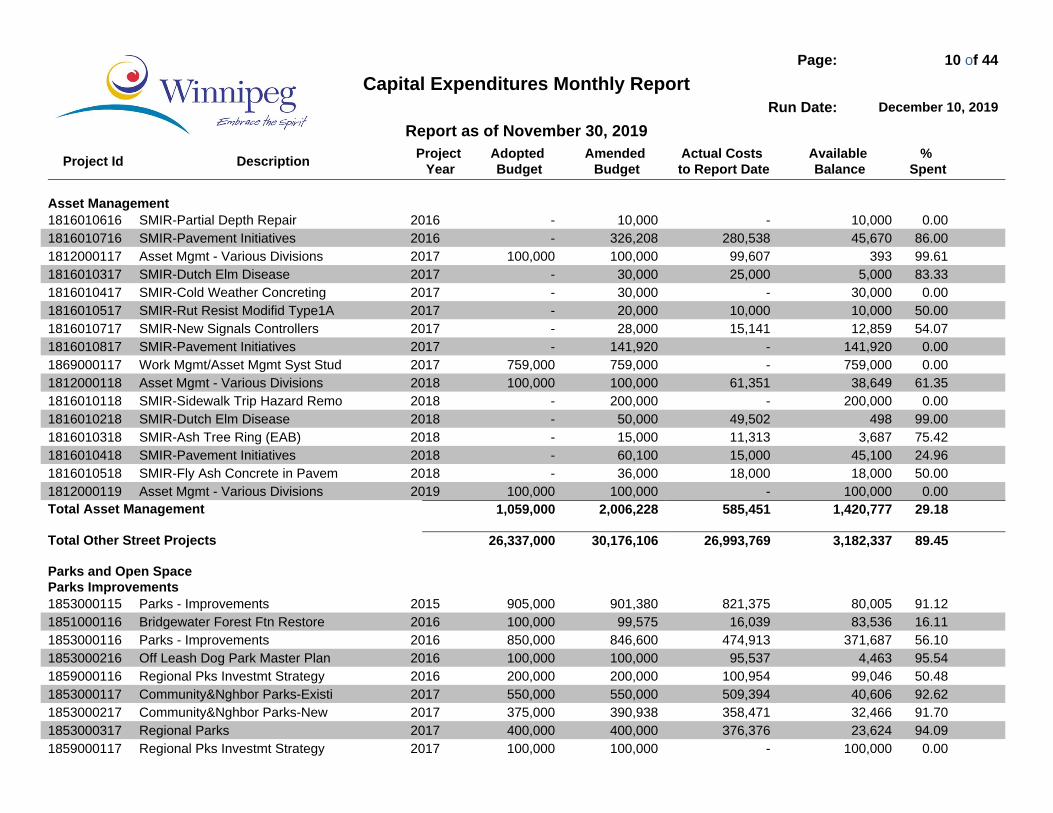
Asset Management1816010616 SMIR-Partial Depth Repair 2016 - 10,000 - 10,000 0.001816010716 SMIR-Pavement Initiatives 2016 - 326,208 280,538 45,670 86.001812000117 Asset Mgmt - Various Divisions 2017 100,000 100,000 99,607 393 99.611816010317 SMIR-Dutch Elm Disease 2017 - 30,000 25,000 5,000 83.331816010417 SMIR-Cold Weather Concreting 2017 - 30,000 - 30,000 0.001816010517 SMIR-Rut Resist Modifid Type1A 2017 - 20,000 10,000 10,000 50.001816010717 SMIR-New Signals Controllers 2017 - 28,000 15,141 12,859 54.071816010817 SMIR-Pavement Initiatives 2017 - 141,920 - 141,920 0.001869000117 Work Mgmt/Asset Mgmt Syst Stud 2017 759,000 759,000 - 759,000 0.001812000118 Asset Mgmt - Various Divisions 2018 100,000 100,000 61,351 38,649 61.351816010118 SMIR-Sidewalk Trip Hazard Remo 2018 - 200,000 - 200,000 0.001816010218 SMIR-Dutch Elm Disease 2018 - 50,000 49,502 498 99.001816010318 SMIR-Ash Tree Ring (EAB) 2018 - 15,000 11,313 3,687 75.421816010418 SMIR-Pavement Initiatives 2018 - 60,100 15,000 45,100 24.961816010518 SMIR-Fly Ash Concrete in Pavem 2018 - 36,000 18,000 18,000 50.001812000119 Asset Mgmt - Various Divisions 2019 100,000 100,000 - 100,000 0.00Total Asset Management 1,059,000 2,006,228 585,451 1,420,777 29.18
Total Other Street Projects 26,337,000 30,176,106 26,993,769 3,182,337 89.45
Parks and Open SpaceParks Improvements1853000115 Parks - Improvements 2015 905,000 901,380 821,375 80,005 91.121851000116 Bridgewater Forest Ftn Restore 2016 100,000 99,575 16,039 83,536 16.111853000116 Parks - Improvements 2016 850,000 846,600 474,913 371,687 56.101853000216 Off Leash Dog Park Master Plan 2016 100,000 100,000 95,537 4,463 95.541859000116 Regional Pks Investmt Strategy 2016 200,000 200,000 100,954 99,046 50.481853000117 Community&Nghbor Parks-Existi 2017 550,000 550,000 509,394 40,606 92.621853000217 Community&Nghbor Parks-New 2017 375,000 390,938 358,471 32,466 91.701853000317 Regional Parks 2017 400,000 400,000 376,376 23,624 94.091859000117 Regional Pks Investmt Strategy 2017 100,000 100,000 - 100,000 0.00

Capital Expenditures Monthly ReportPage: 11 of 44
Run Date: December 10, 2019
Report as of November 30, 2019
Project Id DescriptionProject
YearAdopted Budget
Amended Budget
Actual Costs to Report Date
Available Balance
% Spent
1853000118 Community&Nghbor Parks-Existi 2018 150,000 150,000 140,738 9,262 93.831853000318 Regional Parks 2018 250,000 250,000 138,230 111,770 55.291853000418 St. John's Park Lighting 2018 - 394,000 283,514 110,486 71.961853000119 Community&Nghbor Parks-Existi 2019 170,000 - - - 0.00Total Parks Improvements 4,150,000 4,382,492 3,315,541 1,066,951 75.65
Community Parks6318010116 Regionl&Communty Pks-Bldgs 2016 1,200,000 1,200,000 1,013,629 186,371 84.471854000117 Parks Master Plan 2017 300,000 300,000 146,363 153,637 48.796318010117 Kildonan Park Staff House 2017 - 1,991,800 1,952,798 39,002 98.046318020119 Parks Buildings 2019 350,000 350,000 65 349,935 0.02Total Community Parks 1,850,000 3,841,800 3,112,854 728,946 81.03
Athletic Fields Improvements1852000218 Memorial Pk Soccer Pitch Light 2018 - 310,000 261,851 48,149 84.471852000119 Athletic Fields - Improvements 2019 350,000 350,000 - 350,000 0.00Total Athletic Fields Improvements 350,000 660,000 261,851 398,149 39.67
Reforestation, Streets and Aesthetic Improvements1850000118 Reforestation - Improvements 2018 766,000 766,000 765,664 336 99.961850000218 Urban Forest Enhancement 2018 6,334,000 6,334,000 6,030,285 303,715 95.211850000119 Reforestation - Improvements 2019 383,000 383,000 373,064 9,936 97.411850000219 Urban Forest Enhancement 2019 4,100,000 4,100,000 1,104,540 2,995,460 26.94Total Reforestation, Streets and Aesthetic Improvements 11,583,000 11,583,000 8,273,553 3,309,447 71.43
Pathway/Roadway/Tennis Court Upgrading1856000115 Hardsurface Upgrading 2015 150,000 149,400 149,400 - 100.001856000217 Boat Docks & Lauches 2017 1,500,000 300,000 - 300,000 0.001856000317 Parks Road Renewal 2017 420,000 420,000 418,471 1,529 99.64Total Pathway/Roadway/Tennis Court Upgrading 2,070,000 869,400 567,871 301,529 65.32
Community Park Amenities1857002014 Crescent Drive Park 2014 200,000 950,000 308,779 641,221 32.501857000117 Parks & Rec Enhancement P 2017 3,300,000 3,300,000 2,863,106 436,894 86.76

Capital Expenditures Monthly ReportPage: 12 of 44
Run Date: December 10, 2019
Report as of November 30, 2019
Project Id DescriptionProject
YearAdopted Budget
Amended Budget
Actual Costs to Report Date
Available Balance
% Spent
1857000218 PREP-Charleswood - Tuxedo 2018 224,000 224,000 186,866 37,134 83.421857000318 PREP-Daniel McIntyre 2018 224,000 224,000 119,557 104,443 53.371857000418 PREP-Elmwood-East Kildonan 2018 224,000 224,000 213,202 10,798 95.181857000518 PREP-Fort Rouge-East Fort Garr 2018 224,000 224,000 4,635 219,365 2.071857000718 PREP-North Kildonan 2018 224,000 224,000 209,557 14,443 93.551857000818 PREP-Old Kildonan 2018 224,000 224,000 176,892 47,108 78.971857000918 PREP-Point Douglas 2018 224,000 224,000 152,996 71,004 68.301857001018 PREP-River Heights-Fort Garry 2018 224,000 224,000 199,055 24,945 88.861857001118 PREP-St. Boniface 2018 224,000 224,000 211,754 12,246 94.531857001218 PREP-St. Charles 2018 224,000 224,000 222,458 1,542 99.311857001318 PREP-St. James-Brooklands 2018 224,000 224,000 220,126 3,874 98.271857001418 PREP-S. Winnipeg - St. Norbert 2018 224,000 224,000 156,531 67,469 69.881857001518 PREP-St. Vital 2018 224,000 104,000 69,350 34,650 66.681857001618 PREP-Transcona 2018 224,000 224,000 213,574 10,426 95.351857001718 PREP-Priority Safety-Related 2018 300,000 300,000 255,156 44,844 85.051857000119 Parks & Rec Enhancement 2019 - - - - 0.001857000219 PREP-Charleswood-Tuxedo-Westwo 2019 200,000 200,000 - 200,000 0.001857000319 PREP-Daniel McIntyre 2019 200,000 200,000 71,781 128,219 35.891857000419 PREP-Elmwood-East Kildonan 2019 200,000 200,000 40,031 159,969 20.021857000519 PREP-Fort Rouge-East Fort Garr 2019 200,000 200,000 - 200,000 0.001857000619 PREP-Mynarski 2019 200,000 130,000 21,289 108,711 16.381857000719 PREP-North Kildonan 2019 200,000 200,000 71,430 128,570 35.711857000819 PREP-Old Kildonan 2019 200,000 200,000 2,117 197,883 1.061857000919 PREP-Point Douglas 2019 200,000 200,000 130,960 69,040 65.481857001019 PREP-River Heights-Fort Garry 2019 200,000 200,000 14,631 185,369 7.321857001119 PREP-St. Boniface 2019 200,000 200,000 38,018 161,982 19.011857001219 PREP-Waverley West 2019 200,000 200,000 8,903 191,097 4.451857001319 PREP-St. James 2019 200,000 200,000 101,961 98,039 50.981857001419 PREP-St. Norbert - Seine River 2019 200,000 200,000 - 200,000 0.001857001519 PREP-St. Vital 2019 200,000 200,000 - 200,000 0.001857001619 PREP-Transcona 2019 200,000 200,000 12,994 187,006 6.501857001719 PREP-Priority Safety-Related 2019 300,000 300,000 205,153 94,847 68.38

Capital Expenditures Monthly ReportPage: 13 of 44
Run Date: December 10, 2019
Report as of November 30, 2019
Project Id DescriptionProject
YearAdopted Budget
Amended Budget
Actual Costs to Report Date
Available Balance
% Spent
1858000119 St James Optimist Park Restore 2019 - 911,262 47,906 863,357 5.26Total Community Park Amenities 10,236,000 11,707,262 6,550,768 5,156,494 55.95
Insect Control - Safe storage and handling of Chemicals1858000315 Insect Control-Repl 3Grey St. 2015 300,000 300,000 274,590 25,410 91.53Total Insect Control - Safe storage and handling of Chemicals
300,000 300,000 274,590 25,410 91.53
Total Parks and Open Space 30,539,000 33,343,955 22,357,030 10,986,925 67.05
Total Public Works 868,128,172 978,584,590 702,447,496 276,137,094 71.78
TransitTransit Security EnhanceTransit Safety Mgmt Practices4210001218 Transit Safety Mgmt Practices 2018 460,000 460,000 189,158 270,842 41.124210001318 Bus Communication Moderization 2018 1,140,000 1,140,000 41,328 1,098,672 3.634210001219 Transit Safety Mgmt Practices 2019 165,000 165,000 59,853 105,147 36.274210001319 Bus Communication Moderization 2019 1,140,000 1,140,000 29,646 1,110,354 2.604210001619 Bus Op Comp Safety Shields 2019 3,150,000 3,150,000 490,852 2,659,148 15.584210010719 Admin & Ctrl Centre Radio Repl 2019 1,000,000 1,000,000 - 1,000,000 0.00Total Transit Safety Mgmt Practices 7,055,000 7,055,000 810,838 6,244,162 11.49
Total Transit Security Enhance 7,055,000 7,055,000 810,838 6,244,162 11.49
Transit Building Replacement/Refurbishment2017 Building General4210000317 Trn Bldg Replce/Refurb General 2017 1,468,000 1,023,000 20,725 1,002,275 2.03Total 2017 Building General 1,468,000 1,023,000 20,725 1,002,275 2.03
Maintenance Facility Expansion4210000417 Expansion of Transit Mtnce Fac 2017 53,200,000 53,200,000 47,640,778 5,559,222 89.55Total Maintenance Facility Expansion 53,200,000 53,200,000 47,640,778 5,559,222 89.55
Building Upgrades

Capital Expenditures Monthly ReportPage: 14 of 44
Run Date: December 10, 2019
Report as of November 30, 2019
Project Id DescriptionProject
YearAdopted Budget
Amended Budget
Actual Costs to Report Date
Available Balance
% Spent
4210000517 Trn Bldg Roof and Ventil Upgra 2017 3,550,000 3,550,000 3,493,360 56,640 98.404210010219 Trn Bldg Roof and Ventil Upgra 2019 2,334,500 2,334,500 1,055,622 1,278,878 45.224210010419 Hoist Replacement at FRG 2019 1,400,000 1,400,000 70,937 1,329,063 5.074210010519 Rapid OH Doors at Washrack 2019 600,000 600,000 30,025 569,975 5.004210010619 Heavy Shop Equip Replacement 2019 1,805,000 1,805,000 410,503 1,394,497 22.74Total Building Upgrades 9,689,500 9,689,500 5,060,447 4,629,053 52.23
2016 Building General4210010116 Trn Bldg Replce/Refurb General 2016 - 1,960,000 1,608,528 351,472 82.07Total 2016 Building General 0 1,960,000 1,608,528 351,472 82.07
2018 Building General4210010118 Trn Bldg Replce/Refurb General 2018 956,000 956,000 98,007 857,993 10.254210010218 Trn Bldg Roof and Ventil Upgra 2018 300,000 300,000 158,162 141,838 52.72Total 2018 Building General 1,256,000 1,256,000 256,168 999,832 20.40
2019 Building General4210010319 Garage Improvements Phase 2 2019 1,500,000 1,500,000 1,086,748 413,252 72.45Total 2019 Building General 1,500,000 1,500,000 1,086,748 413,252 72.45
Total Transit Building Replacement/Refurbishment 67,113,500 68,628,500 55,673,394 12,955,106 81.12
Fare Collection SystemFare Collection/ Peggo Card System4230001409 Fare Collection System M 2009 15,240,000 17,740,000 15,164,244 2,575,756 85.48Total Fare Collection/ Peggo Card System 15,240,000 17,740,000 15,164,244 2,575,756 85.48
Total Fare Collection System 15,240,000 17,740,000 15,164,244 2,575,756 85.48
Innovative Transit Program2016 Innovative Transit Program4230030116 Innovative Transit Program 2016 2,425,000 2,425,000 1,892,473 532,527 78.04Total 2016 Innovative Transit Program 2,425,000 2,425,000 1,892,473 532,527 78.04
2017 Innovative Transit Program

Capital Expenditures Monthly ReportPage: 15 of 44
Run Date: December 10, 2019
Report as of November 30, 2019
Project Id DescriptionProject
YearAdopted Budget
Amended Budget
Actual Costs to Report Date
Available Balance
% Spent
4230030117 Innovative Transit Program 2017 565,000 565,000 539,020 25,980 95.40Total 2017 Innovative Transit Program 565,000 565,000 539,020 25,980 95.40
2018 Innovative Transit Program4230030118 Innovative Transit Program 2018 500,000 500,000 144,103 355,897 28.82Total 2018 Innovative Transit Program 500,000 500,000 144,103 355,897 28.82
2019 Innovative Transit Program4230030119 Innovative Transit Program 2019 700,000 700,000 - 700,000 0.00Total 2019 Innovative Transit Program 700,000 700,000 0 700,000 0.00
Total Innovative Transit Program 4,190,000 4,190,000 2,575,596 1,614,404 61.47
Transit Buses2016 Transit Buses4210000216 Transit Buses 2016 2016 32,456,000 32,456,000 26,649,290 5,806,710 82.11Total 2016 Transit Buses 32,456,000 32,456,000 26,649,290 5,806,710 82.11
2017 Transit Buses4210000217 Transit Buses 2017 2017 22,408,000 16,870,000 16,430,059 439,941 97.39Total 2017 Transit Buses 22,408,000 16,870,000 16,430,059 439,941 97.39
2018 Transit Buses4210000218 Transit Buses 2018 2018 54,934,000 28,352,000 25,230,120 3,121,880 88.99Total 2018 Transit Buses 54,934,000 28,352,000 25,230,120 3,121,880 88.99
2017 Transit Bus Cameras4210001217 Bus Fleet Cameras 2017 500,000 500,000 231,786 268,214 46.36Total 2017 Transit Bus Cameras 500,000 500,000 231,786 268,214 46.36
2019 Transit Buses4210000219 Transit Buses 2019 2019 22,209,000 22,209,000 41,235 22,167,765 0.19Total 2019 Transit Buses 22,209,000 22,209,000 41,235 22,167,765 0.19
Electric Buses

Capital Expenditures Monthly ReportPage: 16 of 44
Run Date: December 10, 2019
Report as of November 30, 2019
Project Id DescriptionProject
YearAdopted Budget
Amended Budget
Actual Costs to Report Date
Available Balance
% Spent
4210001419 Electric Bus Study 2019 1,000,000 1,000,000 27,503 972,497 2.75Total Electric Buses 1,000,000 1,000,000 27,503 972,497 2.75
Low Income Bus Pass4230040119 Low Income Bus Pass 2019 236,000 236,000 47,376 188,624 20.07Total Low Income Bus Pass 236,000 236,000 47,376 188,624 20.07
Total Transit Buses 133,743,000 101,623,000 68,657,369 32,965,631 67.56
Transit ImprovementsTransit Improvements4210001519 Heated Bus Shelter Program 2019 1,031,000 1,031,000 52,724 978,276 5.114230030219 Accessibility Program 2019 500,000 500,000 - 500,000 0.00Total Transit Improvements 1,531,000 1,531,000 52,724 1,478,276 3.44
Total Transit Improvements 1,531,000 1,531,000 52,724 1,478,276 3.44
Rapid TransitJubilee Rapid Transit Station4230010313 Jubilee Rapid Tr Station 2013 2013 1,667,000 3,016,866 2,481,915 534,951 82.27Total Jubilee Rapid Transit Station 1,667,000 3,016,866 2,481,915 534,951 82.27
SWRT Stg2 & Pembina Construction4230010514 SWRT Stage 2 & Pembina Upfront 2014 587,300,000 467,300,000 259,405,404 207,894,596 55.51Total SWRT Stg2 & Pembina Construction 587,300,000 467,300,000 259,405,404 207,894,596 55.51
SWRT Stg2 & Pembina UP Upfront4230010519 SWRT2 2019 P3 Payment 2019 1,780,000 1,780,000 878,642 901,358 49.36Total SWRT Stg2 & Pembina UP Upfront 1,780,000 1,780,000 878,642 901,358 49.36
Rapid Transit Planning4230010612 Rapid Transit Planning - P 2012 1,000,000 4,200,000 3,459,865 740,135 82.384230010616 Rapid Transit Plan & Design 2016 2,500,000 2,500,000 533,975 1,966,025 21.364230020117 Rapid Transit Master Plan 2017 - 3,200,000 1,597,577 1,602,423 49.92Total Rapid Transit Planning 3,500,000 9,900,000 5,591,417 4,308,583 56.48

Capital Expenditures Monthly ReportPage: 17 of 44
Run Date: December 10, 2019
Report as of November 30, 2019
Project Id DescriptionProject
YearAdopted Budget
Amended Budget
Actual Costs to Report Date
Available Balance
% Spent
Land Acquisition4230010716 Land Acquisition 2016 2,000,000 500,000 474,213 25,787 94.844210010819 Land Acquisition 2019 1,000,000 1,000,000 - 1,000,000 0.00Total Land Acquisition 3,000,000 1,500,000 474,213 1,025,787 31.61
SW Rapid Tr Corridor4230010518 SWRT2 2018 P3 Payment 2018 350,000 350,000 64,896 285,104 18.54Total SW Rapid Tr Corridor 350,000 350,000 64,896 285,104 18.54
Total Rapid Transit 597,597,000 483,846,866 268,896,486 214,950,380 55.57
Total Transit 826,469,500 684,614,366 411,830,651 272,783,715 60.16
Community Services (including Community Incentive Grants)GrantsCommunity Incentive Grant Program6251000115 Community Incentive Grant Prog 2015 1,746,000 1,746,000 1,686,345 59,655 96.586251000116 Community Incentive Grant Prog 2016 1,665,000 1,665,000 1,444,320 220,680 86.756251000117 Community Incentive Grant Prog 2017 1,698,000 1,698,000 786,972 911,028 46.356251000118 Community Incentive Grant Prog 2018 1,732,000 1,732,000 195,120 1,536,880 11.276251000119 Community Incentive Grant Prog 2019 1,960,841 1,960,841 72,000 1,888,841 3.67Total Community Incentive Grant Program 8,801,841 8,801,841 4,184,758 4,617,084 47.54
Total Grants 8,801,841 8,801,841 4,184,758 4,617,084 47.54
Information TechnologySoftware6260000117 Business Application Systems 2017 142,000 142,000 126,296 15,704 88.94Total Software 142,000 142,000 126,296 15,704 88.94
Upgrade/Replace6210000319 Library Tech Upgrade/Replace 2019 350,000 350,000 271,431 78,569 77.556262000119 Tech Advancement Program 2019 312,000 312,000 45,637 266,363 14.63Total Upgrade/Replace 662,000 662,000 317,067 344,933 47.90
Capital Expenditures Monthly ReportPage: 18 of 44
Run Date: December 10, 2019
Report as of November 30, 2019
Project Id DescriptionProject
YearAdopted Budget
Amended Budget
Actual Costs to Report Date
Available Balance
% Spent
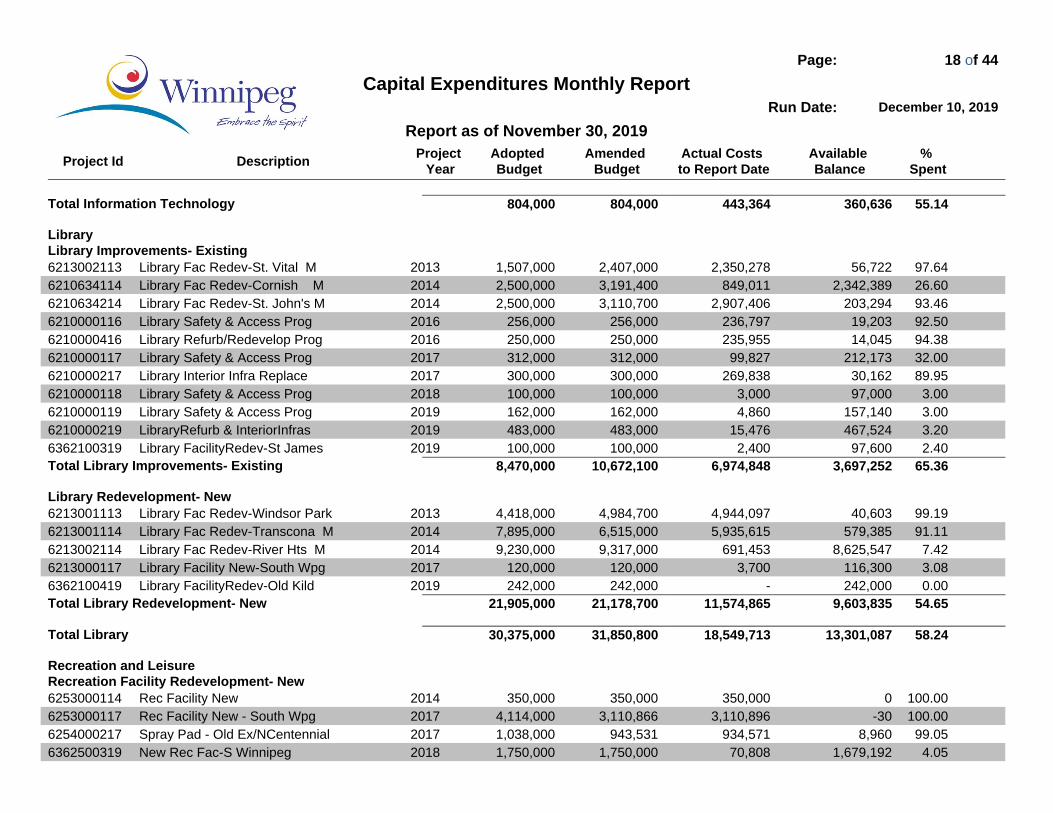
Total Information Technology 804,000 804,000 443,364 360,636 55.14
LibraryLibrary Improvements- Existing6213002113 Library Fac Redev-St. Vital M 2013 1,507,000 2,407,000 2,350,278 56,722 97.646210634114 Library Fac Redev-Cornish M 2014 2,500,000 3,191,400 849,011 2,342,389 26.606210634214 Library Fac Redev-St. John's M 2014 2,500,000 3,110,700 2,907,406 203,294 93.466210000116 Library Safety & Access Prog 2016 256,000 256,000 236,797 19,203 92.506210000416 Library Refurb/Redevelop Prog 2016 250,000 250,000 235,955 14,045 94.386210000117 Library Safety & Access Prog 2017 312,000 312,000 99,827 212,173 32.006210000217 Library Interior Infra Replace 2017 300,000 300,000 269,838 30,162 89.956210000118 Library Safety & Access Prog 2018 100,000 100,000 3,000 97,000 3.006210000119 Library Safety & Access Prog 2019 162,000 162,000 4,860 157,140 3.006210000219 LibraryRefurb & InteriorInfras 2019 483,000 483,000 15,476 467,524 3.206362100319 Library FacilityRedev-St James 2019 100,000 100,000 2,400 97,600 2.40Total Library Improvements- Existing 8,470,000 10,672,100 6,974,848 3,697,252 65.36
Library Redevelopment- New6213001113 Library Fac Redev-Windsor Park 2013 4,418,000 4,984,700 4,944,097 40,603 99.196213001114 Library Fac Redev-Transcona M 2014 7,895,000 6,515,000 5,935,615 579,385 91.116213002114 Library Fac Redev-River Hts M 2014 9,230,000 9,317,000 691,453 8,625,547 7.426213000117 Library Facility New-South Wpg 2017 120,000 120,000 3,700 116,300 3.086362100419 Library FacilityRedev-Old Kild 2019 242,000 242,000 - 242,000 0.00Total Library Redevelopment- New 21,905,000 21,178,700 11,574,865 9,603,835 54.65
Total Library 30,375,000 31,850,800 18,549,713 13,301,087 58.24
Recreation and LeisureRecreation Facility Redevelopment- New6253000114 Rec Facility New 2014 350,000 350,000 350,000 0 100.006253000117 Rec Facility New - South Wpg 2017 4,114,000 3,110,866 3,110,896 -30 100.006254000217 Spray Pad - Old Ex/NCentennial 2017 1,038,000 943,531 934,571 8,960 99.056362500319 New Rec Fac-S Winnipeg 2018 1,750,000 1,750,000 70,808 1,679,192 4.05
Capital Expenditures Monthly ReportPage: 19 of 44
Run Date: December 10, 2019
Report as of November 30, 2019
Project Id DescriptionProject
YearAdopted Budget
Amended Budget
Actual Costs to Report Date
Available Balance
% Spent
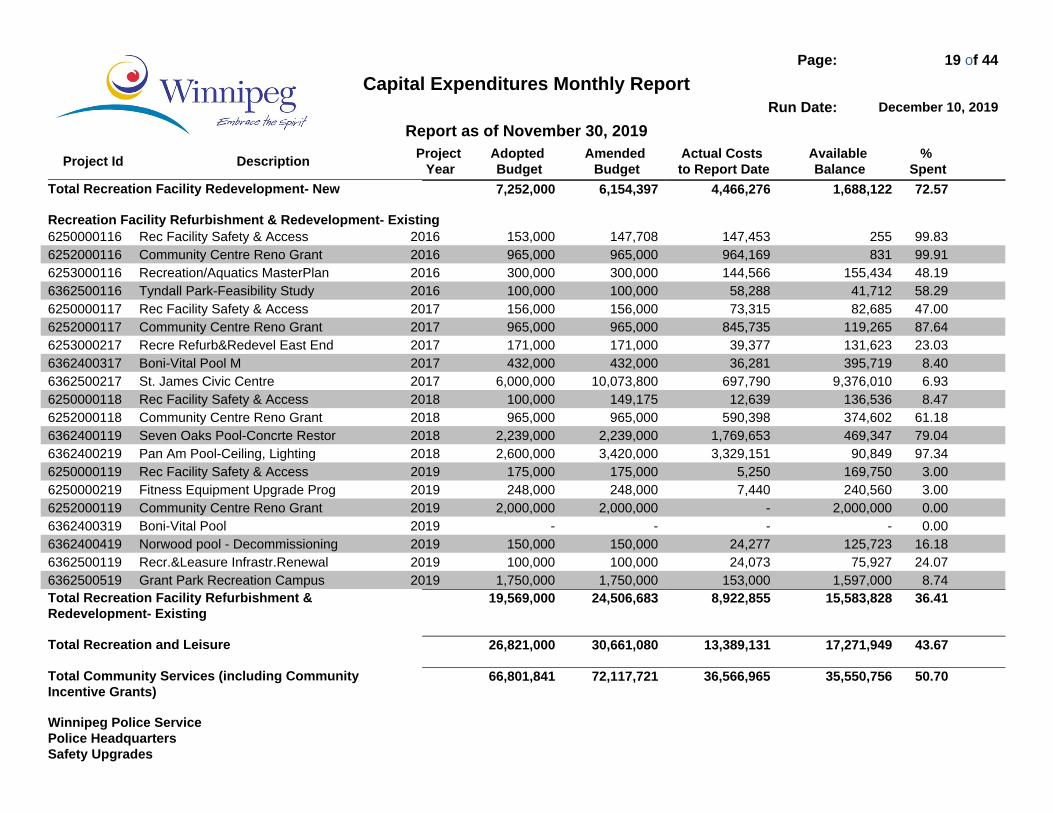
Total Recreation Facility Redevelopment- New 7,252,000 6,154,397 4,466,276 1,688,122 72.57
Recreation Facility Refurbishment & Redevelopment- Existing6250000116 Rec Facility Safety & Access 2016 153,000 147,708 147,453 255 99.836252000116 Community Centre Reno Grant 2016 965,000 965,000 964,169 831 99.916253000116 Recreation/Aquatics MasterPlan 2016 300,000 300,000 144,566 155,434 48.196362500116 Tyndall Park-Feasibility Study 2016 100,000 100,000 58,288 41,712 58.296250000117 Rec Facility Safety & Access 2017 156,000 156,000 73,315 82,685 47.006252000117 Community Centre Reno Grant 2017 965,000 965,000 845,735 119,265 87.646253000217 Recre Refurb&Redevel East End 2017 171,000 171,000 39,377 131,623 23.036362400317 Boni-Vital Pool M 2017 432,000 432,000 36,281 395,719 8.406362500217 St. James Civic Centre 2017 6,000,000 10,073,800 697,790 9,376,010 6.936250000118 Rec Facility Safety & Access 2018 100,000 149,175 12,639 136,536 8.476252000118 Community Centre Reno Grant 2018 965,000 965,000 590,398 374,602 61.186362400119 Seven Oaks Pool-Concrte Restor 2018 2,239,000 2,239,000 1,769,653 469,347 79.046362400219 Pan Am Pool-Ceiling, Lighting 2018 2,600,000 3,420,000 3,329,151 90,849 97.346250000119 Rec Facility Safety & Access 2019 175,000 175,000 5,250 169,750 3.006250000219 Fitness Equipment Upgrade Prog 2019 248,000 248,000 7,440 240,560 3.006252000119 Community Centre Reno Grant 2019 2,000,000 2,000,000 - 2,000,000 0.006362400319 Boni-Vital Pool 2019 - - - - 0.006362400419 Norwood pool - Decommissioning 2019 150,000 150,000 24,277 125,723 16.186362500119 Recr.&Leasure Infrastr.Renewal 2019 100,000 100,000 24,073 75,927 24.076362500519 Grant Park Recreation Campus 2019 1,750,000 1,750,000 153,000 1,597,000 8.74Total Recreation Facility Refurbishment & Redevelopment- Existing
19,569,000 24,506,683 8,922,855 15,583,828 36.41
Total Recreation and Leisure 26,821,000 30,661,080 13,389,131 17,271,949 43.67
Total Community Services (including Community Incentive Grants)
66,801,841 72,117,721 36,566,965 35,550,756 50.70
Winnipeg Police ServicePolice HeadquartersSafety Upgrades

Capital Expenditures Monthly ReportPage: 20 of 44
Run Date: December 10, 2019
Report as of November 30, 2019
Project Id DescriptionProject
YearAdopted Budget
Amended Budget
Actual Costs to Report Date
Available Balance
% Spent
2204400016 Police HQ Bldg Sys Safeguards 2016 290,000 290,000 207,720 82,280 71.632204400017 Police HQ Bldg Sys Safeguards 2017 510,000 1,260,579 1,232,984 27,595 97.81Total Safety Upgrades 800,000 1,550,579 1,440,704 109,875 92.91
Police Headquarters6322003016 North Dist Police Station M 2016 23,379,577 23,379,577 200,681 23,178,896 0.866322004016 EDPS Leasehold Improvements 2016 - 825,000 630,701 194,299 76.452203800018 Bomb Unit Truck Replacement 2018 300,000 300,000 - 300,000 0.002205900019 Evidence Archival -Tenant Impr 2019 500,000 500,000 - 500,000 0.00Total Police Headquarters 24,179,577 25,004,577 831,382 24,173,195 3.32
Total Police Headquarters 24,979,577 26,555,156 2,272,085 24,283,070 8.56
Computer Upgrades2203500019 Technology Upgrades-Infor Syst 2019 1,200,000 1,200,000 - 1,200,000 0.00Telephone System2201400013 Comm New Phone System 2013 1,490,000 490,000 36 489,964 0.01Total Telephone System 1,490,000 490,000 36 489,964 0.01
Software Upgrade2202600016 Mobile and Transient Users 2016 250,000 250,000 249,723 277 99.892202700017 Major Case Mgnt System Expan M 2017 1,158,000 - - - 0.002204700017 Computer Assisted Dispatch 2017 250,000 250,000 249,988 12 100.002205000017 Police Div Systems Upgr. M 2017 2,467,000 2,467,000 1,577,882 889,118 63.962202700019 Major Case Mgnt System Expansn 2019 1,158,000 1,158,000 - 1,158,000 0.002205000019 Police Div Systems Upgr. M 2019 - - - - 0.00Total Software Upgrade 5,283,000 4,125,000 2,077,592 2,047,408 50.37
Hardware Upgrade2203700019 In Car Computing 2019 1,000,000 1,000,000 - 1,000,000 0.00Total Hardware Upgrade 1,000,000 1,000,000 0 1,000,000 0.00
Electronic Ticketing2204500015 Electronic Ticketing 2015 500,000 500,000 5,580 494,420 1.12
Capital Expenditures Monthly ReportPage: 21 of 44
Run Date: December 10, 2019
Report as of November 30, 2019
Project Id DescriptionProject
YearAdopted Budget
Amended Budget
Actual Costs to Report Date
Available Balance
% Spent
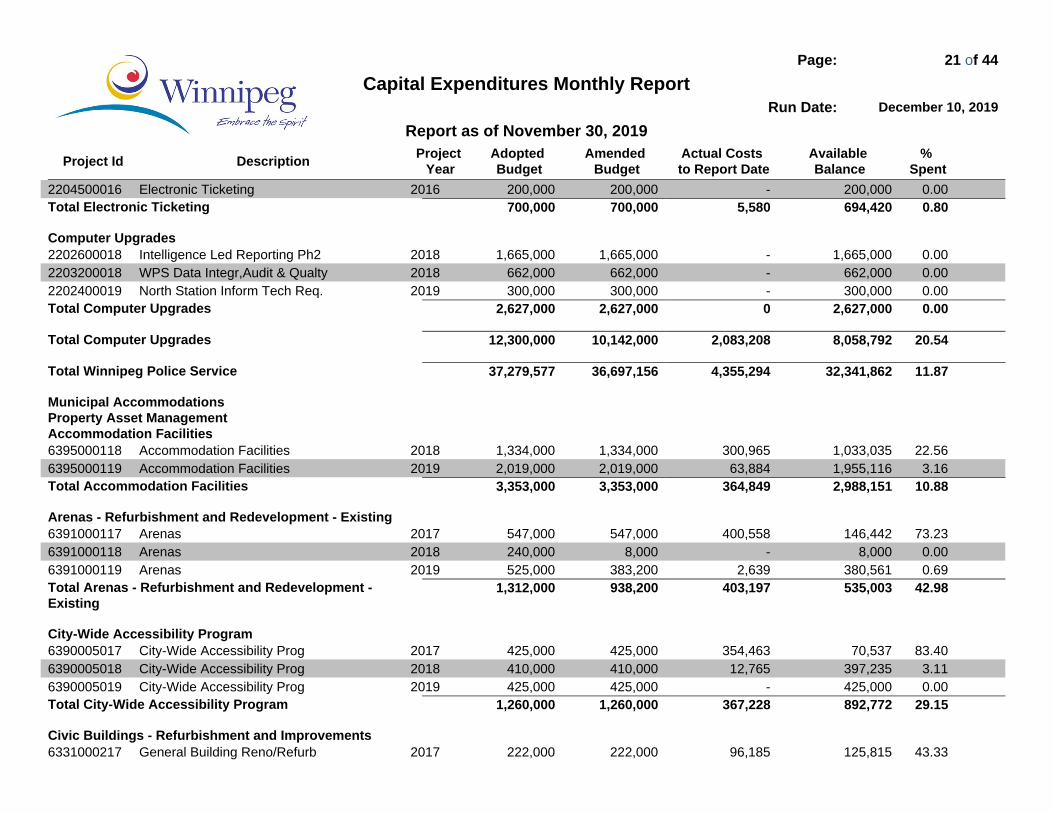
2204500016 Electronic Ticketing 2016 200,000 200,000 - 200,000 0.00Total Electronic Ticketing 700,000 700,000 5,580 694,420 0.80
Computer Upgrades2202600018 Intelligence Led Reporting Ph2 2018 1,665,000 1,665,000 - 1,665,000 0.002203200018 WPS Data Integr,Audit & Qualty 2018 662,000 662,000 - 662,000 0.002202400019 North Station Inform Tech Req. 2019 300,000 300,000 - 300,000 0.00Total Computer Upgrades 2,627,000 2,627,000 0 2,627,000 0.00
Total Computer Upgrades 12,300,000 10,142,000 2,083,208 8,058,792 20.54
Total Winnipeg Police Service 37,279,577 36,697,156 4,355,294 32,341,862 11.87
Municipal AccommodationsProperty Asset ManagementAccommodation Facilities6395000118 Accommodation Facilities 2018 1,334,000 1,334,000 300,965 1,033,035 22.566395000119 Accommodation Facilities 2019 2,019,000 2,019,000 63,884 1,955,116 3.16Total Accommodation Facilities 3,353,000 3,353,000 364,849 2,988,151 10.88
Arenas - Refurbishment and Redevelopment - Existing6391000117 Arenas 2017 547,000 547,000 400,558 146,442 73.236391000118 Arenas 2018 240,000 8,000 - 8,000 0.006391000119 Arenas 2019 525,000 383,200 2,639 380,561 0.69Total Arenas - Refurbishment and Redevelopment - Existing
1,312,000 938,200 403,197 535,003 42.98
City-Wide Accessibility Program6390005017 City-Wide Accessibility Prog 2017 425,000 425,000 354,463 70,537 83.406390005018 City-Wide Accessibility Prog 2018 410,000 410,000 12,765 397,235 3.116390005019 City-Wide Accessibility Prog 2019 425,000 425,000 - 425,000 0.00Total City-Wide Accessibility Program 1,260,000 1,260,000 367,228 892,772 29.15
Civic Buildings - Refurbishment and Improvements6331000217 General Building Reno/Refurb 2017 222,000 222,000 96,185 125,815 43.33

Capital Expenditures Monthly ReportPage: 22 of 44
Run Date: December 10, 2019
Report as of November 30, 2019
Project Id DescriptionProject
YearAdopted Budget
Amended Budget
Actual Costs to Report Date
Available Balance
% Spent
6331000717 Historic Buildings 2017 145,000 145,000 16,276 128,724 11.226331000518 Portage & Main Inters. Improv 2018 1,500,000 1,500,000 73,187 1,426,813 4.886331000619 Energy Conservation 2018 158,000 158,000 - 158,000 0.006331000718 Historic Buildings 2018 187,000 187,000 - 187,000 0.006331020818 Gen Replace & Upgrade 2018 125,000 125,000 - 125,000 0.006395020118 Millennium Library - HVAC M 2018 700,000 700,000 36,713 663,287 5.246331000219 General Building Reno/Refurb 2019 180,000 254,771 - 254,771 0.006331000719 Historic Buildings 2019 214,000 214,000 - 214,000 0.006331001219 PSB and Civic Cntr Car Prk 2019 10,460,000 12,090,000 1,331,179 10,758,821 11.016331020819 Gen Replace & Upgrade 2019 113,000 113,000 - 113,000 0.00Total Civic Buildings - Refurbishment and Improvements 14,004,000 15,708,771 1,553,539 14,155,231 9.89
Community Centres - Refurbishment and Improvements6399000313 Jonathan Toews Field House 2013 - 13,700,000 13,654,438 45,562 99.676390001016 Building Asset/Work Management 2016 162,000 162,000 114,974 47,026 70.976390000117 Community Centres- Refurbish 2017 620,000 620,000 481,919 138,081 77.736390000118 Community Centres- Refurbish 2018 322,000 322,000 6,631 315,369 2.066390002018 UFF- Hockey Pen Light Standard 2018 100,000 100,000 99,708 292 99.716390000119 Community Centres- Refurbish 2019 673,000 673,000 - 673,000 0.006390001019 Building Asset/Work Management 2019 175,000 175,000 - 175,000 0.006390002019 UFF- Hockey Pen Light Standard 2019 100,000 100,000 - 100,000 0.00Total Community Centres - Refurbishment and Improvements
2,152,000 15,852,000 14,357,671 1,494,329 90.57
Community Facilities6394000117 Community Facilities 2017 200,000 200,000 189,553 10,447 94.786394000118 Recreation & Leisure Centres 2018 125,000 125,000 - 125,000 0.006394000119 Recreation & Leisure Centres 2019 106,000 106,000 - 106,000 0.00Total Community Facilities 431,000 431,000 189,553 241,447 43.98
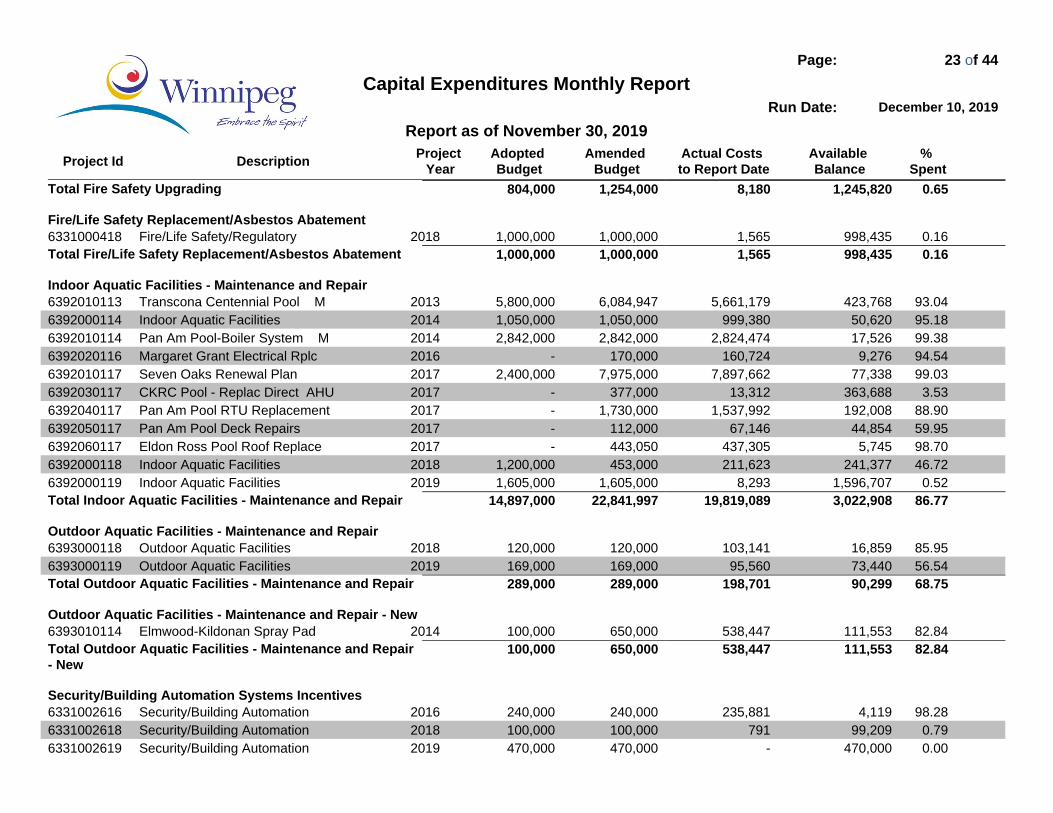
Fire Safety Upgrading6331010417 2017 Fire Alarm Code Complianc 2017 - 450,000 8,180 441,820 1.826331000419 Fire/Life Safety/Regulatory 2019 804,000 804,000 - 804,000 0.00
Capital Expenditures Monthly ReportPage: 23 of 44
Run Date: December 10, 2019
Report as of November 30, 2019
Project Id DescriptionProject
YearAdopted Budget
Amended Budget
Actual Costs to Report Date
Available Balance
% Spent
Total Fire Safety Upgrading 804,000 1,254,000 8,180 1,245,820 0.65
Fire/Life Safety Replacement/Asbestos Abatement6331000418 Fire/Life Safety/Regulatory 2018 1,000,000 1,000,000 1,565 998,435 0.16Total Fire/Life Safety Replacement/Asbestos Abatement 1,000,000 1,000,000 1,565 998,435 0.16
Indoor Aquatic Facilities - Maintenance and Repair6392010113 Transcona Centennial Pool M 2013 5,800,000 6,084,947 5,661,179 423,768 93.046392000114 Indoor Aquatic Facilities 2014 1,050,000 1,050,000 999,380 50,620 95.186392010114 Pan Am Pool-Boiler System M 2014 2,842,000 2,842,000 2,824,474 17,526 99.386392020116 Margaret Grant Electrical Rplc 2016 - 170,000 160,724 9,276 94.546392010117 Seven Oaks Renewal Plan 2017 2,400,000 7,975,000 7,897,662 77,338 99.036392030117 CKRC Pool - Replac Direct AHU 2017 - 377,000 13,312 363,688 3.536392040117 Pan Am Pool RTU Replacement 2017 - 1,730,000 1,537,992 192,008 88.906392050117 Pan Am Pool Deck Repairs 2017 - 112,000 67,146 44,854 59.956392060117 Eldon Ross Pool Roof Replace 2017 - 443,050 437,305 5,745 98.706392000118 Indoor Aquatic Facilities 2018 1,200,000 453,000 211,623 241,377 46.726392000119 Indoor Aquatic Facilities 2019 1,605,000 1,605,000 8,293 1,596,707 0.52Total Indoor Aquatic Facilities - Maintenance and Repair 14,897,000 22,841,997 19,819,089 3,022,908 86.77
Outdoor Aquatic Facilities - Maintenance and Repair6393000118 Outdoor Aquatic Facilities 2018 120,000 120,000 103,141 16,859 85.956393000119 Outdoor Aquatic Facilities 2019 169,000 169,000 95,560 73,440 56.54Total Outdoor Aquatic Facilities - Maintenance and Repair 289,000 289,000 198,701 90,299 68.75
Outdoor Aquatic Facilities - Maintenance and Repair - New6393010114 Elmwood-Kildonan Spray Pad 2014 100,000 650,000 538,447 111,553 82.84Total Outdoor Aquatic Facilities - Maintenance and Repair- New
100,000 650,000 538,447 111,553 82.84
Security/Building Automation Systems Incentives6331002616 Security/Building Automation 2016 240,000 240,000 235,881 4,119 98.286331002618 Security/Building Automation 2018 100,000 100,000 791 99,209 0.796331002619 Security/Building Automation 2019 470,000 470,000 - 470,000 0.00

Capital Expenditures Monthly ReportPage: 24 of 44
Run Date: December 10, 2019
Report as of November 30, 2019
Project Id DescriptionProject
YearAdopted Budget
Amended Budget
Actual Costs to Report Date
Available Balance
% Spent
Total Security/Building Automation Systems Incentives 810,000 810,000 236,673 573,327 29.22
Total Property Asset Management 40,412,000 64,387,968 38,038,691 26,349,276 59.08
Police ResponseLease6331002819 East District Police Stn Lease 2019 1,056,000 1,056,000 968,000 88,000 91.67Total Lease 1,056,000 1,056,000 968,000 88,000 91.67
Total Police Response 1,056,000 1,056,000 968,000 88,000 91.67
Total Municipal Accommodations 41,468,000 65,443,968 39,006,691 26,437,276 59.60
Fire Paramedic ServiceFacilitiesOptimization2111010016 Standards of Coverage 2016 250,000 185,731 152,756 32,975 82.252111020017 Standards of Coverage 2017 375,000 - - - 0.00Total Optimization 625,000 185,731 152,756 32,975 82.25
Maintenance2111010917 Facilities Optimizat-Station 9 2017 550,000 535,000 75,040 459,960 14.036321000017 Station Capital Maintenance 2017 1,938,000 1,028,000 719,992 308,008 70.042111010918 Facilities Optimizat-Station 9 2018 550,000 550,000 - 550,000 0.006321000018 Station Capital Maintenance 2018 2,594,000 2,594,000 426,214 2,167,786 16.436321000117 Station Cap Mtce-Station 2 2018 - 180,000 174,226 5,774 96.796321000317 Station Cap Mtce-Station 16 2018 - 240,000 229,325 10,675 95.556321000417 Station Cap Mtce-Station 17` 2018 - 305,000 283,135 21,865 92.836321000019 Station Capital Maintenance 2019 3,447,000 3,447,000 - 3,447,000 0.00Total Maintenance 9,079,000 8,879,000 1,907,931 6,971,069 21.49
Total Facilities 9,704,000 9,064,731 2,060,687 7,004,044 22.73
EquipmentAcquisition

Capital Expenditures Monthly ReportPage: 25 of 44
Run Date: December 10, 2019
Report as of November 30, 2019
Project Id DescriptionProject
YearAdopted Budget
Amended Budget
Actual Costs to Report Date
Available Balance
% Spent
2109010018 Portable Mass Spectrometer 2018 - 150,000 107,377 42,623 71.58Total Acquisition 0 150,000 107,377 42,623 71.58
Replacement2105000017 911 Call Centre Resillience 2017 861,000 861,000 596,585 264,415 69.292104013018 Zoll Monitor Defibrillators 2018 664,000 664,000 663,013 987 99.852104015018 Power Stretchers 2018 285,000 49,023 1,271 47,752 2.592104013019 Zoll Monitor Defibrillators 2019 624,000 624,000 118,233 505,767 18.952104014019 Bariatric Equipment 2019 167,000 167,000 - 167,000 0.002104014119 Self Contained Breathing Appar 2019 89,000 89,000 - 89,000 0.002104015019 Power Stretchers 2019 463,000 463,000 - 463,000 0.002104200019 Hoists and Compressor 2019 70,000 70,000 - 70,000 0.00Total Replacement 3,223,000 2,987,023 1,379,102 1,607,921 46.17
Total Equipment 3,223,000 3,137,023 1,486,479 1,650,544 47.39
SystemsSoftware Upgrade2106020019 Computer Aided Dispatch (CAD) 2019 11,225,000 11,225,000 82,780 11,142,220 0.74Total Software Upgrade 11,225,000 11,225,000 82,780 11,142,220 0.74
Total Systems 11,225,000 11,225,000 82,780 11,142,220 0.74
Total Fire Paramedic Service 24,152,000 23,426,754 3,629,945 19,796,809 15.49
Innovation, Transformation and TechnologyHardwareCommunications Network Infrastructure3402500016 Enterprise Computing Initia RP 2016 1,896,000 1,888,904 1,859,486 29,418 98.443401200017 Communications Network Infr 2017 401,000 401,000 400,510 490 99.883401204017 Public Safety Radio System 2017 - 14,798,000 14,193,001 604,999 95.913403000118 Core Inform Technology ProgrRP 2018 7,441,000 7,441,000 3,717,966 3,723,034 49.973401200019 Communications Network Infra 2019 298,000 298,000 8,637 289,363 2.903401205019 CSB Facilities 2019 174,000 174,000 - 174,000 0.00

Capital Expenditures Monthly ReportPage: 26 of 44
Run Date: December 10, 2019
Report as of November 30, 2019
Project Id DescriptionProject
YearAdopted Budget
Amended Budget
Actual Costs to Report Date
Available Balance
% Spent
3401206019 Tait Radio Replacement M 2019 1,902,000 1,902,000 - 1,902,000 0.00Total Communications Network Infrastructure 12,112,000 26,902,904 20,179,601 6,723,303 75.01
Enterprise Computing3402500017 Enterprise Computing Initia RP 2017 1,566,000 1,566,000 1,496,934 69,066 95.593402500018 Enterprise Computing Initiativ 2018 126,000 126,000 7,683 118,317 6.103402500019 Enterprise Computing Initiativ 2019 1,026,000 1,026,000 32,929 993,071 3.21Total Enterprise Computing 2,718,000 2,718,000 1,537,547 1,180,453 56.57
Infrastructure Service Enhancement3458300017 Infrastructure Service Enhance 2017 100,000 100,000 86,903 13,097 86.90Total Infrastructure Service Enhancement 100,000 100,000 86,903 13,097 86.90
Renewals3458500019 Intake Program 2019 534,000 534,000 20,092 513,908 3.76Total Renewals 534,000 534,000 20,092 513,908 3.76
Total Hardware 15,464,000 30,254,904 21,824,142 8,430,762 72.13
SoftwarePeopleSoft3455000019 PeopleSoft Enhancements 2019 892,000 892,000 - 892,000 0.00Total PeopleSoft 892,000 892,000 0 892,000 0.00
Data Warehouse / Business Integration3470000015 Enterprise Content Management 2015 275,000 275,000 246,570 28,430 89.663459000118 Innovation Strategy-ISP 2018 2,000,000 999 - 999 0.003459000218 ISP-Electronic Court Notificat 2018 - 233,759 206,500 27,259 88.343459000418 ISP - Citizen Portal 2018 - 75,000 - 75,000 0.003459000518 IDP - Oracle EPM 2018 - 75,000 367 74,633 0.493459000618 ISP - Book an Officer Website 2018 - 62,000 - 62,000 0.003459000718 ISP - Fibre Build Re- Engineer 2018 - 100,260 - 100,260 0.003459000818 ISP - AS Innovation Ideas 2018 - 25,000 214 24,786 0.863459000918 ISP - EOC-BusinessContinuity 2018 - 173,956 172,064 1,892 98.91

Capital Expenditures Monthly ReportPage: 27 of 44
Run Date: December 10, 2019
Report as of November 30, 2019
Project Id DescriptionProject
YearAdopted Budget
Amended Budget
Actual Costs to Report Date
Available Balance
% Spent
3459001118 ISP - Trainfo 2018 - 25,000 - 25,000 0.003459001318 ISP - ChatBot 2018 - 10,000 7,155 2,845 71.553459001418 ISP - eVoting 2018 - 10,000 3,208 6,792 32.083459001518 ISP - Innovation Portfolio 2018 - 90,000 70,956 19,044 78.843459001618 ISP-FIPPA Case Mgmt 2018 - 35,000 27,837 7,163 79.533459009918 ISP - Innovation Bench 2018 - 530,000 378,423 151,577 71.403458200019 Microsoft Software Renewal 2019 247,000 247,000 185,690 61,310 75.183459000119 Innovation Strategy 2019 1,000,000 422,000 - 422,000 0.003459000219 ISP-Enterprise Mobility Mgmt 2019 - 70,000 - 70,000 0.003459000319 ISP-Lineat Referencing System 2019 - 75,000 - 75,000 0.003459000419 ISP-Bike Share 2019 - 80,000 - 80,000 0.003459000519 ISP-Robotic Process Automation 2019 - 75,000 - 75,000 0.003459000619 ISP-Remote Superiision Pilot 2019 - 88,000 971 87,029 1.103459000719 ISP-AVL for Mowers 2019 - 125,000 - 125,000 0.003459000819 ISP-Business Continuity Plann 2019 - 65,000 - 65,000 0.003459001718 ISP-Accounts Payable Workflow 2019 - 60,000 30,996 29,004 51.663459001818 ISP-Rev & Exp Open Budget 2019 - 150,000 - 150,000 0.003459001918 ISP-WPS Queue Mgmt 2019 - 111,000 8,973 102,027 8.083459100119 Smart Cities Innovation Prgm 2019 1,000,000 1,000,000 - 1,000,000 0.003460000019 Info Security Initiatives 2019 365,000 365,000 4,653 360,347 1.273461000019 Microsoft Office License EverG 2019 1,375,000 1,375,000 54 1,374,946 0.003462000019 Disaster Recov Gap Mitigat Ph1 2019 954,000 954,000 - 954,000 0.003463000019 E-Mail Archiving 2019 484,000 484,000 17,318 466,682 3.583470000019 Enterprise Content Managemnt M 2019 1,102,000 1,102,000 1,280 1,100,720 0.12Total Data Warehouse / Business Integration 8,802,000 8,568,974 1,363,230 7,205,744 15.91
Total Software 9,694,000 9,460,974 1,363,230 8,097,744 14.41
Total Innovation, Transformation and Technology 25,158,000 39,715,878 23,187,372 16,528,506 58.38
Planning, Property and DevelopmentDeveloper Pay BackDeveloper Pay Back/Park Amenities

Capital Expenditures Monthly ReportPage: 28 of 44
Run Date: December 10, 2019
Report as of November 30, 2019
Project Id DescriptionProject
YearAdopted Budget
Amended Budget
Actual Costs to Report Date
Available Balance
% Spent
6351000219 Developer Payback 2019 292,000 292,000 - 292,000 0.00Total Developer Pay Back/Park Amenities 292,000 292,000 0 292,000 0.00
Total Developer Pay Back 292,000 292,000 0 292,000 0.00
Art, Entertainment, & CulturePublic Art Strategy6351400718 Public Art Strategy 2018 500,000 500,000 499,600 400 99.92Total Public Art Strategy 500,000 500,000 499,600 400 99.92
Total Art, Entertainment, & Culture 500,000 500,000 499,600 400 99.92
CemeteriesCemeteries - Refurbishment and Improvements6322100118 Cemeteries - Improvements 2018 200,000 1,468,787 1,454,093 14,694 99.006322100119 Cemeteries - Improvements 2019 940,000 940,000 223,875 716,125 23.82Total Cemeteries - Refurbishment and Improvements 1,140,000 2,408,787 1,677,968 730,818 69.66
Total Cemeteries 1,140,000 2,408,787 1,677,968 730,818 69.66
City BeautificationBIZ Zones Image Routes Main Streets6351241517 BIZ Zones Image Rtes Main Sts 2017 974,000 974,000 916,070 57,930 94.056351241518 BIZ Zones Image Rtes Main Sts 2018 400,000 400,000 177,907 222,093 44.486351241519 BIZ Zones Image Rtes Main Sts 2019 332,000 332,000 - 332,000 0.00Total BIZ Zones Image Routes Main Streets 1,706,000 1,706,000 1,093,977 612,023 64.13
Downtown Enhancement Program6351800117 Downtown Enhancement Program 2017 400,000 400,000 383,493 16,507 95.876351400418 James Ave Streetscaping 2018 - 2,000,000 1,483,649 516,351 74.186351800118 Downtown Enhancement Program 2018 125,000 125,000 96,373 28,627 77.106351800119 Downtown Enhancement Program 2019 333,000 333,000 232 332,768 0.07Total Downtown Enhancement Program 858,000 2,858,000 1,963,747 894,253 68.71
Other

Capital Expenditures Monthly ReportPage: 29 of 44
Run Date: December 10, 2019
Report as of November 30, 2019
Project Id DescriptionProject
YearAdopted Budget
Amended Budget
Actual Costs to Report Date
Available Balance
% Spent
6351800417 Tache Promenade 2017 4,303,000 8,000,000 7,051,250 948,750 88.14Total Other 4,303,000 8,000,000 7,051,250 948,750 88.14
Total City Beautification 6,867,000 12,564,000 10,108,974 2,455,026 80.46
Computer UpgradesComputer Automation6361000419 Computer Automation 2019 133,000 133,000 65,168 67,832 49.00Total Computer Automation 133,000 133,000 65,168 67,832 49.00
Total Computer Upgrades 133,000 133,000 65,168 67,832 49.00
Land Drainage & Flood ControlRiverbank Greenway Programs6351300117 Riverbank Greenway Programs 2017 225,000 225,000 132,586 92,414 58.936351300119 Riverbank Greenway Programs 2019 205,000 205,000 - 205,000 0.00Total Riverbank Greenway Programs 430,000 430,000 132,586 297,414 30.83
Riverbank Stabilization6351300216 Riverbank Stab/Phys Asset Prot 2016 1,686,610 686,610 335,008 351,602 48.796351300217 Riverbank Stab/Phys Asset Prot 2017 1,229,000 1,229,000 - 1,229,000 0.006351300218 Riverbank Stab/Phys Asset Prot 2018 500,000 500,000 - 500,000 0.006351300219 Riverbank Stab/Phys Asset Prot 2019 500,000 500,000 - 500,000 0.00Total Riverbank Stabilization 3,915,610 2,915,610 335,008 2,580,602 11.49
Total Land Drainage & Flood Control 4,345,610 3,345,610 467,594 2,878,016 13.98
RecreationOther6351802015 Park City West Community Centr 2015 - 1,200,000 1,097,041 102,959 91.42Total Other 0 1,200,000 1,097,041 102,959 91.42
Total Recreation 0 1,200,000 1,097,041 102,959 91.42
Total Planning, Property and Development 13,277,610 20,443,397 13,916,345 6,527,052 68.07
Capital Expenditures Monthly ReportPage: 30 of 44
Run Date: December 10, 2019
Report as of November 30, 2019
Project Id DescriptionProject
YearAdopted Budget
Amended Budget
Actual Costs to Report Date
Available Balance
% Spent
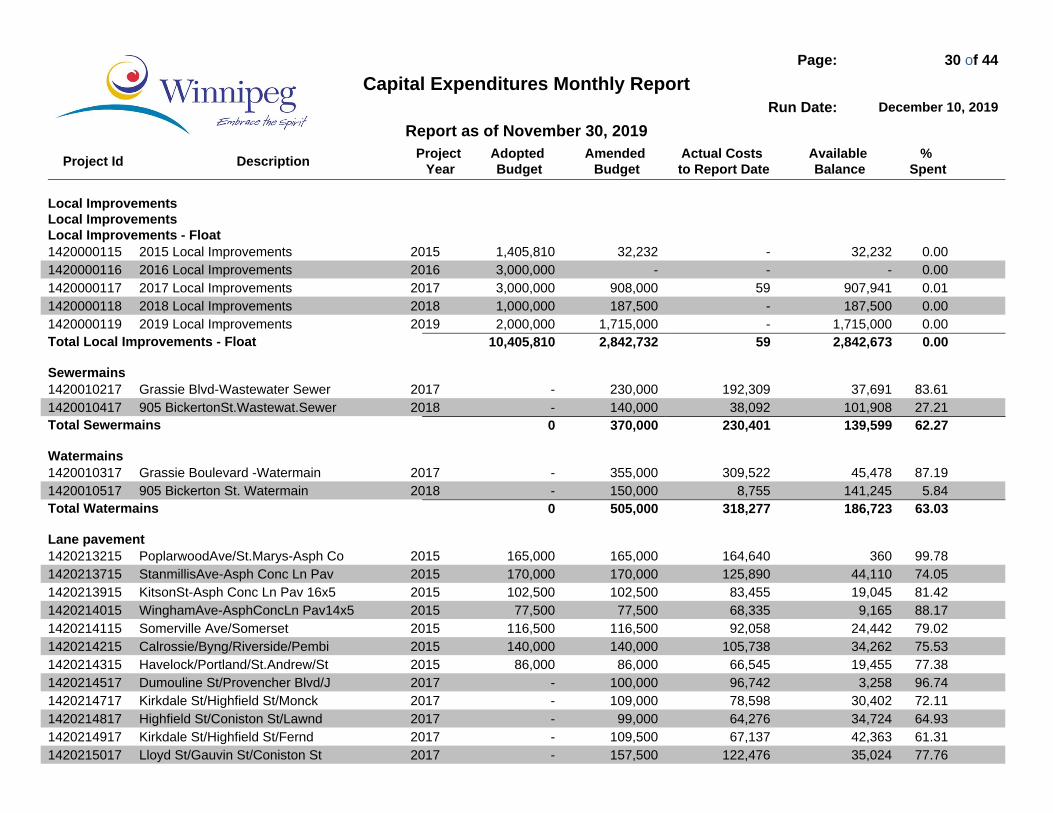
Local ImprovementsLocal ImprovementsLocal Improvements - Float1420000115 2015 Local Improvements 2015 1,405,810 32,232 - 32,232 0.001420000116 2016 Local Improvements 2016 3,000,000 - - - 0.001420000117 2017 Local Improvements 2017 3,000,000 908,000 59 907,941 0.011420000118 2018 Local Improvements 2018 1,000,000 187,500 - 187,500 0.001420000119 2019 Local Improvements 2019 2,000,000 1,715,000 - 1,715,000 0.00Total Local Improvements - Float 10,405,810 2,842,732 59 2,842,673 0.00
Sewermains1420010217 Grassie Blvd-Wastewater Sewer 2017 - 230,000 192,309 37,691 83.611420010417 905 BickertonSt.Wastewat.Sewer 2018 - 140,000 38,092 101,908 27.21Total Sewermains 0 370,000 230,401 139,599 62.27
Watermains1420010317 Grassie Boulevard -Watermain 2017 - 355,000 309,522 45,478 87.191420010517 905 Bickerton St. Watermain 2018 - 150,000 8,755 141,245 5.84Total Watermains 0 505,000 318,277 186,723 63.03
Lane pavement1420213215 PoplarwoodAve/St.Marys-Asph Co 2015 165,000 165,000 164,640 360 99.781420213715 StanmillisAve-Asph Conc Ln Pav 2015 170,000 170,000 125,890 44,110 74.051420213915 KitsonSt-Asph Conc Ln Pav 16x5 2015 102,500 102,500 83,455 19,045 81.421420214015 WinghamAve-AsphConcLn Pav14x5 2015 77,500 77,500 68,335 9,165 88.171420214115 Somerville Ave/Somerset 2015 116,500 116,500 92,058 24,442 79.021420214215 Calrossie/Byng/Riverside/Pembi 2015 140,000 140,000 105,738 34,262 75.531420214315 Havelock/Portland/St.Andrew/St 2015 86,000 86,000 66,545 19,455 77.381420214517 Dumouline St/Provencher Blvd/J 2017 - 100,000 96,742 3,258 96.741420214717 Kirkdale St/Highfield St/Monck 2017 - 109,000 78,598 30,402 72.111420214817 Highfield St/Coniston St/Lawnd 2017 - 99,000 64,276 34,724 64.931420214917 Kirkdale St/Highfield St/Fernd 2017 - 109,500 67,137 42,363 61.311420215017 Lloyd St/Gauvin St/Coniston St 2017 - 157,500 122,476 35,024 77.76

Capital Expenditures Monthly ReportPage: 31 of 44
Run Date: December 10, 2019
Report as of November 30, 2019
Project Id DescriptionProject
YearAdopted Budget
Amended Budget
Actual Costs to Report Date
Available Balance
% Spent
1420215117 Coniston St/Lyndale Dr/Crawfor 2017 - 124,000 96,502 27,498 77.821420215217 Highfield St/ Coniston St/Fern 2017 - 99,000 70,121 28,879 70.831420215317 Notre Dame St/Dumoulin St/Arch 2017 - 116,500 88,248 28,252 75.751420215418 Bronstone,Fernwood,St. Mary's 2018 - 187,500 144,895 42,605 77.281420215518 Dumoulin,Provencher,LaFleche 2018 - 52,500 47,182 5,318 89.871420215618 Highfield,Coniston,Chandos, 2018 - 95,000 77,504 17,496 81.581420215718 Coniston,Lyndale,Claremont 2018 - 161,500 143,255 18,245 88.701420215818 Coniston,Lyndale,Monck,Claremo 2018 - 150,000 143,174 6,826 95.451420215918 Walmer,Kirkdale,Lawndale,Birch 2018 - 107,500 89,331 18,169 83.101420216018 Kildondn/Greene Ave/Linden Av 2018 - 58,500 44,885 13,615 76.731420216117 Highfield/Coniston /Claremont 2019 - 97,500 69,421 28,079 71.201420216217 Coniston/Lyndale/Ferndale/Lawn 2019 - 175,000 112,579 62,421 64.331420216317 Maralbo/Parkville/St.Mary's/Du 2019 - 30,000 15,303 14,697 51.011420216419 KirkdaleSt/Highfield St/Lawnda 2019 - 120,000 - 120,000 0.001420216519 Walmer St/Kirkdale St/Claremon 2019 - 105,000 - 105,000 0.001420216619 NS Lane East of Desmeuron St 2019 - 60,000 - 60,000 0.00Total Lane pavement 857,500 3,172,000 2,278,290 893,710 71.83
Boulevards and Sidewalks1420230614 Point Hebert-GrassBLVD-20.5ft 2014 10,000 10,000 - 10,000 0.001420230714 Point Hebert-BLVD-Trees Messag 2014 12,000 12,000 - 12,000 0.00Total Boulevards and Sidewalks 22,000 22,000 0 22,000 0.00
Total Local Improvements 11,285,310 6,911,732 2,827,027 4,084,705 40.90
Total Local Improvements 11,285,310 6,911,732 2,827,027 4,084,705 40.90
City ClerksCity ClerksCity Archives0400000116 City Archives Management 2017 - 2,000,000 1,294,537 705,463 64.73Total City Archives 0 2,000,000 1,294,537 705,463 64.73
Election Systems

Capital Expenditures Monthly ReportPage: 32 of 44
Run Date: December 10, 2019
Report as of November 30, 2019
Project Id DescriptionProject
YearAdopted Budget
Amended Budget
Actual Costs to Report Date
Available Balance
% Spent
0400000518 Elections Systems 2018 200,000 200,000 115,439 84,561 57.72Total Election Systems 200,000 200,000 115,439 84,561 57.72
Corporate Records Centre0400000917 Corporate Records Centre 2017 150,000 150,000 3,411 146,589 2.27Total Corporate Records Centre 150,000 150,000 3,411 146,589 2.27
Innovation Fund0400001715 Innovation Capital Fund 2015 1,000,000 - - - 0.000400041715 ICF-CFRS Dashboard 2015 - 350,000 320,884 29,116 91.680400001716 Innovation Capital Fund 2016 1,000,000 - - - 0.000400101716 ICF -Intuitive Routing 2016 - 80,106 80,106 - 100.000400121716 ICF -Y/E Consol/Work Sys 2016 - 33,000 - 33,000 0.000400151716 ICF -Facility Advertising Disp 2016 - 51,360 50,030 1,330 97.410400001717 Innovation Capital Fund 2017 1,000,000 - - - 0.000400171716 ICF - Enterprise Mobility Mgmt 2017 - 168,380 33,256 135,124 19.750400181716 ICF-Transit Enhance & Bus WiFi 2017 - 300,000 57,888 242,112 19.300400201717 ICF-Lane Closures System 2017 - 390,000 82,142 307,858 21.060400211717 ICF-Alarm Permit Mgnt System 2017 - 160,000 63,390 96,610 39.620400231717 ICF-ElectricVehicles &Charging 2017 - 197,200 149,212 47,988 75.670400251717 ICF-Solar Uses Pan Am Pool 2017 - 37,222 19,674 17,548 52.860400261717 ICF-City Hall Waste Reduction 2017 - 10,000 6,480 3,520 64.800400271717 ICF-RetroCommission City Bldgs 2017 - 113,761 113,761 - 100.000400001718 Innovation Capital Fund 2018 500,000 - - - 0.000400291718 ICF-FlameguardFireSuppression 2018 - 15,450 - 15,450 0.000400321718 ICF-ClimateSmartPilot 2018 - 12,500 3,315 9,185 26.520400311718 Digitization of Board Comm Rec 2019 - 71,760 - 71,760 0.000400331718 ICF -PeopleSoft AP Paperless 2019 - 289,995 - 289,995 0.00Total Innovation Fund 3,500,000 2,280,734 980,137 1,300,597 42.97
Total City Clerks 3,850,000 4,630,734 2,393,524 2,237,210 51.69
Total City Clerks 3,850,000 4,630,734 2,393,524 2,237,210 51.69

Capital Expenditures Monthly ReportPage: 33 of 44
Run Date: December 10, 2019
Report as of November 30, 2019
Project Id DescriptionProject
YearAdopted Budget
Amended Budget
Actual Costs to Report Date
Available Balance
% Spent
Assessment and TaxationAssessment and TaxationAssessment Automation1400000117 Assessment Automation 2017 870,000 870,000 404,928 465,072 46.541400000119 Assessment Automation 2019 350,000 350,000 - 350,000 0.00Total Assessment Automation 1,220,000 1,220,000 404,928 815,072 33.19
Valcura System1400000218 Valcura System 2018 200,000 200,000 - 200,000 0.00Total Valcura System 200,000 200,000 0 200,000 0.00
Assessment Data Valuation Information System1400000318 Assessm.Data Valuat. Info Sys 2018 1,208,000 1,208,000 313,606 894,394 25.96Total Assessment Data Valuation Information System 1,208,000 1,208,000 313,606 894,394 25.96
Total Assessment and Taxation 2,628,000 2,628,000 718,534 1,909,466 27.34
Total Assessment and Taxation 2,628,000 2,628,000 718,534 1,909,466 27.34
Corporate ProjectsEnterprise SystemsPeopleSoft1200001516 PS Accounts Receivable Billing 2016 550,000 550,000 350,700 199,300 63.761200001517 PS Accounts Receivable Billing 2017 192,000 192,000 48,552 143,448 25.29Total PeopleSoft 742,000 742,000 399,252 342,748 53.81
Total Enterprise Systems 742,000 742,000 399,252 342,748 53.81
Total Corporate Projects 742,000 742,000 399,252 342,748 53.81
Customer Service and Corporate CommunicationsSoftwareContact Centre - 3113457000017 311 Renewal 2017 450,000 450,000 329,603 120,397 73.25Total Contact Centre - 311 450,000 450,000 329,603 120,397 73.25

Capital Expenditures Monthly ReportPage: 34 of 44
Run Date: December 10, 2019
Report as of November 30, 2019
Project Id DescriptionProject
YearAdopted Budget
Amended Budget
Actual Costs to Report Date
Available Balance
% Spent
Total Software 450,000 450,000 329,603 120,397 73.25
Total Customer Service and Corporate Communications 450,000 450,000 329,603 120,397 73.25
Total Tax Supported (including Transit) 1,921,690,010 1,936,406,295 1,241,608,699 694,797,595 64.12
UtilitiesSewage Disposal UtilityCollectionCSO and BF Strategy2038000117 2017 CSO Bsmt Flood Man Strat 2017 21,400,000 27,000,000 20,786,324 6,213,676 76.992038000118 2018 CSO Bsmt Flood Man Strat 2018 26,098,000 26,098,000 10,362,016 15,735,984 39.702038000119 2019 CSO Bsmt Flood Man Strat 2019 31,100,000 31,100,000 1,018,994 30,081,006 3.28Total CSO and BF Strategy 78,598,000 84,198,000 32,167,333 52,030,667 38.20
Information Technology2040000815 Laboratory Info Mgmt Upgrade 2015 500,000 500,000 254,595 245,405 50.922040001300 WWD Business Intelligence MRP 2016 2,520,000 2,520,000 714,175 1,805,825 28.342040001416 HR Document Mgmt System 2016 300,000 300,000 298,272 1,728 99.422040001516 GIS & PW Manager Upgrade 2016 310,000 375,000 209,077 165,923 55.752040001117 Wastewater HaulingSys Replacmt 2017 1,000,000 1,000,000 346,349 653,651 34.632040001218 Customer Billing Upgrade 2018 1,165,000 1,165,000 122,338 1,042,662 10.502040001818 WWD Document Management 2018 350,000 350,000 336,165 13,835 96.052040001219 Customer Billing Upgrade 2019 185,000 185,000 - 185,000 0.002040001819 WWD Document Management 2019 500,000 500,000 17,780 482,220 3.562040002119 Digital Customer Solutions 2019 1,600,000 1,600,000 - 1,600,000 0.00Total Information Technology 8,430,000 8,495,000 2,298,752 6,196,248 27.06
Interceptors2037001211 Inkster Blvd Interceptor 2011 - 12,130,000 10,924,935 1,205,065 90.072037001516 NE Interceptor River Crossing 2016 11,000,000 11,000,000 7,942,983 3,057,017 72.212037001317 Plessis Road Interceptor 2017 7,300,000 7,300,000 4,777,369 2,522,631 65.442037001618 Southwest Interceptor Crossing 2018 250,000 250,000 - 250,000 0.00

Capital Expenditures Monthly ReportPage: 35 of 44
Run Date: December 10, 2019
Report as of November 30, 2019
Project Id DescriptionProject
YearAdopted Budget
Amended Budget
Actual Costs to Report Date
Available Balance
% Spent
2037001718 Airport West Servicing 2018 2,150,000 2,150,000 144,579 2,005,421 6.722037001619 Southwest Interceptor Crossing 2019 1,100,000 1,100,000 - 1,100,000 0.00Total Interceptors 21,800,000 33,930,000 23,789,866 10,140,134 70.11
Lift Stations2035000616 D'Arcy Lift Stn Load Shedding 2016 400,000 400,000 - 400,000 0.002030001817 Arc Flash Hazard Analysis/Remd 2017 424,000 424,000 188,582 235,418 44.482035000117 Lift Stations Upgrading 2017 2,332,000 2,332,000 2,178,282 153,718 93.412030001818 Arc Flash Hazard Analysis/Remd 2018 767,000 767,000 135,375 631,625 17.652030003018 Comminutor Chamber Rehab 2018 1,100,000 1,100,000 630,794 469,206 57.342035000118 Lift Stations Upgrading 2018 2,750,000 2,750,000 1,542,960 1,207,040 56.112030001819 Arc Flash Hazard Analysis/Remd 2019 879,000 879,000 167,922 711,078 19.102030003019 Comminutor Chamber Rehab 2019 1,200,000 1,200,000 - 1,200,000 0.002035000119 2019 Stations Upgrading 2019 2,825,000 2,825,000 - 2,825,000 0.00Total Lift Stations 12,677,000 12,677,000 4,843,915 7,833,085 38.21
Reliability Upgrades2030003216 Coll Power Reliablity Study 2016 120,000 120,000 34,715 85,285 28.93Total Reliability Upgrades 120,000 120,000 34,715 85,285 28.93
River Crossing Rehab2037500018 River Crossings Monitoring P 2018 970,000 970,000 6,568 963,432 0.682037500019 River Crossings Monitoring P 2019 700,000 700,000 118 699,882 0.02Total River Crossing Rehab 1,670,000 1,670,000 6,686 1,663,314 0.40
Sewer Renewals2039100116 2016 Sewer Renewals P 2016 16,900,000 16,900,000 15,607,658 1,292,342 92.352039100117 2017 Sewer Renewals P 2017 18,800,000 18,800,000 11,536,069 7,263,931 61.362039100118 2018 Sewer Renewal P 2018 18,200,000 18,200,000 8,987,745 9,212,255 49.382039100119 2019 Sewer Renewals P 2019 17,500,000 17,500,000 2,629,475 14,870,525 15.03Total Sewer Renewals 71,400,000 71,400,000 38,760,947 32,639,053 54.29
Total Collection 194,695,000 212,490,000 101,902,215 110,587,785 47.96

Capital Expenditures Monthly ReportPage: 36 of 44
Run Date: December 10, 2019
Report as of November 30, 2019
Project Id DescriptionProject
YearAdopted Budget
Amended Budget
Actual Costs to Report Date
Available Balance
% Spent
TreatmentBiosolids203110004B Biosolids Budget P 2012 65,203,286 11,963,286 8,099,072 3,864,213 67.70Total Biosolids 65,203,286 11,963,286 8,099,072 3,864,213 67.70
Information Technology2040001716 WIMS Dashboard 2016 1,400,000 441,000 341,584 99,416 77.462040000617 Process Control Sys Upgrade 2017 1,000,000 1,000,000 692,025 307,975 69.202040000618 Process Control Sys Upgrade 2018 9,000,000 9,000,000 281,539 8,718,461 3.13Total Information Technology 11,400,000 10,441,000 1,315,148 9,125,852 12.60
NEWPCC203110013B NEWPCC Upgrade P 2012 795,071,171 407,861,213 25,386,372 382,474,841 6.222034000913 Hauled Liq Waste Acceptnce Fac 2013 3,925,000 3,925,000 71,476 3,853,524 1.82Total NEWPCC 798,996,171 411,786,213 25,457,848 386,328,366 6.18
Reliability Upgrades2030000515 WPCC Asset Refurbish/Replace 2015 5,000,000 4,000,000 3,675,672 324,328 91.892030000516 Asset Refurbish/Replace 2016 2,000,000 2,000,000 1,576,216 423,784 78.812030000517 Asset Refurbish/Replace 2017 2,000,000 2,000,000 1,104,427 895,573 55.222030000518 Asset Refurbish/Replace 2018 4,000,000 4,000,000 55,382 3,944,618 1.382030000519 Asset Refurbish/Replace 2019 6,000,000 6,000,000 78 5,999,922 0.00Total Reliability Upgrades 19,000,000 18,000,000 6,411,775 11,588,225 35.62
SEWPCC203210002B SEWPCC Nutrient Removal P 2012 324,682,248 324,682,248 218,538,764 106,143,484 67.31Total SEWPCC 324,682,248 324,682,248 218,538,764 106,143,484 67.31
Total Treatment 1,219,281,705 776,872,747 259,822,607 517,050,140 33.44
Total Sewage Disposal Utility 1,413,976,705 989,362,747 361,724,822 627,637,925 36.56
Waterworks UtilityDistributionFeeder Mains

Capital Expenditures Monthly ReportPage: 37 of 44
Run Date: December 10, 2019
Report as of November 30, 2019
Project Id DescriptionProject
YearAdopted Budget
Amended Budget
Actual Costs to Report Date
Available Balance
% Spent
2004000715 Feedermain Condition Assessmnt 2015 1,000,000 1,000,000 783,467 216,533 78.352004001115 North Kildonan Feedermain 2015 2,500,000 1,650,019 1,408,999 241,020 85.392004000716 Feedermain Condition Assessmnt 2016 1,000,000 1,000,000 769,247 230,753 76.922004000717 Feeder Main Condition Assessmt 2017 500,000 500,000 - 500,000 0.002004000718 Feeder Main Condition Assessmt 2018 1,350,000 1,350,000 44,582 1,305,418 3.302004000719 Feeder Main Condition Assessmt 2019 350,000 350,000 249 349,751 0.07Total Feeder Mains 6,700,000 5,850,019 3,006,544 2,843,475 51.39
Information Technology2010000815 Lab Info Mgmt Upgrade 2015 500,000 500,000 284,056 215,944 56.812010000917 Utility Asset Mgmt System 2017 500,000 500,000 463,626 36,374 92.732010000918 Utility Asset Mgmt System 2018 600,000 600,000 21,557 578,443 3.592010001118 Web Self Service 2018 700,000 700,000 665,118 34,882 95.022010001218 Customer Billing Upgrade 2018 1,165,000 1,165,000 134,171 1,030,829 11.522010001518 CCB iNovah Integration 2018 300,000 300,000 - 300,000 0.002010001219 Customer Billing Upgrade 2019 185,000 185,000 - 185,000 0.002010001319 Automated Remittance Processin 2019 400,000 400,000 - 400,000 0.002010001519 CCB iNovah Integration 2019 130,000 130,000 - 130,000 0.002010001619 IT Cybersecurity Review 2019 340,000 340,000 - 340,000 0.002010001919 Digital Enablement 2019 530,000 530,000 - 530,000 0.002010002019 GIS Enhancements 2019 300,000 300,000 - 300,000 0.00Total Information Technology 5,650,000 5,650,000 1,568,528 4,081,472 27.76
Various2001001713 Public Water Outlets 2013 750,000 750,000 410,262 339,738 54.702001002914 552 & 598 Plinguet Fire Protec 2014 - 600,000 111,573 488,427 18.602001000818 Building Reno-1199 Pacific 2018 110,000 110,000 - 110,000 0.002001001719 Public Water Outlets 2019 475,000 475,000 310 474,690 0.07Total Various 1,335,000 1,935,000 522,145 1,412,855 26.98
Water Main Renewals2013100117 2017 Water Main Renewal Pro P 2017 18,500,000 18,500,000 18,500,000 - 100.002013500117 Saskatchewan Water Main 2017 4,830,000 4,830,000 11,849 4,818,151 0.25

Capital Expenditures Monthly ReportPage: 38 of 44
Run Date: December 10, 2019
Report as of November 30, 2019
Project Id DescriptionProject
YearAdopted Budget
Amended Budget
Actual Costs to Report Date
Available Balance
% Spent
2013500217 Transcona Water Main Reliab 2017 - 5,788,000 1,381,807 4,406,193 23.872013500317 N St Boniface Water Main 2017 - 5,000,000 1,808,534 3,191,466 36.172013100118 2018 Water Main Renewal Pro P 2018 16,500,000 16,500,000 14,227,556 2,272,444 86.232013100119 2019 Water Main Renewal Pro P 2019 16,500,000 16,500,000 14,035,611 2,464,389 85.06Total Water Main Renewals 56,330,000 67,118,000 49,965,357 17,152,643 74.44
Total Distribution 70,015,000 80,553,019 55,062,575 25,490,445 68.36
Supply and TreatmentAqueduct2003000616 Aqueduct Asset Preservation 2016 550,000 550,000 179,659 370,341 32.672003000617 Aqueduct Asset Preservation 2017 400,000 400,000 130,651 269,349 32.662003000917 Br 1 Aqueduct-Riverbank Stab 2017 950,000 950,000 543,042 406,958 57.162012000217 Aqueduct Intake Con Assmt 2017 3,223,000 3,223,000 197,880 3,025,120 6.142003000618 Aqueduct Asset Preservation 2018 1,198,000 1,198,000 13,811 1,184,189 1.152003000918 Br 1 Aqueduct-Riverbank Stab 2018 500,000 500,000 - 500,000 0.00Total Aqueduct 6,821,000 6,821,000 1,065,042 5,755,958 15.61
Bridges2001002700 SL Aqued/Falcon Rvr Brid MRP 2013 9,000,000 9,000,000 5,843,824 3,156,176 64.93Total Bridges 9,000,000 9,000,000 5,843,824 3,156,176 64.93
Pumping Stations2005001115 Chlorine Upgrading Pumping Stn 2015 425,000 200,000 92,729 107,271 46.362005001216 Pump Stn/Reservoir Upgrades 2016 8,700,000 8,700,000 7,939,280 760,720 91.262005100200 Water SCADA Upgrade MRP 2016 16,058,000 16,022,661 752,587 15,270,074 4.702005000317 Pump Station Reliability Upgrd 2017 3,659,000 3,659,000 348,060 3,310,940 9.512005000617 Tache Booster Pumping Station 2017 1,500,000 278,501 209,826 68,675 75.342005000700 Hurst Pumping Stn MRP 2017 2,825,000 2,825,000 108,677 2,716,323 3.852005001317 Study Backup Power Hurst 2017 400,000 400,000 - 400,000 0.002005001218 Pump Stn/Reservoir Upgrades 2018 600,000 600,000 3,503 596,497 0.582005001418 HVAC Upgrades Pumping Stn M 2018 1,000,000 1,000,000 - 1,000,000 0.002005000619 Tache Booster Pumping Station 2019 785,000 785,000 1,364 783,636 0.17

Capital Expenditures Monthly ReportPage: 39 of 44
Run Date: December 10, 2019
Report as of November 30, 2019
Project Id DescriptionProject
YearAdopted Budget
Amended Budget
Actual Costs to Report Date
Available Balance
% Spent
2005001619 Discharge Meter Upgrades 2019 150,000 150,000 - 150,000 0.00Total Pumping Stations 36,102,000 34,620,162 9,456,026 25,164,136 27.31
Security Upgrades2001001517 Water System Security Upgrades 2017 498,000 498,000 185,583 312,417 37.27Total Security Upgrades 498,000 498,000 185,583 312,417 37.27
Shoal Lake Intake2003000517 Aqueduct Con Assmt 2017 1,500,000 1,500,000 62,413 1,437,587 4.162003000518 Aqueduct Con Assmt 2018 900,000 900,000 - 900,000 0.00Total Shoal Lake Intake 2,400,000 2,400,000 62,413 2,337,587 2.60
Various2001002815 Water Conservation Study 2015 230,000 230,000 164,316 65,684 71.442001003015 Watershed & Asset Protection 2015 1,000,000 600,000 432,201 167,799 72.032001002819 Water Conservation Study 2019 155,000 155,000 - 155,000 0.00Total Various 1,385,000 985,000 596,517 388,483 60.56
Water Treatment2002000115 WTP-Projects and Review 2015 700,000 569,000 355,004 213,996 62.392005000916 Deacon PS Suction Header Valve 2016 200,000 57,000 - 57,000 0.002002500517 Deacon Site Flood Protection 2017 1,825,000 1,825,000 - 1,825,000 0.002005001517 Ultraviolet Light Upgrade 2017 1,735,000 1,735,000 - 1,735,000 0.002002500518 Deacon Site Flood Protection 2018 300,000 300,000 - 300,000 0.002002500618 WT Research&Process Opt Facili 2018 560,000 560,000 46,684 513,316 8.342002500718 WT Plant Capacity Validation 2018 150,000 150,000 - 150,000 0.002002500818 WTP Asset Refurbishment 2018 125,000 125,000 79,144 45,856 63.322002500819 WTP Asset Refurbishment 2019 575,000 575,000 2,867 572,133 0.50Total Water Treatment 6,170,000 5,896,000 483,699 5,412,301 8.20
Total Supply and Treatment 62,376,000 60,220,162 17,693,104 42,527,058 29.38
Total Waterworks Utility 132,391,000 140,773,181 72,755,679 68,017,502 51.68

Capital Expenditures Monthly ReportPage: 40 of 44
Run Date: December 10, 2019
Report as of November 30, 2019
Project Id DescriptionProject
YearAdopted Budget
Amended Budget
Actual Costs to Report Date
Available Balance
% Spent
Land Drainage and Flood Control UtilityFlood ControlFloodplain Mgmt2070000412 Floodplain Mgmt 2012 300,000 300,000 232,959 67,041 77.652070000413 Floodplain Mgmt 2013 100,000 100,000 - 100,000 0.002070000414 Floodplain Mgmt 2014 100,000 100,000 - 100,000 0.002070001216 Flood Manual Upgrades 2016 325,000 325,000 279,536 45,464 86.012070000418 Floodplain Mgmt 2018 215,000 215,000 - 215,000 0.00Total Floodplain Mgmt 1,040,000 1,040,000 512,495 527,505 49.28
Primary Dike2070002819 St Boniface PLD Slop Stab 2019 150,000 150,000 - 150,000 0.00Total Primary Dike 150,000 150,000 0 150,000 0.00
Flood Pumping Station2076500117 Flood Pumping Station Rehab 2017 1,000,000 1,000,000 165,916 834,084 16.592076500118 Flood Pumping Station Rehab 2018 1,000,000 1,000,000 65 999,935 0.012076500119 Flood Pumping Station Rehab 2019 1,000,000 1,000,000 - 1,000,000 0.00Total Flood Pumping Station 3,000,000 3,000,000 165,981 2,834,019 5.53
Outfalls2078500216 Outfall Gate Structures 2016 2,600,000 2,600,000 2,585,128 14,872 99.432078500217 Outfall Gate Structures 2017 2,430,000 2,430,000 948,076 1,481,924 39.022078000118 Outfall Rehabilitation 2018 3,000,000 3,000,000 313,693 2,686,307 10.462078500218 Outfall Gate Structures 2018 1,800,000 1,800,000 541,804 1,258,196 30.102078000119 Outfall Rehabilitation 2019 2,000,000 2,000,000 - 2,000,000 0.002078500219 Outfall Gate Structures 2019 1,870,000 1,870,000 - 1,870,000 0.00Total Outfalls 13,700,000 13,700,000 4,388,702 9,311,298 32.03
Land Acquisition2080000115 Seine River Waterway Acquis 2015 150,000 24,000 - 24,000 0.00Total Land Acquisition 150,000 24,000 0 24,000 0.00
Total Flood Control 18,040,000 17,914,000 5,067,178 12,846,822 28.29
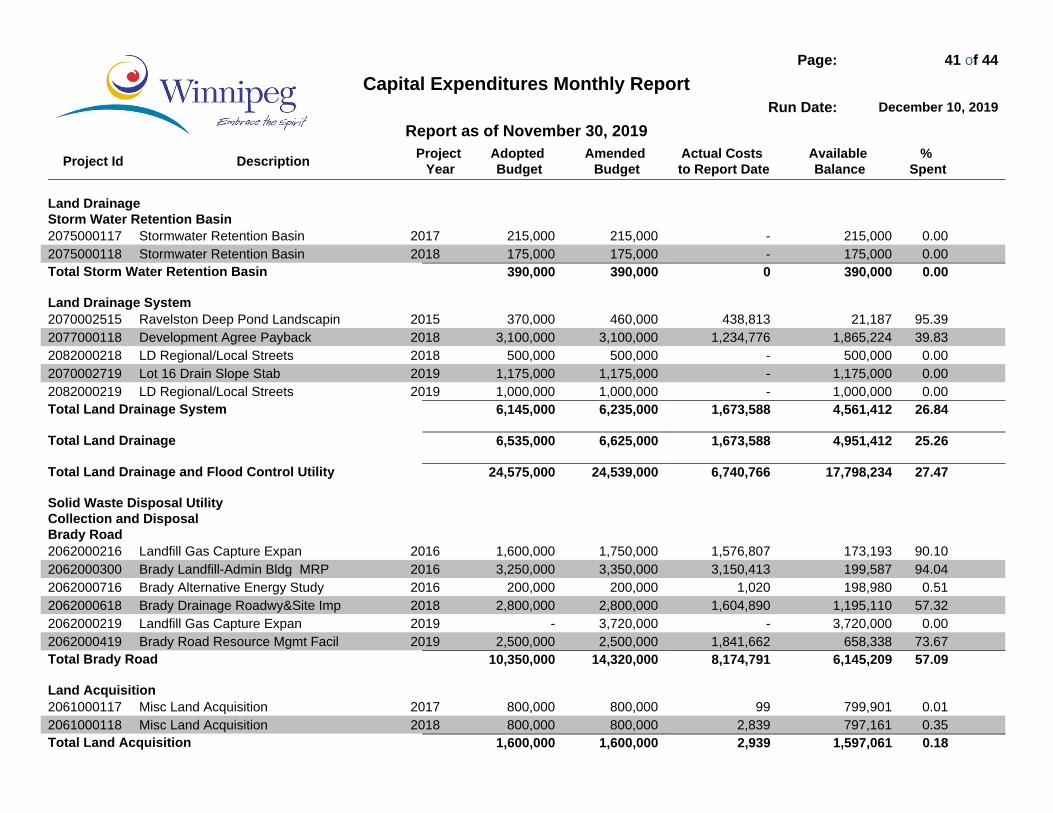
Capital Expenditures Monthly ReportPage: 41 of 44
Run Date: December 10, 2019
Report as of November 30, 2019
Project Id DescriptionProject
YearAdopted Budget
Amended Budget
Actual Costs to Report Date
Available Balance
% Spent
Land DrainageStorm Water Retention Basin2075000117 Stormwater Retention Basin 2017 215,000 215,000 - 215,000 0.002075000118 Stormwater Retention Basin 2018 175,000 175,000 - 175,000 0.00Total Storm Water Retention Basin 390,000 390,000 0 390,000 0.00
Land Drainage System2070002515 Ravelston Deep Pond Landscapin 2015 370,000 460,000 438,813 21,187 95.392077000118 Development Agree Payback 2018 3,100,000 3,100,000 1,234,776 1,865,224 39.832082000218 LD Regional/Local Streets 2018 500,000 500,000 - 500,000 0.002070002719 Lot 16 Drain Slope Stab 2019 1,175,000 1,175,000 - 1,175,000 0.002082000219 LD Regional/Local Streets 2019 1,000,000 1,000,000 - 1,000,000 0.00Total Land Drainage System 6,145,000 6,235,000 1,673,588 4,561,412 26.84
Total Land Drainage 6,535,000 6,625,000 1,673,588 4,951,412 25.26
Total Land Drainage and Flood Control Utility 24,575,000 24,539,000 6,740,766 17,798,234 27.47
Solid Waste Disposal UtilityCollection and DisposalBrady Road2062000216 Landfill Gas Capture Expan 2016 1,600,000 1,750,000 1,576,807 173,193 90.102062000300 Brady Landfill-Admin Bldg MRP 2016 3,250,000 3,350,000 3,150,413 199,587 94.042062000716 Brady Alternative Energy Study 2016 200,000 200,000 1,020 198,980 0.512062000618 Brady Drainage Roadwy&Site Imp 2018 2,800,000 2,800,000 1,604,890 1,195,110 57.322062000219 Landfill Gas Capture Expan 2019 - 3,720,000 - 3,720,000 0.002062000419 Brady Road Resource Mgmt Facil 2019 2,500,000 2,500,000 1,841,662 658,338 73.67Total Brady Road 10,350,000 14,320,000 8,174,791 6,145,209 57.09
Land Acquisition2061000117 Misc Land Acquisition 2017 800,000 800,000 99 799,901 0.012061000118 Misc Land Acquisition 2018 800,000 800,000 2,839 797,161 0.35Total Land Acquisition 1,600,000 1,600,000 2,939 1,597,061 0.18

Capital Expenditures Monthly ReportPage: 42 of 44
Run Date: December 10, 2019
Report as of November 30, 2019
Project Id DescriptionProject
YearAdopted Budget
Amended Budget
Actual Costs to Report Date
Available Balance
% Spent
Other Landfills2060000600 Closed Landfill Site Improv RP 2017 392,000 392,000 248,904 143,096 63.502060000619 Closed Landfill Site Improv 2019 225,000 225,000 80,802 144,198 35.91Total Other Landfills 617,000 617,000 329,707 287,293 53.44
Total Collection and Disposal 12,567,000 16,537,000 8,507,437 8,029,563 51.44
Recycling and Waste DiversionRecycling2065001219 CIWMS Material Recov Education 2019 250,000 250,000 - 250,000 0.00Total Recycling 250,000 250,000 0 250,000 0.00
Brady Road2065000814 CIWMS Conslt Supprt Transition 2014 200,000 200,000 27,686 172,314 13.842062000819 BRRMF - Site Improvements 2019 200,000 200,000 - 200,000 0.002062001019 BRRMF - Onsite Leachate 2019 450,000 450,000 - 450,000 0.00Total Brady Road 850,000 850,000 27,686 822,314 3.26
Information Technology2064000217 Garbage&Recycle Cart Asset Man 2017 250,000 250,000 203,194 46,806 81.282064000318 Collection Mgmt System 2018 700,000 700,000 - 700,000 0.00Total Information Technology 950,000 950,000 203,194 746,806 21.39
4R Depots2065001100 CIWMS-4R Wpg Depots MRP 2013 15,423,000 15,423,000 14,174,950 1,248,050 91.91Total 4R Depots 15,423,000 15,423,000 14,174,950 1,248,050 91.91
Total Recycling and Waste Diversion 17,473,000 17,473,000 14,405,829 3,067,171 82.45
Total Solid Waste Disposal Utility 30,040,000 34,010,000 22,913,266 11,096,734 67.37
Total Utilities 1,600,982,705 1,188,684,928 464,134,533 724,550,395 39.05
Special Operating AgenciesWinnipeg Fleet Management Agency
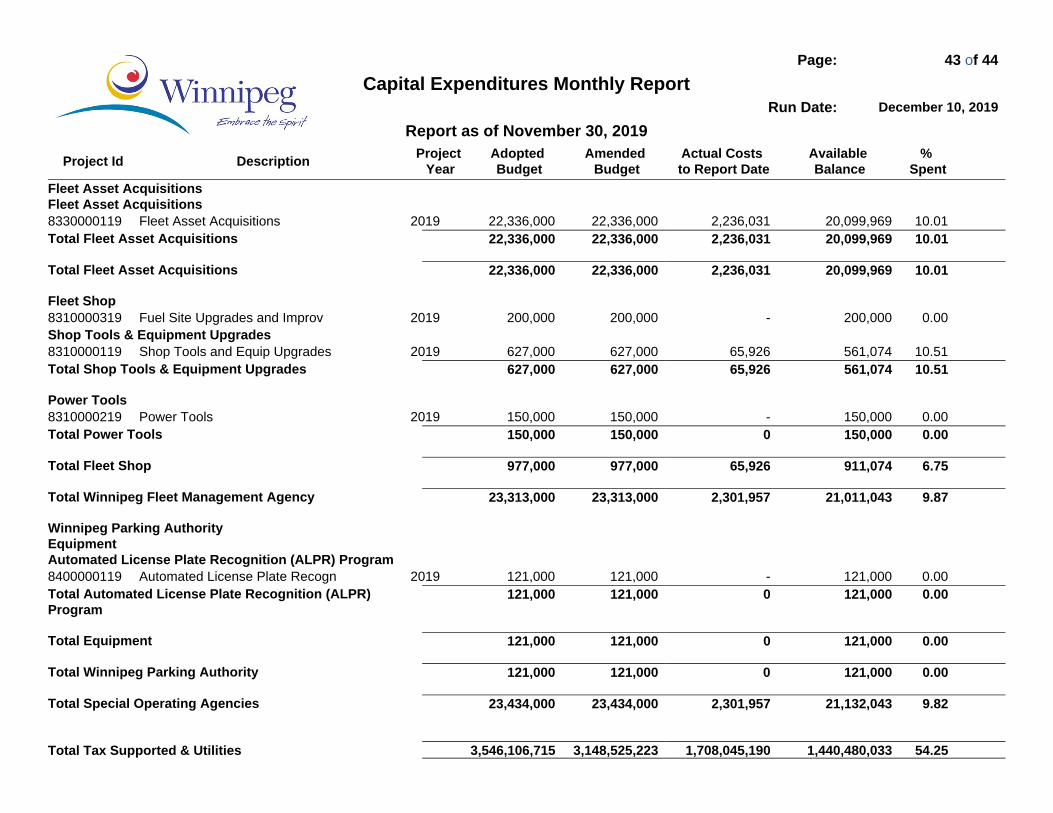
Capital Expenditures Monthly ReportPage: 43 of 44
Run Date: December 10, 2019
Report as of November 30, 2019
Project Id DescriptionProject
YearAdopted Budget
Amended Budget
Actual Costs to Report Date
Available Balance
% Spent
Fleet Asset AcquisitionsFleet Asset Acquisitions8330000119 Fleet Asset Acquisitions 2019 22,336,000 22,336,000 2,236,031 20,099,969 10.01Total Fleet Asset Acquisitions 22,336,000 22,336,000 2,236,031 20,099,969 10.01
Total Fleet Asset Acquisitions 22,336,000 22,336,000 2,236,031 20,099,969 10.01
Fleet Shop8310000319 Fuel Site Upgrades and Improv 2019 200,000 200,000 - 200,000 0.00Shop Tools & Equipment Upgrades8310000119 Shop Tools and Equip Upgrades 2019 627,000 627,000 65,926 561,074 10.51Total Shop Tools & Equipment Upgrades 627,000 627,000 65,926 561,074 10.51
Power Tools8310000219 Power Tools 2019 150,000 150,000 - 150,000 0.00Total Power Tools 150,000 150,000 0 150,000 0.00
Total Fleet Shop 977,000 977,000 65,926 911,074 6.75
Total Winnipeg Fleet Management Agency 23,313,000 23,313,000 2,301,957 21,011,043 9.87
Winnipeg Parking AuthorityEquipmentAutomated License Plate Recognition (ALPR) Program8400000119 Automated License Plate Recogn 2019 121,000 121,000 - 121,000 0.00Total Automated License Plate Recognition (ALPR) Program
121,000 121,000 0 121,000 0.00
Total Equipment 121,000 121,000 0 121,000 0.00
Total Winnipeg Parking Authority 121,000 121,000 0 121,000 0.00
Total Special Operating Agencies 23,434,000 23,434,000 2,301,957 21,132,043 9.82
Total Tax Supported & Utilities 3,546,106,715 3,148,525,223 1,708,045,190 1,440,480,033 54.25

Capital Expenditures Monthly ReportPage: 44 of 44
Run Date: December 10, 2019
Report as of November 30, 2019
Project Id DescriptionProject
YearAdopted Budget
Amended Budget
Actual Costs to Report Date
Available Balance
% Spent
End of Report