Embed Size (px)
Citation preview

Page 1 of 15 Economic Pulse Newsletter - All Rights Reserved
Full Disclaimer - Nothing here should ever be considered advice, research or the invitation to buy or sell securities. These are my personal opinions only. Copying or distribution of this report is prohibited except with express written permission.
The Economic Pulse Newsletter
September 2021 – Grinding sideways
Contents Overview Market and Investment Model Update
Economic Composite Update Special Topics Summary
Overview Welcome to the Sep 2021 release of the Economic Pulse Newsletter. Equities had another positive month. The SP500 closed down 4.7% and is also down 4.7% from its all-time high. International markets closed down 3.4%. The monthly equity COMP models remain risk-on for Oct. In GPM-COMP the hedge factor is zero. And FAST-COMP is back to risk-off. On the economic front, NONE of the COMPV2 indicators are red for this month. Econ indicators were mixed in August. I’ll dive into more detail in the economic section. Let’s start by looking at the Economic Pulse Dashboards as of Sep 30, 2021.
Table 1: Monthly Dashboard

Page 2 of 15 Economic Pulse Newsletter - All Rights Reserved
Full Disclaimer - Nothing here should ever be considered advice, research or the invitation to buy or sell securities. These are my personal opinions only. Copying or distribution of this report is prohibited except with express written permission.
The monthly dashboard shows that the signal from the monthly SPY-COMP is GREEN, risk-on. As for the monthly investment models, most of the equity portfolios are in risk-on positions for the month of Oct, except for FAST-COMP which is back to risk-off this month and will be invested in LQD. The equity models in risk-on mode will be invested in their appropriate risk-on ETFs for the month, which are shown in Table 1. Also, TAA Bond will be in TIP, TLT, LQD. BONDCOMP will be invested in its CRED allocation, which is LQD, EMB, BNDX, HYG. Now, let’s look at last month’s performance and the year’s performance.
Table 2: Monthly Equity Performance
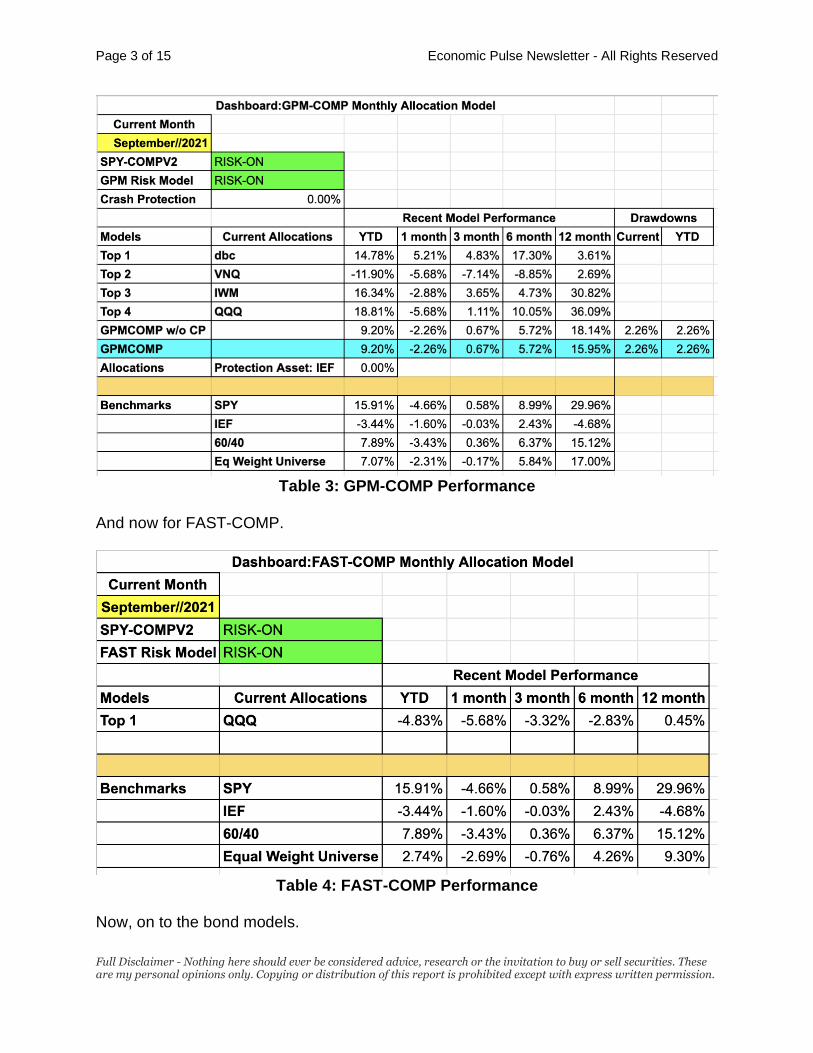
Note: dashboards are all online. You can find the new monthly dashboards here and new weekly dashboards here. Note that I have now included drawdowns in the tracker. Now, let’s look at the GPM-COMP model. Below is the tracker for the GPM-COMP model.
Page 3 of 15 Economic Pulse Newsletter - All Rights Reserved
Full Disclaimer - Nothing here should ever be considered advice, research or the invitation to buy or sell securities. These are my personal opinions only. Copying or distribution of this report is prohibited except with express written permission.
Table 3: GPM-COMP Performance
And now for FAST-COMP.
Table 4: FAST-COMP Performance
Now, on to the bond models.

Page 4 of 15 Economic Pulse Newsletter - All Rights Reserved
Full Disclaimer - Nothing here should ever be considered advice, research or the invitation to buy or sell securities. These are my personal opinions only. Copying or distribution of this report is prohibited except with express written permission.
Table 6: Monthly Bond Dashboard
And finally, here is the new Dashboard for the model investor portfolios.
Table 7: Monthly Model Investor Portfolio Performance
The Getting Started, WF-GPM and the Aggressive 1 portfolio lead for 2021 in performance with low drawdowns as well.

Page 5 of 15 Economic Pulse Newsletter - All Rights Reserved
Full Disclaimer - Nothing here should ever be considered advice, research or the invitation to buy or sell securities. These are my personal opinions only. Copying or distribution of this report is prohibited except with express written permission.
Market Update and Commentary An ugly September for almost all asset classes. All major asset classes were down for the month except for commodities and Japanese stocks. As far as US stocks go, it was actually small and microcap stocks the outperformed the large cap indices and as far as sectors, energy was the only one that was positive for the month. Volatility was up significantly for the month and had a monthly close above 20. Let’s start by taking a look at the state of the SP500, since it drives our risk-model, and some key derivative indicators, before I dive into the commentary section. Chart 1 below is what we use to track the status of SPX vs it’s 6-month SMA. The SPX closed just below its 6-month SMA this month. It’s about 5% below its all-time high. The market trend remains positive as the upward sloping 6-month SMA demonstrates.
Chart 1: SPX vs its 6-month SMA
Chart 2 below is what we use to track the weekly SPY-COMP model. The SPX closed below its 13-week EMA.

Page 6 of 15 Economic Pulse Newsletter - All Rights Reserved
Full Disclaimer - Nothing here should ever be considered advice, research or the invitation to buy or sell securities. These are my personal opinions only. Copying or distribution of this report is prohibited except with express written permission.
Chart 2: SPX vs its 13 EMA
And now two of my favorite derivative indicators. Market breadth was down over the last 4 weeks but not dramatically so.
Now, for the stock to bond ratio, a measure of risk appetite. Also, this indicator was down but overall continues to hold up as well.

Page 7 of 15 Economic Pulse Newsletter - All Rights Reserved
Full Disclaimer - Nothing here should ever be considered advice, research or the invitation to buy or sell securities. These are my personal opinions only. Copying or distribution of this report is prohibited except with express written permission.
The percent of stocks above the 200-day SMA weakened again over this past month this time lead by larger cap stocks.
And finally, long term volatility. Volatility was up big for the month and close above 20.

Page 8 of 15 Economic Pulse Newsletter - All Rights Reserved
Full Disclaimer - Nothing here should ever be considered advice, research or the invitation to buy or sell securities. These are my personal opinions only. Copying or distribution of this report is prohibited except with express written permission.
In summary, it was an ugly month for almost all assets worldwide. Commodities and japanese stocks were the only standouts for the month. Commentary An ugly month all around. The SPY ended its streak of 7 straight months of gains. Pretty much all major asset classes were down for the month including bonds. Commodities and Japanese stocks were the only ones with positive returns. Volatility was up for the month and closed above 20. Markets trends have started to change. US large cap stocks are still in their longer-term uptrends but many of the sub-indices are definitely in sideways consolidation mode now. Same is true internationally, except for Japan, with emerging market stocks potentially starting a downtrend. Despite the hints of a changing market environment, the longer-term trends remain in place for the moment, which at the moment hint at consolidation. Last Sept and Oct look very similar to the price action today. On the economic side, the indicators for Aug were good. Zero economic indicators are in the RED zone, like last month. The pace of improvement has slowed again, but this should be expected give the super strong bounce back from very low levels in the pandemic. The good economic performance is backed up across the individual indicators and even worldwide. Take a look at the economic indicator section for more details on all of this.

Page 9 of 15 Economic Pulse Newsletter - All Rights Reserved
Full Disclaimer - Nothing here should ever be considered advice, research or the invitation to buy or sell securities. These are my personal opinions only. Copying or distribution of this report is prohibited except with express written permission.
Economic Composite Update (COMPV2)
COMPV2 is our primary economic indicator. It consists of 7 individual economic indicators that have proven to signal changes in the economy prior to any significant economic downturn and to any significant stock market pull back. Please read the background document on the member home page on our economic model for a full explanation of how it works. For Aug 2021, NONE of the seven economic indicators came in RED. Same as last month. IP went back to green. Overall, the economic indicators were OK in Aug and point to continued good growth in the US economy despite them backing off their recent torrid pace of growth.
Table 5: COMPV2 Economic Indicators
This month five of the seven indicators improved. Here is the detail on each of the indicators.
• Unemployment rate (UER) – Down to 5.2%, employment growth was good for Aug. The indicator remains in the green.
• Initial Claims (ICSA) – Initial unemployment claims were down from last month. Holding down below 400K. Indicator is green.
• Real retail sales – Slightly up for Aug and still very strong year over year at over 9%. Indicator remains green.
• Industrial production, durable consumer goods – Up for Aug and July revised higher. Year over year growth is just above 1% reflecting a lot of supply issues.
• PCE (Personal consumption expenditures) – Up slightly from last month and still up strongly year over year. The indicator is GREEN.
• Leverage – Leverage ticked up last month and remains at green levels.
• Yield curve – Started to rise this month and remains positive.
Overall, COMPV2 was better than in Aug sndt none of the seven indicators are RED. Economic momentum continues to be strong but is cooling off from the crazy bounce back post COVID.

Page 10 of 15 Economic Pulse Newsletter - All Rights Reserved
Full Disclaimer - Nothing here should ever be considered advice, research or the invitation to buy or sell securities. These are my personal opinions only. Copying or distribution of this report is prohibited except with express written permission.
Now let’s look at the COMPV2 Probit model. This month stayed about the same. The COMPV2 indicators, minus PCE, are used as inputs to the Probit model to calculate the probability of a recession. The primary purpose of the Probit in real time is to identify the recession start. It also helps us choose the top economic indicators for the COMP model. I’ve started to post the Probit models on the bottom of the COMPV2 charts page. For Aug 2021 data, both Probit models are still close to the 0% These levels suggest the US economy continues to grow nicely.
Let’s move on to supporting indicators and what they’re saying about the US economy.

Page 11 of 15 Economic Pulse Newsletter - All Rights Reserved
Full Disclaimer - Nothing here should ever be considered advice, research or the invitation to buy or sell securities. These are my personal opinions only. Copying or distribution of this report is prohibited except with express written permission.
Supporting Economic Indicators
In this section, we look at what supporting indicators are telling us about the US economy. Here we look for confirmation or divergences from our COMPV2 indicator. By looking at what other indicators are saying we can gain some valuable insight into current economic conditions. First, Table 7 is the update on the set of other composite indicators we track as of the end of Sep for Aug 2021 data.
Table 7: Composite Economic Indicators
The current picture, for Aug data, is the same as last month, no major warning signs in the overall picture.

Page 12 of 15 Economic Pulse Newsletter - All Rights Reserved
Full Disclaimer - Nothing here should ever be considered advice, research or the invitation to buy or sell securities. These are my personal opinions only. Copying or distribution of this report is prohibited except with express written permission.
Now, let’s look at the individual indicators. Table 8 also shows the that the labor indicators were a bit worse over last month, after accounting for unreported indicators.
Table 8: Part 1 of the individual Indicators
Table 9 shows the Consumer, Housing and Business indicators. Consumer and business were flat from last month while housing indicators worsened.

Page 13 of 15 Economic Pulse Newsletter - All Rights Reserved
Full Disclaimer - Nothing here should ever be considered advice, research or the invitation to buy or sell securities. These are my personal opinions only. Copying or distribution of this report is prohibited except with express written permission.
Table 9: Part 2 of the Individual Indicators
Table 10 below shows the credit and market health scores. Credit is about the same as last month but market indicators worsened again due to China.

Page 14 of 15 Economic Pulse Newsletter - All Rights Reserved
Full Disclaimer - Nothing here should ever be considered advice, research or the invitation to buy or sell securities. These are my personal opinions only. Copying or distribution of this report is prohibited except with express written permission.
Table 10: Part 3 of the Individual Indicators
In summary, COMPV2, the composite indicators, and the individual indicators are telling us the same thing. The US economy continues to grow nicely with no major warning signs. The pace of growth has slowed but that was to be expected after the bounce back effect from COVID.

Page 15 of 15 Economic Pulse Newsletter - All Rights Reserved
Full Disclaimer - Nothing here should ever be considered advice, research or the invitation to buy or sell securities. These are my personal opinions only. Copying or distribution of this report is prohibited except with express written permission.
Special Topic In this section, we’ll highlight a topic of interest for the month. Often it may be debunking a scary chart of the month, of which there always seems to be one. Or it could just be something interesting to highlight or pay attention to for the month.
No special topic this month.
Summary
That’s it for this month. As of Sep 30, 2021, the monthly SPY-COMP and all of the equity models are still RISK-ON. GPM-COMP is also risk-on with no hedge. FAST-COMP is back to risk-off. As always, if you have any questions or comments drop me an email at [email protected]