Embed Size (px)
Citation preview

Page 2
Multifamily Market Trends
USC Casden Forecast | 2018 Multifamily Report
Page 3
Produced By:
USC Lusk Center for Real Estate
Authors:
Richard K. Green | Director | USC Lusk Center for Real Estate
Beacon Economics team
Christopher Thornberg | Founding Partner
Robert Kleinhenz | Economist | Executive Director of Research
Adam J. Fowler | Research Manager
Justin Niakamal, Senior Research Associate
White Papers:
Jessie Kornberg | President & CEO | Bet Tzedek
Barry Altshuler | Vice President, Investments | Equity Residential
Online at | lusk.usc.edu/casden
USC Lusk Center For Real Estate Casden Real Estate Economics Forecast
2018 Multifamily Report
Page 4
Multifamily Market Trends
Casden Multifamily Forecast Sponsors
Program Affiliates
Gold Sponsors
Silver Sponsors
Page 5
Contents
Current View of the eConomy 6
Los AngeLes 10
Los AngeLes submArkets 13
orAnge County 26
orAnge County submArkets 29
inLAnd empire 34
inLAnd empire submArkets 37
sAn diego 42
sAn diego submArkets 45
VenturA 50
VenturA submArkets 53
prop 10 essAys 56
teChniCAL notes 58
methodoLogy 58
Current View of the Economy
Page 6
Current View of the EconomyFigure 1: New Private Housing Units Authorized by Building Permits,
Thousands of Units, Monthly, Seasonally Adjusted Annual Rate (Federal Reserve Economic Data)
Figure 2 :
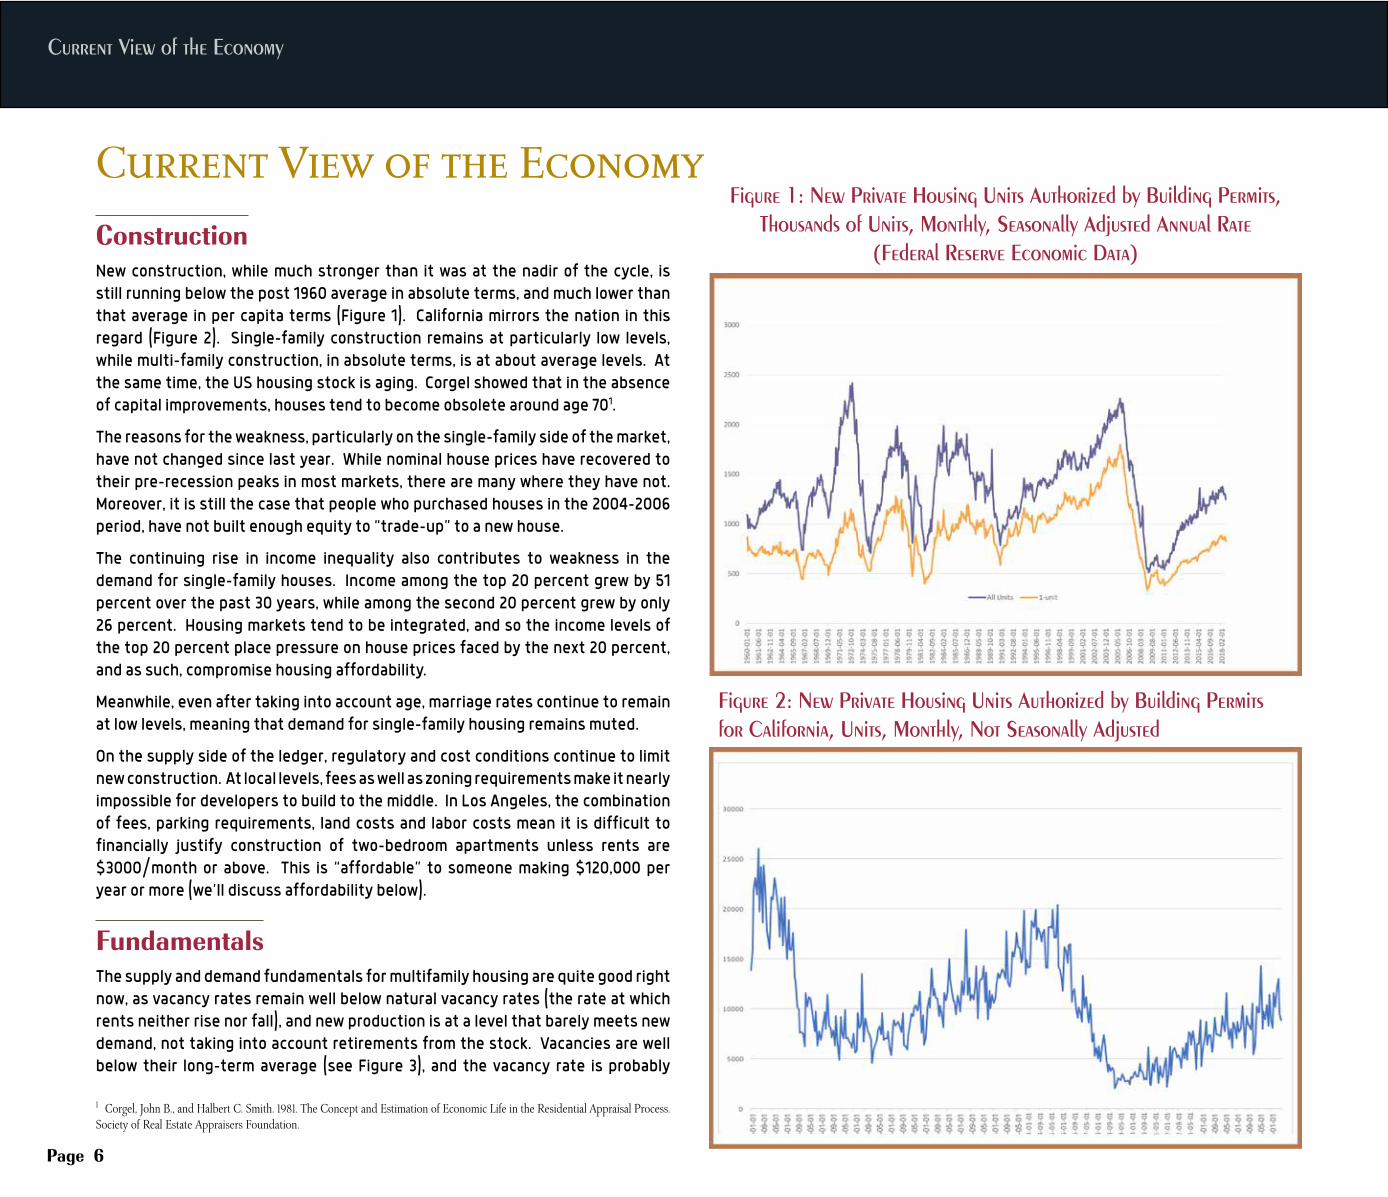
Construction New construction, while much stronger than it was at the nadir of the cycle, is still running below the post 1960 average in absolute terms, and much lower than that average in per capita terms (Figure 1). California mirrors the nation in this regard (Figure 2). Single-family construction remains at particularly low levels, while multi-family construction, in absolute terms, is at about average levels. At the same time, the US housing stock is aging. Corgel showed that in the absence of capital improvements, houses tend to become obsolete around age 701.
The reasons for the weakness, particularly on the single-family side of the market, have not changed since last year. While nominal house prices have recovered to their pre-recession peaks in most markets, there are many where they have not. Moreover, it is still the case that people who purchased houses in the 2004-2006 period, have not built enough equity to “trade-up” to a new house.
The continuing rise in income inequality also contributes to weakness in the demand for single-family houses. Income among the top 20 percent grew by 51 percent over the past 30 years, while among the second 20 percent grew by only 26 percent. Housing markets tend to be integrated, and so the income levels of the top 20 percent place pressure on house prices faced by the next 20 percent, and as such, compromise housing affordability.
Meanwhile, even after taking into account age, marriage rates continue to remain at low levels, meaning that demand for single-family housing remains muted.
On the supply side of the ledger, regulatory and cost conditions continue to limit new construction. At local levels, fees as well as zoning requirements make it nearly impossible for developers to build to the middle. In Los Angeles, the combination of fees, parking requirements, land costs and labor costs mean it is difficult to financially justify construction of two-bedroom apartments unless rents are $3000/month or above. This is “affordable” to someone making $120,000 per year or more (we’ll discuss affordability below).
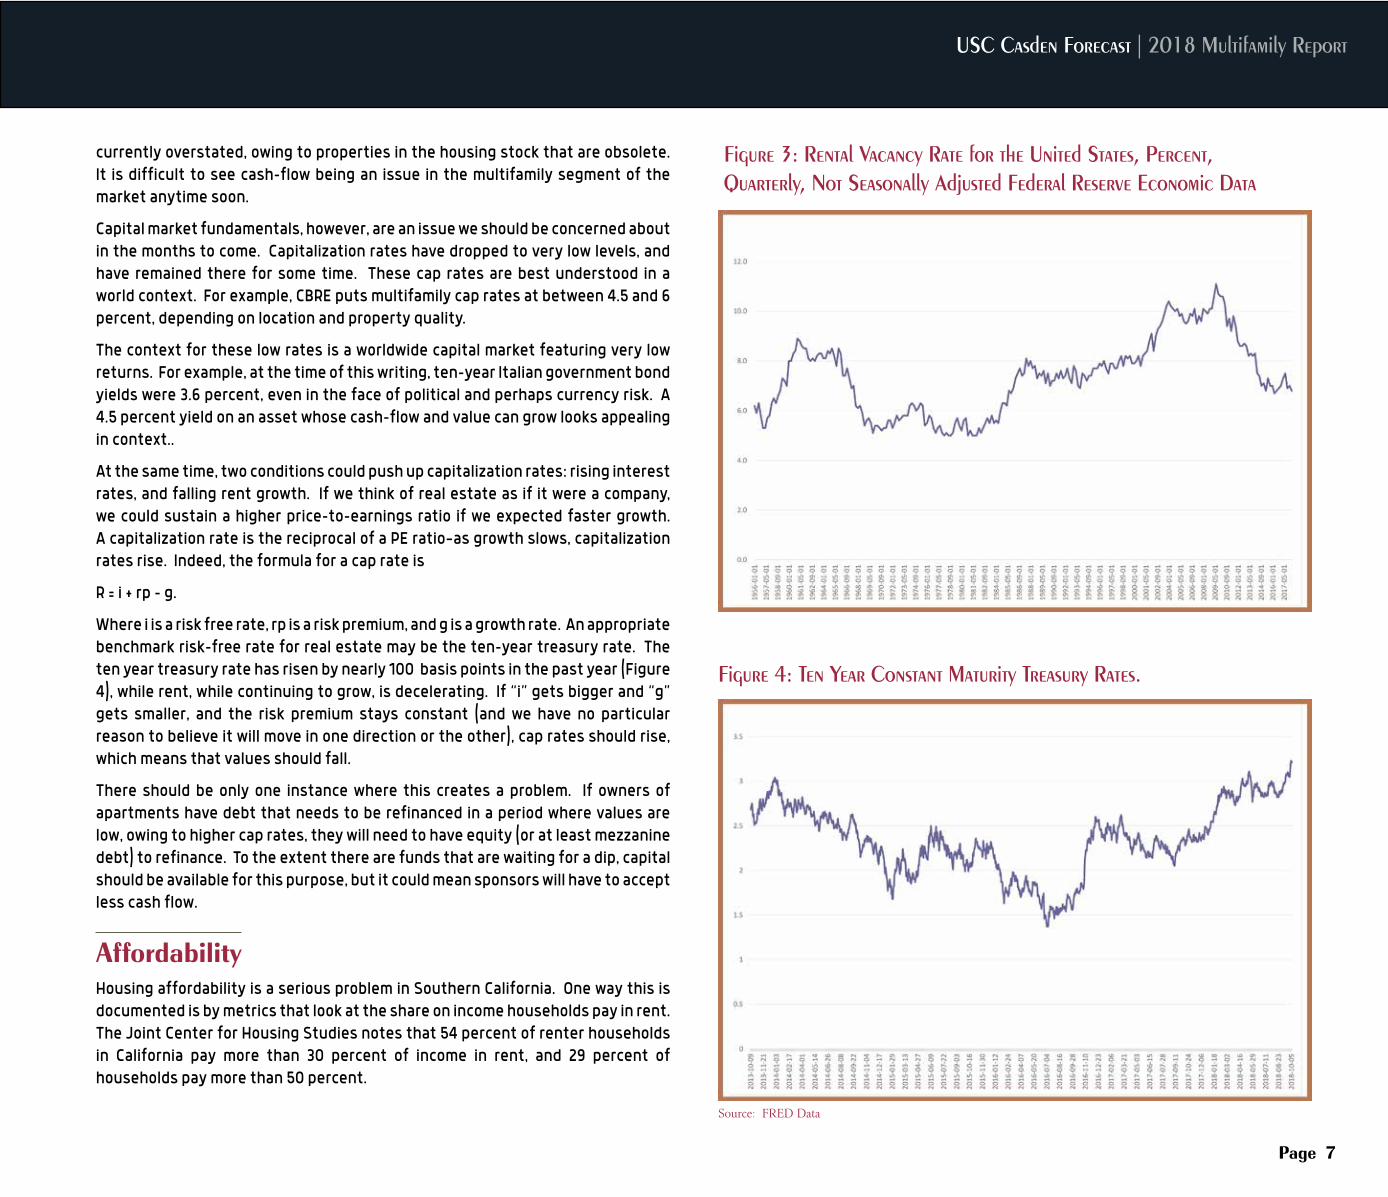
FundamentalsThe supply and demand fundamentals for multifamily housing are quite good right now, as vacancy rates remain well below natural vacancy rates (the rate at which rents neither rise nor fall), and new production is at a level that barely meets new demand, not taking into account retirements from the stock. Vacancies are well below their long-term average (see Figure 3), and the vacancy rate is probably
Figure 2: New Private Housing Units Authorized by Building Permits for California, Units, Monthly, Not Seasonally Adjusted
1 Corgel, John B., and Halbert C. Smith. 1981. The Concept and Estimation of Economic Life in the Residential Appraisal Process. Society of Real Estate Appraisers Foundation.
USC Casden Forecast | 2018 Multifamily Report
Page 7
Figure 3: Rental Vacancy Rate for the United States, Percent, Quarterly, Not Seasonally Adjusted Federal Reserve Economic Data
Figure 4: Ten Year Constant Maturity Treasury Rates.
currently overstated, owing to properties in the housing stock that are obsolete. It is difficult to see cash-flow being an issue in the multifamily segment of the market anytime soon.
Capital market fundamentals, however, are an issue we should be concerned about in the months to come. Capitalization rates have dropped to very low levels, and have remained there for some time. These cap rates are best understood in a world context. For example, CBRE puts multifamily cap rates at between 4.5 and 6 percent, depending on location and property quality.
The context for these low rates is a worldwide capital market featuring very low returns. For example, at the time of this writing, ten-year Italian government bond yields were 3.6 percent, even in the face of political and perhaps currency risk. A 4.5 percent yield on an asset whose cash-flow and value can grow looks appealing in context..
At the same time, two conditions could push up capitalization rates: rising interest rates, and falling rent growth. If we think of real estate as if it were a company, we could sustain a higher price-to-earnings ratio if we expected faster growth. A capitalization rate is the reciprocal of a PE ratio—as growth slows, capitalization rates rise. Indeed, the formula for a cap rate is
R = i + rp – g.
Where i is a risk free rate, rp is a risk premium, and g is a growth rate. An appropriate benchmark risk-free rate for real estate may be the ten-year treasury rate. The ten year treasury rate has risen by nearly 100 basis points in the past year (Figure 4), while rent, while continuing to grow, is decelerating. If “i” gets bigger and “g” gets smaller, and the risk premium stays constant (and we have no particular reason to believe it will move in one direction or the other), cap rates should rise, which means that values should fall.
There should be only one instance where this creates a problem. If owners of apartments have debt that needs to be refinanced in a period where values are low, owing to higher cap rates, they will need to have equity (or at least mezzanine debt) to refinance. To the extent there are funds that are waiting for a dip, capital should be available for this purpose, but it could mean sponsors will have to accept less cash flow.
AffordabilityHousing affordability is a serious problem in Southern California. One way this is documented is by metrics that look at the share on income households pay in rent. The Joint Center for Housing Studies notes that 54 percent of renter households in California pay more than 30 percent of income in rent, and 29 percent of households pay more than 50 percent.
Source: FRED Data
Current View of the Economy
Page 8
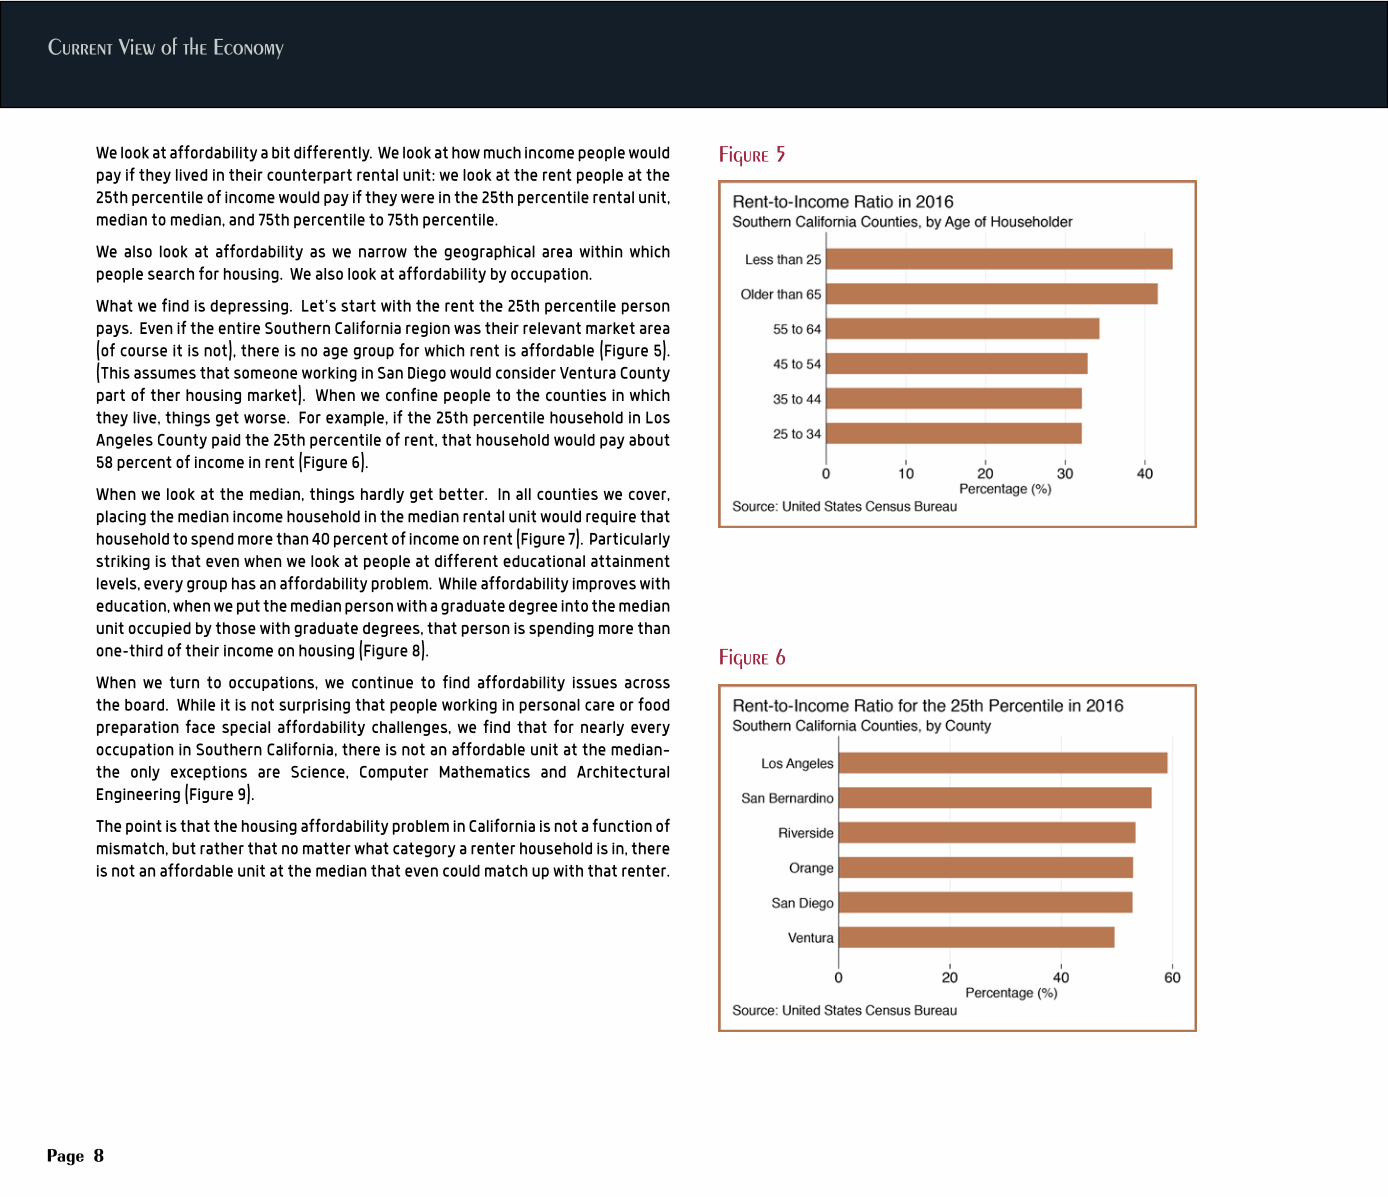
Figure 5We look at affordability a bit differently. We look at how much income people would pay if they lived in their counterpart rental unit: we look at the rent people at the 25th percentile of income would pay if they were in the 25th percentile rental unit, median to median, and 75th percentile to 75th percentile.
We also look at affordability as we narrow the geographical area within which people search for housing. We also look at affordability by occupation.
What we find is depressing. Let’s start with the rent the 25th percentile person pays. Even if the entire Southern California region was their relevant market area (of course it is not), there is no age group for which rent is affordable (Figure 5). (This assumes that someone working in San Diego would consider Ventura County part of ther housing market). When we confine people to the counties in which they live, things get worse. For example, if the 25th percentile household in Los Angeles County paid the 25th percentile of rent, that household would pay about 58 percent of income in rent (Figure 6).
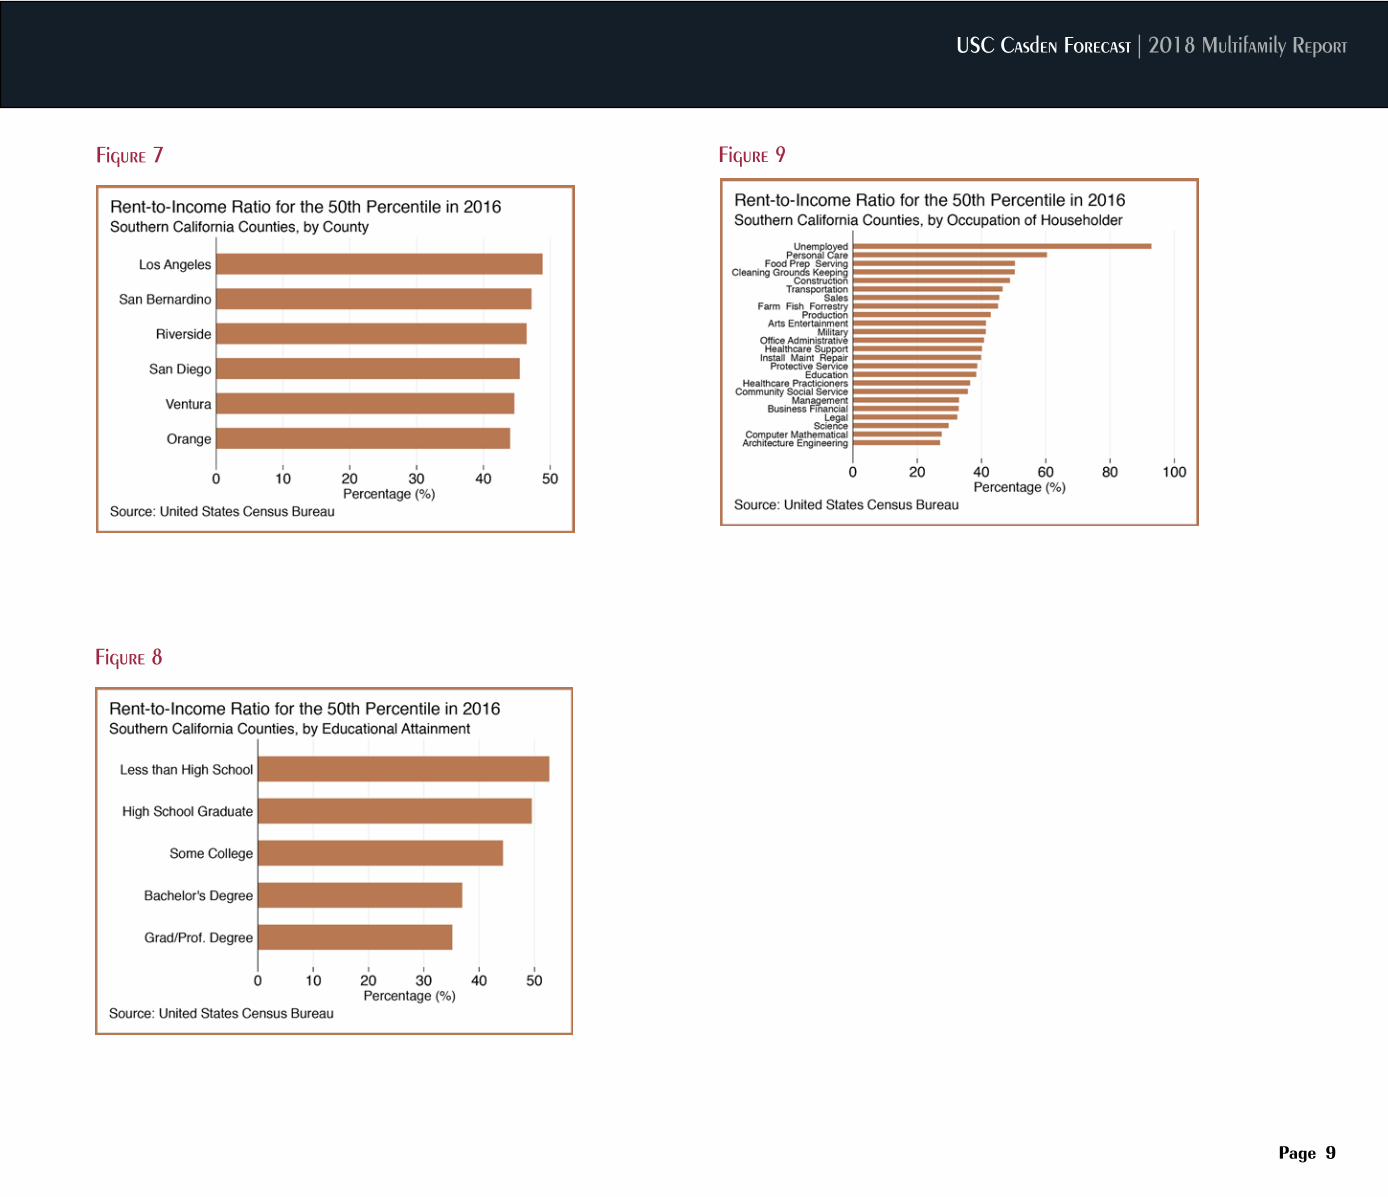
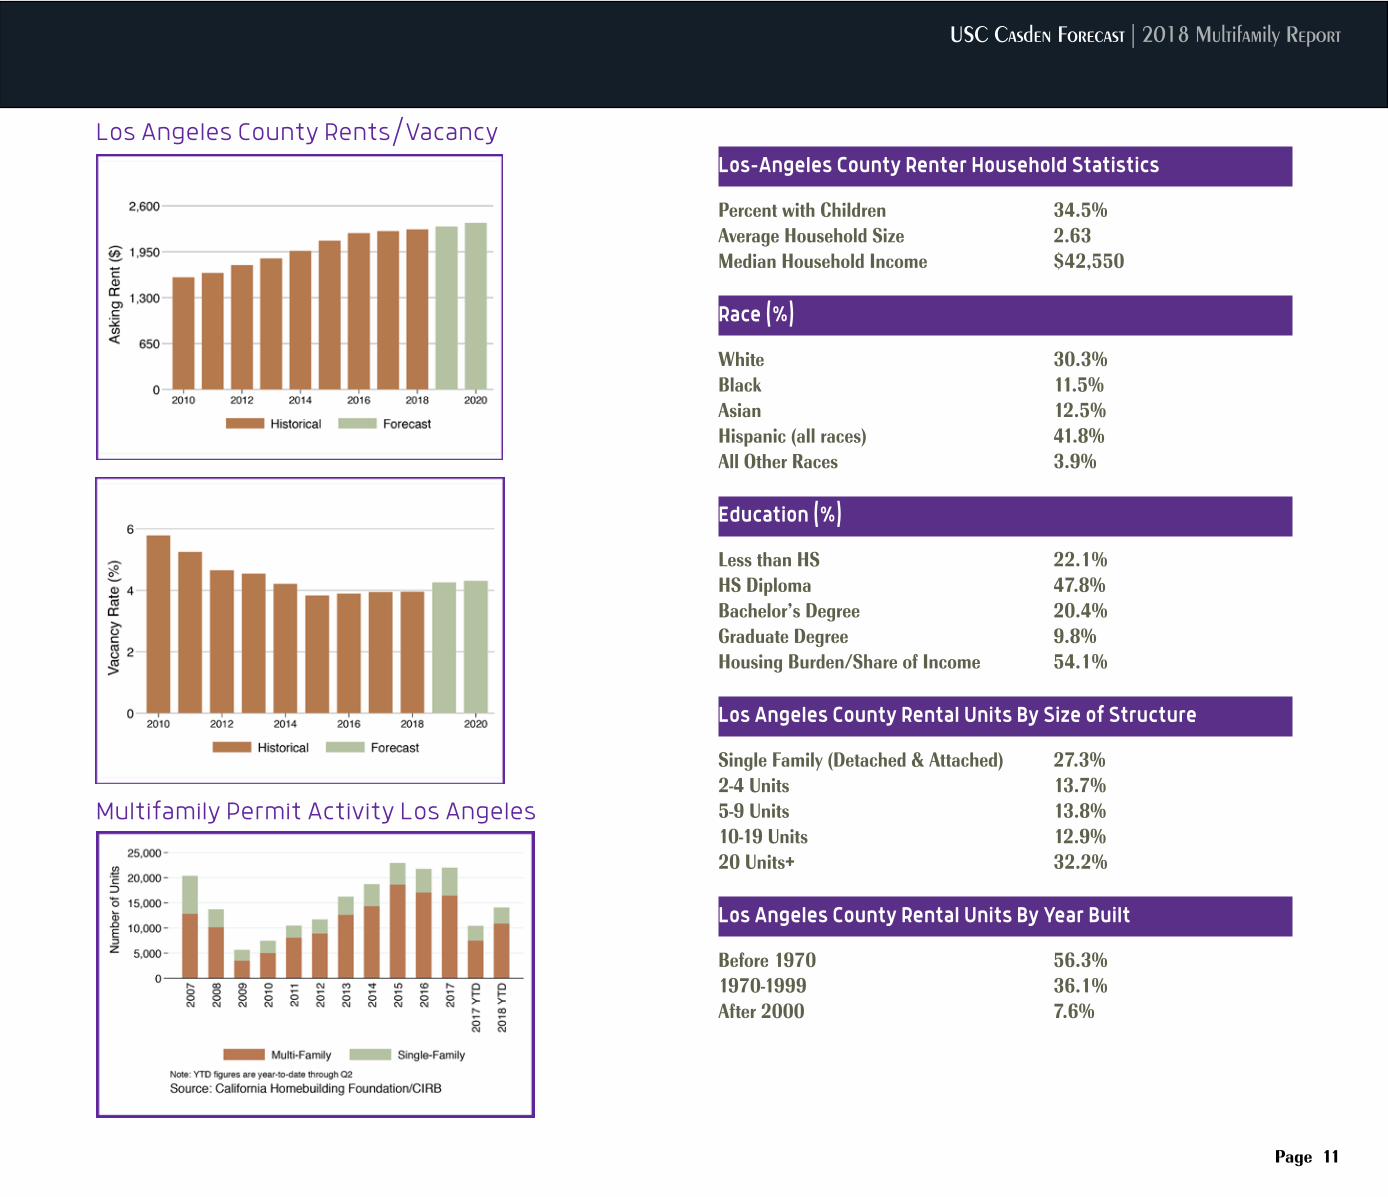
When we look at the median, things hardly get better. In all counties we cover, placing the median income household in the median rental unit would require that household to spend more than 40 percent of income on rent (Figure 7). Particularly striking is that even when we look at people at different educational attainment levels, every group has an affordability problem. While affordability improves with education, when we put the median person with a graduate degree into the median unit occupied by those with graduate degrees, that person is spending more than one-third of their income on housing (Figure 8).
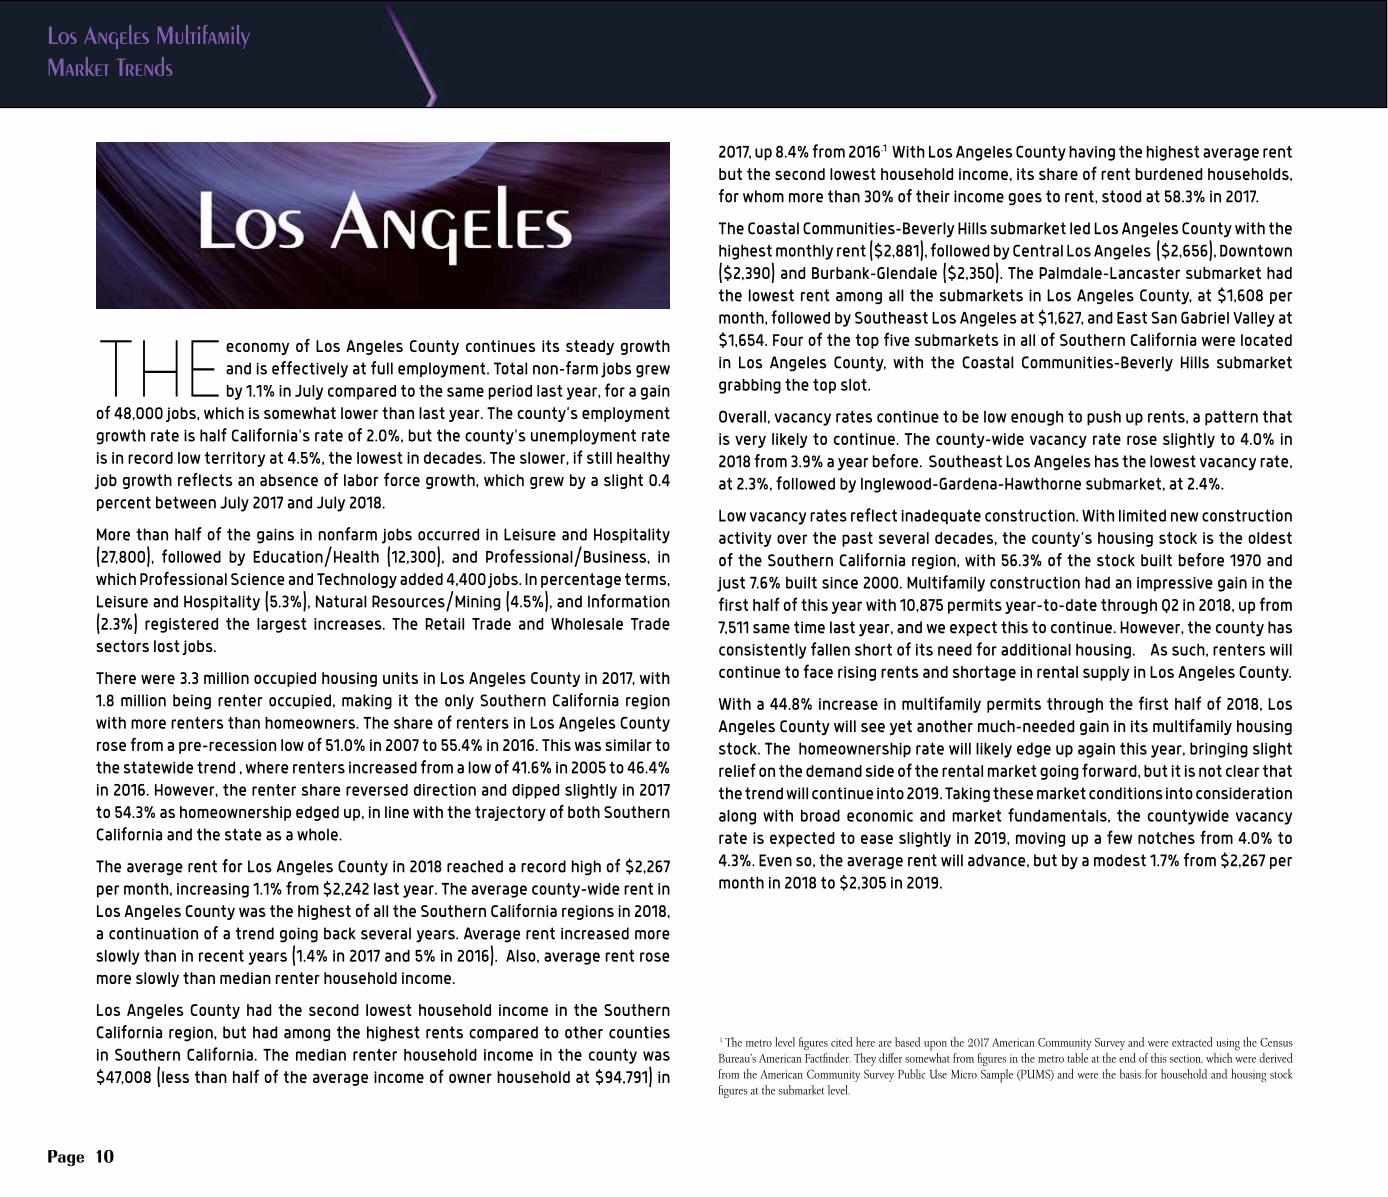
When we turn to occupations, we continue to find affordability issues across the board. While it is not surprising that people working in personal care or food preparation face special affordability challenges, we find that for nearly every occupation in Southern California, there is not an affordable unit at the median—the only exceptions are Science, Computer Mathematics and Architectural Engineering (Figure 9).
The point is that the housing affordability problem in California is not a function of mismatch, but rather that no matter what category a renter household is in, there is not an affordable unit at the median that even could match up with that renter.
Figure 6
USC Casden Forecast | 2018 Multifamily Report
Page 9
Figure 7
Figure 8
Figure 9
Los Angeles Multifamily Market Trends
Page 10
THE economy of Los Angeles County continues its steady growth and is effectively at full employment. Total non-farm jobs grew by 1.1% in July compared to the same period last year, for a gain
of 48,000 jobs, which is somewhat lower than last year. The county’s employment growth rate is half California’s rate of 2.0%, but the county’s unemployment rate is in record low territory at 4.5%, the lowest in decades. The slower, if still healthy job growth reflects an absence of labor force growth, which grew by a slight 0.4 percent between July 2017 and July 2018.
More than half of the gains in nonfarm jobs occurred in Leisure and Hospitality (27,800), followed by Education/Health (12,300), and Professional/Business, in which Professional Science and Technology added 4,400 jobs. In percentage terms, Leisure and Hospitality (5.3%), Natural Resources/Mining (4.5%), and Information (2.3%) registered the largest increases. The Retail Trade and Wholesale Trade sectors lost jobs.
There were 3.3 million occupied housing units in Los Angeles County in 2017, with 1.8 million being renter occupied, making it the only Southern California region with more renters than homeowners. The share of renters in Los Angeles County rose from a pre-recession low of 51.0% in 2007 to 55.4% in 2016. This was similar to the statewide trend , where renters increased from a low of 41.6% in 2005 to 46.4% in 2016. However, the renter share reversed direction and dipped slightly in 2017 to 54.3% as homeownership edged up, in line with the trajectory of both Southern California and the state as a whole.
The average rent for Los Angeles County in 2018 reached a record high of $2,267 per month, increasing 1.1% from $2,242 last year. The average county-wide rent in Los Angeles County was the highest of all the Southern California regions in 2018, a continuation of a trend going back several years. Average rent increased more slowly than in recent years (1.4% in 2017 and 5% in 2016). Also, average rent rose more slowly than median renter household income.
Los Angeles County had the second lowest household income in the Southern California region, but had among the highest rents compared to other counties in Southern California. The median renter household income in the county was $47,008 (less than half of the average income of owner household at $94,791) in
2017, up 8.4% from 2016.1 With Los Angeles County having the highest average rent but the second lowest household income, its share of rent burdened households, for whom more than 30% of their income goes to rent, stood at 58.3% in 2017.
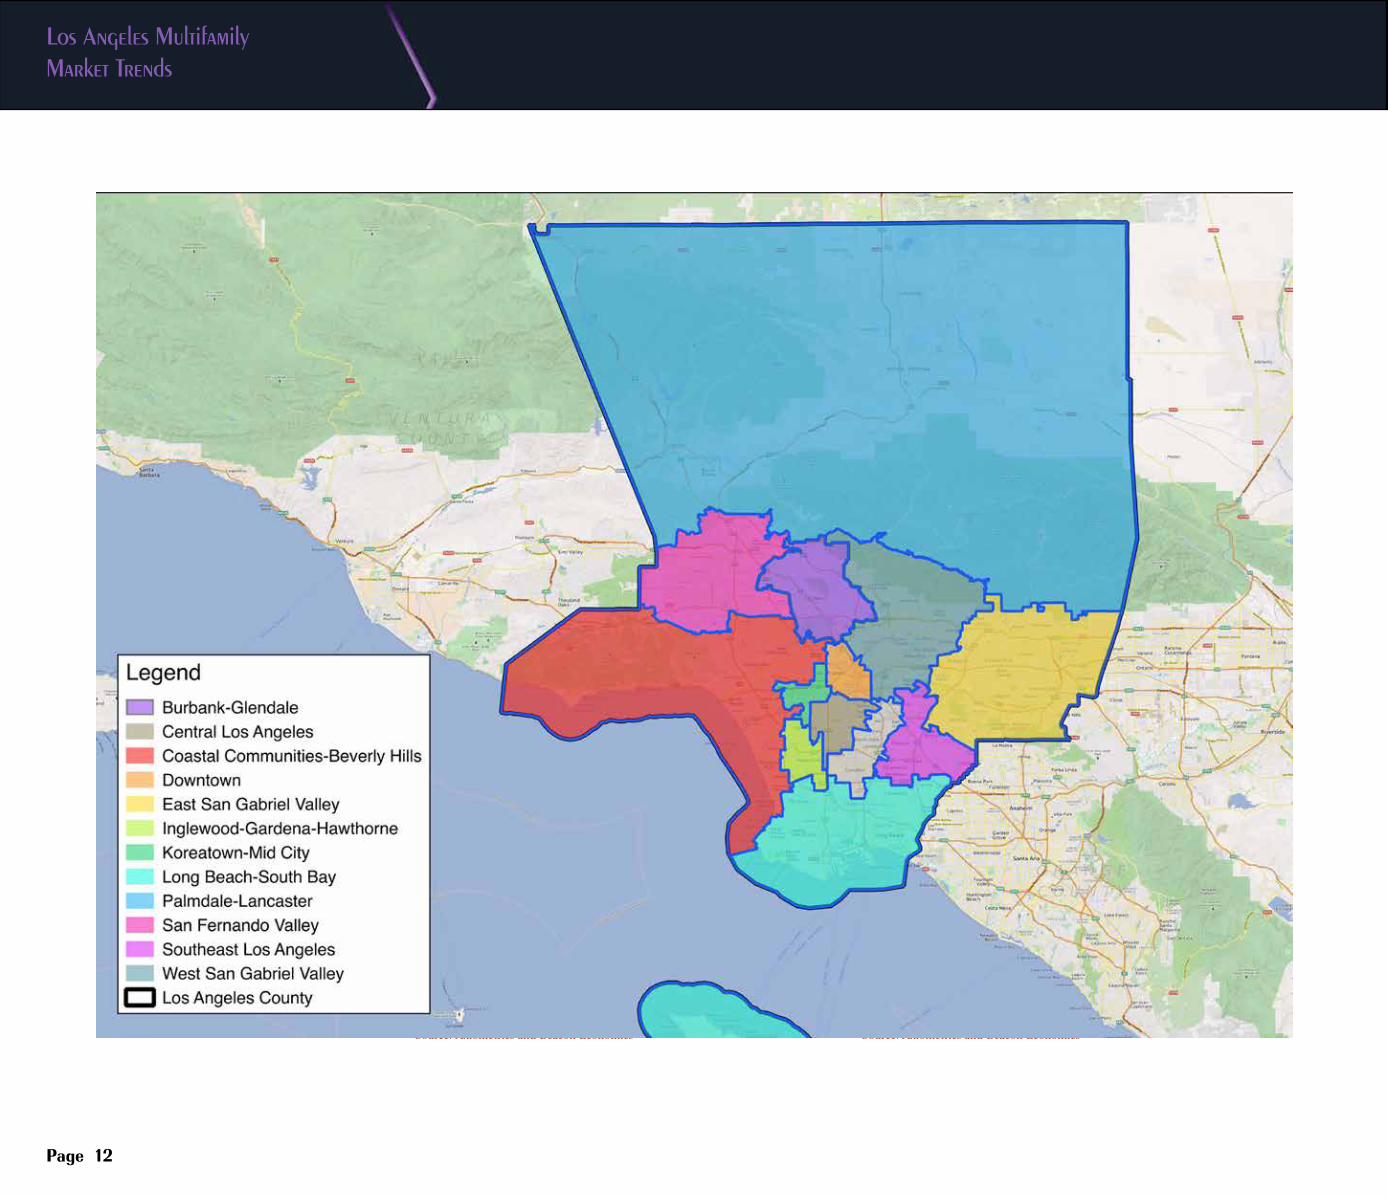
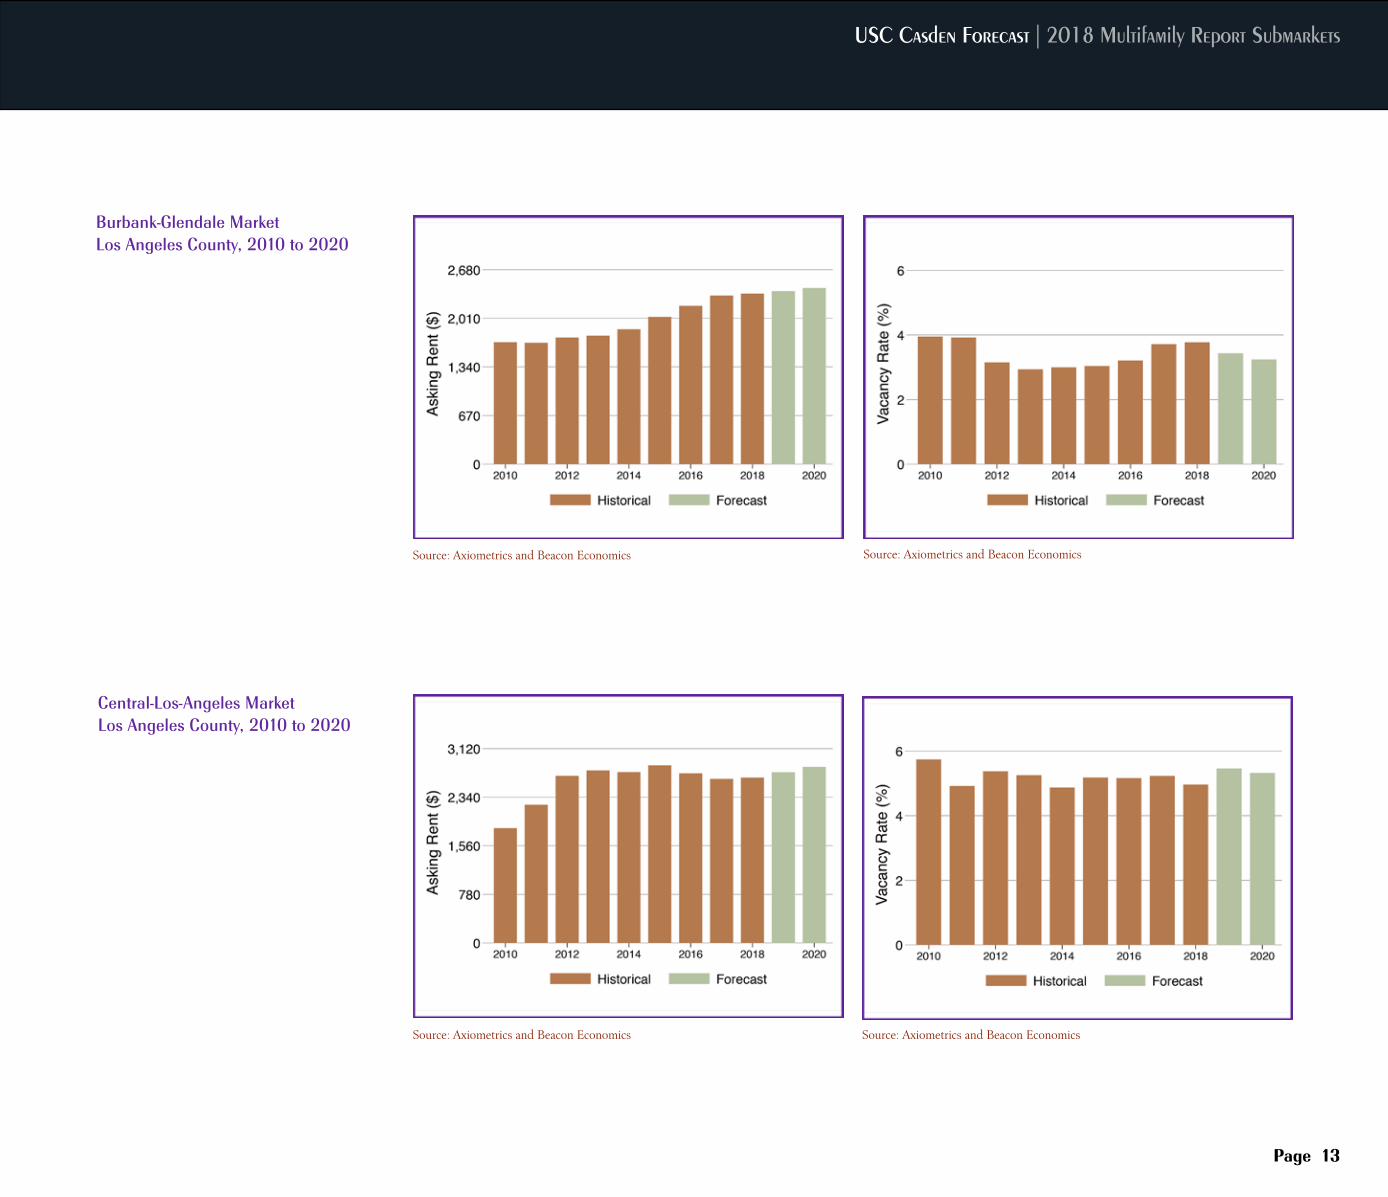
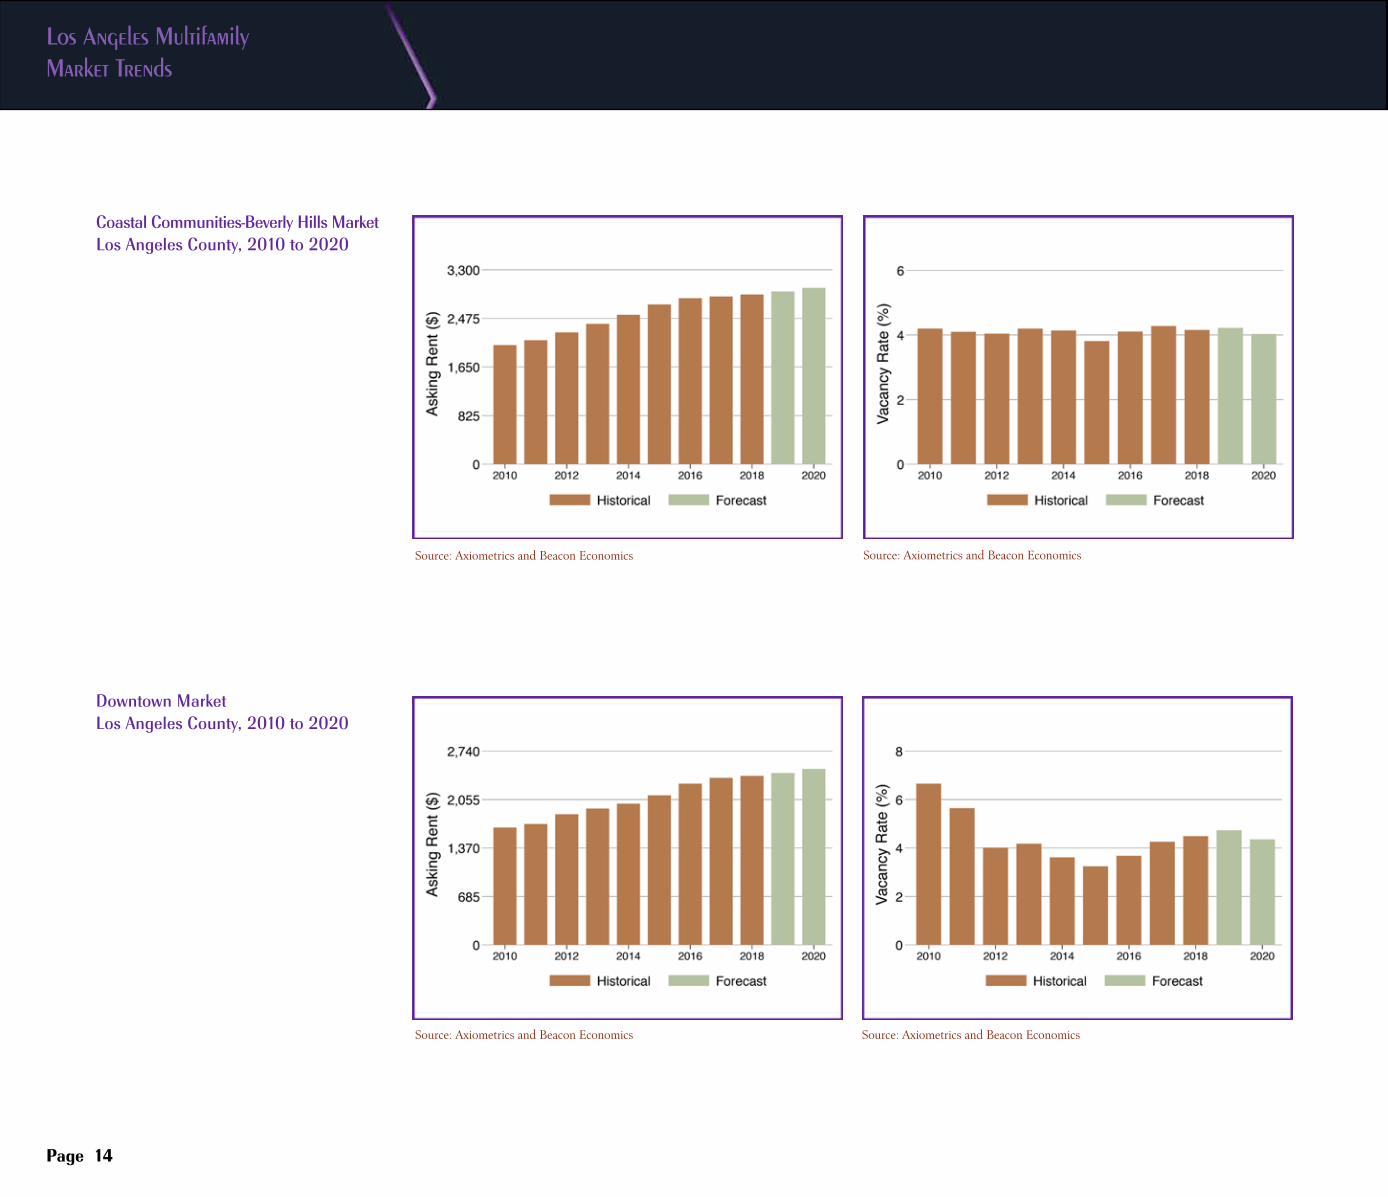
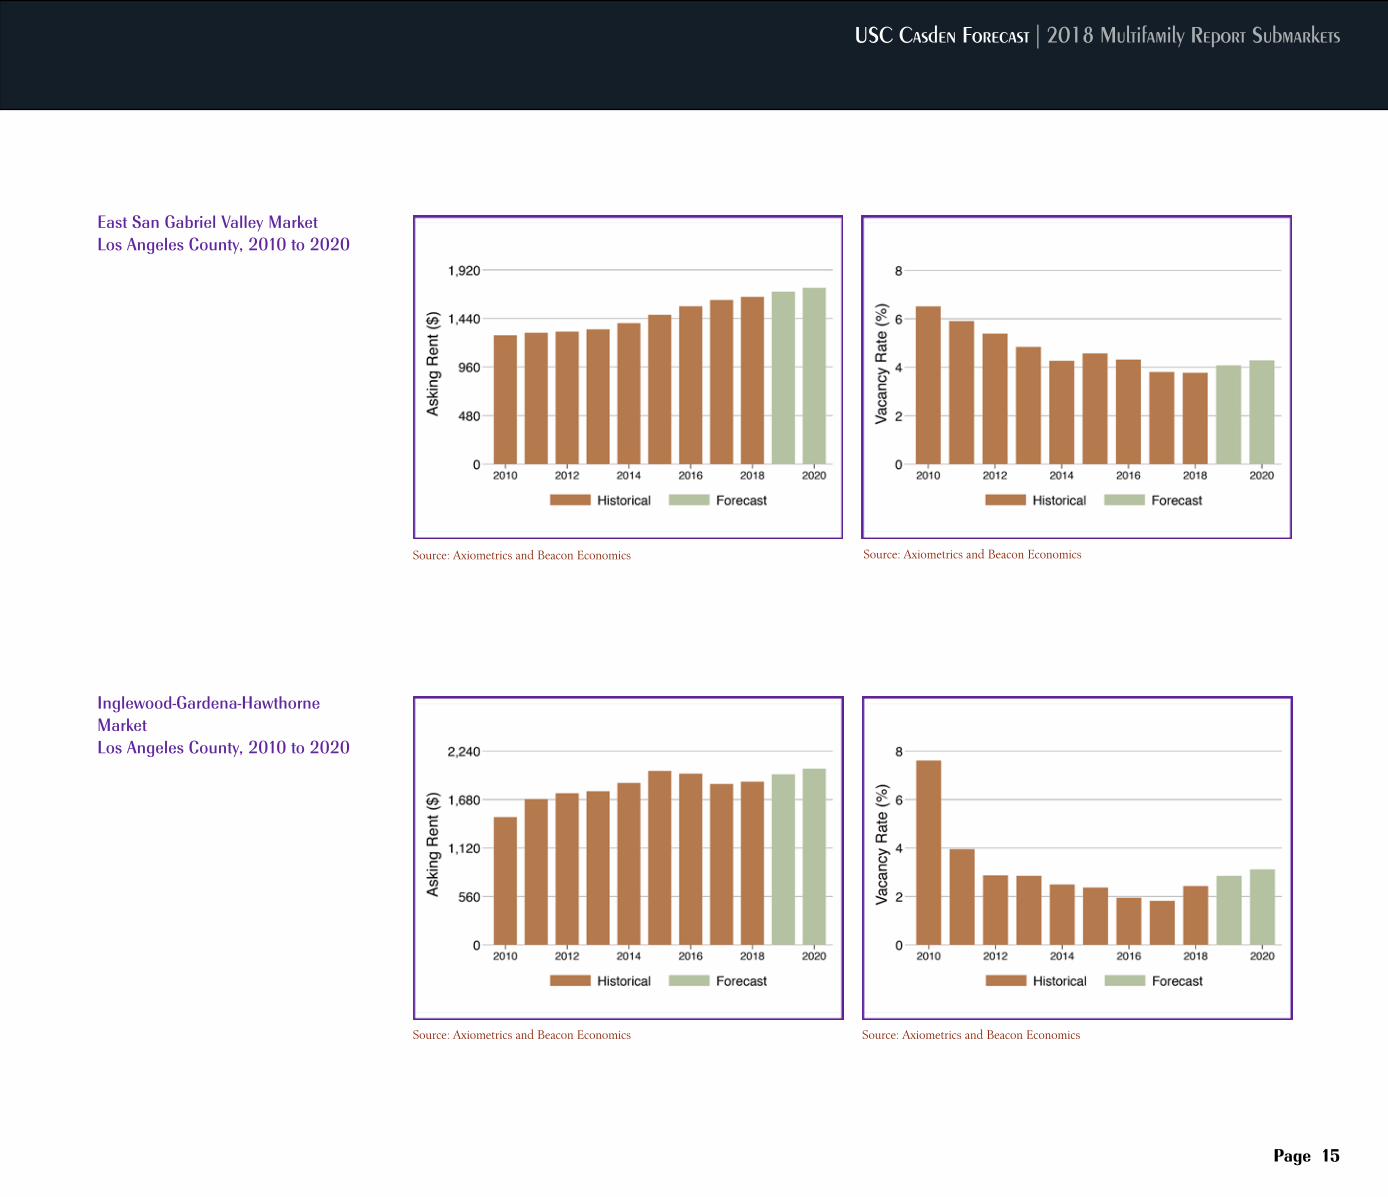
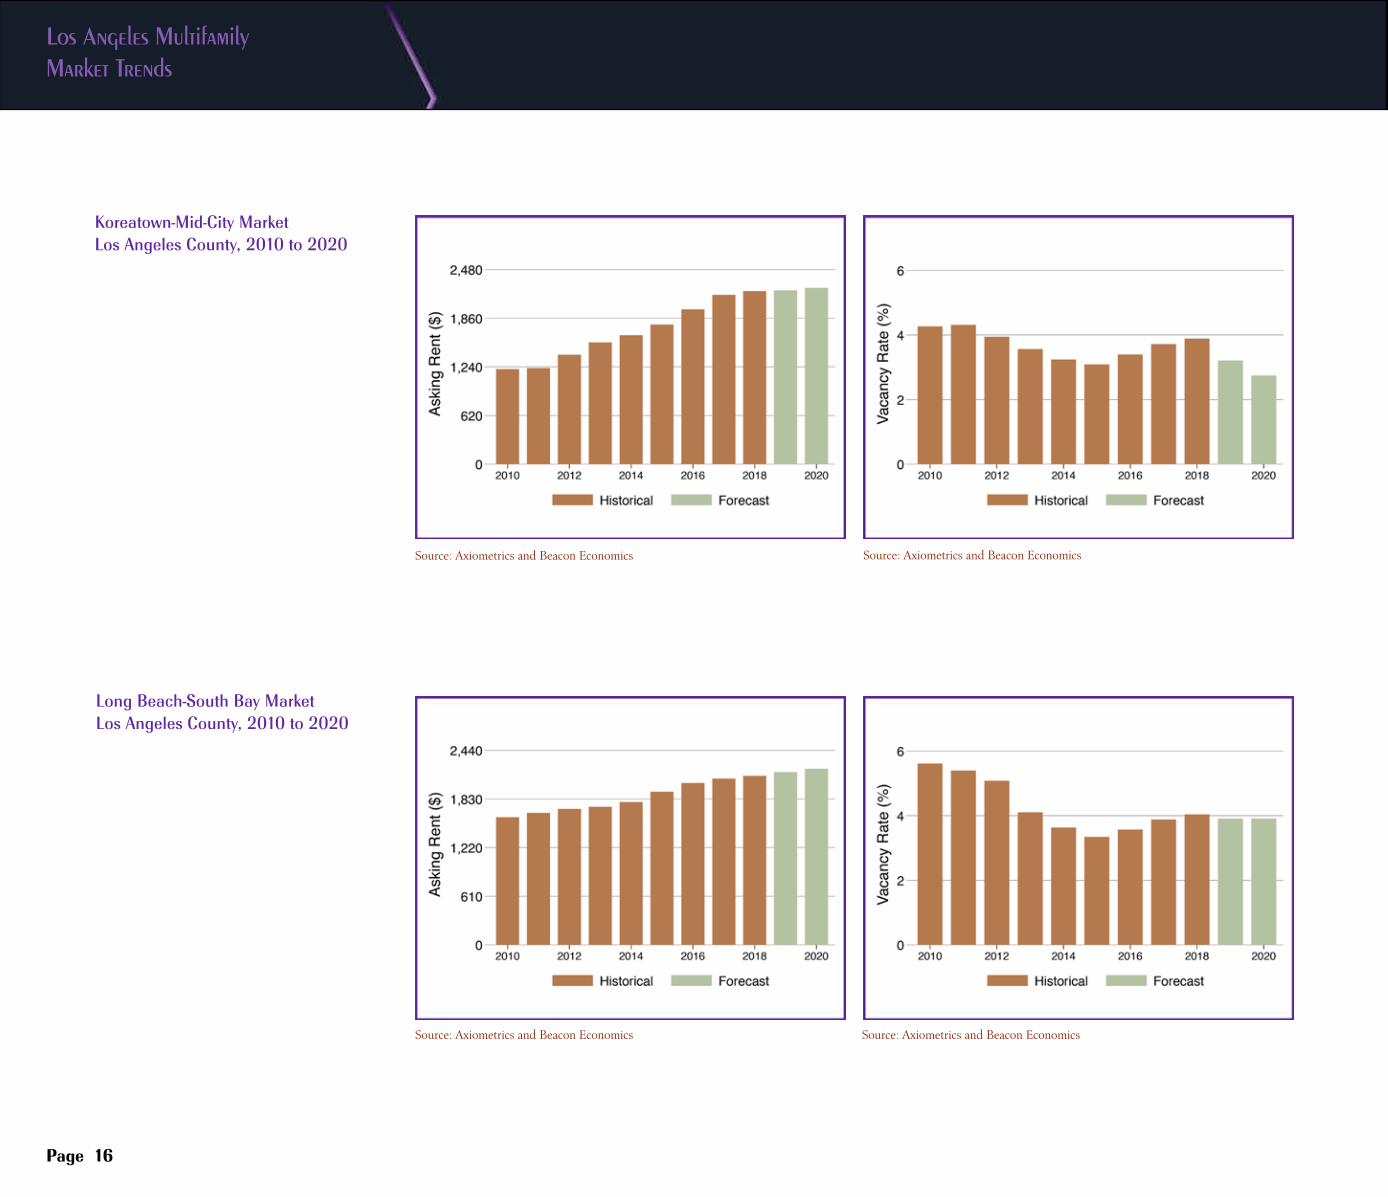
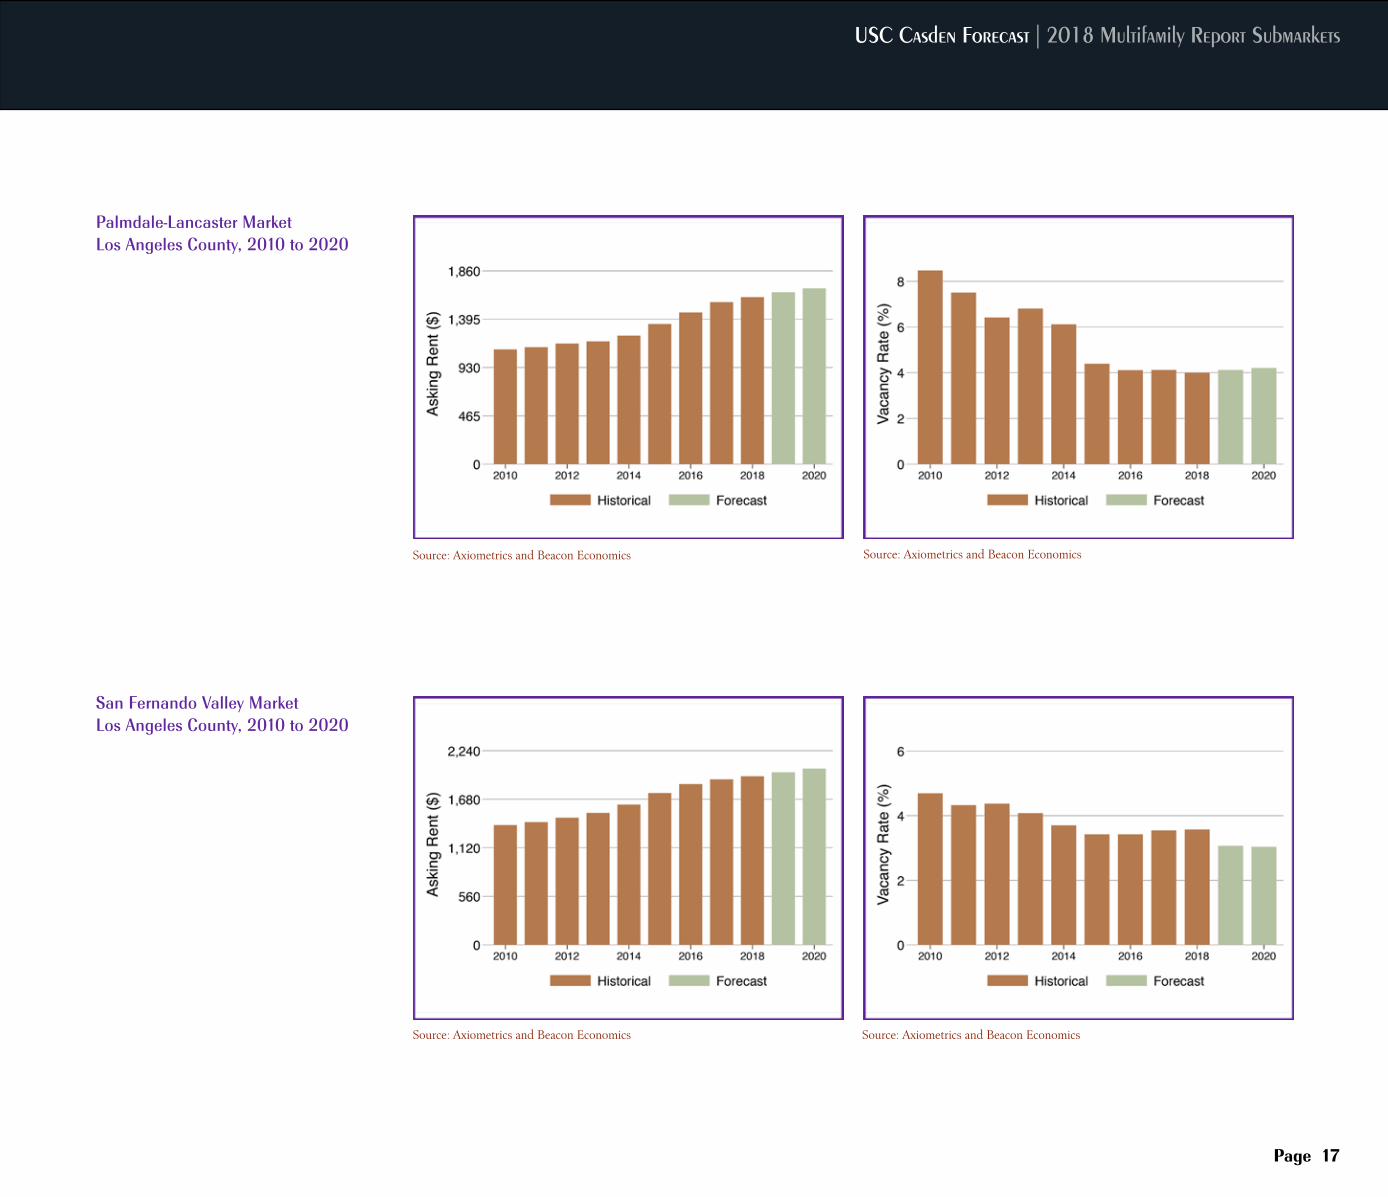
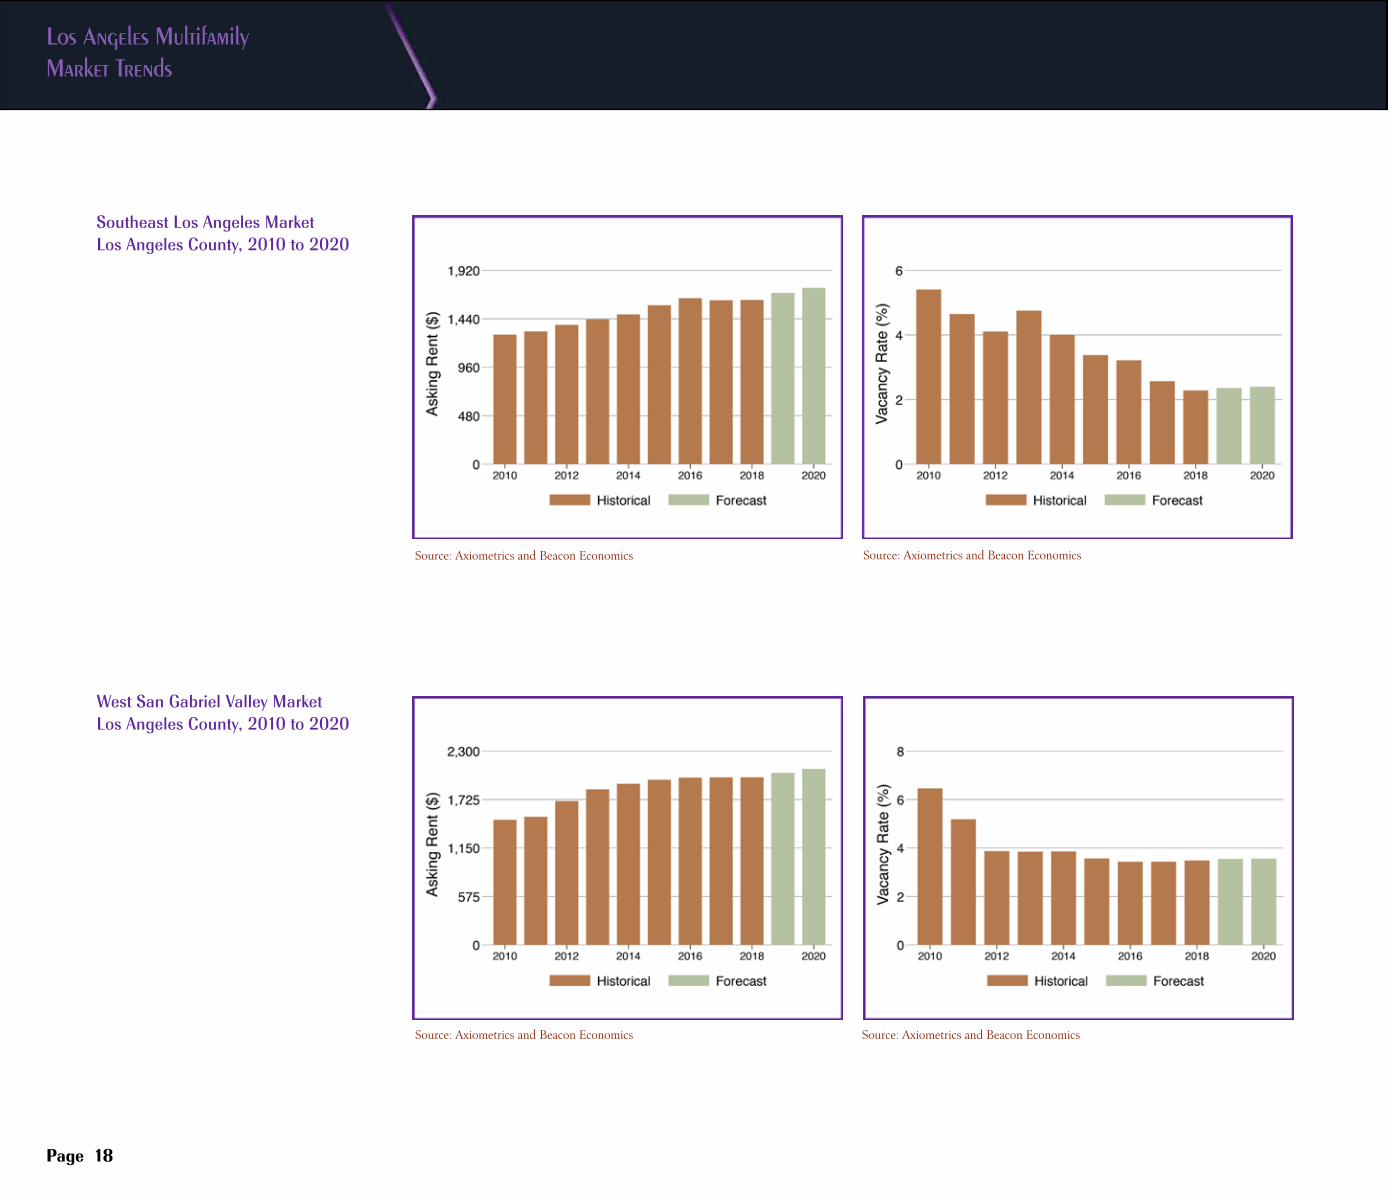
The Coastal Communities-Beverly Hills submarket led Los Angeles County with the highest monthly rent ($2,881), followed by Central Los Angeles ($2,656), Downtown ($2,390) and Burbank-Glendale ($2,350). The Palmdale-Lancaster submarket had the lowest rent among all the submarkets in Los Angeles County, at $1,608 per month, followed by Southeast Los Angeles at $1,627, and East San Gabriel Valley at $1,654. Four of the top five submarkets in all of Southern California were located in Los Angeles County, with the Coastal Communities-Beverly Hills submarket grabbing the top slot.
Overall, vacancy rates continue to be low enough to push up rents, a pattern that is very likely to continue. The county-wide vacancy rate rose slightly to 4.0% in 2018 from 3.9% a year before. Southeast Los Angeles has the lowest vacancy rate, at 2.3%, followed by Inglewood-Gardena-Hawthorne submarket, at 2.4%.
Low vacancy rates reflect inadequate construction. With limited new construction activity over the past several decades, the county’s housing stock is the oldest of the Southern California region, with 56.3% of the stock built before 1970 and just 7.6% built since 2000. Multifamily construction had an impressive gain in the first half of this year with 10,875 permits year-to-date through Q2 in 2018, up from 7,511 same time last year, and we expect this to continue. However, the county has consistently fallen short of its need for additional housing. As such, renters will continue to face rising rents and shortage in rental supply in Los Angeles County.
With a 44.8% increase in multifamily permits through the first half of 2018, Los Angeles County will see yet another much-needed gain in its multifamily housing stock. The homeownership rate will likely edge up again this year, bringing slight relief on the demand side of the rental market going forward, but it is not clear that the trend will continue into 2019. Taking these market conditions into consideration along with broad economic and market fundamentals, the countywide vacancy rate is expected to ease slightly in 2019, moving up a few notches from 4.0% to 4.3%. Even so, the average rent will advance, but by a modest 1.7% from $2,267 per month in 2018 to $2,305 in 2019.
1 The metro level figures cited here are based upon the 2017 American Community Survey and were extracted using the Census Bureau’s American Factfinder. They differ somewhat from figures in the metro table at the end of this section, which were derived from the American Community Survey Public Use Micro Sample (PUMS) and were the basis for household and housing stock figures at the submarket level.
USC Casden Forecast | 2018 Multifamily Report
Page 11
Los Angeles County Rents/Vacancy
Multifamily Permit Activity Los Angeles
Los-Angeles County Renter Household Statistics
Percent with Children 34.5%Average Household Size 2.63Median Household Income $42,550
Race (%)
White 30.3%Black 11.5%Asian 12.5%Hispanic (all races) 41.8%All Other Races 3.9%
Education (%)
Less than HS 22.1%HS Diploma 47.8%Bachelor’s Degree 20.4%Graduate Degree 9.8%Housing Burden/Share of Income 54.1%
Los Angeles County Rental Units By Size of Structure
Single Family (Detached & Attached) 27.3%2-4 Units 13.7%5-9 Units 13.8%10-19 Units 12.9%20 Units+ 32.2%
Los Angeles County Rental Units By Year Built
Before 1970 56.3%1970-1999 36.1%After 2000 7.6%
Source: Axiometrics and Beacon Economics
Source: Axiometrics and Beacon Economics
Source: Axiometrics and Beacon Economics
Source: Axiometrics and Beacon Economics
Page 12
Los Angeles Multifamily Market Trends
Source: Axiometrics and Beacon Economics
Source: Axiometrics and Beacon Economics
Source: Axiometrics and Beacon Economics
Source: Axiometrics and Beacon Economics
Page 13
USC Casden Forecast | 2018 Multifamily Report Submarkets
Burbank-Glendale MarketLos Angeles County, 2010 to 2020
Central-Los-Angeles MarketLos Angeles County, 2010 to 2020
Source: Axiometrics and Beacon Economics
Source: Axiometrics and Beacon Economics
Source: Axiometrics and Beacon Economics
Source: Axiometrics and Beacon Economics
Page 14
Los Angeles Multifamily Market Trends
Coastal Communities-Beverly Hills MarketLos Angeles County, 2010 to 2020
Downtown MarketLos Angeles County, 2010 to 2020
Source: Axiometrics and Beacon Economics
Source: Axiometrics and Beacon Economics
Source: Axiometrics and Beacon Economics
Source: Axiometrics and Beacon Economics
Page 15
USC Casden Forecast | 2018 Multifamily Report Submarkets
Inglewood-Gardena-Hawthorne MarketLos Angeles County, 2010 to 2020
East San Gabriel Valley MarketLos Angeles County, 2010 to 2020
Source: Axiometrics and Beacon Economics
Source: Axiometrics and Beacon Economics
Source: Axiometrics and Beacon Economics
Source: Axiometrics and Beacon Economics
Page 16
Los Angeles Multifamily Market Trends
Koreatown-Mid-City MarketLos Angeles County, 2010 to 2020
Long Beach-South Bay MarketLos Angeles County, 2010 to 2020
Source: Axiometrics and Beacon Economics
Source: Axiometrics and Beacon Economics
Source: Axiometrics and Beacon Economics
Source: Axiometrics and Beacon Economics
Page 17
USC Casden Forecast | 2018 Multifamily Report Submarkets
Palmdale-Lancaster MarketLos Angeles County, 2010 to 2020
San Fernando Valley MarketLos Angeles County, 2010 to 2020
Source: Axiometrics and Beacon Economics
Source: Axiometrics and Beacon Economics
Source: Axiometrics and Beacon Economics
Source: Axiometrics and Beacon Economics
Page 18
Los Angeles Multifamily Market Trends
Southeast Los Angeles MarketLos Angeles County, 2010 to 2020
West San Gabriel Valley MarketLos Angeles County, 2010 to 2020
Page 19
USC Casden Forecast | 2018 Multifamily Report
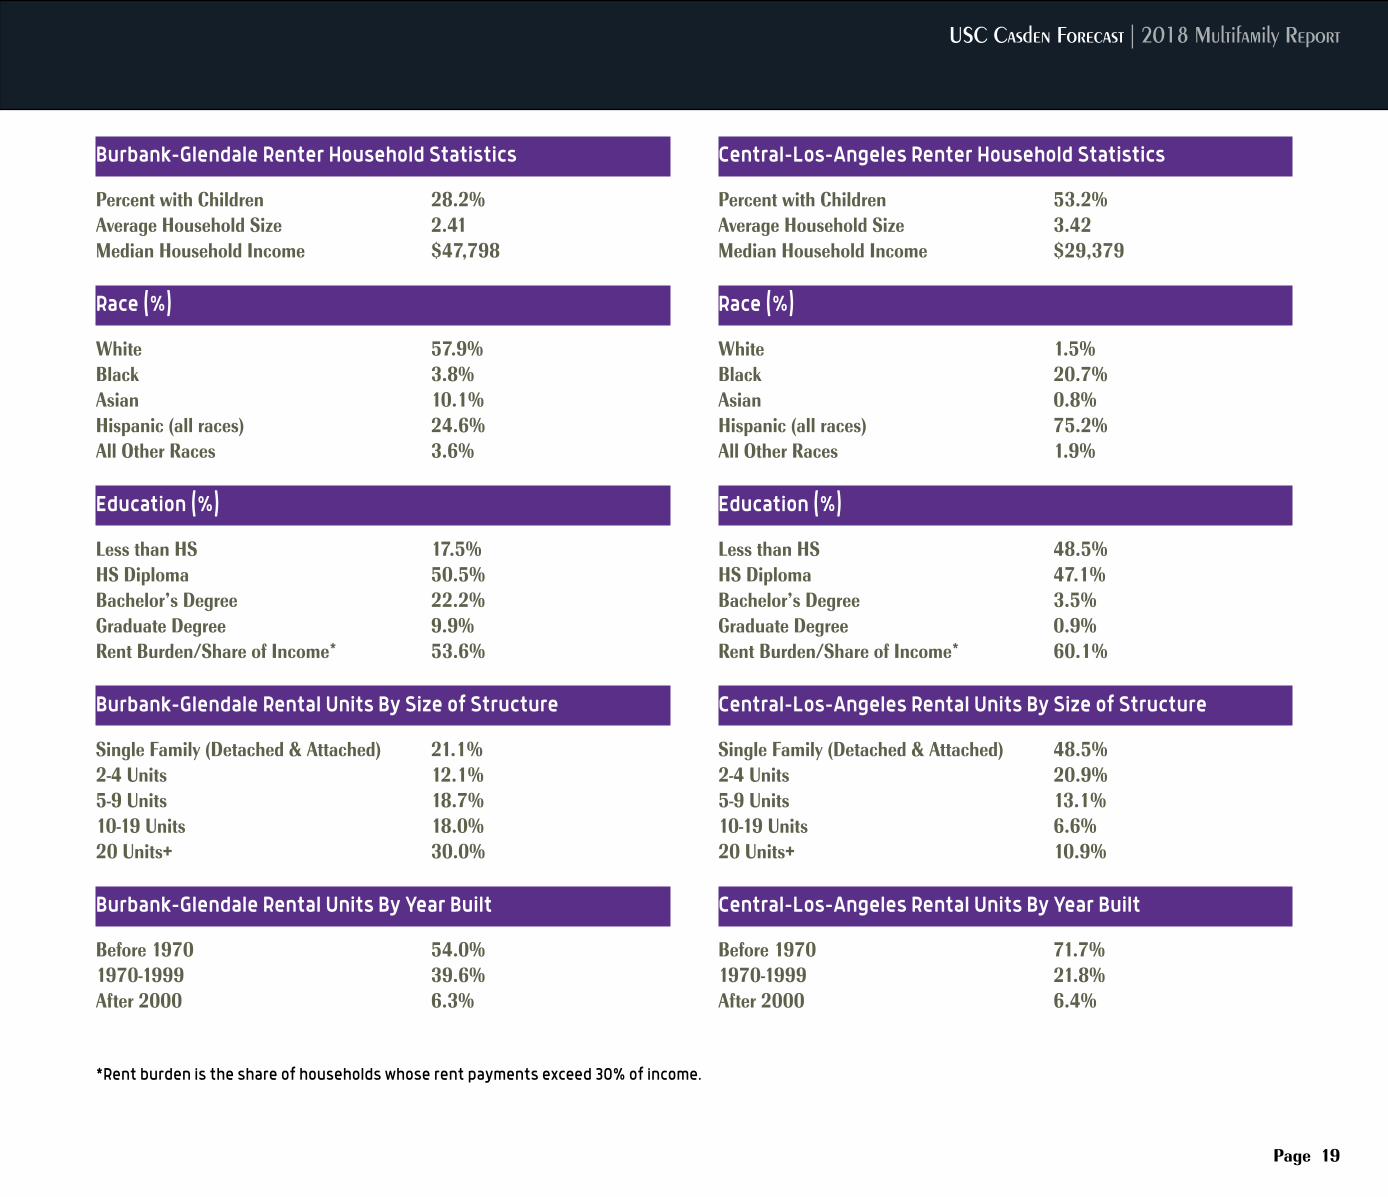
Burbank-Glendale Renter Household Statistics
Percent with Children 28.2%Average Household Size 2.41Median Household Income $47,798
Race (%)
White 57.9%Black 3.8%Asian 10.1%Hispanic (all races) 24.6%All Other Races 3.6%
Education (%)
Less than HS 17.5%HS Diploma 50.5%Bachelor’s Degree 22.2%Graduate Degree 9.9%Rent Burden/Share of Income* 53.6% Burbank-Glendale Rental Units By Size of Structure
Single Family (Detached & Attached) 21.1%2-4 Units 12.1%5-9 Units 18.7%10-19 Units 18.0%20 Units+ 30.0% Burbank-Glendale Rental Units By Year Built
Before 1970 54.0%1970-1999 39.6%After 2000 6.3%
Central-Los-Angeles Renter Household Statistics
Percent with Children 53.2%Average Household Size 3.42Median Household Income $29,379
Race (%)
White 1.5%Black 20.7%Asian 0.8%Hispanic (all races) 75.2%All Other Races 1.9%
Education (%)
Less than HS 48.5%HS Diploma 47.1%Bachelor’s Degree 3.5%Graduate Degree 0.9%Rent Burden/Share of Income* 60.1% Central-Los-Angeles Rental Units By Size of Structure
Single Family (Detached & Attached) 48.5%2-4 Units 20.9%5-9 Units 13.1%10-19 Units 6.6%20 Units+ 10.9% Central-Los-Angeles Rental Units By Year Built
Before 1970 71.7%1970-1999 21.8%After 2000 6.4%
*Rent burden is the share of households whose rent payments exceed 30% of income.
Los Angeles Multifamily Market Trends
Page 20
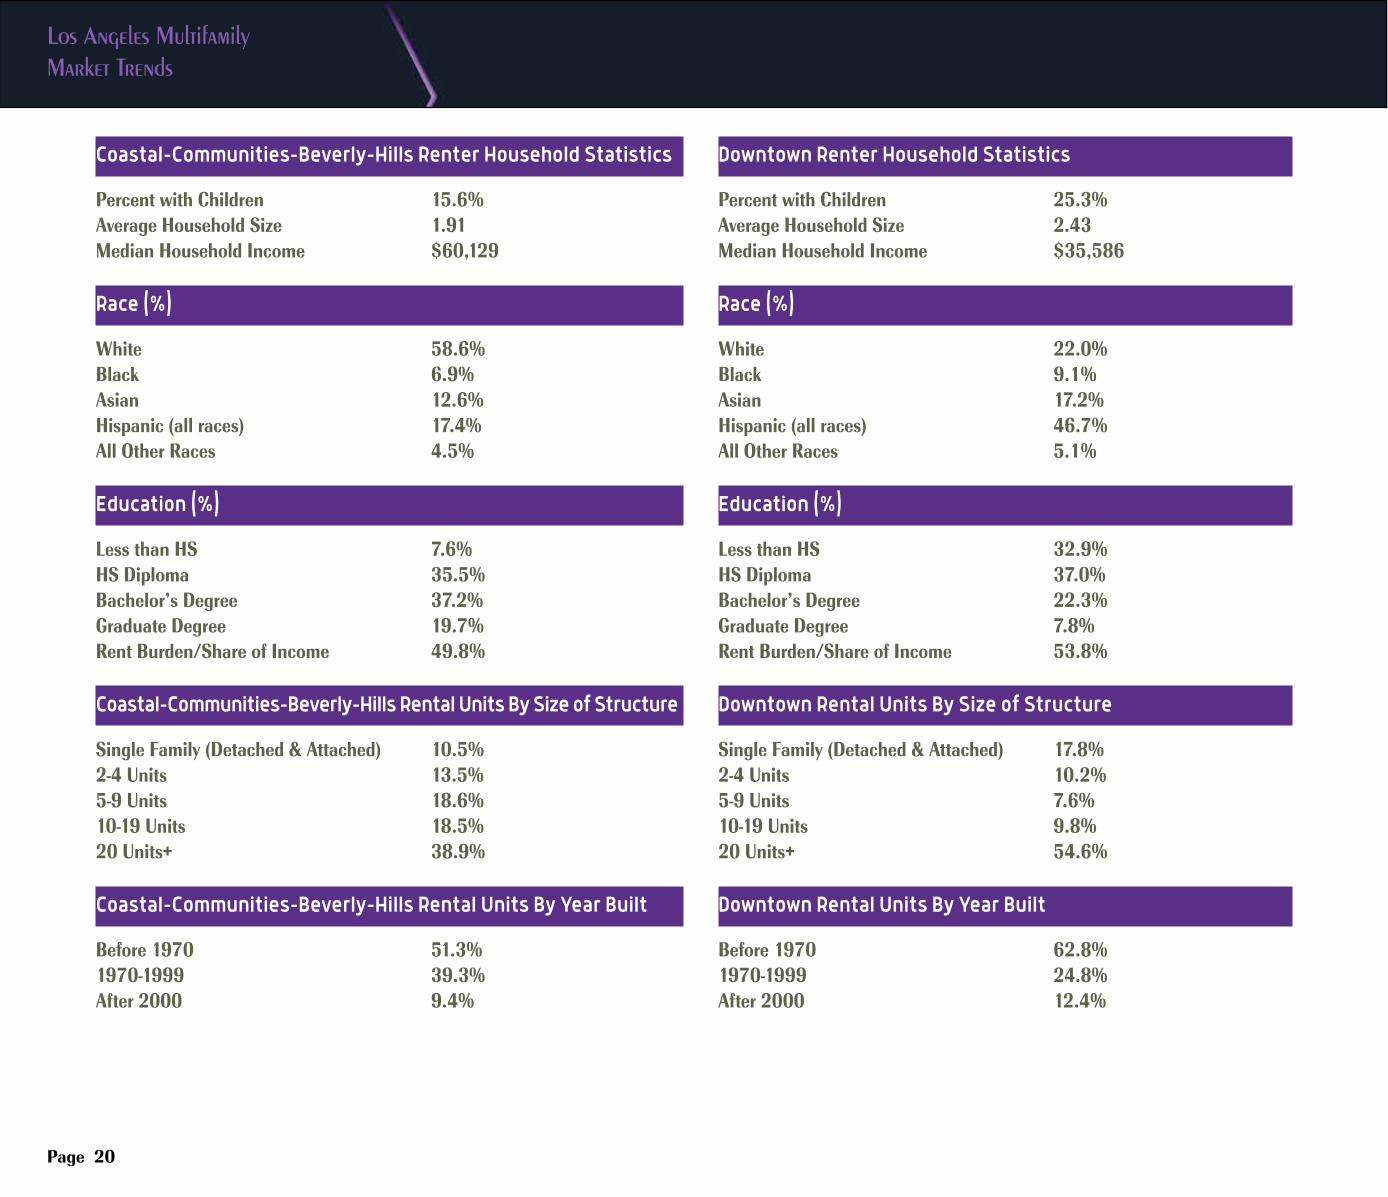
Downtown Renter Household Statistics
Percent with Children 25.3%Average Household Size 2.43Median Household Income $35,586
Race (%)
White 22.0%Black 9.1%Asian 17.2%Hispanic (all races) 46.7%All Other Races 5.1%
Education (%)
Less than HS 32.9%HS Diploma 37.0%Bachelor’s Degree 22.3%Graduate Degree 7.8%Rent Burden/Share of Income 53.8% Downtown Rental Units By Size of Structure
Single Family (Detached & Attached) 17.8%2-4 Units 10.2%5-9 Units 7.6%10-19 Units 9.8%20 Units+ 54.6% Downtown Rental Units By Year Built
Before 1970 62.8%1970-1999 24.8%After 2000 12.4%
Coastal-Communities-Beverly-Hills Renter Household Statistics
Percent with Children 15.6%Average Household Size 1.91Median Household Income $60,129
Race (%)
White 58.6%Black 6.9%Asian 12.6%Hispanic (all races) 17.4%All Other Races 4.5%
Education (%)
Less than HS 7.6%HS Diploma 35.5%Bachelor’s Degree 37.2%Graduate Degree 19.7%Rent Burden/Share of Income 49.8%
Coastal-Communities-Beverly-Hills Rental Units By Size of Structure
Single Family (Detached & Attached) 10.5%2-4 Units 13.5%5-9 Units 18.6%10-19 Units 18.5%20 Units+ 38.9%
Coastal-Communities-Beverly-Hills Rental Units By Year Built
Before 1970 51.3%1970-1999 39.3%After 2000 9.4%
USC Casden Forecast | 2018 Multifamily Report
Page 21
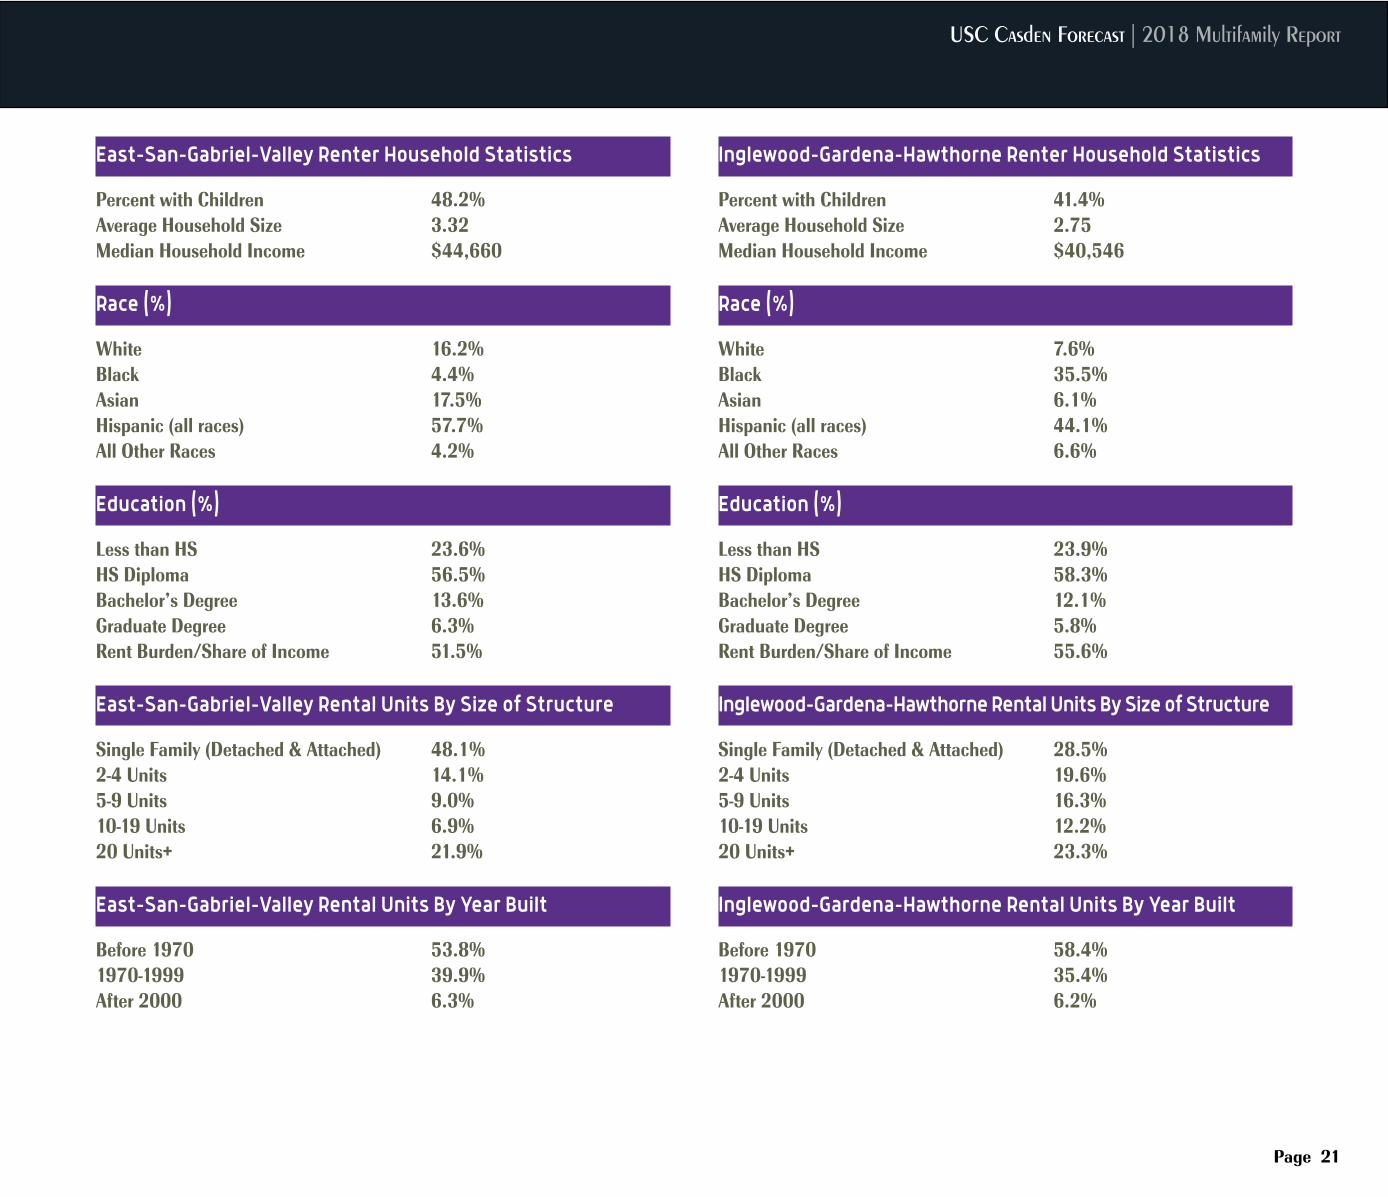
East-San-Gabriel-Valley Renter Household Statistics
Percent with Children 48.2%Average Household Size 3.32Median Household Income $44,660
Race (%)
White 16.2%Black 4.4%Asian 17.5%Hispanic (all races) 57.7%All Other Races 4.2%
Education (%)
Less than HS 23.6%HS Diploma 56.5%Bachelor’s Degree 13.6%Graduate Degree 6.3%Rent Burden/Share of Income 51.5% East-San-Gabriel-Valley Rental Units By Size of Structure
Single Family (Detached & Attached) 48.1%2-4 Units 14.1%5-9 Units 9.0%10-19 Units 6.9%20 Units+ 21.9% East-San-Gabriel-Valley Rental Units By Year Built
Before 1970 53.8%1970-1999 39.9%After 2000 6.3%
Inglewood-Gardena-Hawthorne Renter Household Statistics
Percent with Children 41.4%Average Household Size 2.75Median Household Income $40,546
Race (%)
White 7.6%Black 35.5%Asian 6.1%Hispanic (all races) 44.1%All Other Races 6.6%
Education (%)
Less than HS 23.9%HS Diploma 58.3%Bachelor’s Degree 12.1%Graduate Degree 5.8%Rent Burden/Share of Income 55.6% Inglewood-Gardena-Hawthorne Rental Units By Size of Structure
Single Family (Detached & Attached) 28.5%2-4 Units 19.6%5-9 Units 16.3%10-19 Units 12.2%20 Units+ 23.3% Inglewood-Gardena-Hawthorne Rental Units By Year Built
Before 1970 58.4%1970-1999 35.4%After 2000 6.2%
Los Angeles Multifamily Market Trends
Page 22
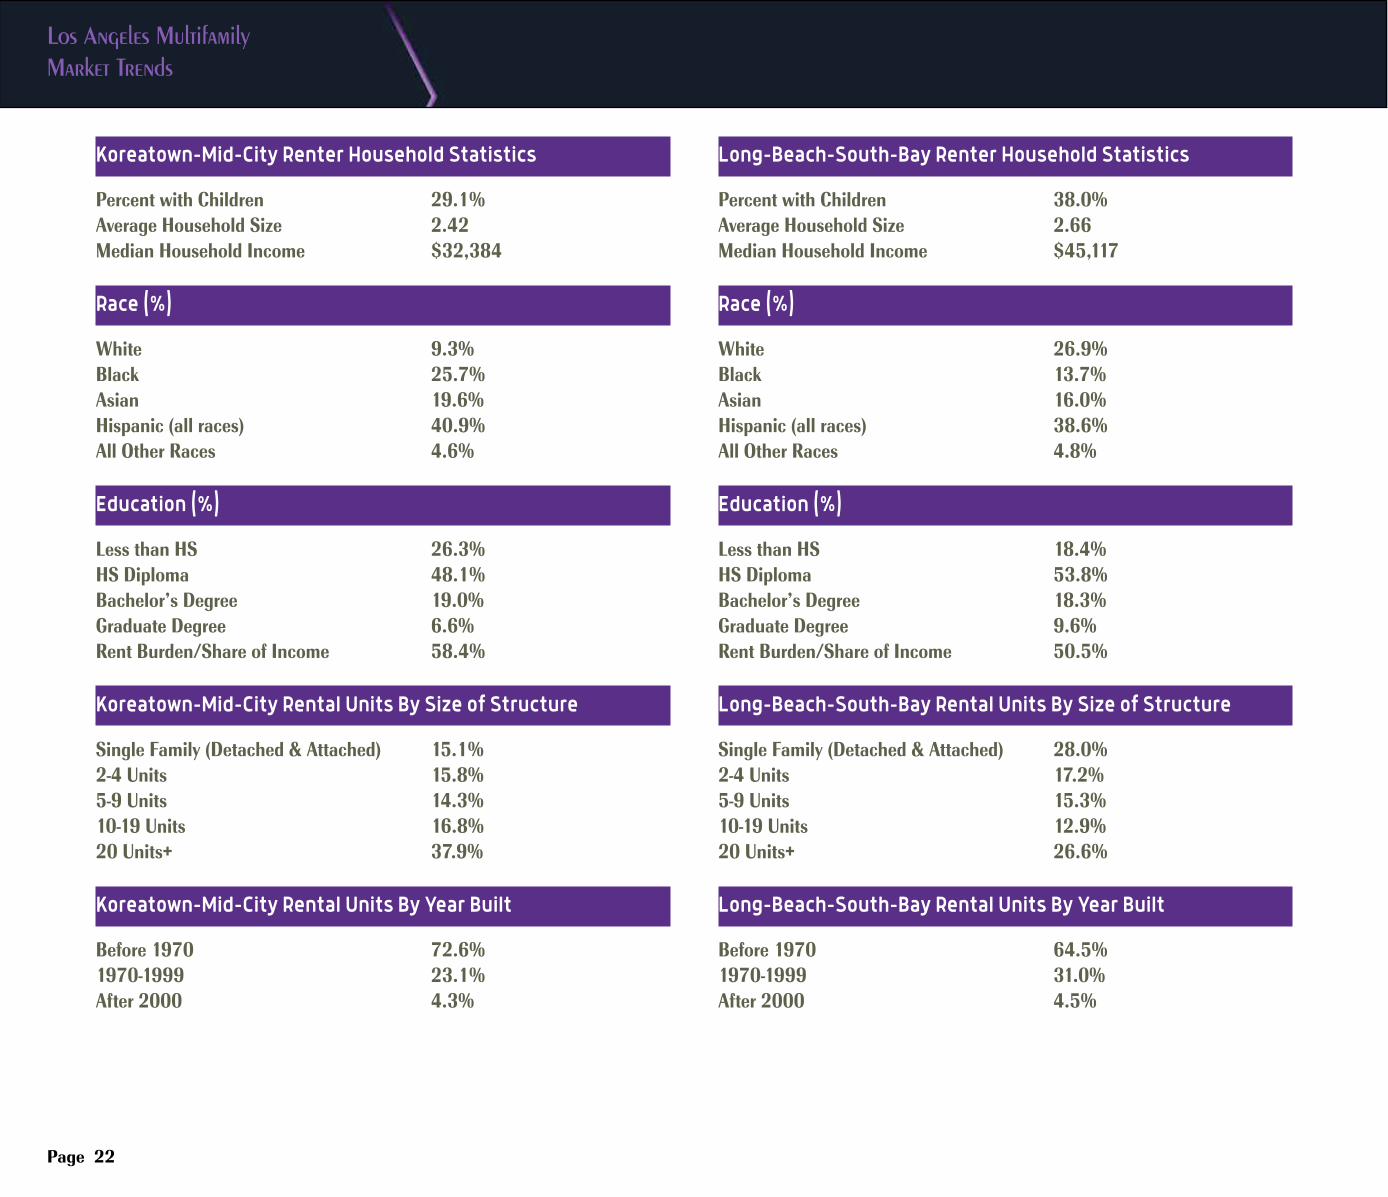
Koreatown-Mid-City Renter Household Statistics
Percent with Children 29.1%Average Household Size 2.42Median Household Income $32,384
Race (%)
White 9.3%Black 25.7%Asian 19.6%Hispanic (all races) 40.9%All Other Races 4.6%
Education (%)
Less than HS 26.3%HS Diploma 48.1%Bachelor’s Degree 19.0%Graduate Degree 6.6%Rent Burden/Share of Income 58.4% Koreatown-Mid-City Rental Units By Size of Structure
Single Family (Detached & Attached) 15.1%2-4 Units 15.8%5-9 Units 14.3%10-19 Units 16.8%20 Units+ 37.9% Koreatown-Mid-City Rental Units By Year Built
Before 1970 72.6%1970-1999 23.1%After 2000 4.3%
Long-Beach-South-Bay Renter Household Statistics
Percent with Children 38.0%Average Household Size 2.66Median Household Income $45,117
Race (%)
White 26.9%Black 13.7%Asian 16.0%Hispanic (all races) 38.6%All Other Races 4.8%
Education (%)
Less than HS 18.4%HS Diploma 53.8%Bachelor’s Degree 18.3%Graduate Degree 9.6%Rent Burden/Share of Income 50.5% Long-Beach-South-Bay Rental Units By Size of Structure
Single Family (Detached & Attached) 28.0%2-4 Units 17.2%5-9 Units 15.3%10-19 Units 12.9%20 Units+ 26.6% Long-Beach-South-Bay Rental Units By Year Built
Before 1970 64.5%1970-1999 31.0%After 2000 4.5%
USC Casden Forecast | 2018 Multifamily Report
Page 23
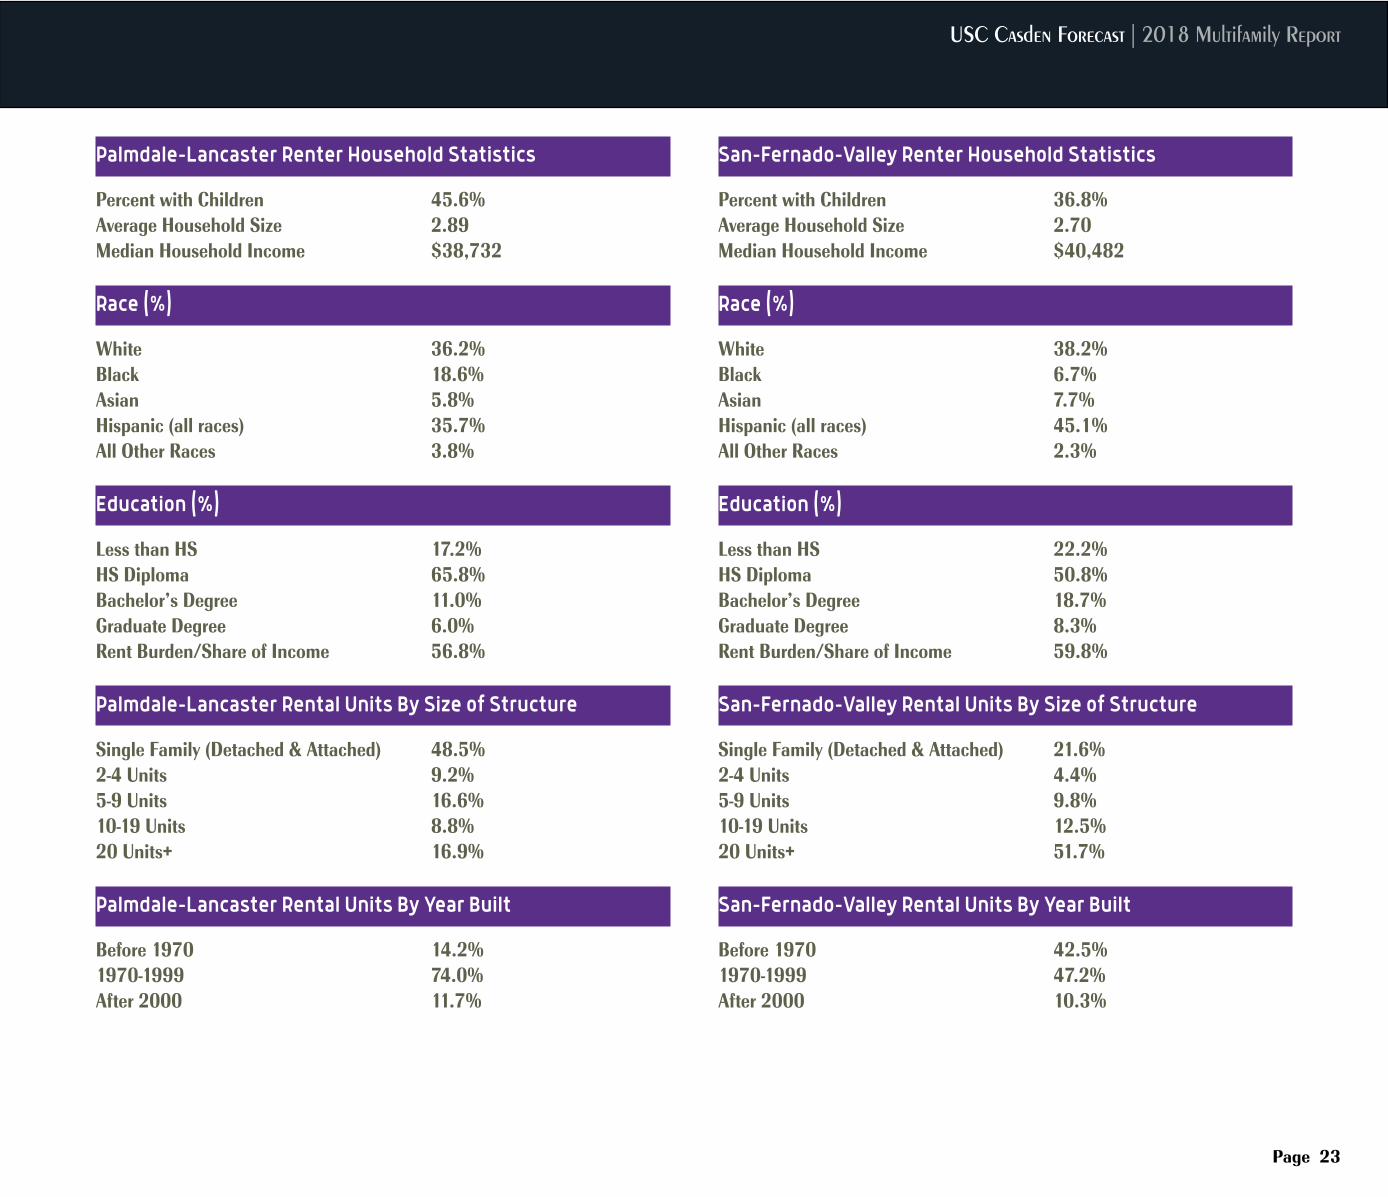
Palmdale-Lancaster Renter Household Statistics
Percent with Children 45.6%Average Household Size 2.89Median Household Income $38,732
Race (%)
White 36.2%Black 18.6%Asian 5.8%Hispanic (all races) 35.7%All Other Races 3.8%
Education (%)
Less than HS 17.2%HS Diploma 65.8%Bachelor’s Degree 11.0%Graduate Degree 6.0%Rent Burden/Share of Income 56.8% Palmdale-Lancaster Rental Units By Size of Structure
Single Family (Detached & Attached) 48.5%2-4 Units 9.2%5-9 Units 16.6%10-19 Units 8.8%20 Units+ 16.9% Palmdale-Lancaster Rental Units By Year Built
Before 1970 14.2%1970-1999 74.0%After 2000 11.7%
San-Fernado-Valley Renter Household Statistics
Percent with Children 36.8%Average Household Size 2.70Median Household Income $40,482
Race (%)
White 38.2%Black 6.7%Asian 7.7%Hispanic (all races) 45.1%All Other Races 2.3%
Education (%)
Less than HS 22.2%HS Diploma 50.8%Bachelor’s Degree 18.7%Graduate Degree 8.3%Rent Burden/Share of Income 59.8% San-Fernado-Valley Rental Units By Size of Structure
Single Family (Detached & Attached) 21.6%2-4 Units 4.4%5-9 Units 9.8%10-19 Units 12.5%20 Units+ 51.7% San-Fernado-Valley Rental Units By Year Built
Before 1970 42.5%1970-1999 47.2%After 2000 10.3%
Los Angeles Multifamily Market Trends
Page 24
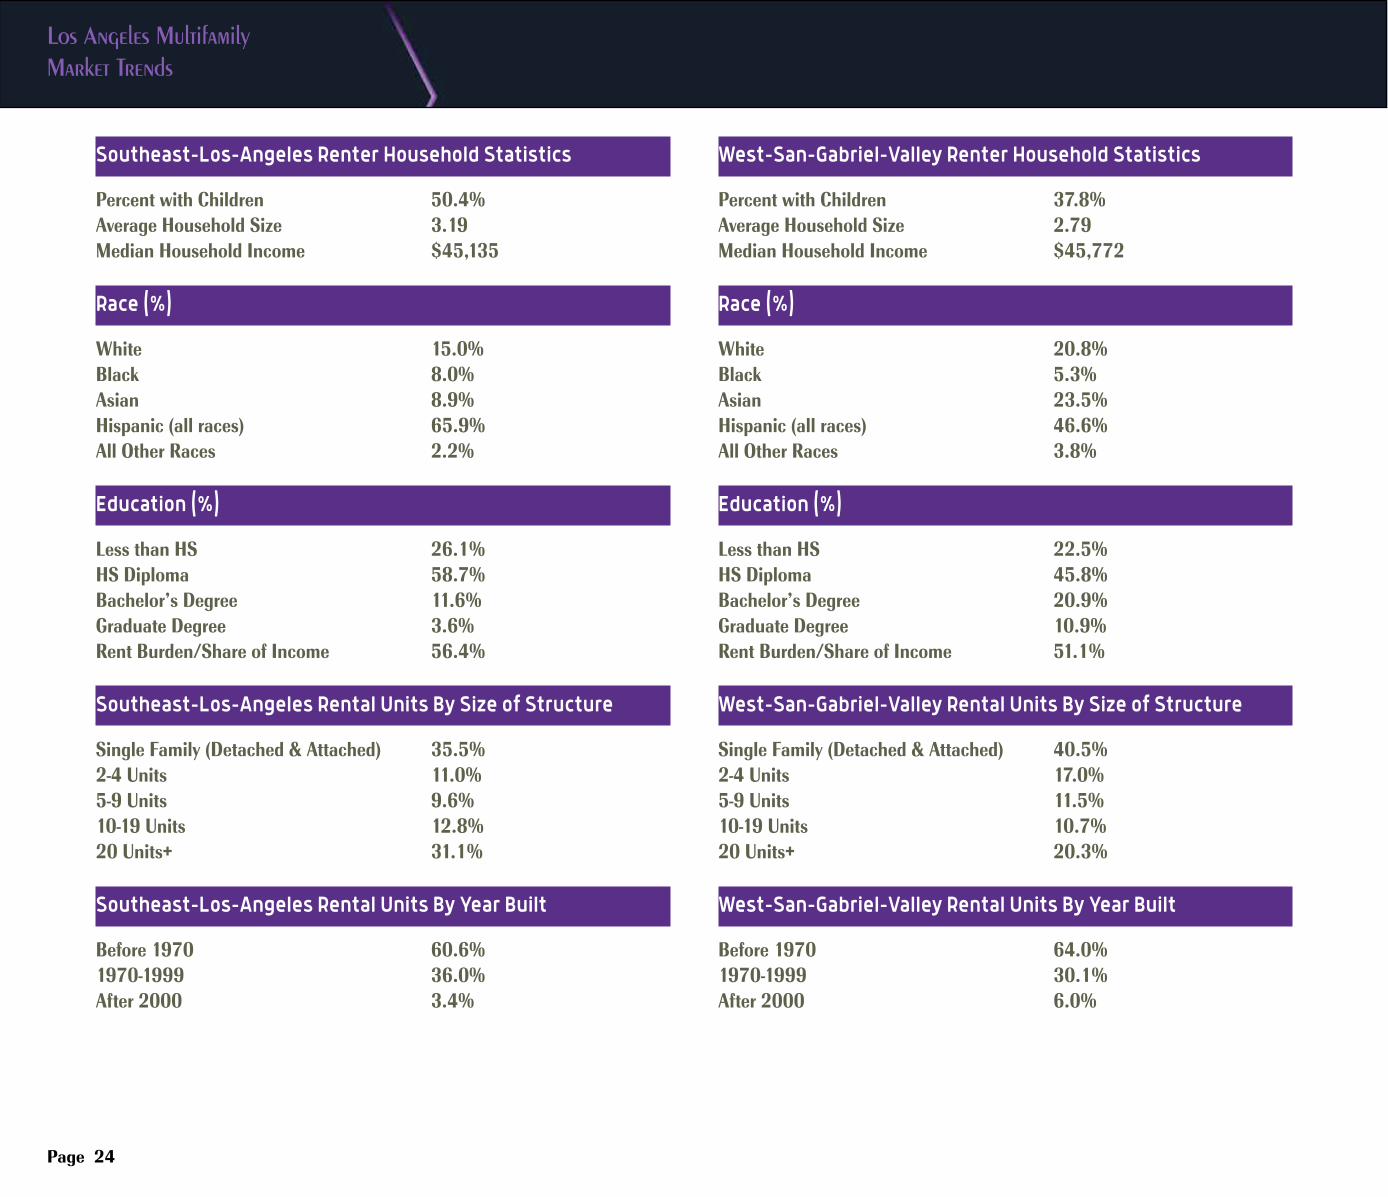
Southeast-Los-Angeles Renter Household Statistics
Percent with Children 50.4%Average Household Size 3.19Median Household Income $45,135
Race (%)
White 15.0%Black 8.0%Asian 8.9%Hispanic (all races) 65.9%All Other Races 2.2%
Education (%)
Less than HS 26.1%HS Diploma 58.7%Bachelor’s Degree 11.6%Graduate Degree 3.6%Rent Burden/Share of Income 56.4% Southeast-Los-Angeles Rental Units By Size of Structure
Single Family (Detached & Attached) 35.5%2-4 Units 11.0%5-9 Units 9.6%10-19 Units 12.8%20 Units+ 31.1% Southeast-Los-Angeles Rental Units By Year Built
Before 1970 60.6%1970-1999 36.0%After 2000 3.4%
West-San-Gabriel-Valley Renter Household Statistics
Percent with Children 37.8%Average Household Size 2.79Median Household Income $45,772
Race (%)
White 20.8%Black 5.3%Asian 23.5%Hispanic (all races) 46.6%All Other Races 3.8%
Education (%)
Less than HS 22.5%HS Diploma 45.8%Bachelor’s Degree 20.9%Graduate Degree 10.9%Rent Burden/Share of Income 51.1% West-San-Gabriel-Valley Rental Units By Size of Structure
Single Family (Detached & Attached) 40.5%2-4 Units 17.0%5-9 Units 11.5%10-19 Units 10.7%20 Units+ 20.3% West-San-Gabriel-Valley Rental Units By Year Built
Before 1970 64.0%1970-1999 30.1%After 2000 6.0%
USC Casden Forecast | 2018 Multifamily Report
Page 25
Orange County Multifamily Market Trends
Page 26
AS one of the top performing economies in Southern California, Orange County led other parts of the region early in the current expansion, but growth has slowed as it has reached full employment in recent years.
The county unemployment rate decreased from 3.5% in July 2017 to just 2.8% in July 2018, well below the state rate of 4.2% and the national rate of 3.9%. Given the constrained labor market, the pace of job growth has slowed considerably, to 1.1% year-to-year in July 2018 from 2.1% a year ago. In absolute terms, the largest job gains occurred in Administrative Support, Health Care, and Leisure and Hospitality. Education Services led all industries in percentage gains with a 6.3% year-over-year increase, followed by Administrative Support (5.8%) and Health Care (3.7%). The Financial Activities sector had the largest job loss (down 2.5%), mainly due to declines in Finance and Insurance. Going forward, overall job growth will be muted, as the county navigates the tightest labor market in nearly 20 years. In the absence of substantial in-migration, or more commuters from the Inland Empire, there simply won’t be people for employers in Orange County – or for that matter, all of Southern California -- to hire.
The homeownership rate in Orange County has historically been higher than in nearby Los Angeles County and San Diego County. However, the share of renter households increased from 2005 to 2015, following the broader trend across Southern California. By 2016, renters made up 43.4% of all households, unchanged from 2015 and 5.3% higher than in 2005. However, their share fell to 42.6% in 2017. Accordingly, the homeownership rate increased 0.8% to a 57.4% in 2017, consistent with income and economic growth in the region.
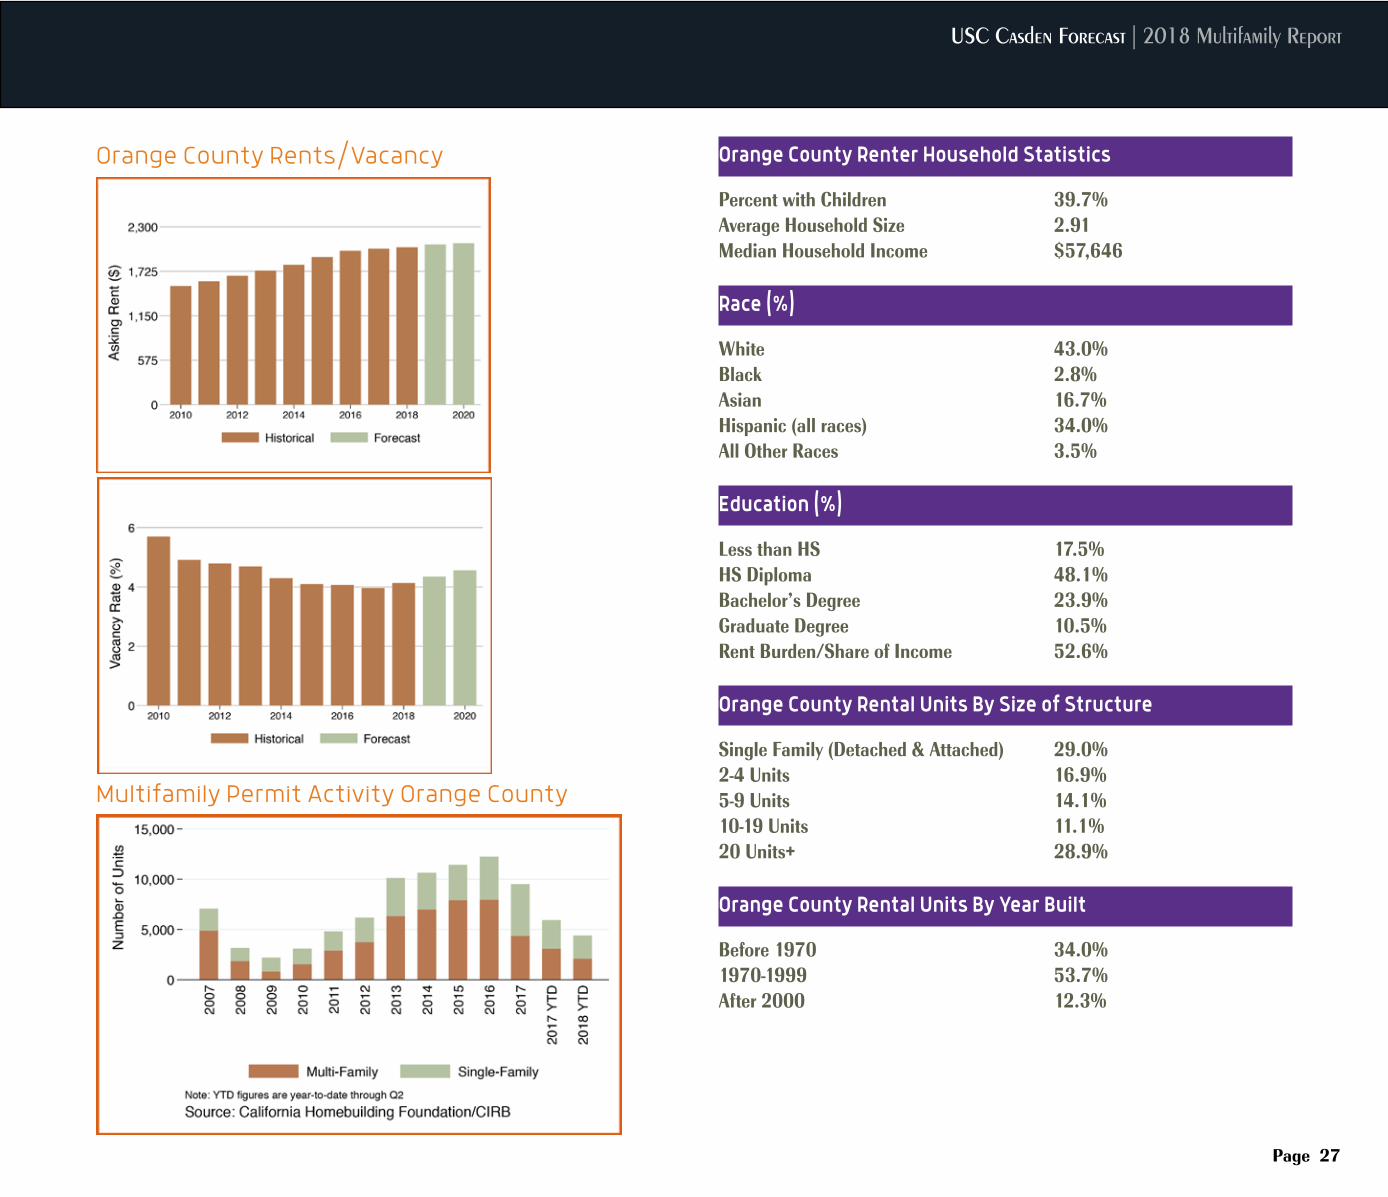
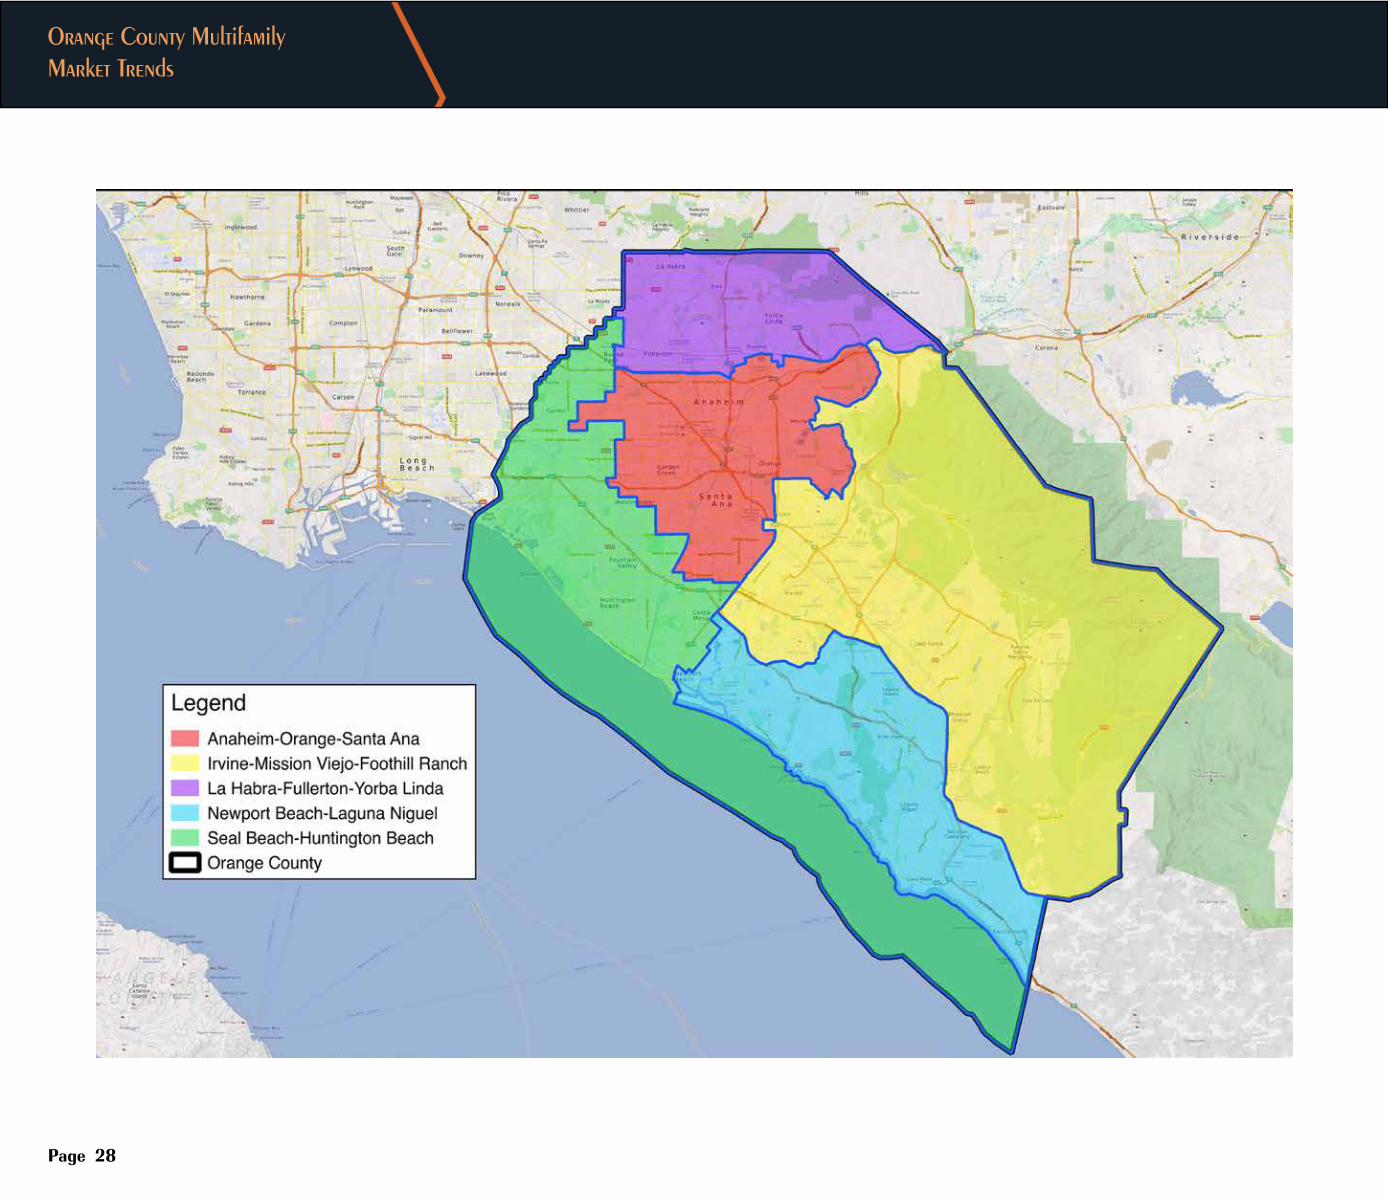
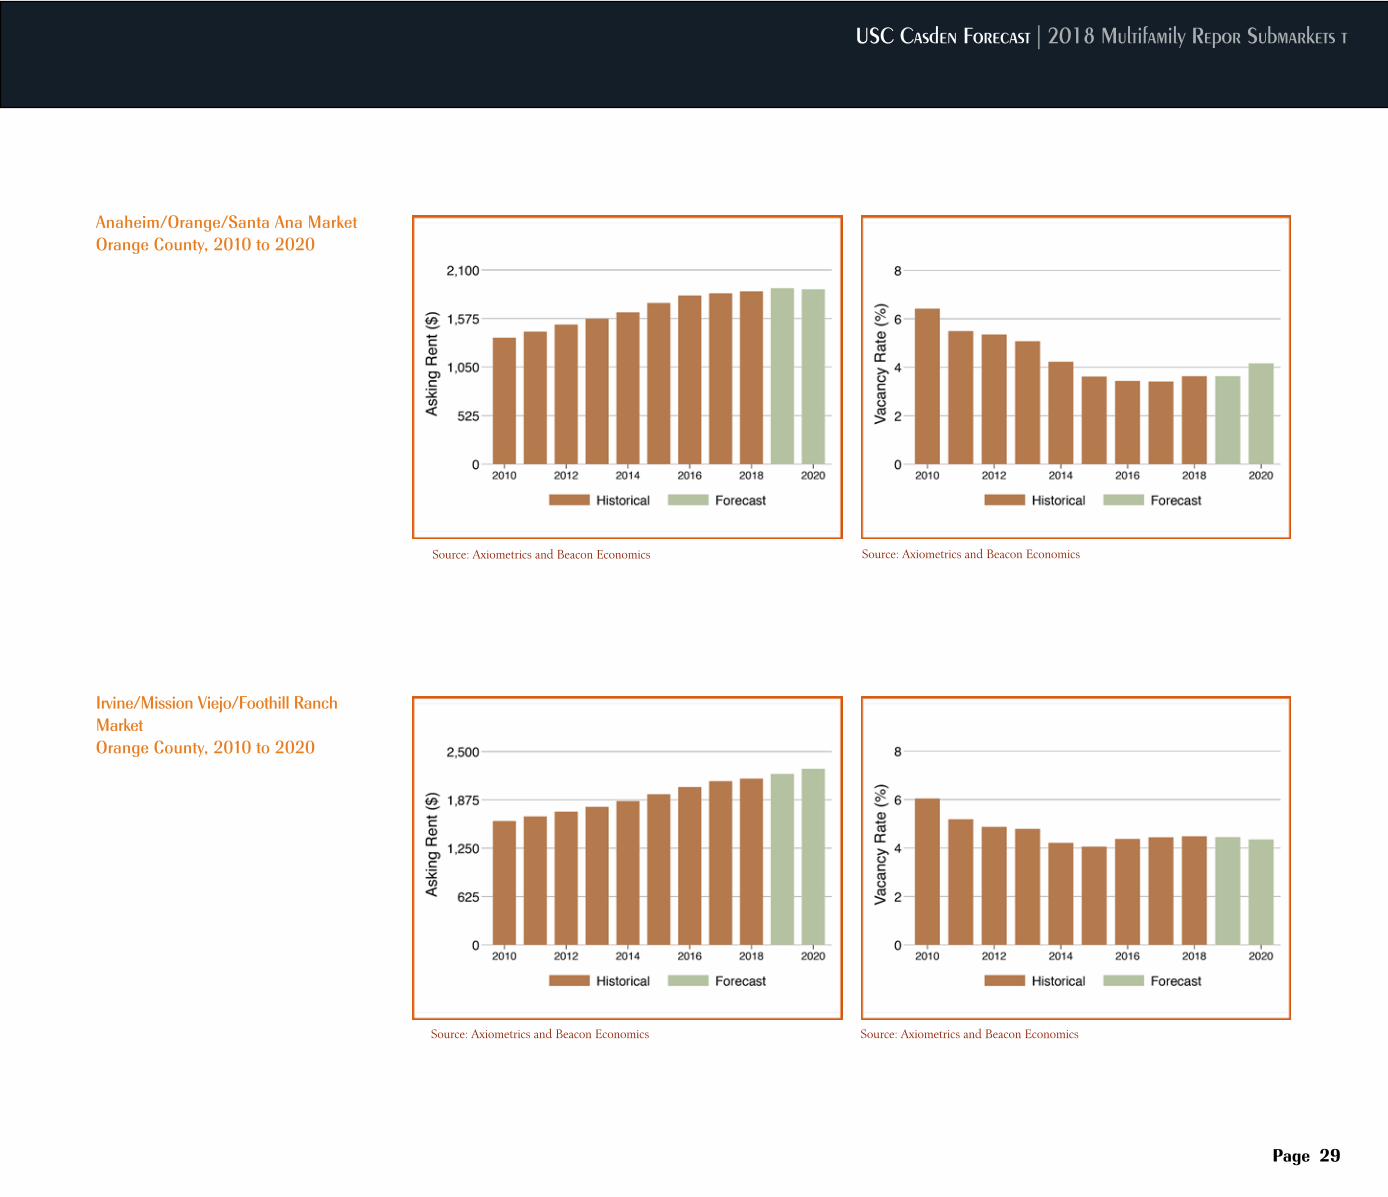
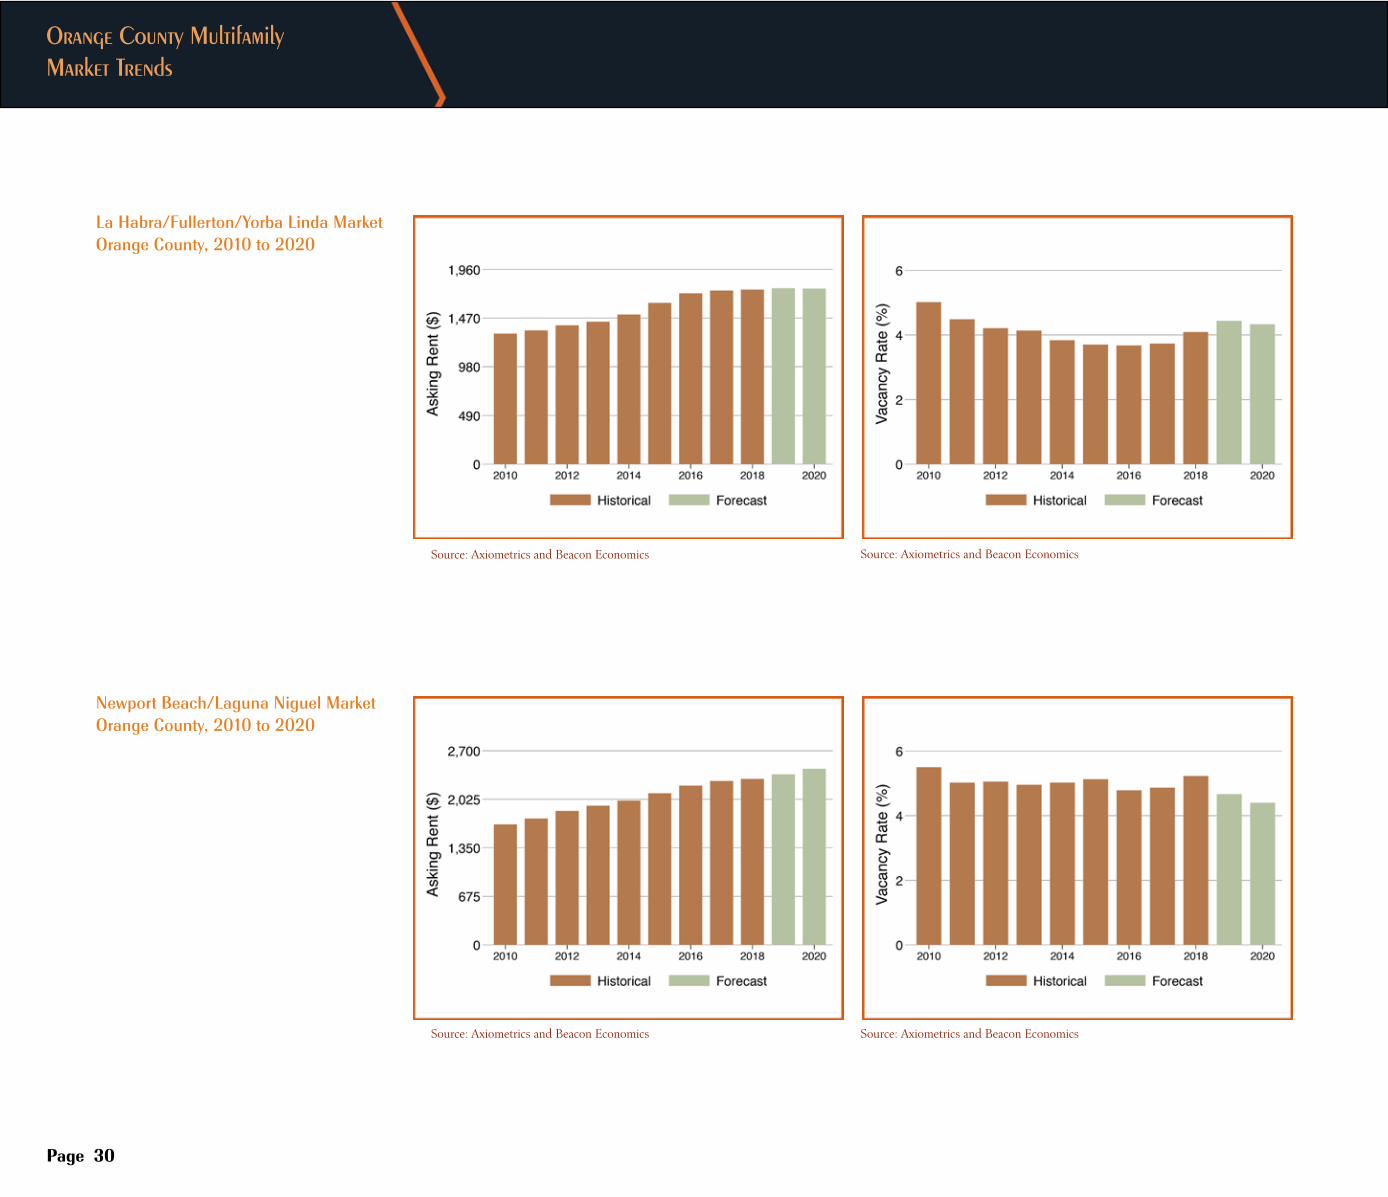
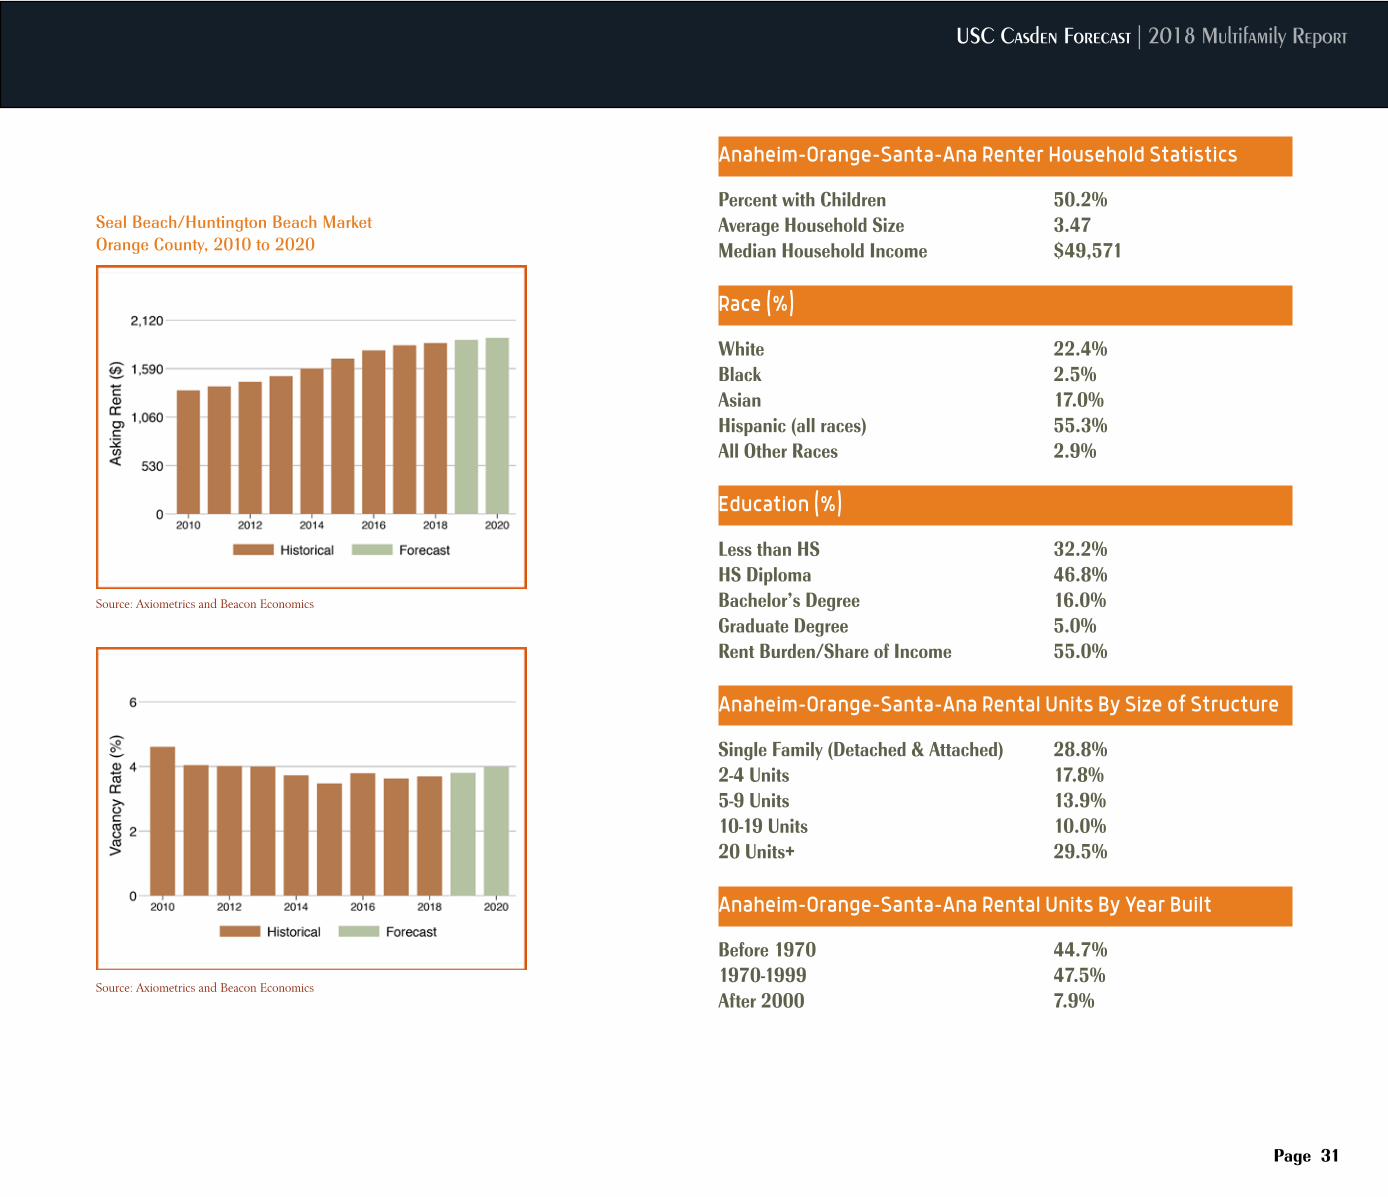
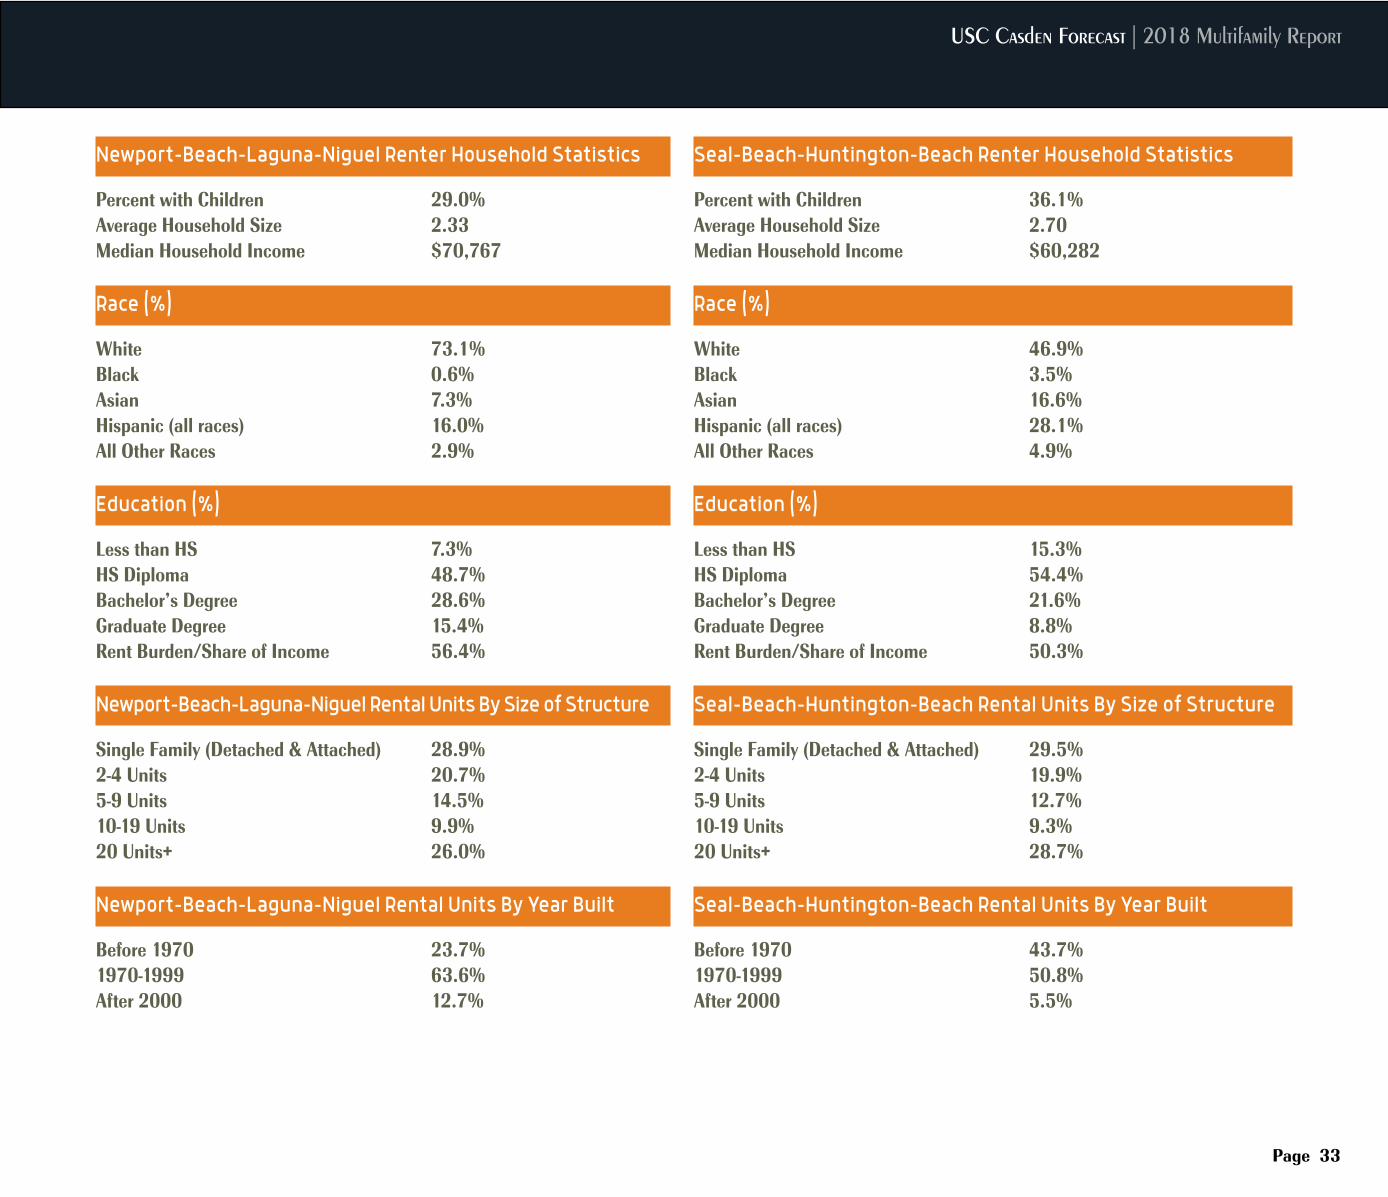
Monthly effective rent for Orange County averaged $2,035 in the second quarter of 2018. At the submarket level, the Newport-Beach Laguna-Niguel submarket has the highest effective rent in 2018 ($2,308 per month), followed by Irvine-Mission Viejo-Foothill Ranch ($2,151 per month) and Seal Beach Huntington Beach ($1,871 per month). Rent was lowest in La Habra-Fullerton-Yorba Linda, at $1,756 per month, followed by Anaheim-Orange-Santa Ana at $1,869 per month. Irvine-Mission Viejo-Foothill Ranch and Seal Beach Huntington Beach saw the fastest growth in rents, at 1.61% and 1.41% respectively. Across all the Southern California submarkets, the Newport-Beach Laguna-Niguel submarket had the fifth highest effective rent.
In 2017, median household income for renters was $61,503, up from $58,669 in 2016. The median household income for owners was $110,9521, up from $108,185. Income for renter households increased at an annual rate of 4.8%, outpacing the income gains of owner households which increased by 2.6%. Despite significant increases in renter incomes over the past 10 years, the income gap between renters and owners has persisted. Finally, the county’s share of rent burdened households, for whom more than 30% of their income goes to rent, stood at 57.7% in 2017, approximately the same as in other parts of Southern California.
Vacancy rates increased slightly in all Orange County submarkets in 2018, with the metro vacancy rate edging up from 4.0% last year to 4.1%. Orange County has the highest vacancy rate of all the Southern California metro markets, due in part to several years of elevated multifamily construction levels. Among all the submarkets in Orange County, the Anaheim-Orange-Santa Ana submarket has the lowest vacancy rate, at 3.6%, followed by Seal-Beach Huntington Beach, at 3.7%. The vacancy rate in the La Habra-Fullerton-Yorba Linda submarket increased by the largest margin in 2018, up 0.4 percentage points from 3.7% last year to 4.1%. As the submarket with the highest rent in Orange County, Newport Beach-Laguna Niguel has the highest vacancy rate (5.2%) compared to all Southern California submarkets in this report. Irvine-Mission Viejo-Foothill Ranch, was tied for third with Downtown Los Angeles and Simi Valley (Ventura County) among the submarkets with a vacancy rate of 4.5%. This is still sufficiently low vacancy for rents to increase, if mildly.
Rent increases in Orange County and its submarkets have been tempered over the past couple of years, in part because of the surge in multifamily construction that has occurred since the Great Recession, especially over the past 5 years. Multifamily permit activity increased nearly tenfold from 824 units during the depths for the Great Recession in 2009 to 7,964 units in 2016. However, between 2016 and 2017, the number of new multifamily building permits issued fell by 45%. The slowdown in new construction continued into 2018, with just 2,084 multifamily permits in the first half of this year, a 32.6% decrease from the same period last year.
With population growth and income gains continuing and the pace of construction slowing, the market will continue to be tight and rents will trend upward. The vacancy rate for Orange will move up marginally from 4.1% this year to 4.3% in 2019, and countywide average rent will increase at a somewhat faster pace with a 1.8% increase from $2,035 per month in 2018 to $2,071 in the coming year.
1 The metro level figures cited here are based upon the 2017 American Community Survey and were extracted using the Census Bureau’s American Factfinder. They differ somewhat from figures in the metro table at the end of this section, which were derived from the American Community Survey Public Use Micro Sample (PUMS) and were the basis for household and housing stock figures at the submarket leve
USC Casden Forecast | 2018 Multifamily Report
Page 27
Orange County Rents/Vacancy
Multifamily Permit Activity Orange County
Orange County Renter Household Statistics
Percent with Children 39.7%Average Household Size 2.91Median Household Income $57,646
Race (%)
White 43.0%Black 2.8%Asian 16.7%Hispanic (all races) 34.0%All Other Races 3.5%
Education (%)
Less than HS 17.5%HS Diploma 48.1%Bachelor’s Degree 23.9%Graduate Degree 10.5%Rent Burden/Share of Income 52.6%
Orange County Rental Units By Size of Structure
Single Family (Detached & Attached) 29.0%2-4 Units 16.9%5-9 Units 14.1%10-19 Units 11.1%20 Units+ 28.9%
Orange County Rental Units By Year Built
Before 1970 34.0%1970-1999 53.7%After 2000 12.3%
Orange County Multifamily Market Trends
Page 28
USC Casden Forecast | 2018 Multifamily Repor Submarkets t
Source: Axiometrics and Beacon Economics
Source: Axiometrics and Beacon Economics
Source: Axiometrics and Beacon Economics
Source: Axiometrics and Beacon Economics
Page 29
Anaheim/Orange/Santa Ana MarketOrange County, 2010 to 2020
Irvine/Mission Viejo/Foothill Ranch MarketOrange County, 2010 to 2020
Orange County Multifamily Market Trends
Source: Axiometrics and Beacon Economics
Source: Axiometrics and Beacon Economics
Source: Axiometrics and Beacon Economics
Source: Axiometrics and Beacon Economics
Page 30
La Habra/Fullerton/Yorba Linda MarketOrange County, 2010 to 2020
Newport Beach/Laguna Niguel MarketOrange County, 2010 to 2020
USC Casden Forecast | 2018 Multifamily Report
Source: Axiometrics and Beacon Economics
Source: Axiometrics and Beacon Economics
Page 31
Seal Beach/Huntington Beach MarketOrange County, 2010 to 2020
Anaheim-Orange-Santa-Ana Renter Household Statistics
Percent with Children 50.2%Average Household Size 3.47Median Household Income $49,571
Race (%)
White 22.4%Black 2.5%Asian 17.0%Hispanic (all races) 55.3%All Other Races 2.9%
Education (%)
Less than HS 32.2%HS Diploma 46.8%Bachelor’s Degree 16.0%Graduate Degree 5.0%Rent Burden/Share of Income 55.0%
Anaheim-Orange-Santa-Ana Rental Units By Size of Structure
Single Family (Detached & Attached) 28.8%2-4 Units 17.8%5-9 Units 13.9%10-19 Units 10.0%20 Units+ 29.5%
Anaheim-Orange-Santa-Ana Rental Units By Year Built
Before 1970 44.7%1970-1999 47.5%After 2000 7.9%
Orange County Multifamily Market Trends
Page 32
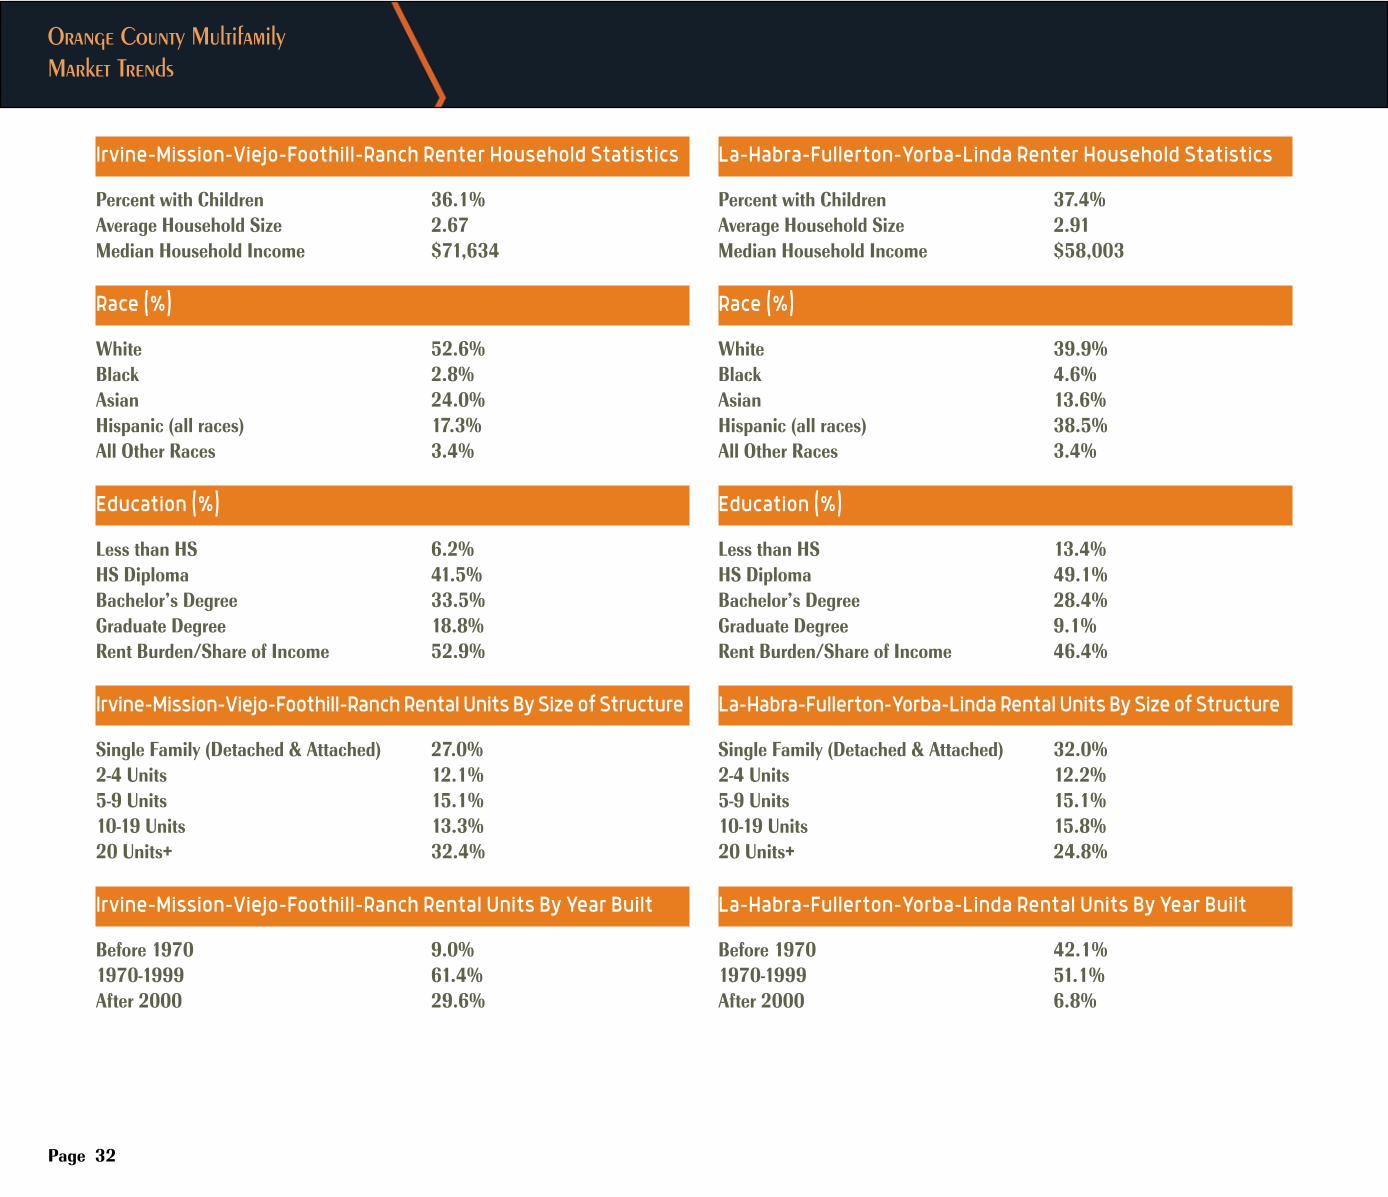
Irvine-Mission-Viejo-Foothill-Ranch Renter Household Statistics
Percent with Children 36.1%Average Household Size 2.67Median Household Income $71,634
Race (%)
White 52.6%Black 2.8%Asian 24.0%Hispanic (all races) 17.3%All Other Races 3.4%
Education (%)
Less than HS 6.2%HS Diploma 41.5%Bachelor’s Degree 33.5%Graduate Degree 18.8%Rent Burden/Share of Income 52.9%
Irvine-Mission-Viejo-Foothill-Ranch Rental Units By Size of Structure
Single Family (Detached & Attached) 27.0%2-4 Units 12.1%5-9 Units 15.1%10-19 Units 13.3%20 Units+ 32.4%
Irvine-Mission-Viejo-Foothill-Ranch Rental Units By Year Built
Before 1970 9.0%1970-1999 61.4%After 2000 29.6%
La-Habra-Fullerton-Yorba-Linda Renter Household Statistics
Percent with Children 37.4%Average Household Size 2.91Median Household Income $58,003
Race (%)
White 39.9%Black 4.6%Asian 13.6%Hispanic (all races) 38.5%All Other Races 3.4%
Education (%)
Less than HS 13.4%HS Diploma 49.1%Bachelor’s Degree 28.4%Graduate Degree 9.1%Rent Burden/Share of Income 46.4%
La-Habra-Fullerton-Yorba-Linda Rental Units By Size of Structure
Single Family (Detached & Attached) 32.0%2-4 Units 12.2%5-9 Units 15.1%10-19 Units 15.8%20 Units+ 24.8%
La-Habra-Fullerton-Yorba-Linda Rental Units By Year Built
Before 1970 42.1%1970-1999 51.1%After 2000 6.8%
USC Casden Forecast | 2018 Multifamily Report
Page 33
Newport-Beach-Laguna-Niguel Renter Household Statistics
Percent with Children 29.0%Average Household Size 2.33Median Household Income $70,767
Race (%)
White 73.1%Black 0.6%Asian 7.3%Hispanic (all races) 16.0%All Other Races 2.9%
Education (%)
Less than HS 7.3%HS Diploma 48.7%Bachelor’s Degree 28.6%Graduate Degree 15.4%Rent Burden/Share of Income 56.4%
Newport-Beach-Laguna-Niguel Rental Units By Size of Structure
Single Family (Detached & Attached) 28.9%2-4 Units 20.7%5-9 Units 14.5%10-19 Units 9.9%20 Units+ 26.0%
Newport-Beach-Laguna-Niguel Rental Units By Year Built
Before 1970 23.7%1970-1999 63.6%After 2000 12.7%
Seal-Beach-Huntington-Beach Renter Household Statistics
Percent with Children 36.1%Average Household Size 2.70Median Household Income $60,282
Race (%)
White 46.9%Black 3.5%Asian 16.6%Hispanic (all races) 28.1%All Other Races 4.9%
Education (%)
Less than HS 15.3%HS Diploma 54.4%Bachelor’s Degree 21.6%Graduate Degree 8.8%Rent Burden/Share of Income 50.3%
Seal-Beach-Huntington-Beach Rental Units By Size of Structure
Single Family (Detached & Attached) 29.5%2-4 Units 19.9%5-9 Units 12.7%10-19 Units 9.3%20 Units+ 28.7%
Seal-Beach-Huntington-Beach Rental Units By Year Built
Before 1970 43.7%1970-1999 50.8%After 2000 5.5%

Inland Empire Multifamily Market Trends
Page 34
THE Inland Empire has been the fastest growing economy of all the regions in Southern California for several years. Total nonfarm jobs grew by 3.4% year-over-year in July 2018, which exceeded
the growth rate of California (2.0%) during the same period. As a result, the unemployment rate decreased from 5.0% a year ago to 4.5% in July, the lowest since before the Great Recession. Of the 50,100 nonfarm jobs added in July, 8,300 were in Administrative Support, 7,500 were in Government, and 7,400 were in Leisure and Hospitality. Administrative Support also registered the largest percentage increase at 8.4%, followed by Wholesale Trade (8.3%), Educational Services (5.7%), and Logistics (5.1%). The County lost jobs in Information and in Real Estate over the past year. With the local economy expected to grow and add jobs over the next year, and with sizable population increases in the picture for several years to come, demand for rental housing in the Inland Empire will be strong.
The homeownership rate in the Inland Empire has been historically higher than much of Southern California, owing to relatively high affordability. The homeownership rate stood at 63.0% in 2017, up from 61.1% a year ago. In turn, renter households as percentage of total households fell from 38.9% to 37.0%. The Inland Empire aligns with the national trends in homeownership, picking up since 2015 following several years of decline.
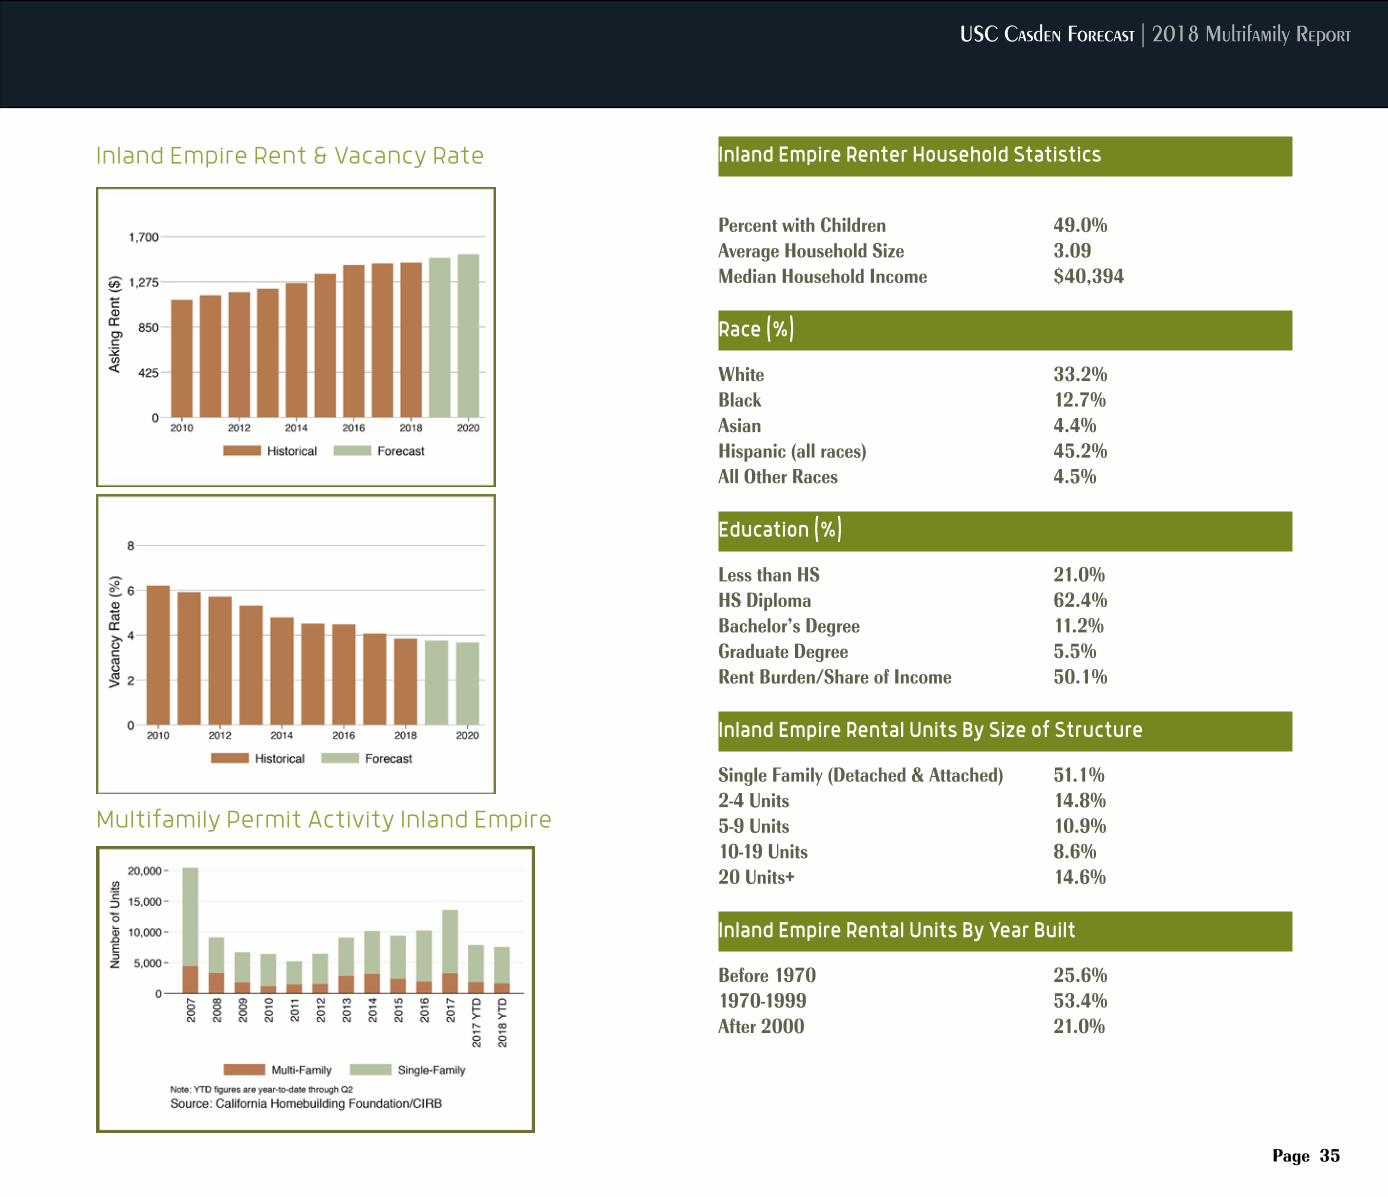
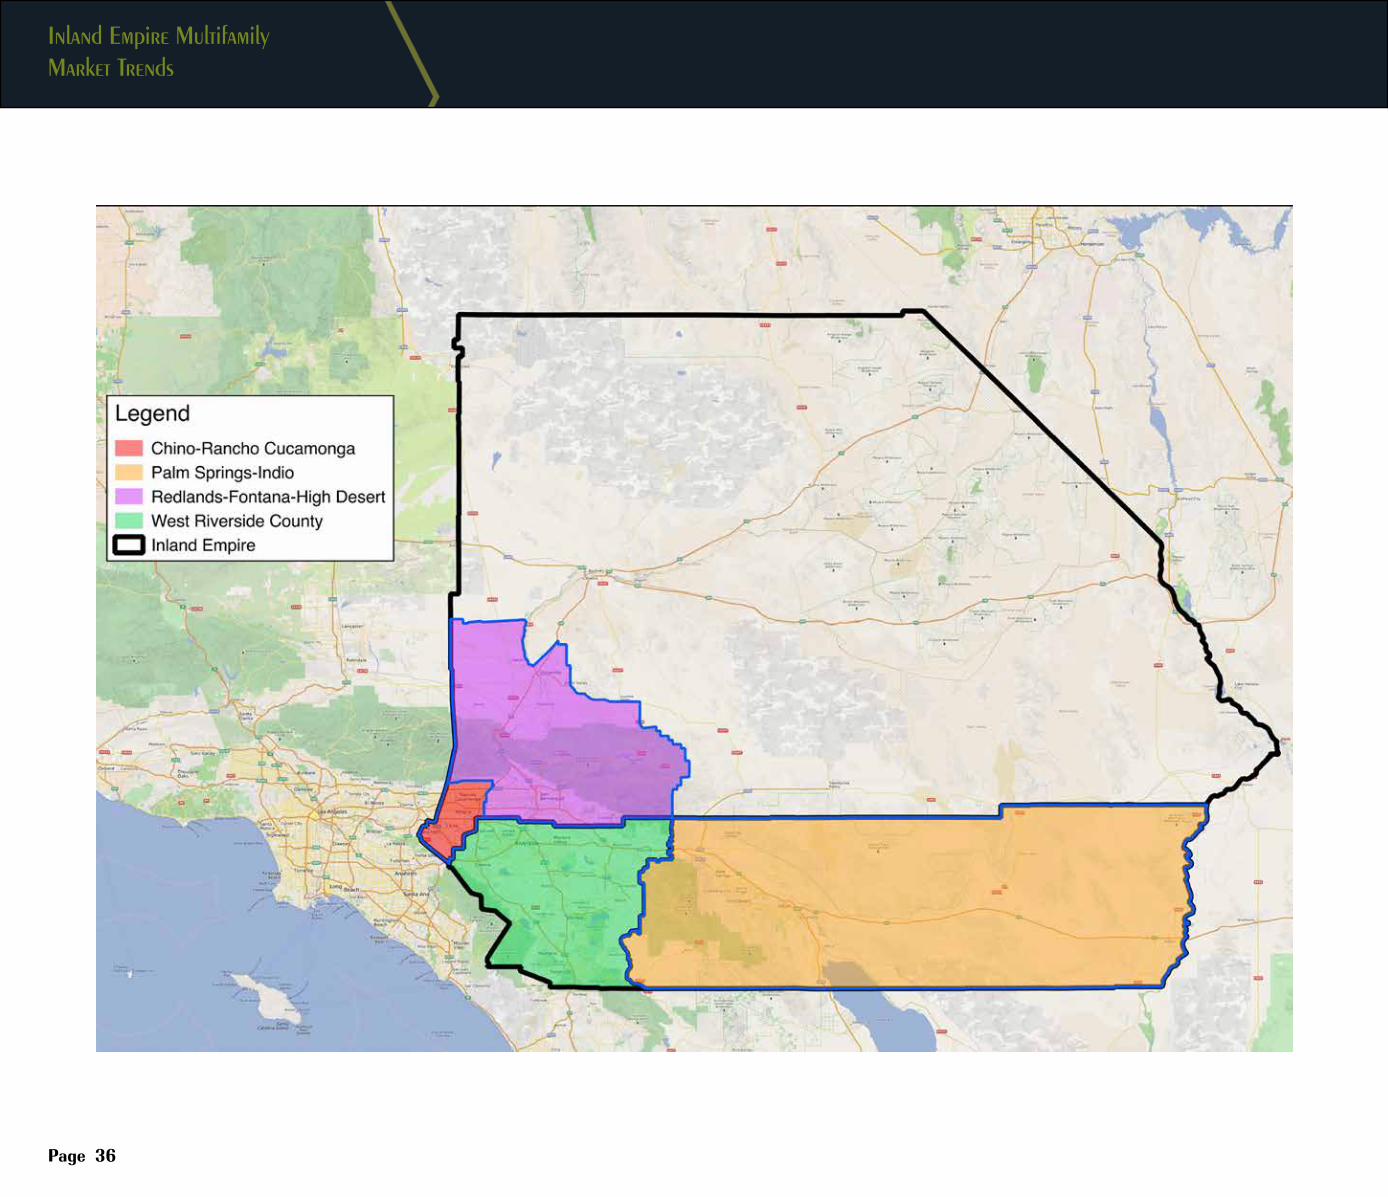
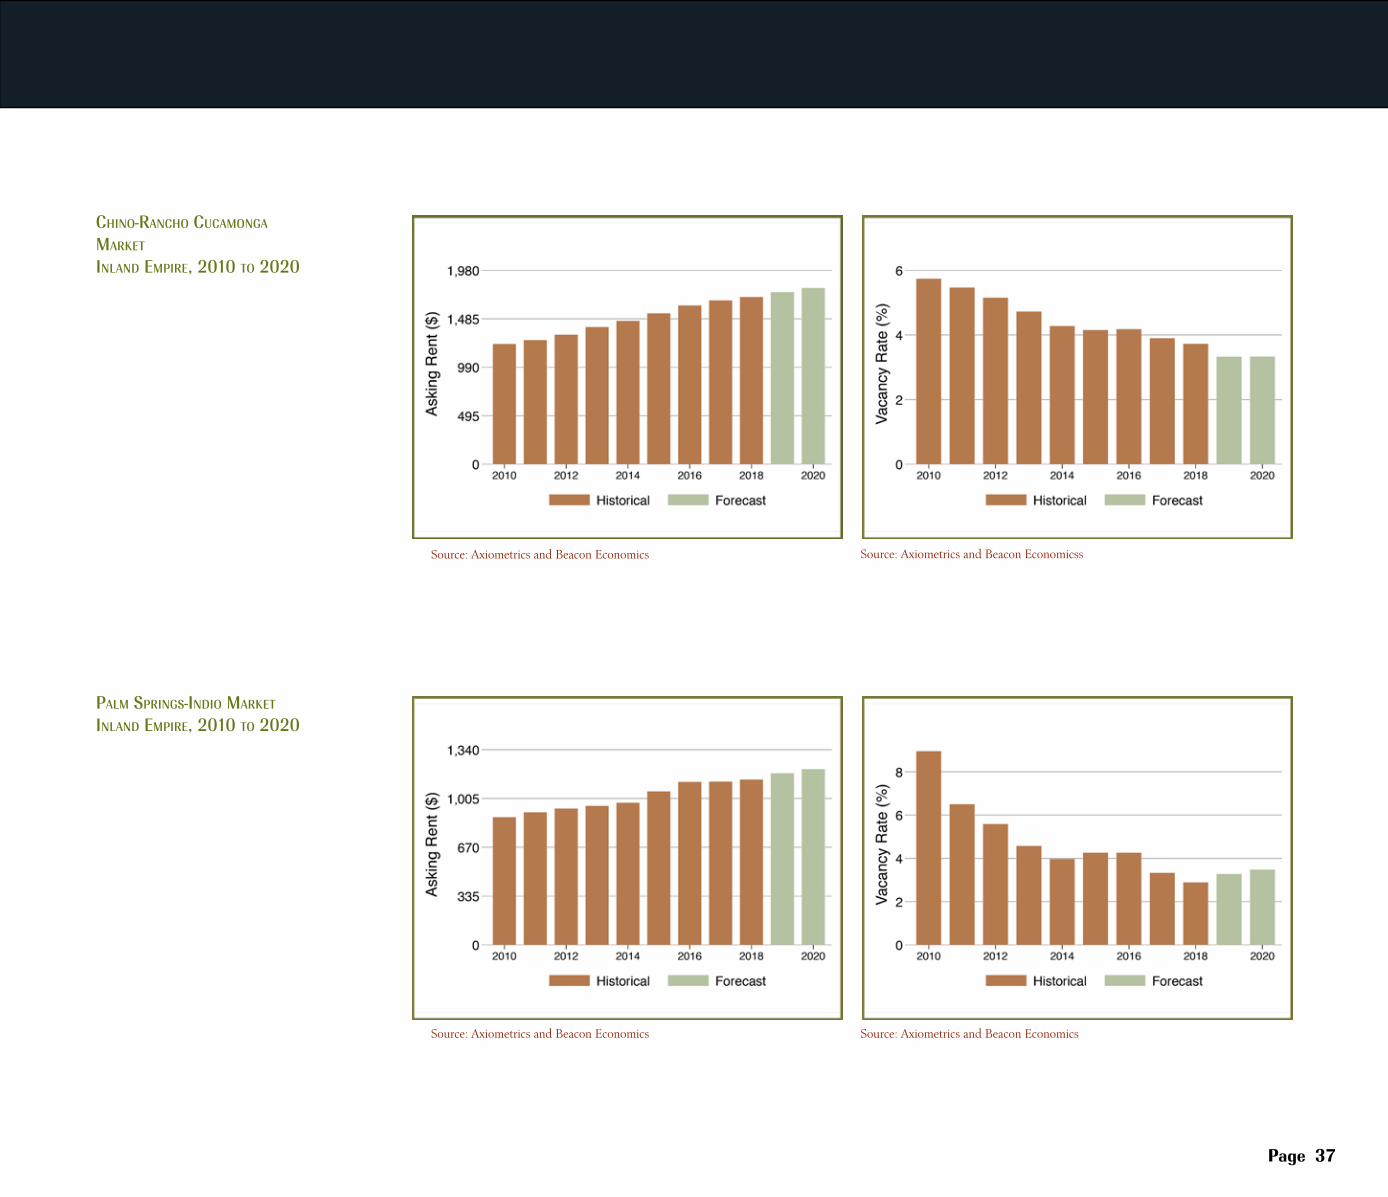
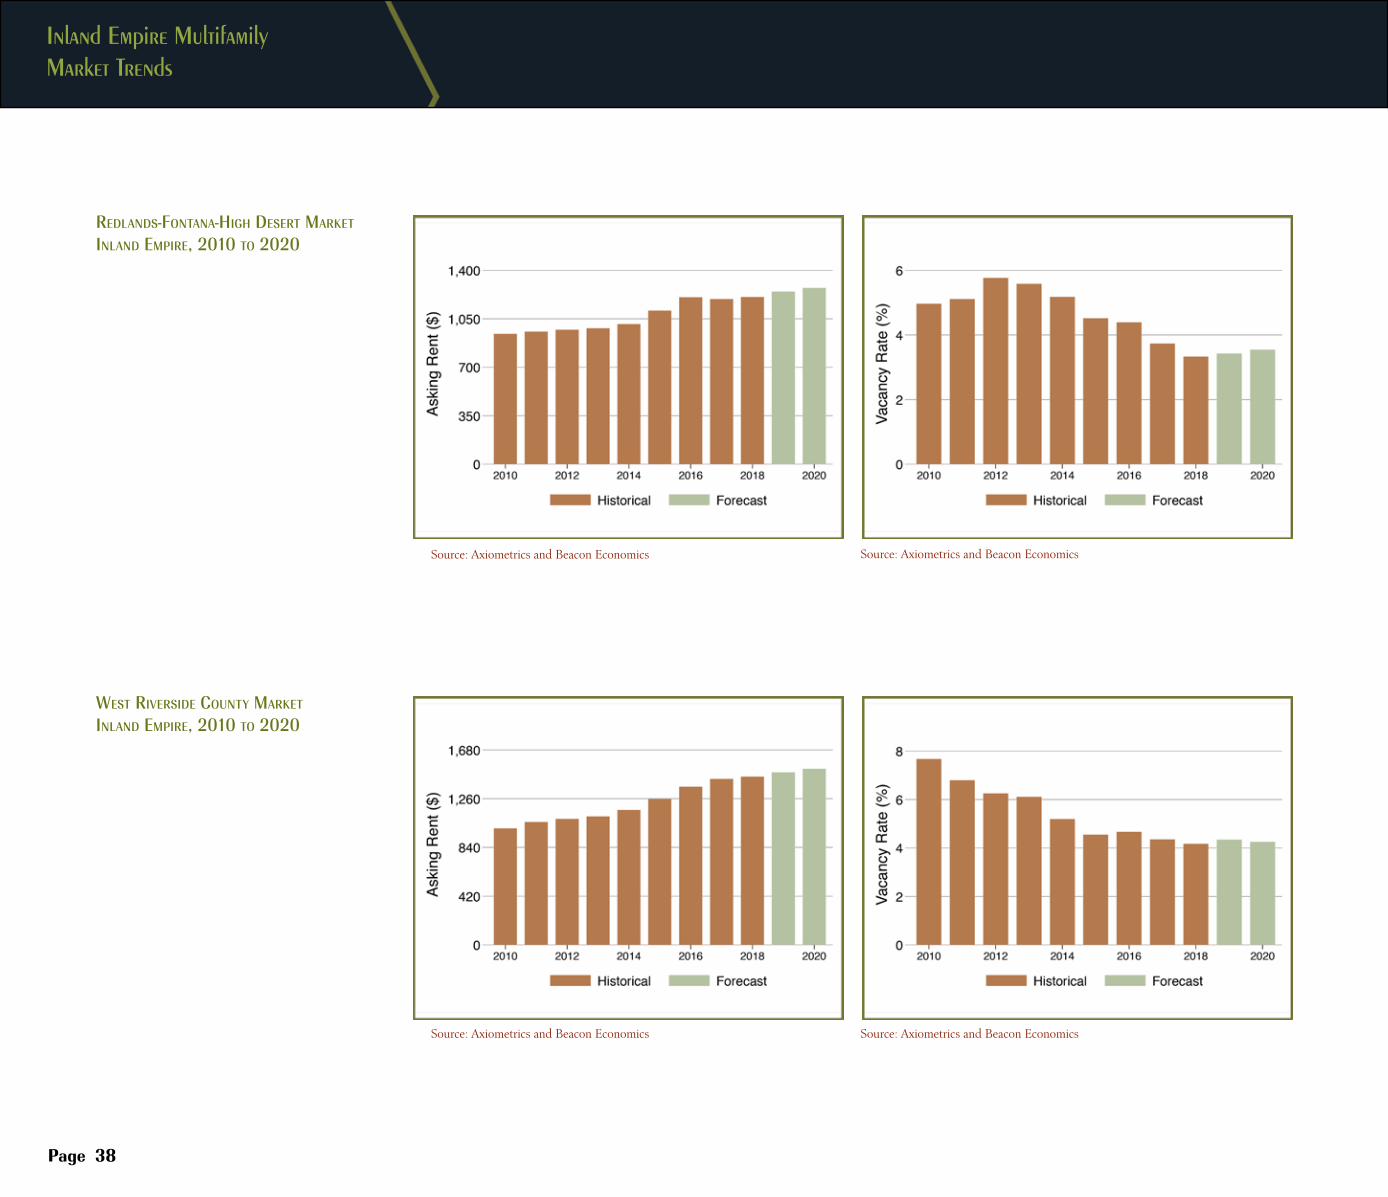
The average rent in Inland Empire metro area was the lowest among all the counties in Southern California, and the rent growth rate was also the lowest. This year, average rent in the Inland Empire was $1,457, up 0.6% from $1,447 last year. Of all the submarkets in the Inland Empire, Chino-Rancho Cucamonga had the highest rent ($1,709), followed by West Riverside County ($1,451), Redlands-Fontana-High Desert ($1,209) and Palm Springs-Indio ($1,135).
The median household income for renters in the Inland Empire was $42,416 in 2017, up 4.1% annually. This was the lowest among the Southern California regions in 2017, and was slightly more than half of that of owner-occupied households ($77,893).1 The Inland Empire’s share of rent burdened households, for whom more than 30% of their income goes to rent, stood at 58.8% in 2017. In brief, despite the fact that it had the lowest rents in Southern California, Inland Empire residents faced the highest rent burden across all of the Southern California metro areas.
The vacancy rate in the Inland Empire fell to its lowest in 16 years at 3.8% in 2018, down from 4.1% a year earlier, and was the lowest among the regions discussed in this report. This is quite a change from recent history, when the area posted the highest vacancy rate in Southern California. This is explained by growth in jobs and incomes along with relatively larger population gains in recent years that have bumped up against somewhat limited increases in multifamily housing stock. West Riverside County had the highest vacancy rate among all the submarkets (4.2%), followed by Chino-Rancho Cucamonga (3.7%), Redlands-Fontana-High Desert (3.3%). Palm Springs-Indio has the lowest vacancy rate at only 2.9%.
With more than 20% of its housing built since 2000, the Inland Empire has the newest housing stock in the Southern California Region. Following low levels of construction in the immediate aftermath of the Great Recession, both multifamily and single-family construction accelerated, eventually reaching a post-recession high of 13,593 units in 2017. However, both multi-family permits and single-family permits have decreased through the first half of the year. Only 1,648 multi-family permits were issued so far this year, compared to 1,848 issued during the same period last year, while single family permits fell from over 7,800 to 7,600 in the first half of this year.
The already tight rental market in the Inland Empire will remain so, as its vacancy rate is expected to hold steady at 3.8% this year and next. In turn, average rent for the region will accelerate from this year’s 0.6% gain to a 3.1% increase in 2019, with rent rising from $1,457 per month this year to $1,501 per month in 2019.
Going forward, population growth will continue to drive demand for rental housing in the Inland Empire. It will also maintain its reputation for being the affordable region in Southern California. While significant numbers of residents commute to other parts of Southern California for their jobs, their share of all Inland Empire workers has declined gradually as the region has diversified its economic base. Of all the metro areas in Southern California, the Inland Empire has the greatest potential for long run growth.
1 The metro level figures cited here are based upon the 2017 American Community Survey and were extracted using the Census Bureau’s American Factfinder. They differ somewhat from figures in the metro table at the end of this section, which were derived from the American Community Survey Public Use Micro Sample (PUMS) and were the basis for household and housing stock figures at the submarket leve
USC Casden Forecast | 2018 Multifamily Report
Page 35
Inland Empire Rent & Vacancy Rate
Multifamily Permit Activity Inland Empire
Inland Empire Renter Household Statistics
Percent with Children 49.0%Average Household Size 3.09Median Household Income $40,394
Race (%)
White 33.2%Black 12.7%Asian 4.4%Hispanic (all races) 45.2%All Other Races 4.5%
Education (%)
Less than HS 21.0%HS Diploma 62.4%Bachelor’s Degree 11.2%Graduate Degree 5.5%Rent Burden/Share of Income 50.1% Inland Empire Rental Units By Size of Structure
Single Family (Detached & Attached) 51.1%2-4 Units 14.8%5-9 Units 10.9%10-19 Units 8.6%20 Units+ 14.6% Inland Empire Rental Units By Year Built
Before 1970 25.6%1970-1999 53.4%After 2000 21.0%
Inland Empire Multifamily Market Trends
Page 36
USC Casden Forecast | 2018 Multifamily Report Submarkets
Page 37
Source: Axiometrics and Beacon Economics
Source: Axiometrics and Beacon Economics
Source: Axiometrics and Beacon Economicss
Source: Axiometrics and Beacon Economics
Chino-RanCho CuCamonga maRket
inland empiRe, 2010 to 2020
palm SpRingS-indio maRket
inland empiRe, 2010 to 2020
Inland Empire Multifamily Market Trends
Page 38
Source: Axiometrics and Beacon Economics
Source: Axiometrics and Beacon Economics
Source: Axiometrics and Beacon Economics
Source: Axiometrics and Beacon Economics
RedlandS-Fontana-high deSeRt maRket
inland empiRe, 2010 to 2020
WeSt RiveRSide County maRket
inland empiRe, 2010 to 2020
USC Casden Forecast | 2018 Multifamily Report
Page 39
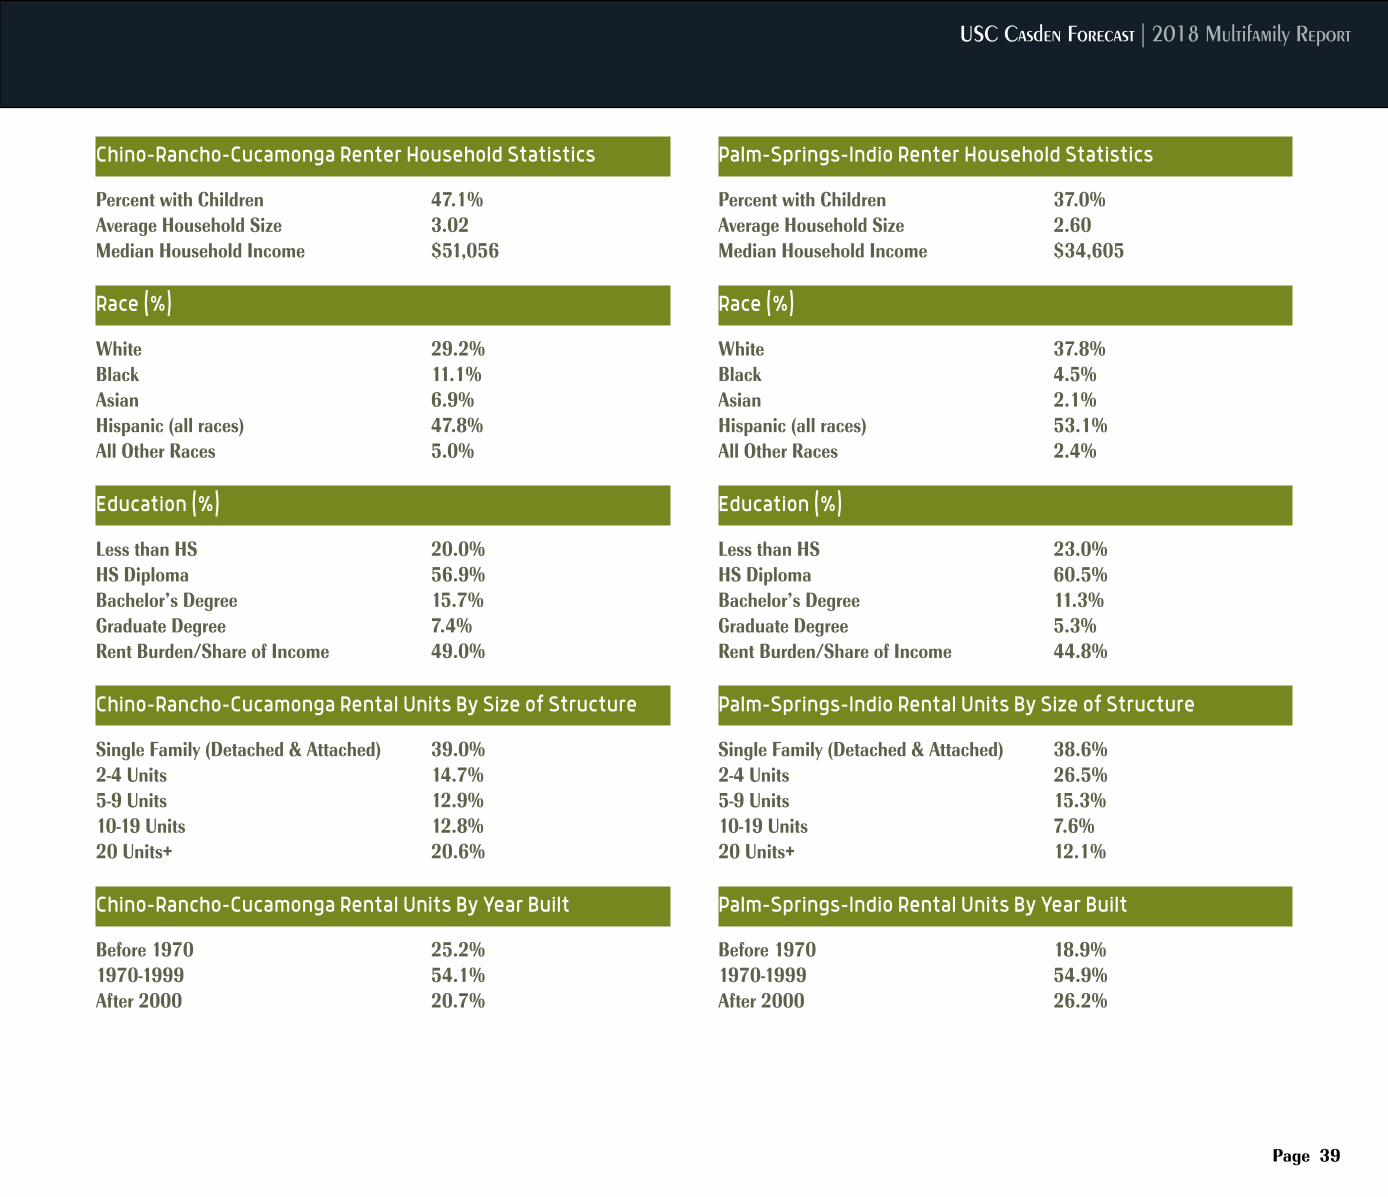
Chino-Rancho-Cucamonga Renter Household Statistics
Percent with Children 47.1%Average Household Size 3.02Median Household Income $51,056
Race (%)
White 29.2%Black 11.1%Asian 6.9%Hispanic (all races) 47.8%All Other Races 5.0%
Education (%)
Less than HS 20.0%HS Diploma 56.9%Bachelor’s Degree 15.7%Graduate Degree 7.4%Rent Burden/Share of Income 49.0% Chino-Rancho-Cucamonga Rental Units By Size of Structure
Single Family (Detached & Attached) 39.0%2-4 Units 14.7%5-9 Units 12.9%10-19 Units 12.8%20 Units+ 20.6% Chino-Rancho-Cucamonga Rental Units By Year Built
Before 1970 25.2%1970-1999 54.1%After 2000 20.7%
Palm-Springs-Indio Renter Household Statistics
Percent with Children 37.0%Average Household Size 2.60Median Household Income $34,605
Race (%)
White 37.8%Black 4.5%Asian 2.1%Hispanic (all races) 53.1%All Other Races 2.4%
Education (%)
Less than HS 23.0%HS Diploma 60.5%Bachelor’s Degree 11.3%Graduate Degree 5.3%Rent Burden/Share of Income 44.8% Palm-Springs-Indio Rental Units By Size of Structure
Single Family (Detached & Attached) 38.6%2-4 Units 26.5%5-9 Units 15.3%10-19 Units 7.6%20 Units+ 12.1% Palm-Springs-Indio Rental Units By Year Built
Before 1970 18.9%1970-1999 54.9%After 2000 26.2%
Inland Empire Multifamily Market Trends
Page 40
Page 40
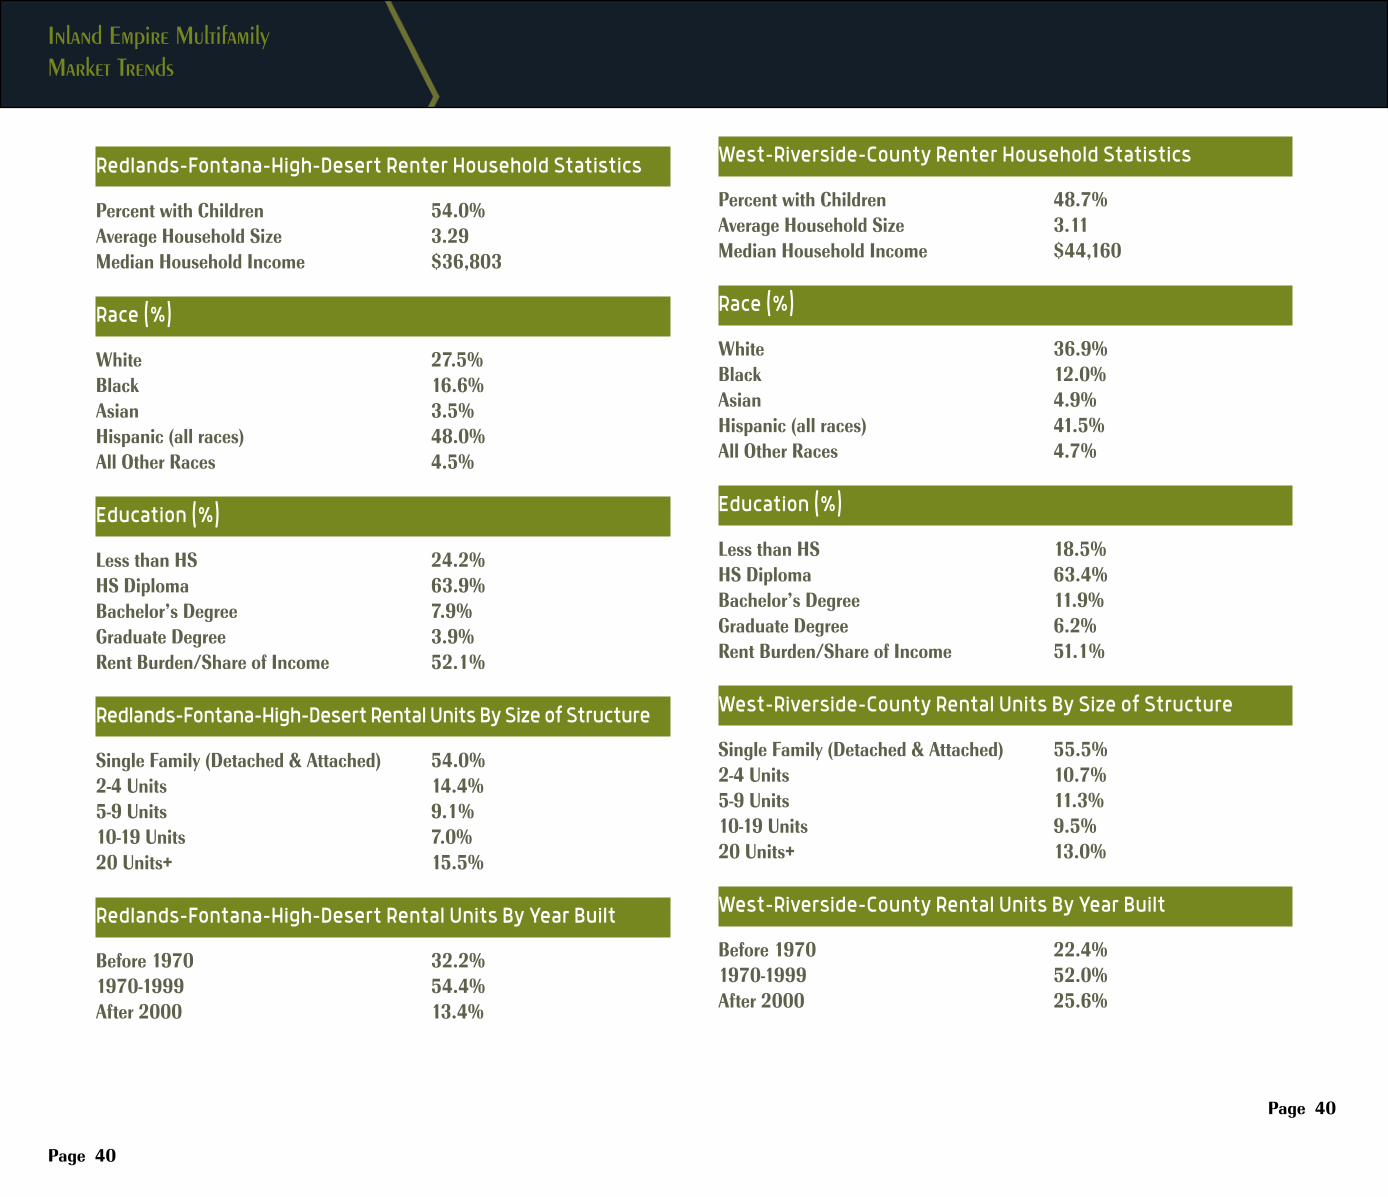
Redlands-Fontana-High-Desert Renter Household Statistics
Percent with Children 54.0%Average Household Size 3.29Median Household Income $36,803
Race (%)
White 27.5%Black 16.6%Asian 3.5%Hispanic (all races) 48.0%All Other Races 4.5%
Education (%)
Less than HS 24.2%HS Diploma 63.9%Bachelor’s Degree 7.9%Graduate Degree 3.9%Rent Burden/Share of Income 52.1% Redlands-Fontana-High-Desert Rental Units By Size of Structure
Single Family (Detached & Attached) 54.0%2-4 Units 14.4%5-9 Units 9.1%10-19 Units 7.0%20 Units+ 15.5% Redlands-Fontana-High-Desert Rental Units By Year Built
Before 1970 32.2%1970-1999 54.4%After 2000 13.4%
West-Riverside-County Renter Household Statistics
Percent with Children 48.7%Average Household Size 3.11Median Household Income $44,160
Race (%)
White 36.9%Black 12.0%Asian 4.9%Hispanic (all races) 41.5%All Other Races 4.7%
Education (%)
Less than HS 18.5%HS Diploma 63.4%Bachelor’s Degree 11.9%Graduate Degree 6.2%Rent Burden/Share of Income 51.1% West-Riverside-County Rental Units By Size of Structure
Single Family (Detached & Attached) 55.5%2-4 Units 10.7%5-9 Units 11.3%10-19 Units 9.5%20 Units+ 13.0% West-Riverside-County Rental Units By Year Built
Before 1970 22.4%1970-1999 52.0%After 2000 25.6%
USC Casden Forecast | 2018 Multifamily Report
Page 41
San Diego Multifamily Market Trends
Page 42
THE economy in San Diego County has advanced strongly in recent years, with job growth ranging between two and three percent annually until just this year. Consequently, the county
unemployment rate has dropped by half from 6.4% in July 2014 to 3.2% in July of this year. The unemployment rate was 0.8% lower than a year earlier, and is significantly lower than California’s average at 4.2%. Job growth has been sustained throughout this year, although at a slower pace than earlier in the decade. With a 1.4% year-to-year increase in July 2018, the county added 20,300 jobs year-over-year. Most of the job gains occurred in Professional Science and Technology (7,100), followed by Education/Health (4,900), and Manufacturing (3,800). Leisure and Hospitality saw the largest job loss (3,200), followed by Trade, Transport, Utilities (1,500) and Financial Activities (1,400). In percentage terms, Natural Resources/Mining had the highest year-over-year growth rate at 33.0%, followed by Professional/Business (4.8%) and Other Services (4.2%). San Diego’s economy will continue to expand in the next two years and will fuel continued rental market activity.
Of the 1.1 million occupied housing units in San Diego County in 2017, 500,000 were renter occupied units. San Diego County experienced a general upward trend in the share of renters from 42% in 2005 before hitting a plateau of 48% in 2015 and 2016. In 2017, the county’s renter share dropped to 46.5%, declining by a sizable 1.4% as income gains enabled more households to step away from renting and move toward homeownership. San Diego County had a slightly larger share of renters compared to the state’s 45.2% in 2017, and the state’s homeownership rate of 54.8% was higher than San Diego’s (53.5%).
As of 2017, the median household income of San Diego County renters stood at $54,025, increasing by 5.7% compared to the prior year. From 2016 to 2017, the median income of owner households increased by 7.7% in the County, reaching $103,2801. The share of rent burdened households, for whom more than 30% of their income goes to rent, stood at 57.2% in 2017, lowest among the regions in this report.
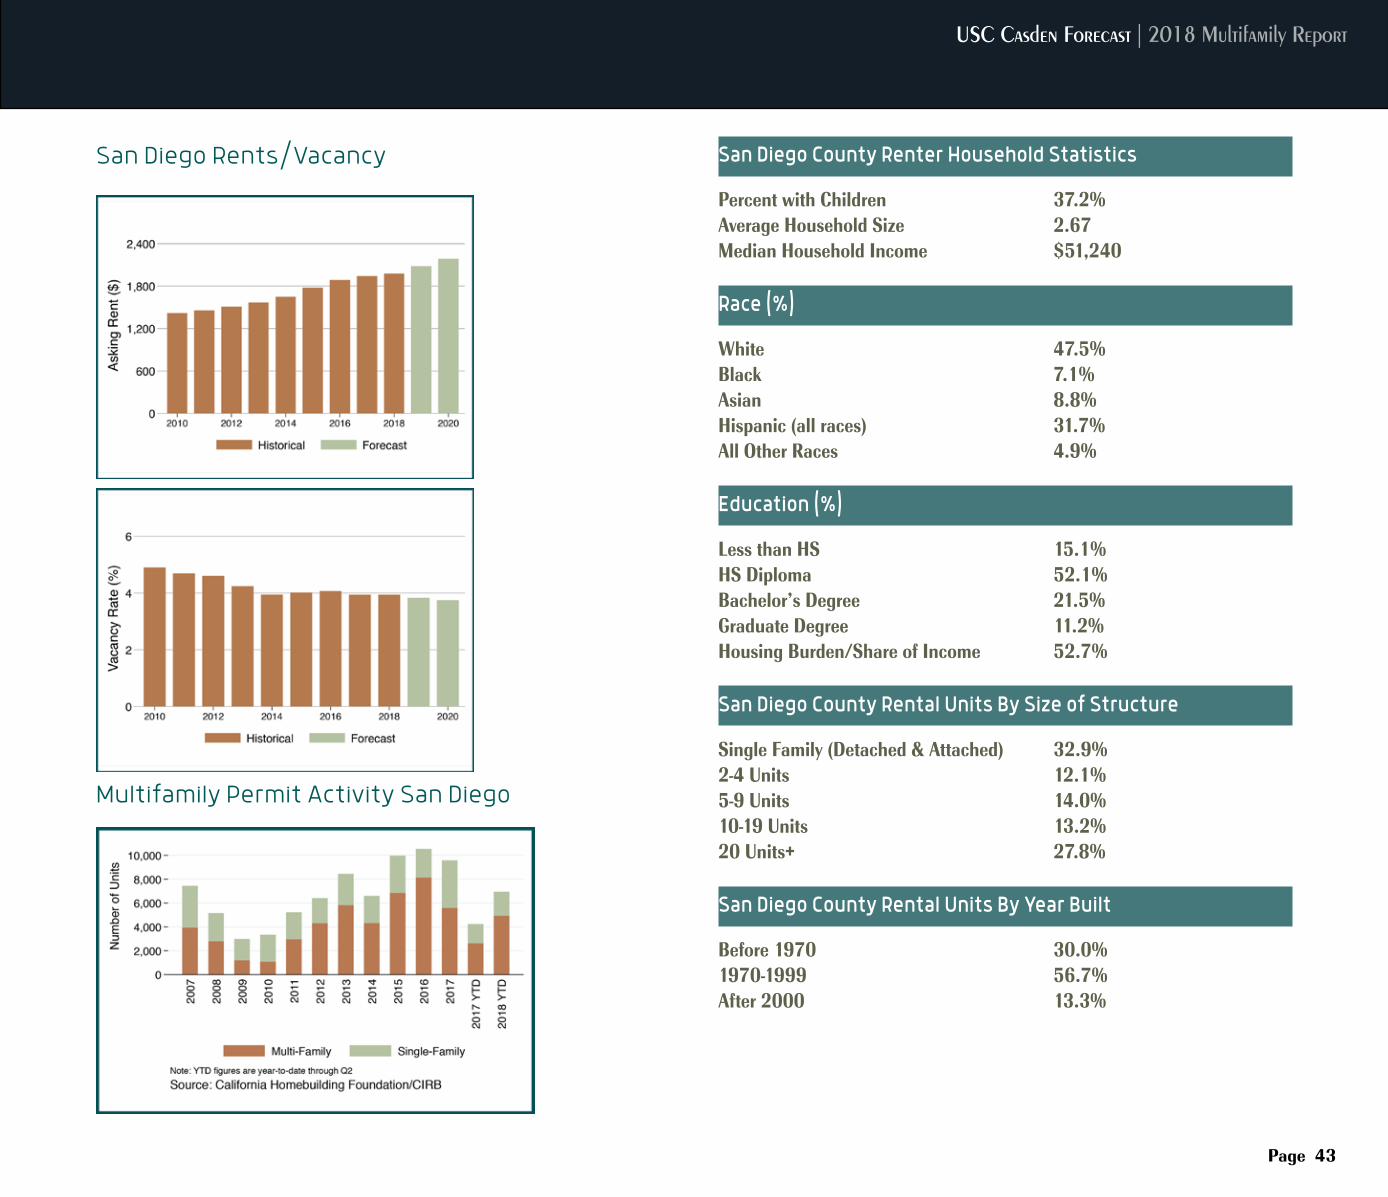
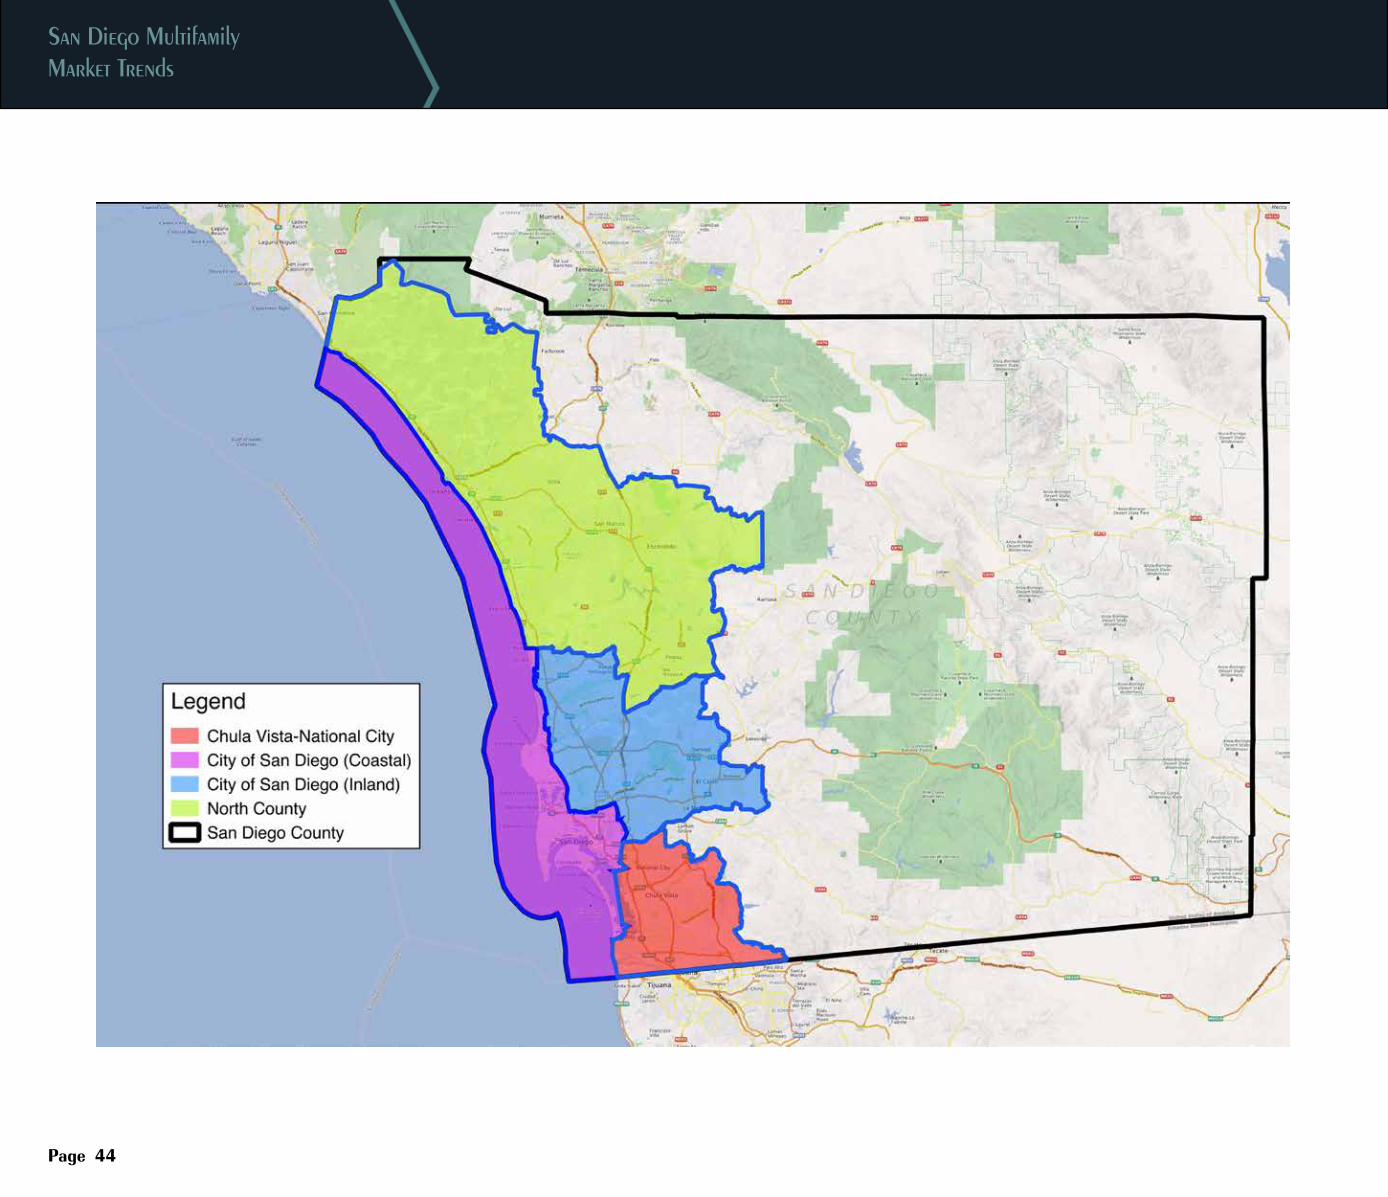
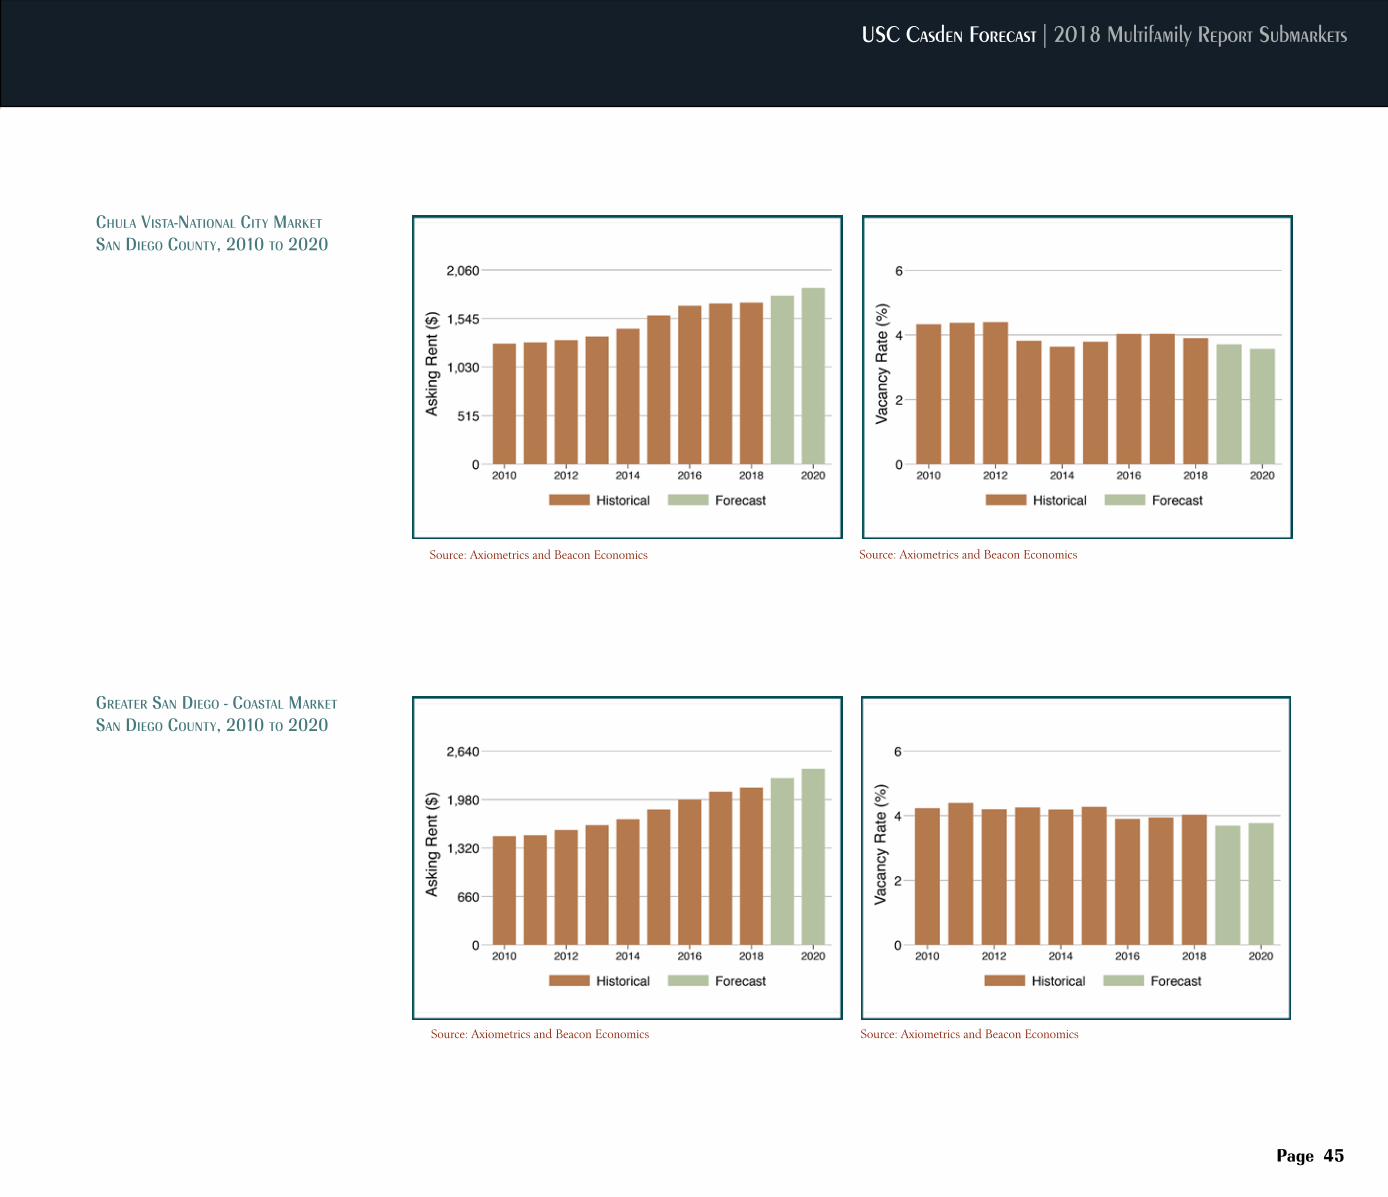
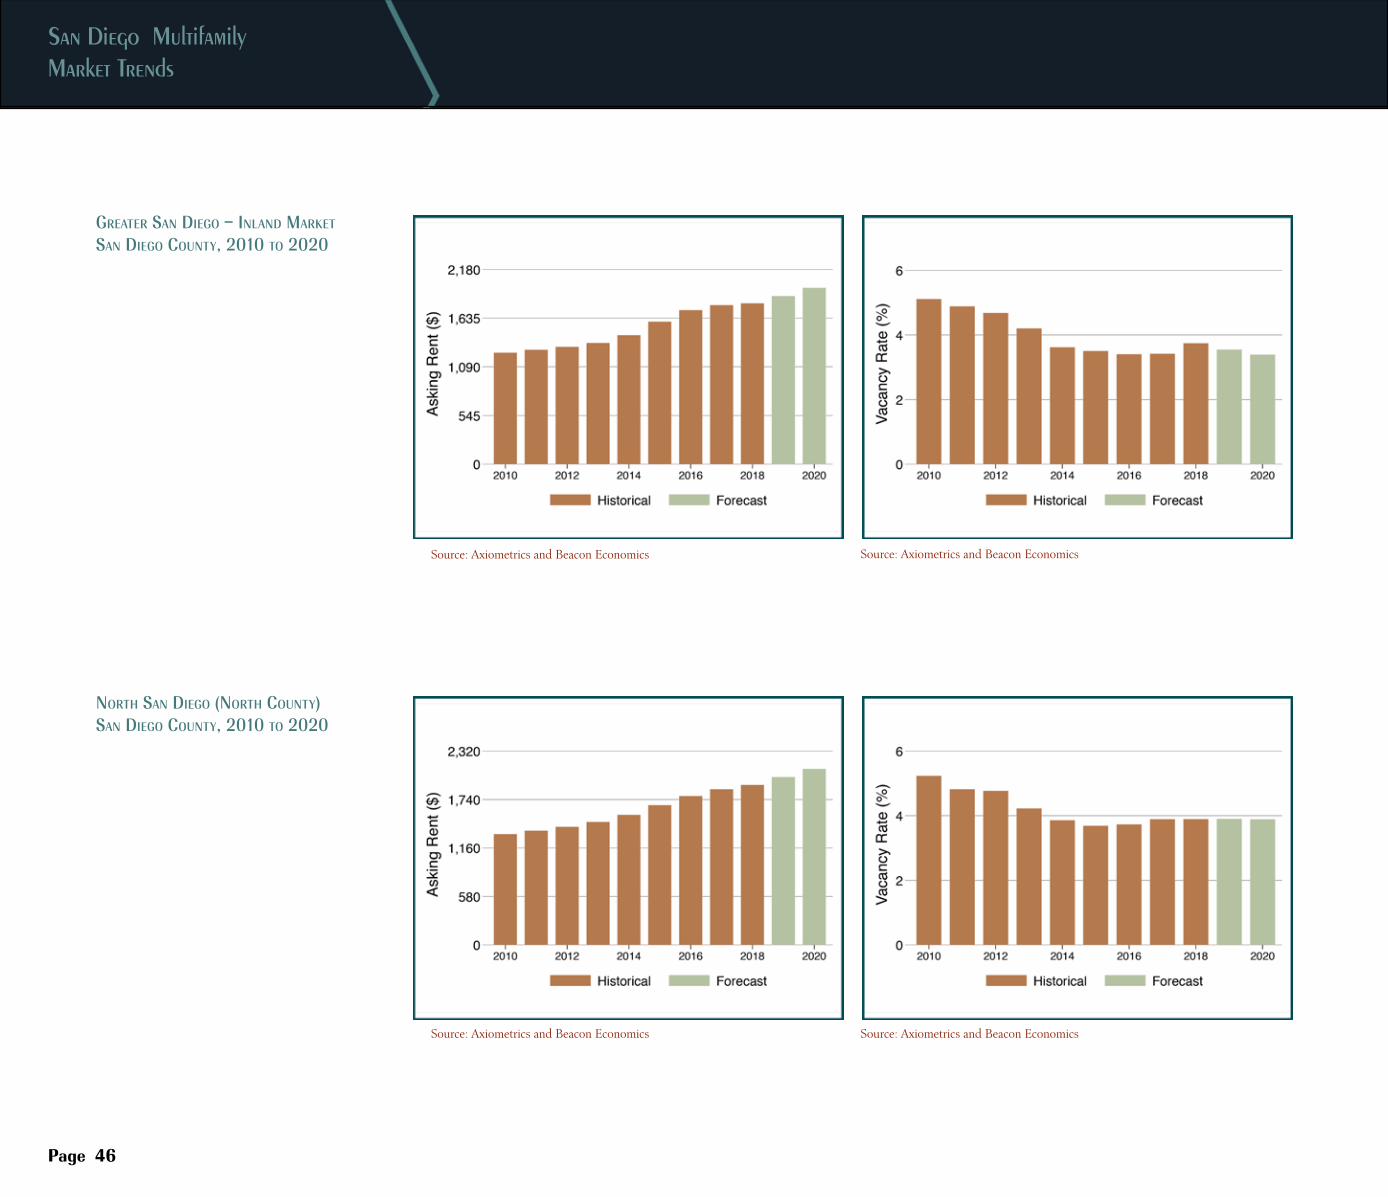
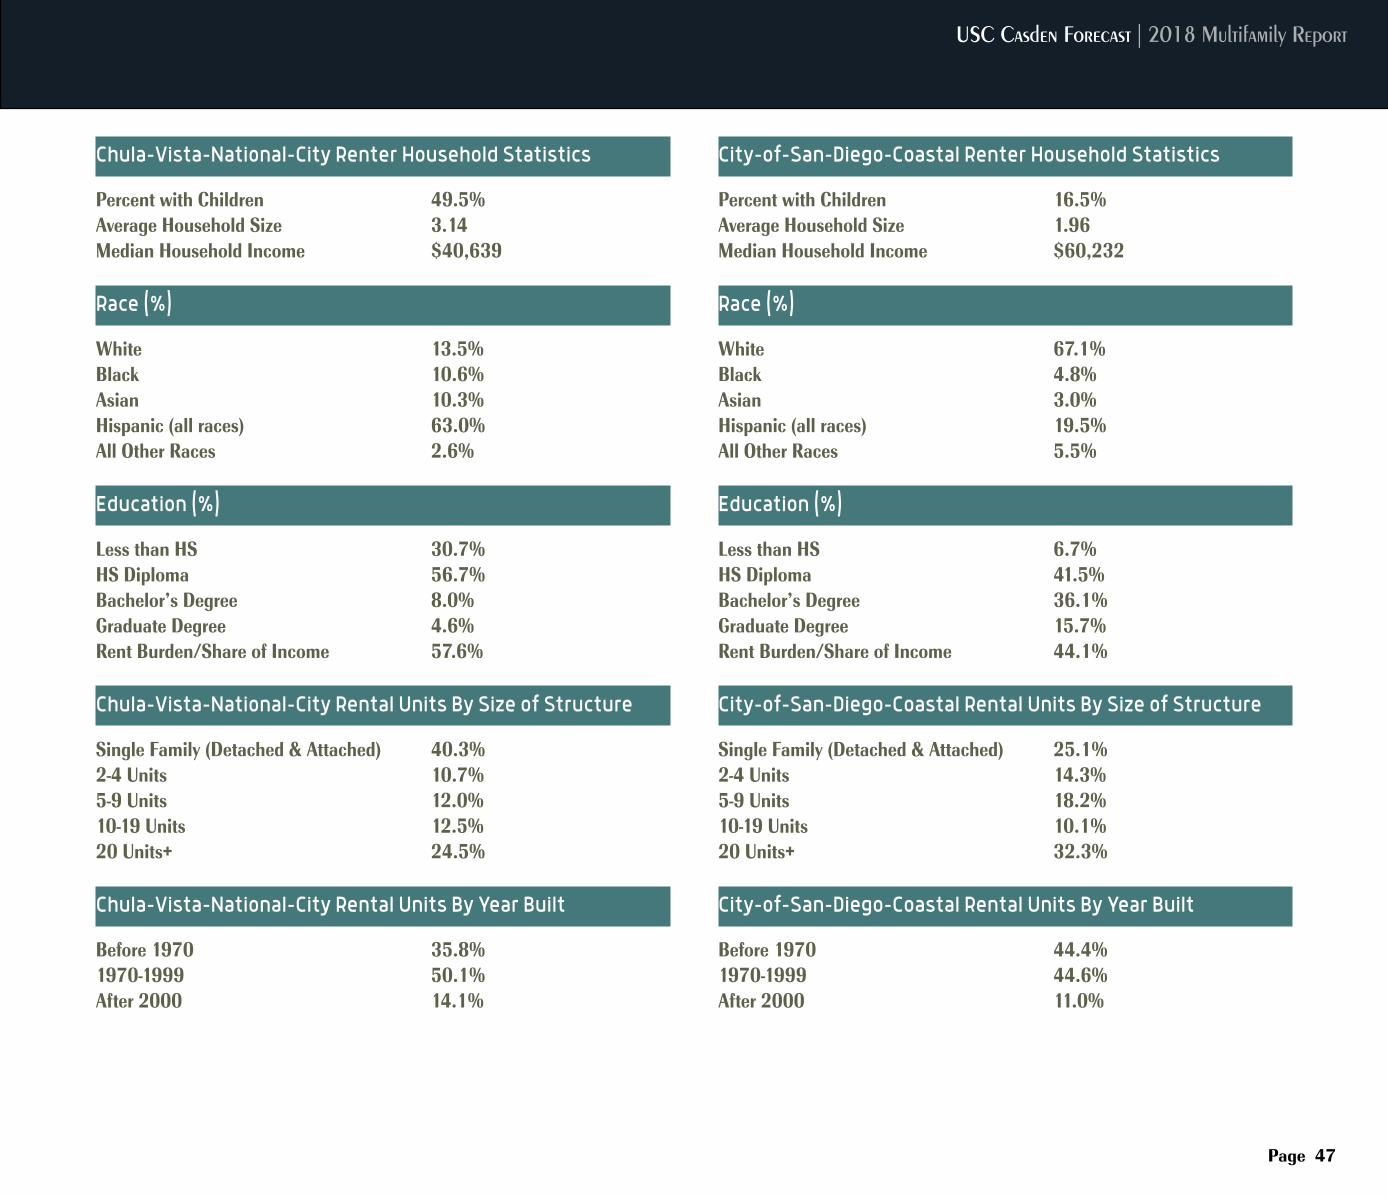
Countywide, the average rent was $1,978 per month in 2018, increasing 1.9% from $1,941 per month in 2017. Among all the submarkets in San Diego, the City of San Diego-Coastal submarket had the highest average monthly rent rate ($2,142), followed by North County ($1,914), the City of San Diego-Inland ($1,801), and lastly Chula Vista-National City ($1,714). Both the City of San Diego-Coastal and North County led the submarkets with the largest percentage increase in rent at 2.7%. Rent increases are decelerating.
For the metro area as a whole, the San Diego vacancy rate in 2018 was unchanged from a year earlier in 2018 at 3.9%. The vacancy rates among San Diego submarkets show little variation. The City of San Diego Coastal had the highest vacancy rate (4.0%), followed by North County and Chula Vista National City (both at 3.9%), and lastly City of San Diego Inland (3.7%). Overall, vacancy rates are low in San Diego submarkets relative to other Southern California submarkets discussed in this report.
Over half (56.6%) of the rental stock in San Diego County was built between 1970 and 1999, with another 13.3% constructed in 2000 or later. The vintage of housing is similar to that of Orange County, and is much newer than Los Angeles County where over half was built before 1970. With more than one-fifth (21.0%) of its units built since the start of the century, only the Inland Empire has a slightly newer stock of rental housing than San Diego County. San Diego’s housing supply has surged this year, especially for multi-family units, with 4,948 permits issued in the first half of 2018, up 87.9% from 2,633 units a year ago.
Despite the increase in construction, the rental market in San Diego County will remain tight, with a countywide vacancy rate that will edge down from 3.9% this year to 3.8% in 2019. Meanwhile, countywide average rent will maintain a steady upward trajectory of about 2% per year over the forecast period through 2020, rising from $1,978 per month in 2018 to $2,080 in 2019 (+5.2%).
San Diego County can expect ongoing economic and population growth over the foreseeable future. The economy’s leading sectors will continue to draw a variety of workers while the region is perennially attractive to older members of the population, including retirees. In turn, there will be continued housing demand in both the renter and owner-occupied markets, and rents will continue to increase as vacancy rates remain low.
1 The metro level figures cited here are based upon the 2017 American Community Survey and were extracted using the Census Bureau’s American Factfinder. They differ somewhat from figures in the metro table at the end of this section, which were derived from the American Community Survey Public Use Micro Sample (PUMS) and were the basis for household and housing stock figures at the submarket leve
USC Casden Forecast | 2018 Multifamily Report
Page 43
San Diego Rents/Vacancy
Multifamily Permit Activity San Diego
San Diego County Renter Household Statistics
Percent with Children 37.2%Average Household Size 2.67Median Household Income $51,240
Race (%)
White 47.5%Black 7.1%Asian 8.8%Hispanic (all races) 31.7%All Other Races 4.9%
Education (%)
Less than HS 15.1%HS Diploma 52.1%Bachelor’s Degree 21.5%Graduate Degree 11.2%Housing Burden/Share of Income 52.7%
San Diego County Rental Units By Size of Structure
Single Family (Detached & Attached) 32.9%2-4 Units 12.1%5-9 Units 14.0%10-19 Units 13.2%20 Units+ 27.8% San Diego County Rental Units By Year Built
Before 1970 30.0%1970-1999 56.7%After 2000 13.3%
San Diego Multifamily Market Trends
Page 44
USC Casden Forecast | 2018 Multifamily Report Submarkets
Page 45
Source: Axiometrics and Beacon Economics
Source: Axiometrics and Beacon Economics
Source: Axiometrics and Beacon Economics
Source: Axiometrics and Beacon Economics
Chula viSta-national City maRket
San diego County, 2010 to 2020
gReateR San diego - CoaStal maRket
San diego County, 2010 to 2020
San Diego Multifamily Market Trends
Page 46
Source: Axiometrics and Beacon Economics
Source: Axiometrics and Beacon Economics
Source: Axiometrics and Beacon Economics
Source: Axiometrics and Beacon Economics
noRth San diego (noRth County)San diego County, 2010 to 2020
gReateR San diego – inland maRket San diego County, 2010 to 2020
USC Casden Forecast | 2018 Multifamily Report
Page 47
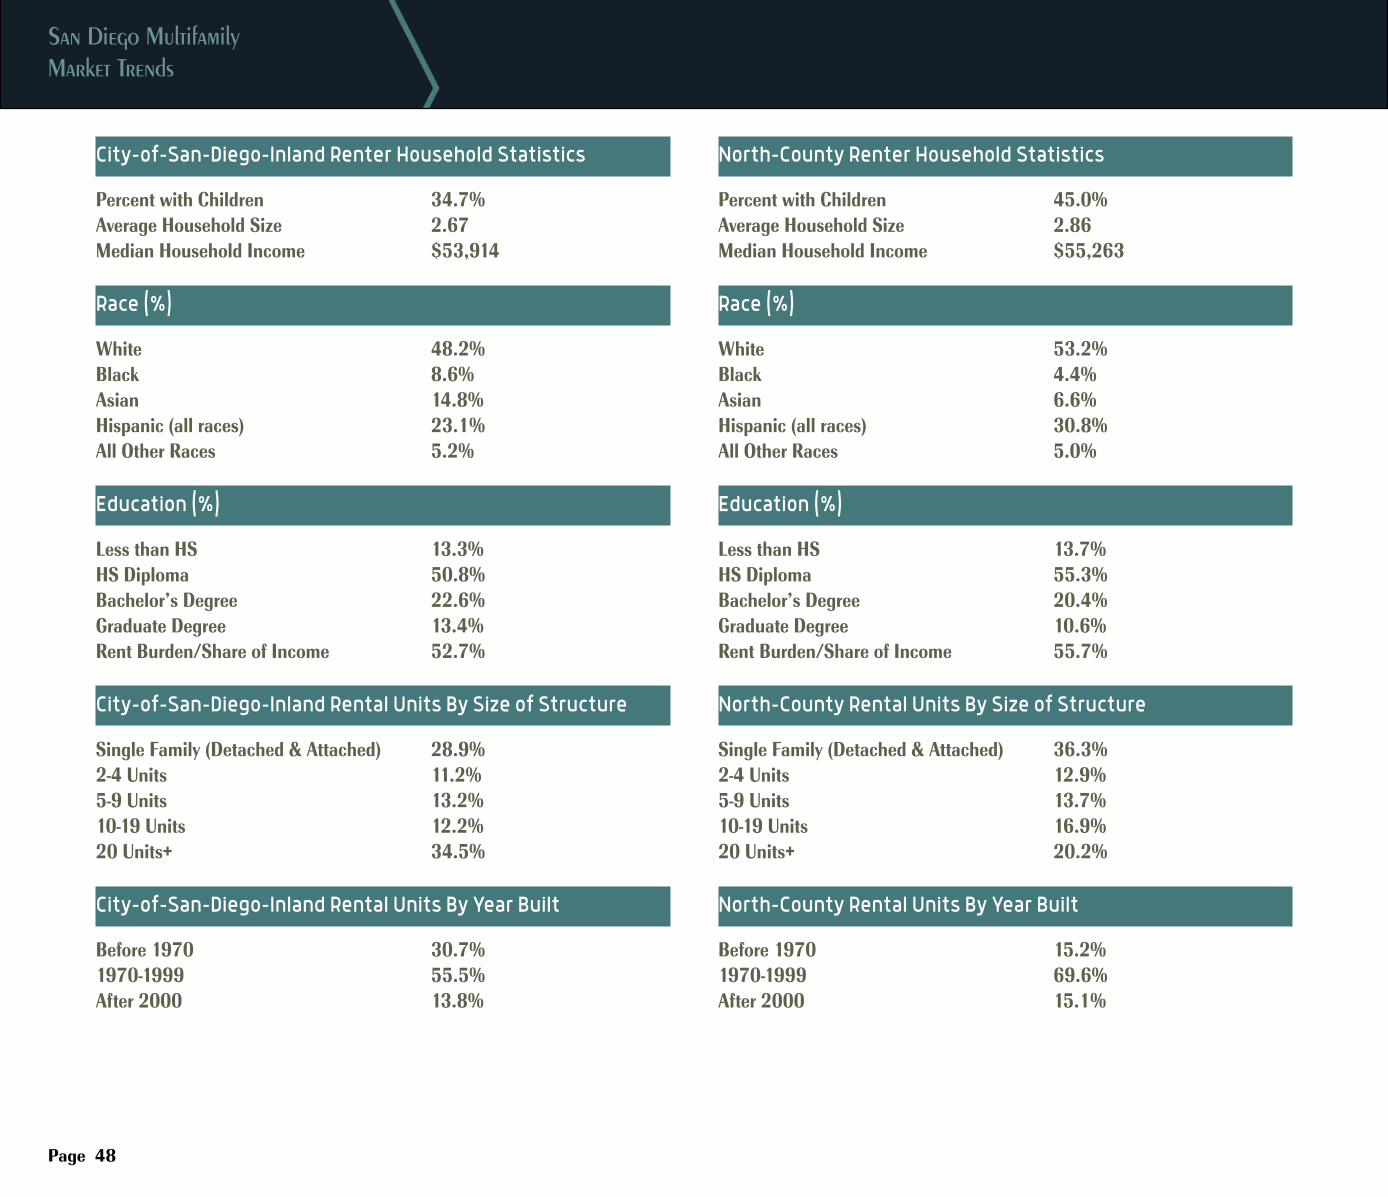
Chula-Vista-National-City Renter Household Statistics
Percent with Children 49.5%Average Household Size 3.14Median Household Income $40,639
Race (%)
White 13.5%Black 10.6%Asian 10.3%Hispanic (all races) 63.0%All Other Races 2.6%
Education (%)
Less than HS 30.7%HS Diploma 56.7%Bachelor’s Degree 8.0%Graduate Degree 4.6%Rent Burden/Share of Income 57.6% Chula-Vista-National-City Rental Units By Size of Structure
Single Family (Detached & Attached) 40.3%2-4 Units 10.7%5-9 Units 12.0%10-19 Units 12.5%20 Units+ 24.5% Chula-Vista-National-City Rental Units By Year Built
Before 1970 35.8%1970-1999 50.1%After 2000 14.1%
City-of-San-Diego-Coastal Renter Household Statistics
Percent with Children 16.5%Average Household Size 1.96Median Household Income $60,232
Race (%)
White 67.1%Black 4.8%Asian 3.0%Hispanic (all races) 19.5%All Other Races 5.5%
Education (%)
Less than HS 6.7%HS Diploma 41.5%Bachelor’s Degree 36.1%Graduate Degree 15.7%Rent Burden/Share of Income 44.1%
City-of-San-Diego-Coastal Rental Units By Size of Structure
Single Family (Detached & Attached) 25.1%2-4 Units 14.3%5-9 Units 18.2%10-19 Units 10.1%20 Units+ 32.3% City-of-San-Diego-Coastal Rental Units By Year Built
Before 1970 44.4%1970-1999 44.6%After 2000 11.0%
San Diego Multifamily Market Trends
Page 48
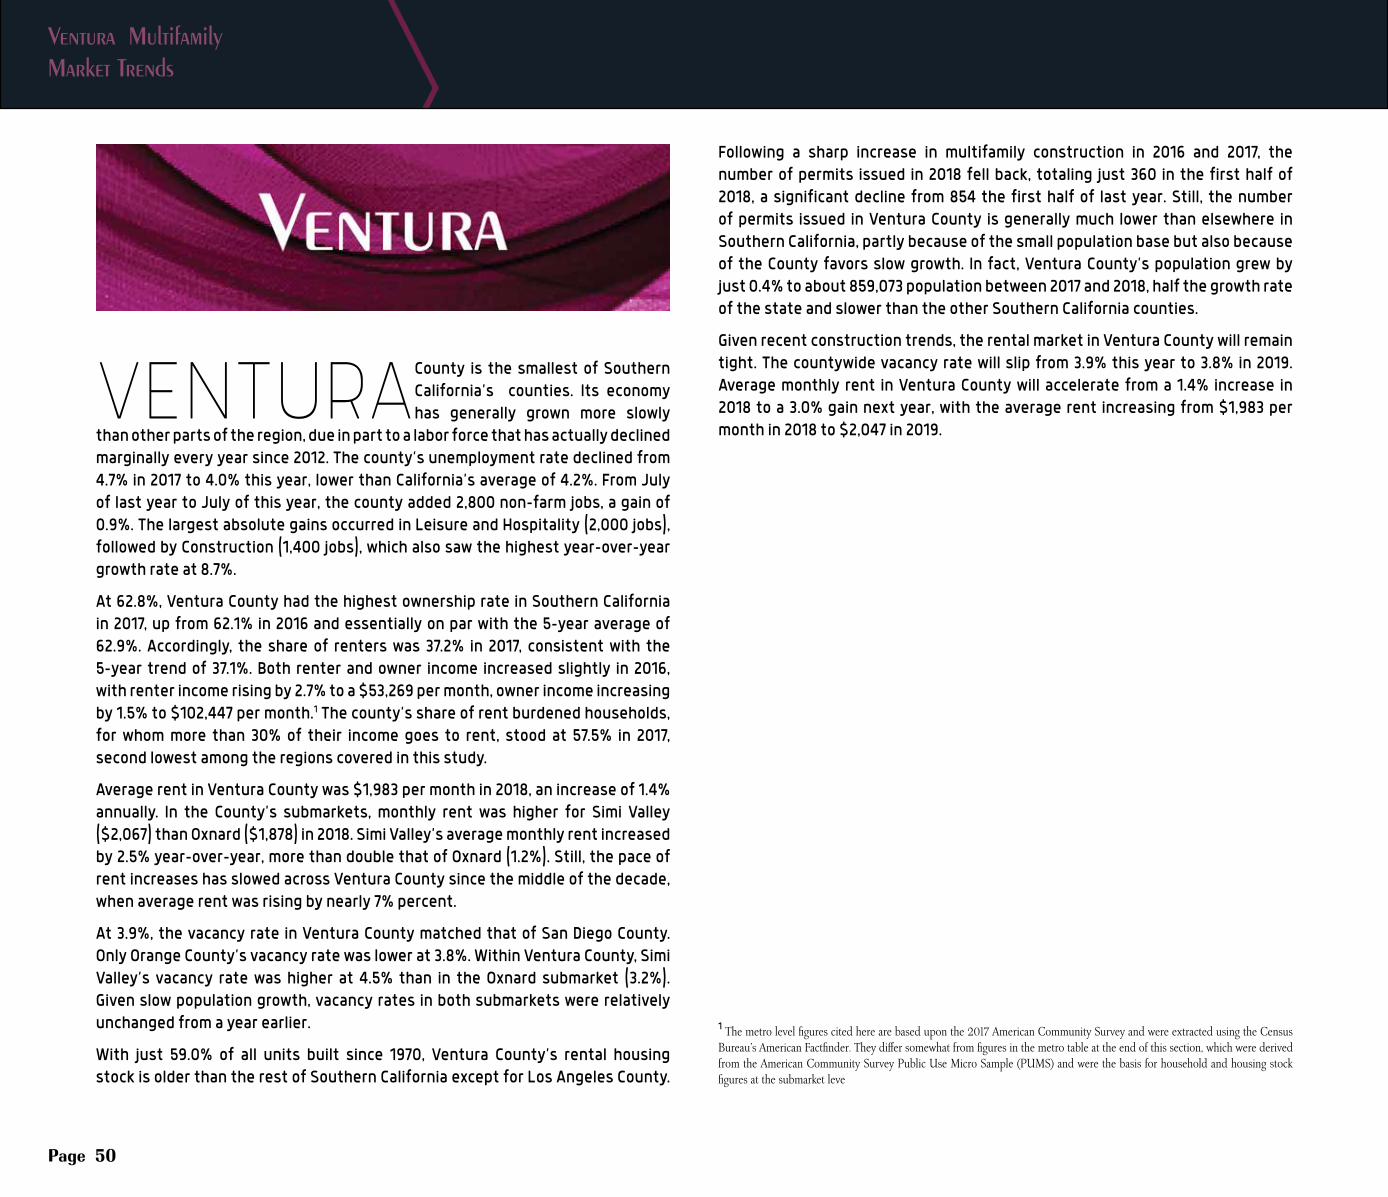
City-of-San-Diego-Inland Renter Household Statistics
Percent with Children 34.7%Average Household Size 2.67Median Household Income $53,914
Race (%)
White 48.2%Black 8.6%Asian 14.8%Hispanic (all races) 23.1%All Other Races 5.2%
Education (%)
Less than HS 13.3%HS Diploma 50.8%Bachelor’s Degree 22.6%Graduate Degree 13.4%Rent Burden/Share of Income 52.7%
City-of-San-Diego-Inland Rental Units By Size of Structure
Single Family (Detached & Attached) 28.9%2-4 Units 11.2%5-9 Units 13.2%10-19 Units 12.2%20 Units+ 34.5% City-of-San-Diego-Inland Rental Units By Year Built
Before 1970 30.7%1970-1999 55.5%After 2000 13.8%
North-County Renter Household Statistics
Percent with Children 45.0%Average Household Size 2.86Median Household Income $55,263
Race (%)
White 53.2%Black 4.4%Asian 6.6%Hispanic (all races) 30.8%All Other Races 5.0%
Education (%)
Less than HS 13.7%HS Diploma 55.3%Bachelor’s Degree 20.4%Graduate Degree 10.6%Rent Burden/Share of Income 55.7%
North-County Rental Units By Size of Structure
Single Family (Detached & Attached) 36.3%2-4 Units 12.9%5-9 Units 13.7%10-19 Units 16.9%20 Units+ 20.2% North-County Rental Units By Year Built
Before 1970 15.2%1970-1999 69.6%After 2000 15.1%

USC Casden Forecast | 2018 Multifamily Report
Page 49
Ventura Multifamily Market Trends
Page 50
VENTURA County is the smallest of Southern California’s counties. Its economy has generally grown more slowly
than other parts of the region, due in part to a labor force that has actually declined marginally every year since 2012. The county’s unemployment rate declined from 4.7% in 2017 to 4.0% this year, lower than California’s average of 4.2%. From July of last year to July of this year, the county added 2,800 non-farm jobs, a gain of 0.9%. The largest absolute gains occurred in Leisure and Hospitality (2,000 jobs), followed by Construction (1,400 jobs), which also saw the highest year-over-year growth rate at 8.7%.
At 62.8%, Ventura County had the highest ownership rate in Southern California in 2017, up from 62.1% in 2016 and essentially on par with the 5-year average of 62.9%. Accordingly, the share of renters was 37.2% in 2017, consistent with the 5-year trend of 37.1%. Both renter and owner income increased slightly in 2016, with renter income rising by 2.7% to a $53,269 per month, owner income increasing by 1.5% to $102,447 per month.1 The county’s share of rent burdened households, for whom more than 30% of their income goes to rent, stood at 57.5% in 2017, second lowest among the regions covered in this study.
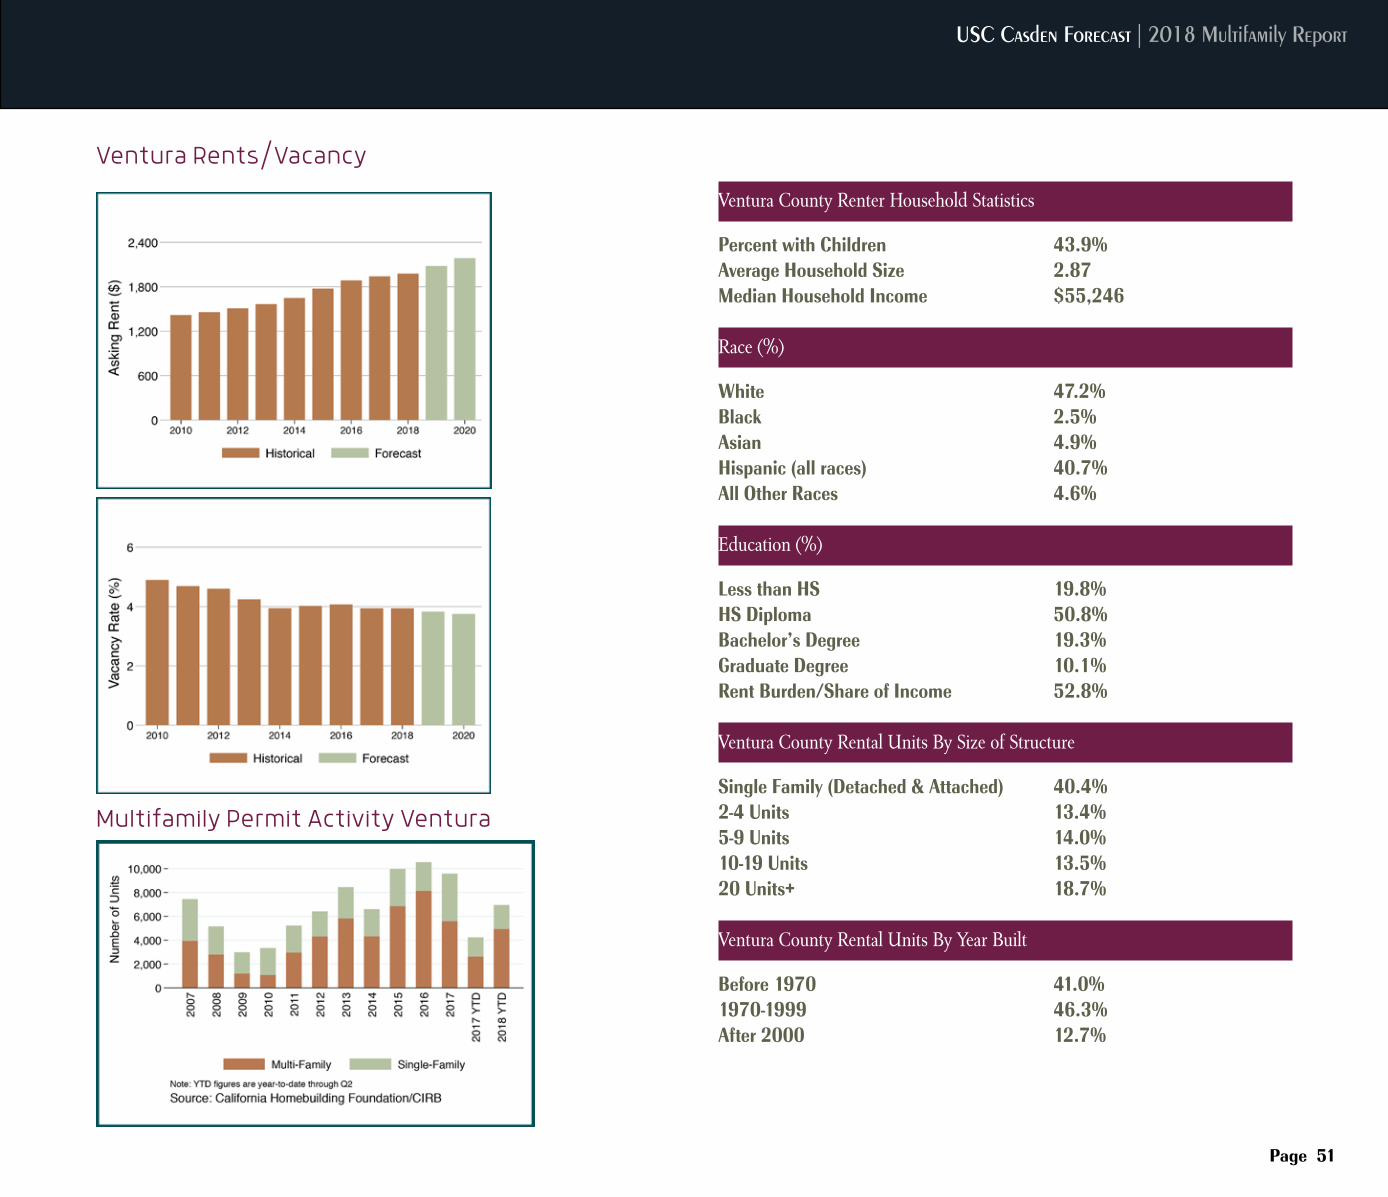
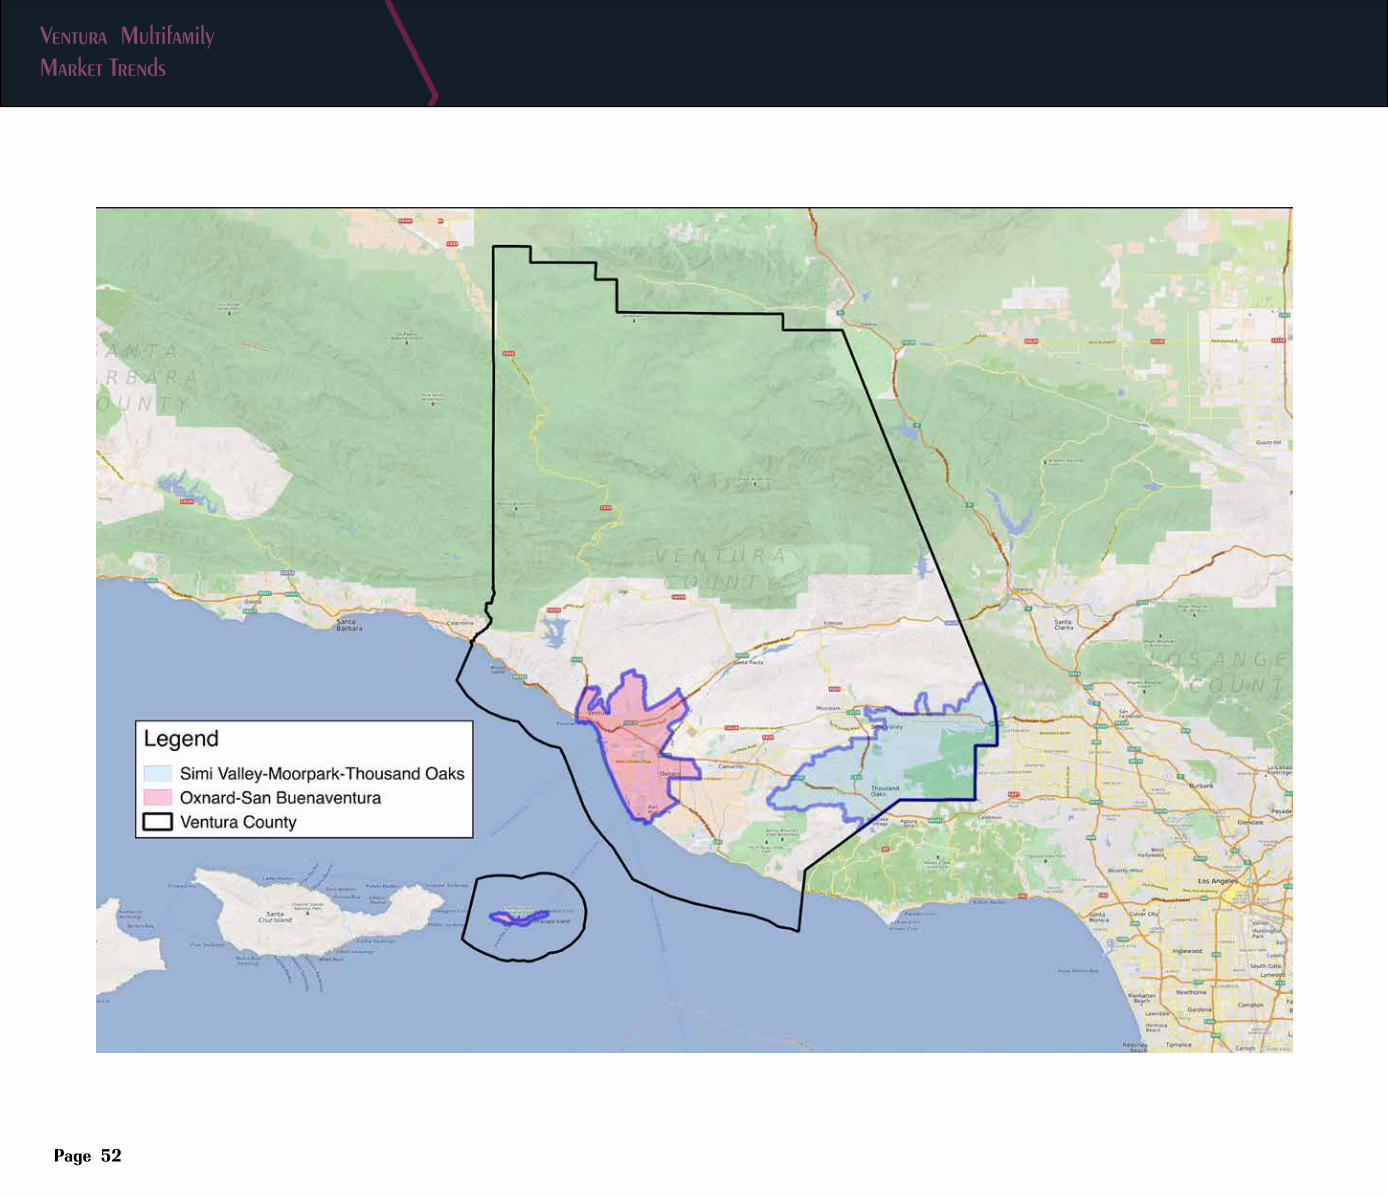
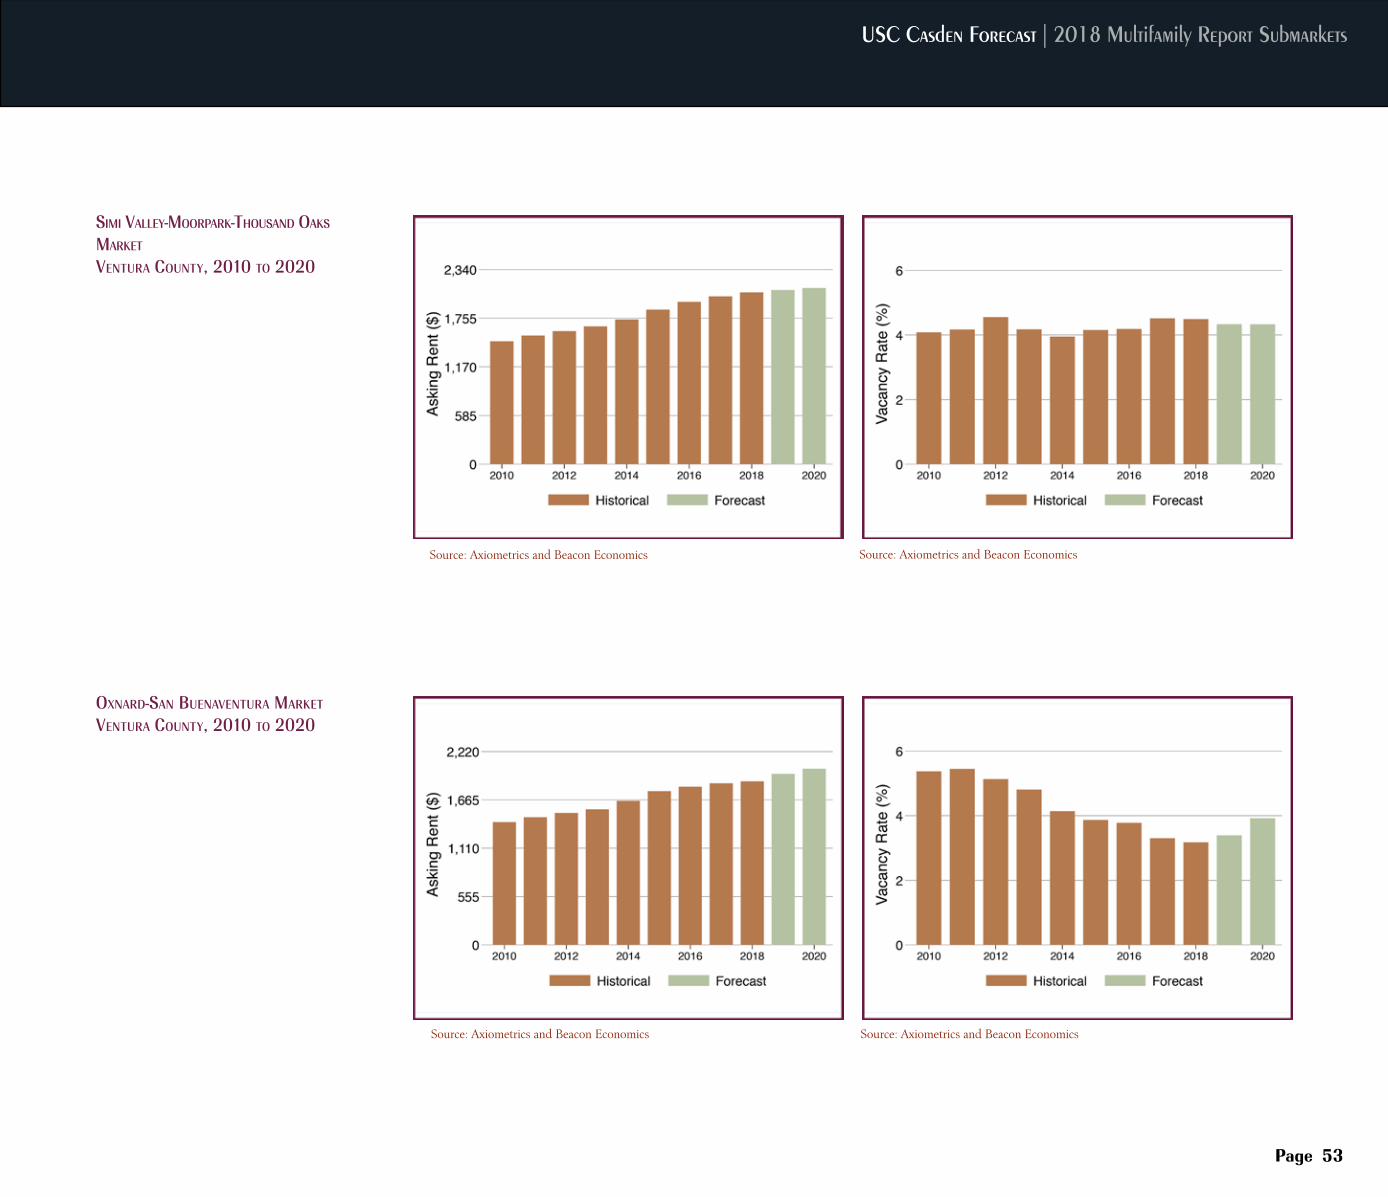
Average rent in Ventura County was $1,983 per month in 2018, an increase of 1.4% annually. In the County’s submarkets, monthly rent was higher for Simi Valley ($2,067) than Oxnard ($1,878) in 2018. Simi Valley’s average monthly rent increased by 2.5% year-over-year, more than double that of Oxnard (1.2%). Still, the pace of rent increases has slowed across Ventura County since the middle of the decade, when average rent was rising by nearly 7% percent.
At 3.9%, the vacancy rate in Ventura County matched that of San Diego County. Only Orange County’s vacancy rate was lower at 3.8%. Within Ventura County, Simi Valley’s vacancy rate was higher at 4.5% than in the Oxnard submarket (3.2%). Given slow population growth, vacancy rates in both submarkets were relatively unchanged from a year earlier.
With just 59.0% of all units built since 1970, Ventura County’s rental housing stock is older than the rest of Southern California except for Los Angeles County.
Following a sharp increase in multifamily construction in 2016 and 2017, the number of permits issued in 2018 fell back, totaling just 360 in the first half of 2018, a significant decline from 854 the first half of last year. Still, the number of permits issued in Ventura County is generally much lower than elsewhere in Southern California, partly because of the small population base but also because of the County favors slow growth. In fact, Ventura County’s population grew by just 0.4% to about 859,073 population between 2017 and 2018, half the growth rate of the state and slower than the other Southern California counties.
Given recent construction trends, the rental market in Ventura County will remain tight. The countywide vacancy rate will slip from 3.9% this year to 3.8% in 2019. Average monthly rent in Ventura County will accelerate from a 1.4% increase in 2018 to a 3.0% gain next year, with the average rent increasing from $1,983 per month in 2018 to $2,047 in 2019.
1 The metro level figures cited here are based upon the 2017 American Community Survey and were extracted using the Census Bureau’s American Factfinder. They differ somewhat from figures in the metro table at the end of this section, which were derived from the American Community Survey Public Use Micro Sample (PUMS) and were the basis for household and housing stock figures at the submarket leve
USC Casden Forecast | 2018 Multifamily Report
Page 51
Ventura Rents/Vacancy
Multifamily Permit Activity Ventura
Ventura County Renter Household Statistics
Percent with Children 43.9%Average Household Size 2.87Median Household Income $55,246
Race (%)
White 47.2%Black 2.5%Asian 4.9%Hispanic (all races) 40.7%All Other Races 4.6%
Education (%)
Less than HS 19.8%HS Diploma 50.8%Bachelor’s Degree 19.3%Graduate Degree 10.1%Rent Burden/Share of Income 52.8% Ventura County Rental Units By Size of Structure
Single Family (Detached & Attached) 40.4%2-4 Units 13.4%5-9 Units 14.0%10-19 Units 13.5%20 Units+ 18.7% Ventura County Rental Units By Year Built
Before 1970 41.0%1970-1999 46.3%After 2000 12.7%
Ventura Multifamily Market Trends
Page 52
Source: Axiometrics and Beacon Economics
Source: Axiometrics and Beacon Economics
Source: Axiometrics and Beacon Economics
Source: Axiometrics and Beacon Economics
USC Casden Forecast | 2018 Multifamily Report Submarkets
Page 53
Source: Axiometrics and Beacon Economics
Source: Axiometrics and Beacon Economics
Source: Axiometrics and Beacon Economics
Source: Axiometrics and Beacon Economics
Simi valley-mooRpaRk-thouSand oakS maRket
ventuRa County, 2010 to 2020
oxnaRd-San BuenaventuRa maRket
ventuRa County, 2010 to 2020
Ventura Multifamily Market Trends
Page 54
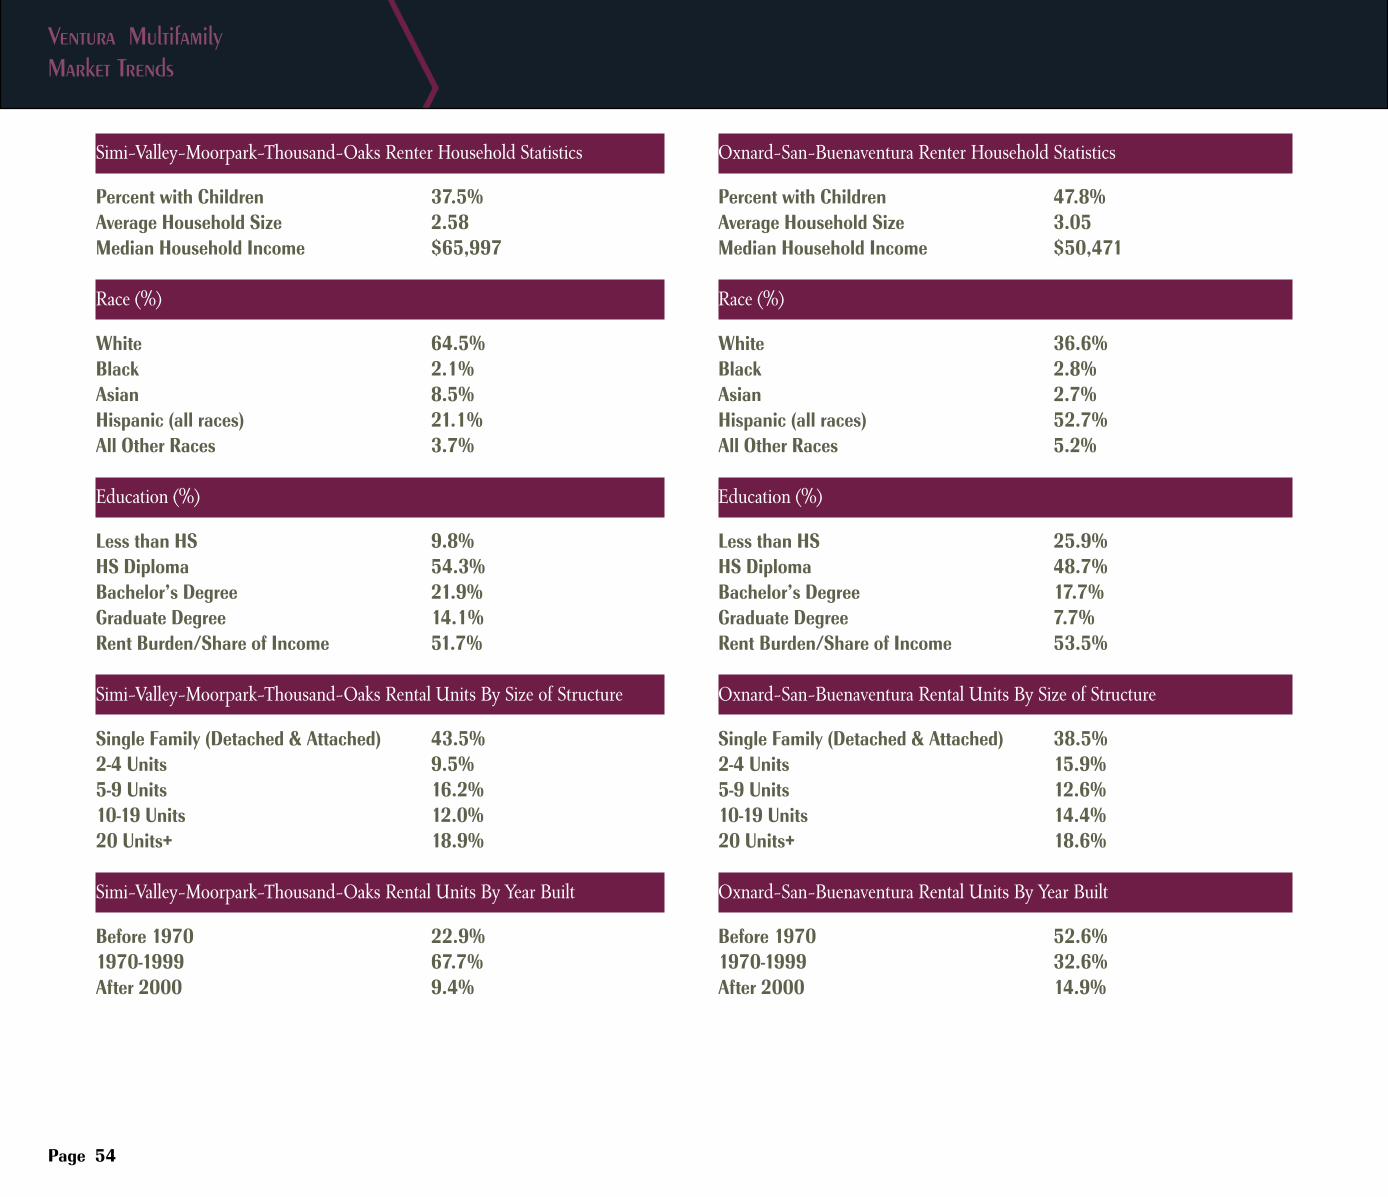
Simi-Valley-Moorpark-Thousand-Oaks Renter Household Statistics
Percent with Children 37.5%Average Household Size 2.58Median Household Income $65,997
Race (%)
White 64.5%Black 2.1%Asian 8.5%Hispanic (all races) 21.1%All Other Races 3.7%
Education (%)
Less than HS 9.8%HS Diploma 54.3%Bachelor’s Degree 21.9%Graduate Degree 14.1%Rent Burden/Share of Income 51.7%
Simi-Valley-Moorpark-Thousand-Oaks Rental Units By Size of Structure
Single Family (Detached & Attached) 43.5%2-4 Units 9.5%5-9 Units 16.2%10-19 Units 12.0%20 Units+ 18.9%
Simi-Valley-Moorpark-Thousand-Oaks Rental Units By Year Built
Before 1970 22.9%1970-1999 67.7%After 2000 9.4%
Oxnard-San-Buenaventura Renter Household Statistics
Percent with Children 47.8%Average Household Size 3.05Median Household Income $50,471
Race (%)
White 36.6%Black 2.8%Asian 2.7%Hispanic (all races) 52.7%All Other Races 5.2%
Education (%)
Less than HS 25.9%HS Diploma 48.7%Bachelor’s Degree 17.7%Graduate Degree 7.7%Rent Burden/Share of Income 53.5%
Oxnard-San-Buenaventura Rental Units By Size of Structure
Single Family (Detached & Attached) 38.5%2-4 Units 15.9%5-9 Units 12.6%10-19 Units 14.4%20 Units+ 18.6%
Oxnard-San-Buenaventura Rental Units By Year Built
Before 1970 52.6%1970-1999 32.6%After 2000 14.9%
USC Casden Forecast | 2018 Multifamily Report
Page 55
Lusk Center White Paper
Page 56
A friend recently shared a telling experience: walking into the grocery store with his 8-year-old this weekend he passed a homeless woman, laying on the ground by
the door, an open wound on her leg. His daughter reacted strongly – demanding that they buy her dinner inside. And they did. My friend told me that but for his daughter’s reaction, he would have walked by, pretending not to see.
This friend is the director of a legal aid program.
In other words, homelessness is so pervasive and persistent in every aspect of daily life in Los Angeles that even those among us focused on providing meaningful solutions to the crisis are now willfully blind to its daily realities and the complete lack of humanity intrinsic in the status quo. And it is about to get so much worse.
Chronic homelessness has many causes, but the recent rise in homelessness has one cause: a
No-Brainer Measure
housing affordability crisis. Reliable estimates show the gap between the supply and demand for affordable rental housing exceeds 600,000 units in Los Angeles. The demographic and economic trends that brought us here are not slowing. Indeed for at least one population – older renters on fixed incomes – they are accelerating. Real efforts to build more affordable housing are underway but years from fruition. In the meantime, more than half of all Los Angelenos turning 65 have less than $10,000 in savings or retirement benefits. How will they afford uncontrolled rent increases? They will not. How will they find affordable, accessible housing? They will not. How will they survive when pushed to the streets? They will not.
I know because I run the legal aid agency tasked by both the City and County of Los Angeles to focus on serving low income seniors and the volume of need is now so severe that we can only accept eviction and illegal rent increase cases where the tenant has
Desperate Times & A
proven to us that they truly have nowhere else to go (no family member’s couch, no church basement, nothing). That is where we live now.
So the arguments against Prop 10 – that it encourages land use by local government instead of regional policy, that it exposes developers to increased regulation, that it dampens profit potential for residential landlords, that it’s legislation by mob rule – are frankly lost on me. This is an emergency. The house is on fire. The long term environmental effects of the fire retardant are not my primary concern. Freeing local government to consider responsible price predictors for vulnerable tenants is far from a complete solution, but at least it is an interim relief of one of the economic drivers of this widespread desperation.
Jessie Kornberg
President & Chief Executive OfficerBet Tzedek
USC Casden Forecast | 2018 Multifamily Report
Page 57
California is in the midst of an unprecedented housing crisis. Skyrocketing costs are crushing California families, who are finding it harder and harder to find a safe, affordable
place to live.
Unfortunately, Proposition 10 is a flawed initiative that would only make our current housing crisis worse. It would lead to less affordable housing being built, create incentives for current landlords to take existing rental properties on the market, and make it harder for those looking for affordable housing.
Top economists from around the country have shown how solutions like those offered by Proposition 10 have failed, time and again. In its analysis of Prop. 10, the state’s nonpartisan legislative analyst warns that Prop. 10 could hurt homeowners by driving down property values. That’s because Prop. 10 would open the door to caps on single family homes, as well as radical rent control proposals that would keep price controls in place, even after a tenant moves out.
It could also put new pressures on the housing market, and on state and local governments which could see a shortfall of up to hundreds of millions of dollars if Prop. 10 is passed. That means less money for key public services like education, healthcare and public safety, and more pressure to increase taxes to make up the shortfall.
What’s worse, studies show that most of the economic benefits of Proposition 10 would go to high-income earners, and that the measure could
actually disproportionately hurt those who are looking for rental housing.
Proponents of Proposition 10 want to say the measure is simply about local control, but it’s not cities and counties that will be empowered if the measure passes. Proposition 10 empowers special interests to push local ballot measures that could radically restrict, regulate and control rents on single-family homes as well as multi-unit buildings. These caps could persist even after a tenant moves out.
We’ve already seen these efforts in communities around the state, and California voters should we wary of handing control over California’s housing stock to activists who will only circumvent the wishes of local elected officials and wind up making our housing crisis worse.
California’s housing situation is a crisis that needs to be addressed. Two measures on the ballot – Propositions 1 and 2 – actually provide real solutions that will help provide housing to those who need it most. But the first step in any crisis is to make sure we don’t make it worse. Unfortunately, making it worse is exactly what Proposition 10 would do.
Proposition 10: A Flawed Initiative
Barry S. Altshuler Executive Vice President, Investments
Equity Residential
Page 58
Multifamily Market Trends
Technical Notes© 2018 University of Southern California, Casden Real Estate Economics Forecast
Overall DisclaimerSome of the data in this report was gathered from third party sources and was not independently verified. Neither Beacon Economics nor the Casden Forecast make any warranties or representations as to the completeness or accuracy thereof.
MethodologyStatistics reported in this year’s USC Casden Forecast are based on data provided by the U.S. Census and RP Axiometrics LLC. Multifamily housing statistics reflect data for structures with 5 or more units, unless otherwise noted.
Beacon Economics utilized the Public Use Microdata Sample of the 2000 U.S. Census Decennial and the Public Use Microdata Sample of the Census U.S. Census American Community Survey 1-Year estimates from 2007 to 2015. Historic trends for every metropolitan area and for every submarket are derived by incorporating the corresponding statistics as estimated by RP Axiometrics LLC.
Beacon Economics used regression models to estimate the number of multifamily renter housing units, rents, and vacancy rates.
The forecast presented in this report uses standard time-series econometric techniques based on historical correlations and forecasts of future economic trends. Beacon Economics used a dynamic panel econometric regional model for each metropolitan area in Southern California using macro trends to create a local forecast that delivers a broad outlook for the region including rents and vacancy rates for multifamily renter-occupied housing units.
Page 59
USC Casden Forecast | 2017 Multifamily Report
Page 59