Embed Size (px)
Citation preview
Paid Family and Medical Leave in Pennsylvania:
Research Findings Report
November 14, 2017
Pennsylvania Department of Labor & Industry
Center for Workforce Information & Analysis
2
Acknowledgements
Community Legal Services of Philadelphia Janet Ginzberg and Nadia Hewka
Keystone Research Center Stephen Herzenberg and Mark Price
PathWays PA Marianne Bellesorte
PA AFL-CIO Richard Bloomingdale and Samantha Shewmaker
PA Chamber of Business and Industry Alex Halper
PA Department of Aging Steven Horner
PA Department of Health Jennifer Dugan, Lauren Hughes, Loren Robinson, and Sara Thuma
PA Department of Human Services Jennifer DeBell and Charles Tyrrell
PA Office of the First Lady, PA Commission for Women Andrea Mead and Catherine Stetler
Women and Girls Foundation Heather Arnet
Women’s Law Project Terry Fromson
This workforce product was funded by a grant awarded by the U.S. Department of Labor’s Employment and Training
Administration. The product was created by the grantee and does not necessarily reflect the official position of the U.S.
Department of Labor. The U.S. Department of Labor makes no guarantees, warranties, or assurances of any kind, express
or implied, with respect to such information, including any information on linked sites and including, but not limited to,
accuracy of the information or its completeness, timeliness, usefulness, adequacy, continued availability, or ownership. This
product is copyrighted by the institution that created it.
3
Table of Contents
Background and Purpose 4
Defining the Model: What Is a Paid Family and Medical Leave Insurance Fund? 6
Key Research Findings 9
PA Cost-Benefit Analyses of a Paid Family Leave Program 12
Simulating Other State Paid Family Leave Models to Pennsylvania 24
Opinion Research: Population Viewpoints 27
Opinion Research: Employer Viewpoints 29
Advisory Board 32
Table Listing 33
Appendix A: Other States’ Paid Family Leave Programs and Research 34
Appendix B: Full Report on Cost, Leave and Length Estimates 40
Appendix C: Pennsylvania’s Grant Proposal Narrative 53
Resources and Suggested Readings 58
Endnotes 60
4
Background and Purpose
As the American workforce has changed considerably in the last 40 years, workplace policies have
been slow to evolve to serve a growing and diverse population. Between March 1975 and March
2000, the labor force participation rate of women with children under 18 increased from 47.4% to
72.9%.i From 1960 to 2015, the share of children under 18 living with two married parents fell
from 88% to 65%.ii There are now an estimated 40.4 million unpaid caregivers of adults 65 and
over, nine of 10 of which care for an aging relative.iii
Studies show that paid leave is an important factor in employee recruitment and retention. A 2011
survey of 200 human resource managers found that two-thirds named supportive work-family
policies as the most important factor in recruiting and retaining employees.iv
Although the United States still does not have a federal paid family and medical leave program,
Presidential Advisor Ivanka Trump has promoted the establishment of a paid leave program,
saying that it “isn’t an entitlement, it’s an investment in America’s working families.” Several
states have developed their own systemic solutions to this issue that inhibits economic growth and
places stress on workers and families. California, Washington, New York, New Jersey, Rhode
Island, and Washington D.C. have all passed legislation developing state Paid Family and Medical
Leave Insurance Funds. In August 2016, the Pennsylvania Department of Labor & Industry was
awarded a $250,000 grant from the U.S. Department of Labor to research and analyze the
implications of a state paid family and medical-leave program in our state.
The state insurance funds already passed by five states and Washington, D.C. ensure small
businesses can compete with large companies to recruit and retain top tier talent. Because many
companies located in Pennsylvania also conduct business and have corporate locations (and
employees) in these other Northeast states, it makes financial and competitive sense for our state
to explore the possibility of developing a similar state-level paid family and medical leave
insurance fund so that our state can remain competitive.
A 2014 report from the Pennsylvania Center for Women and Politics at Chatham Universityv notes
that Pennsylvania is one of the more populous states that offer no family-leave protections other
than those afforded by federal law, leaving workers and their families with fewer protections than
their peers in many other states.
In Pennsylvania, workplace policies that provide support to those who care for aging family
members is especially important. The Commonwealth has the fourth oldest population and the
fifth most residents over age 65. While the federal Family and Medical Leave Act (FMLA)
guarantees unpaid time off to care for a new child or ill family member, it only covers about 60
percent of all workers and it only provides unpaid leave. Five states (California, New Jersey,
Rhode Island, New York, and Washington) have enacted paid family and medical leave laws that
can serve as models for other state efforts. This grant supports activities to determine options for
paid family leave in Pennsylvania.
5
This grant-funded project included several components resulting in the following outputs:
1) A report of findings from a statistical analysis on the populations likely to benefit from
adoption of a paid family leave program and anticipated utilization rates using national
model legislation and other state models deemed viable in Pennsylvania.
2) A report of findings from a cost-benefit analysis of paid family leave programs utilizing
different cost variations.
3) A report on the results of a survey of Pennsylvania businesses that include employers’
perspectives of paid leave programs, what types of paid family leave employers currently
provide, characteristics of the population who benefit from paid leave, and feedback from
employers who presently benefit from offering paid leave programs.
4) A report on the results of a survey of the general population that includes views toward
paid family leave programs, willingness to support/fund programs, preferred plan
elements, and attitudes toward specific paid leave messaging.
5) Establishment of an advisory group comprised of representatives from the Governor’s
Office, relevant state agencies, PathWays PA, Community Legal Services of Philadelphia,
the Pennsylvania Chamber of Business & Industry, the Women’s Law Project, the Women
and Girls Foundation, Keystone Research Center and other stakeholders identified during
project implementation. Advisory group members informed the scope and breadth of the
grant analysis as well as this final report.
6
Defining the Model: What Is A Paid Family & Medical Leave Insurance
Fund?
The birth of a child. A cancer diagnosis or hip replacement. A parent, spouse or child with a serious
illness. Each requires a worker to take an extended period of time off from work. And while almost
everyone will experience this type of event in his or her work life, Pennsylvanians do not have a
guarantee of paid parental or medical leave.
However, Pennsylvania can look to California, Washington, New York, New Jersey, Rhode Island,
and Washington D.C., which have all passed legislation developing state Paid Family and Medical
Leave Insurance Funds. These funds represent a distinctly new and different model to provide paid
leave to employees and employers than past legislative efforts in several ways.
Paid Family and Medical Leave Insurance (PFMLI) Funds do not require employers to
bear all expenses for their employees’ family and medical leave. Instead, existing PFMLI
programs are financed primarily through employee payroll deductions of 0.4% to 1.2% of
employee wages. (In Washington D.C. and New Jersey a combination of employee and employer
payroll contributions are utilized). The development of state insurance funds benefits small
businesses that cannot afford to offer such a benefit on their own. These funds have proven to be
effective and popular models to provide paid family and medical leave to broad populations of
employees and employers throughout a state.
If Pennsylvania agencies, public health advocates, and legislators look to develop the details of
such a program, they will need to explore the costs and benefits of different aspects of the fund.
There are many variables to be considered, including: maximum weeks of leave; weekly salary
cap; wage replacement rate; and waiting period. The Cost-Benefit Analyses included in this report
explore several scenarios for each of these. While there are many variables to be considered, the
basic programmatic model recommended is the same, a Paid Family and Medical Leave Insurance
Fund.
What is a Paid Family and Medical Leave (PFML) insurance fund?
A paid family and medical leave insurance (PFML) fund provides all eligible workers with the
ability to earn a portion of their pay while they take time off work for up to a certain number of
weeks to:
• Care for a family member with a serious health condition (including but not limited to
parents, children, spouses, domestic partners, and siblings in need of care);
• Care for a newborn, newly-adopted child, or newly-placed foster child; or
• Address the worker’s own serious health condition.
7
With a PFML program, which workers have access to paid leave? Under the PFML programs in other states, workers have access to paid leave regardless of gender.
The programs cover most or all private-sector employers, and self-employed individuals can opt-
in.
As outlined in the population survey (see page 20 of this report) a strong majority of
Pennsylvanians support funding a Paid Family and Medical Leave Insurance Fund through a
modest payroll deduction if that fund provides all workers with access to several weeks of paid
family and medical leave.
What are some examples of times when workers might need to access the Paid Family and
Medical Leave insurance fund (PFML)?
• A new infant arrives and the worker needs time to care and bond
• A veteran and his/her family are struggling with PTSD
• An elderly parent has broken a hip and needs a few weeks of post-op support
• A sibling needs several weeks of chemotherapy
• A spouse is recovering from a heart attack
• A child with autism or asthma is having a health crisis
• A loved one is coming home from a rehabilitation clinic and needs support and care
• A worker has a serious injury as a result of an automobile accident and is in need of several
weeks of rehabilitation services
Which states have PFML insurance fund programs now and how are they funded?
California, New Jersey, and Rhode Island have implemented paid family leave laws, and similar
implementation will begin in New York in 2018. Washington and the District of Columbia also
recently passed laws. Maryland, Massachusetts, and Connecticut are in the process of exploring
how to develop state programs. All of these are insurance-based programs paid for by small payroll
contributions.
What are the advantages to employers?
Ten years of analysis from the California paid family leave program indicates that businesses have
saved money due to lower rates of employee turnover. Businesses of all sizes reported positive
outcomes, but small businesses – those with fewer than 50 employees – reported the most positive
effects.vi
What are the advantages to workers and families?
Paid family and medical leave allows workers time to address their own serious health conditions
and to tend to their family caregiving responsibilities – including caring for a spouse or an aging
parent – without risking financial instability. Research demonstrates that when workers have
access to paid family and medical leave, the health and well-being of parents and children is
improved. Having access to paid leave also means that families are less likely to use public
assistance.vii
8
Does Pennsylvania need PFML?
➢ Workers in Pennsylvania invest 1.4 billion hours of unpaid time caring for the elderly each
year. Pennsylvania has one of the oldest populations in the nation, and the state’s aging
population is expected to continue growing.viii
➢ Fewer than half of working adults in Pennsylvania – 40.9% – are both eligible for and can
afford to take unpaid leave under the Family and Medical Leave Act (FMLA). ix
➢ Twenty-one percent of Pennsylvanians do not have the resources to survive up to three
months of sustained loss of income.x
➢ Pennsylvania is one of the 10 worst states for pregnancy discrimination.xi
9
Key Research Findings
While ample national data exists, members of the Pennsylvania General Assembly will surely look
to state-specific data in considering the development of paid family leave legislation. The various
outputs resulting from this grant will provide that Pennsylvania-specific information. The goal of
this project is to research both viable options for, and impacts of, a Pennsylvania paid family leave
program to inform policy and legislative initiatives to provide paid leave benefits for workers in
the Commonwealth.
Key grant-funded research findings include:
There is strong public support for a statewide program to guarantee access to paid family
and medical leave (78% favor, 64% strongly favor). ● Across gender, age, educational attainment level, household income level, marital status,
parental status, multigenerational households, and employment status, Pennsylvania adults
strongly favor the program.
● With and without contextual information about PFML, a majority of Pennsylvania adults
believe it is very important for Pennsylvania to establish a program to guarantee access to
paid family and medical leave.
A majority of employers favor creating a statewide program to provide paid family and
medical leave to employees (56% favor, 35% strongly favor). ● More than two-thirds (69%) of employers currently do not offer paid family and medical
leave to their employees. Of those who do not offer leave, a majority cite the financial
burden offering such leave would have on their companies as the primary barrier to offering
wage reimbursement to their employees.
● The smaller the business, the less likely it is to offer paid leave to its employees.
● These findings reinforce how a state paid family leave insurance fund could relieve cost
burdens from employers and provide an affordable way for all businesses to provide an
important benefit to their employees.
In states without PFML, individual workers and employers bear the majority of the costs. ● When there is no national or state paid leave plan in place, employers must find a way to
finance paid leave plans on their own.
● While large corporations can afford to offer these competitive benefit packages to their
employees, small and mid-size companies cannot afford these plans on their own, putting
main street businesses at a significant disadvantage.
● When employers cannot afford to offer paid leave programs, workers struggle financially
on unpaid leave, or struggle with the extra duty of caregiving while working, which can
greatly affect job productivity.
This project also finds, based on data analysis and literature review, that the establishment of a
state Paid Family and Medical Leave Insurance Fund could result in the following crucial benefits
to the employers, workers, and families of the Commonwealth:
10
Reduced individual costs to workers and employers ● By spreading costs across the entire covered PA workforce, state paid family and medical
leave insurance funds remove the pay burden from employers while leveling the playing
field for small and mid-size companies to retain talent.
● The cost analysis in this report finds that the average annual cost per covered worker ranges
from $123 to $281 per year (based on a worker who earns $35,000 per year). The payroll
contribution rate ranges from 0.672 of one percent to 0.295 of one percent for covered
workers.
Increased job retention. ● A survey of 253 employers affected by California’s paid family leave initiative found that
more than 90% reported either no noticeable or a positive effect on profitability, turnover,
and morale. xii
● Parents with access to paid leave “are 93% more likely to be working at 9‐12 months post-
partum than are those who did not take any leave.” xiii
● 89% of U.S. fathers indicated it was important for employers to provide paid paternity or
paid parental leave (with 60% rating it very/extremely important).xiv
Benefits for small-to-mid-size businesses. ● In Pennsylvania, nearly 95% of business establishments employ fewer than 50 workers.
● Small businesses often have trouble matching the more generous leave benefits offered by
larger employers, sometimes resulting in a hiring disadvantage. When paid leave is
administered through a paid leave insurance program, small businesses benefit in particular
because the cost of leave is shared.
● In California, although all employers reported positive outcomes overall, small- and
medium-sized businesses (those with fewer than 50 employees and those with 50 to 99
employees) reported the most positive outcomes, even more than larger businesses (100+
employees).xv
Decreased infant & maternal mortality rates. ● Several studies have shown paid leave is connected to a range of health benefits including
reduced rates of postpartum depression, increased breastfeeding and routine infant
checkups and immunizations. Fathers, too, stand to gain, with some research suggesting
they develop stronger bonds with their children when they can afford to stay home.
Increased elder care from and for family members and support for caregivers. ● Pennsylvania has one of the oldest populations in the country. Nearly 25% of
Pennsylvania’s population are aged 60 and older; with 300,000 aged 85 and older.
● Nationally, 78% of seniors living at home and in need of care depend on family and friends
as their only source of support.xvi
● A 2010 MetLife study, that include the University of Pittsburgh, indicated that 60% of
family caregivers in the U.S. are employed.xvii
● Adults receiving care from their families report better health outcomes from a variety of
conditions, including heart attacks and strokes.xviii
11
Help families struggling with the opioid crisis. ● Families across the Commonwealth continue to face the effects of the recent opioid
epidemic. Nationally, more than 70 percent of employers say they have been affected by
prescription drug use among their employees.xix
● People struggling with addiction need time away from work in order to seek treatment, yet
most do not have access to paid medical leave.
● The opioid epidemic also affects family members who are not using the drug, as the burden
of caring for an addicted loved one or their children often falls on family members.
● The immediate weeks after being discharged from rehabilitation clinics can be the most
dangerous. Individuals often overestimate the amount of drugs their bodies can withstand.
If they do not have a family member available during this time, they may relapse and
disregard their lowered tolerance. This tragically often results in fatal overdoses.
● Increasing access to paid family and medical leave to more workers can result in more
families having the support they need during times of treatment and recovery, and help
decrease overdose deaths.
Reduced income inequality ● Women, low-wage workers and people of color are among those most disadvantaged by
the current lack of employer-paid leave.xx
● Women who are family caregivers are 2.5 times more likely than non-caregivers to live
in poverty and five times more likely to receive Supplemental Security Income (SSI).xxi
● Increasing access to paid family leave can help increase job retention rates and decrease
the gender wage gap.xxii
Reduced use of public assistance and subsidies. ● When workers do not have access to paid family or medical leave, and a new infant arrives
or family illness occurs, the financial consequences are that a worker will lose their job or
take unpaid family leave. This often results in that worker being paid in public dollars,
most directly in the form of public assistance. According to a 2000 survey of family leave‐taking, almost one‐ tenth of workers using unpaid FMLA leave after the birth of a child
used public assistance during their leave.xxiii
● A replacement rate “sliding scale” model is often implemented to ensure a state insurance
fund is accessible to low-income workers. The state can receive maximum benefit from
helping workers remain economically independent from public subsidies if all workers can
be supported by the wage replacement model of the PFML.
12
PA Cost-Benefit Analyses of a Paid Family Leave Program
Currently, in states without paid family and medical leave programs, the costs associated with
taking time off from work for a serious own-health condition, to bond with a new child, or to care
for an ill relative are shouldered by the individuals that take those leaves and their employers. In
2016, only 14% of all U.S. workers had access to paid family leave from their employers, 38%
had access to short-term disability leave, and 68% had paid sick leave.xxiv Low-wage workers,
young people, people of color, and workers at small employers, are the most disadvantaged by the
lack of a universal paid leave program, because they are the least likely to be covered by these
forms of wage replacement.xxv Women currently are more likely to take time off, and to take longer
time off to have and bond with a child or to care for an ill relative than men.xxvi The lack of paid
leave policies also places them at a relative disadvantage and is a relevant factor which increases
the gender wage gap.
If a statewide paid leave program were implemented, then the cost of covered wages would be
spread across the workforce, with paid leave made available to all workers that meet eligibility
requirements. While paid family leave would not cover all lost wages, workers would have more
income replaced than they do currently. Also, employers would not bear the full cost of providing
paid leave, allowing small businesses the ability to offer benefits to their employees that are often
affordable only for large businesses.
As part of this grant-funded project, a cost-benefit report by Professors Randy Albelda and Alan
Clayton-Matthews (ACM) estimated the cost of benefits paid, number of leaves, leave lengths by
gender, and the percent of workers with wage-replacement for family and medical leaves in
Pennsylvania currently and with four program possibilities of a paid leave program. The four
program variations differ from each other in terms of weekly benefit cap (ranging from $995 to
$573), maximum weeks of leave (ranging from 26 to 12 weeks), wage replacement rate (ranging
from 90% to 60% of weekly wage) and waiting period (from no waiting period to one week).
Using the ACM/IWPR paid family and medical leave simulator, key findings include:
Costs
• The average annual cost per covered worker (which could be paid by employees,
employers or shared between employees and employers) ranges from a high of $281 per
year to $123, not including administrative costs. The payroll contribution rate ranges from
0.672 percent to 0.295 percent for covered workers.
• The average weekly cost per worker ranges from $5.20 to $2.37 a week. The contribution
someone would pay who is earning the median weekly wages in Pennsylvania ($673)
ranges from $4.53 to $1.98 a week.
• Generally speaking, the higher the benefit cap and replacement rate, the lower number of
waiting period days, and the longer the maximum weeks allowed, the higher the cost of the
program.
13
Leaves taken
• Currently 12.5 percent of all employees currently take any leave for a family or medical
reason each year and if state paid family and medical leave were made available we
estimate that would increase to between 12.8 and 12.9. Between 3.5 percent and 4.1 percent
of all employees in the state would use a program annually.
• The majority of all leaves taken currently (and under each of the four program variations)
are for own-health reasons (61 percent are for non-pregnancy own-health leaves and 7
percent for pregnancy). Twenty-five percent of leaves taken are to care for an ill-relative,
with 7.5 percent for bonding with a new child. This does not change with any of the
programs.
• Less than one out of every three leavers would use a paid leave program. Reasons why are:
most leaves are short (currently the median leave is 3 weeks; lack of knowledge of the
program; workplace culture; better wage replacement from an employer; or difficulty using
the program.
Length of leaves
• Currently, the average length of leaves is 6.5 weeks for all leaves. The median length of
leave currently is 3 weeks. The average total length of leave increases by 1.3 weeks to 1.7
weeks (6.5 to 8.5 days) with a program in place, increasing the median total length of all
leaves to 4 weeks.
• The average length of all leaves for those using a program ranges from 8.3 weeks to 10.5
weeks, with pregnancy-related leaves being the longest (10.2 to 15.1 weeks) and ill-relative
leaves being the shortest (about 3 weeks).
• Average program leave lengths for own-health, non-pregnancy related leaves are about the
same length for men and women, however, women on average take longer new child leaves
(about 4.5 weeks for men compared to 9 weeks for women) and only slightly more time
for ill-relative leaves than men.
Wage replacement by work characteristic
• Currently, 70.4 percent of Pennsylvania workers get some form of wage replacement
(including paid sick days, vacation time, short term disability insurance, or paid family
leave) for some of the time they are on a family or medical leave. This increases to between
78.6 percent and 80.0 percent once a paid leave program is in place.
• Currently, workers that are more likely to receive some form of wage replacement include
men, white workers, workers ages 45-64, higher income and higher waged workers, and
workers in large firms.
• With all of the programs, the gap remains but is sharply narrowed for many workers. The
gap is closed in the case of men and women while remains wide for young workers (ages
16-24) and workers with family income below the federal poverty level.
14
Cost Benefit Analysis Highlights
Albelda and Clayton Matthews generate their cost benefit analysis estimates using the model
described in Box 1. This sub-section of this report is an abridged version of the Albelda and
Clayton-Matthews report to the state (refer to Appendix B).
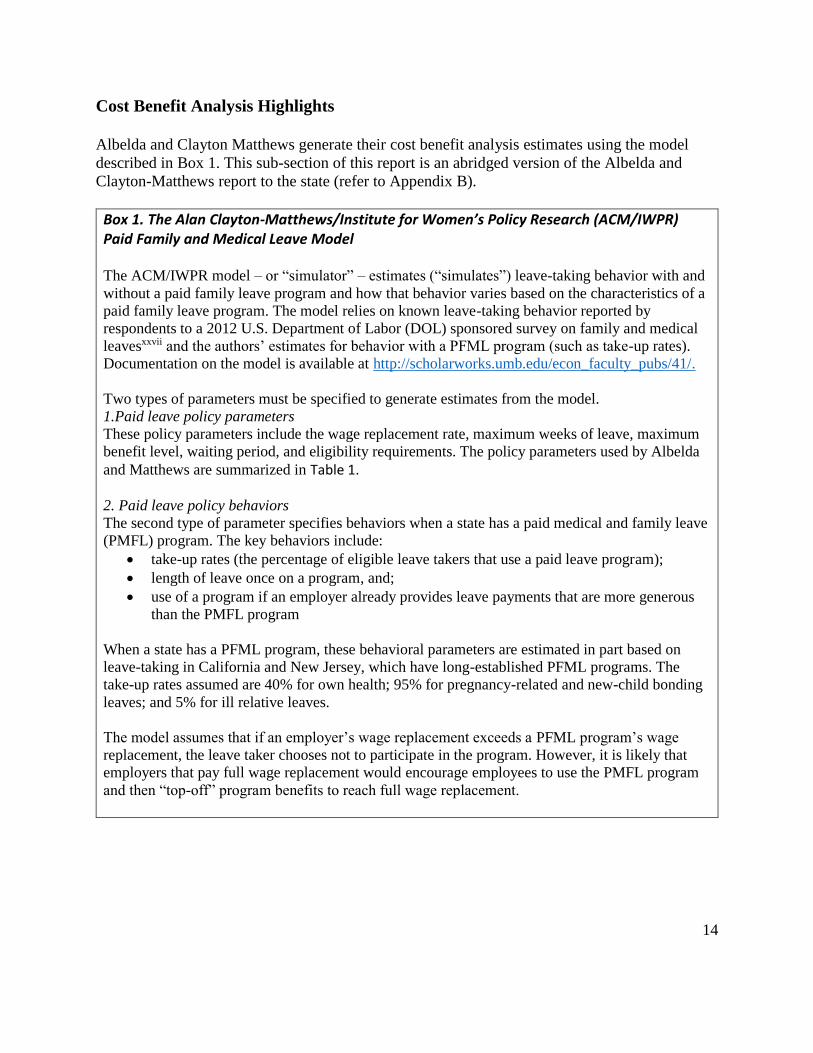
Box 1. The Alan Clayton-Matthews/Institute for Women’s Policy Research (ACM/IWPR) Paid Family and Medical Leave Model The ACM/IWPR model – or “simulator” – estimates (“simulates”) leave-taking behavior with and
without a paid family leave program and how that behavior varies based on the characteristics of a
paid family leave program. The model relies on known leave-taking behavior reported by
respondents to a 2012 U.S. Department of Labor (DOL) sponsored survey on family and medical
leavesxxvii and the authors’ estimates for behavior with a PFML program (such as take-up rates).
Documentation on the model is available at http://scholarworks.umb.edu/econ_faculty_pubs/41/.
Two types of parameters must be specified to generate estimates from the model.
1.Paid leave policy parameters
These policy parameters include the wage replacement rate, maximum weeks of leave, maximum
benefit level, waiting period, and eligibility requirements. The policy parameters used by Albelda
and Matthews are summarized in Table 1.
2. Paid leave policy behaviors
The second type of parameter specifies behaviors when a state has a paid medical and family leave
(PMFL) program. The key behaviors include:
• take-up rates (the percentage of eligible leave takers that use a paid leave program);
• length of leave once on a program, and;
• use of a program if an employer already provides leave payments that are more generous
than the PMFL program
When a state has a PFML program, these behavioral parameters are estimated in part based on
leave-taking in California and New Jersey, which have long-established PFML programs. The
take-up rates assumed are 40% for own health; 95% for pregnancy-related and new-child bonding
leaves; and 5% for ill relative leaves.
The model assumes that if an employer’s wage replacement exceeds a PFML program’s wage
replacement, the leave taker chooses not to participate in the program. However, it is likely that
employers that pay full wage replacement would encourage employees to use the PMFL program
and then “top-off” program benefits to reach full wage replacement.
15
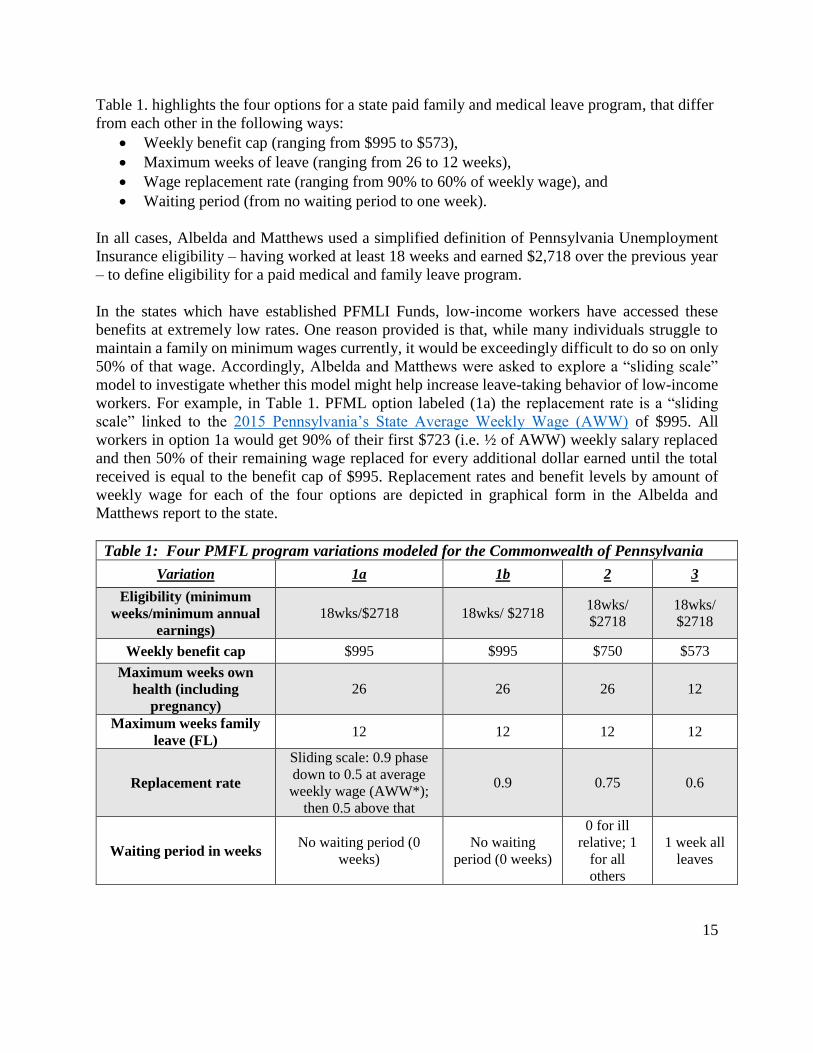
Table 1. highlights the four options for a state paid family and medical leave program, that differ
from each other in the following ways:
• Weekly benefit cap (ranging from $995 to $573),
• Maximum weeks of leave (ranging from 26 to 12 weeks),
• Wage replacement rate (ranging from 90% to 60% of weekly wage), and
• Waiting period (from no waiting period to one week).
In all cases, Albelda and Matthews used a simplified definition of Pennsylvania Unemployment
Insurance eligibility – having worked at least 18 weeks and earned $2,718 over the previous year
– to define eligibility for a paid medical and family leave program.
In the states which have established PFMLI Funds, low-income workers have accessed these
benefits at extremely low rates. One reason provided is that, while many individuals struggle to
maintain a family on minimum wages currently, it would be exceedingly difficult to do so on only
50% of that wage. Accordingly, Albelda and Matthews were asked to explore a “sliding scale”
model to investigate whether this model might help increase leave-taking behavior of low-income
workers. For example, in Table 1. PFML option labeled (1a) the replacement rate is a “sliding
scale” linked to the 2015 Pennsylvania’s State Average Weekly Wage (AWW) of $995. All
workers in option 1a would get 90% of their first $723 (i.e. ½ of AWW) weekly salary replaced
and then 50% of their remaining wage replaced for every additional dollar earned until the total
received is equal to the benefit cap of $995. Replacement rates and benefit levels by amount of
weekly wage for each of the four options are depicted in graphical form in the Albelda and
Matthews report to the state.
Table 1: Four PMFL program variations modeled for the Commonwealth of Pennsylvania
Variation 1a 1b 2 3
Eligibility (minimum
weeks/minimum annual
earnings)
18wks/$2718 18wks/ $2718 18wks/
$2718
18wks/
$2718
Weekly benefit cap $995 $995 $750 $573
Maximum weeks own
health (including
pregnancy)
26 26 26 12
Maximum weeks family
leave (FL) 12 12 12 12
Replacement rate
Sliding scale: 0.9 phase
down to 0.5 at average
weekly wage (AWW*);
then 0.5 above that
0.9 0.75 0.6
Waiting period in weeks No waiting period (0
weeks)
No waiting
period (0 weeks)
0 for ill
relative; 1
for all
others
1 week all
leaves
16
Costs
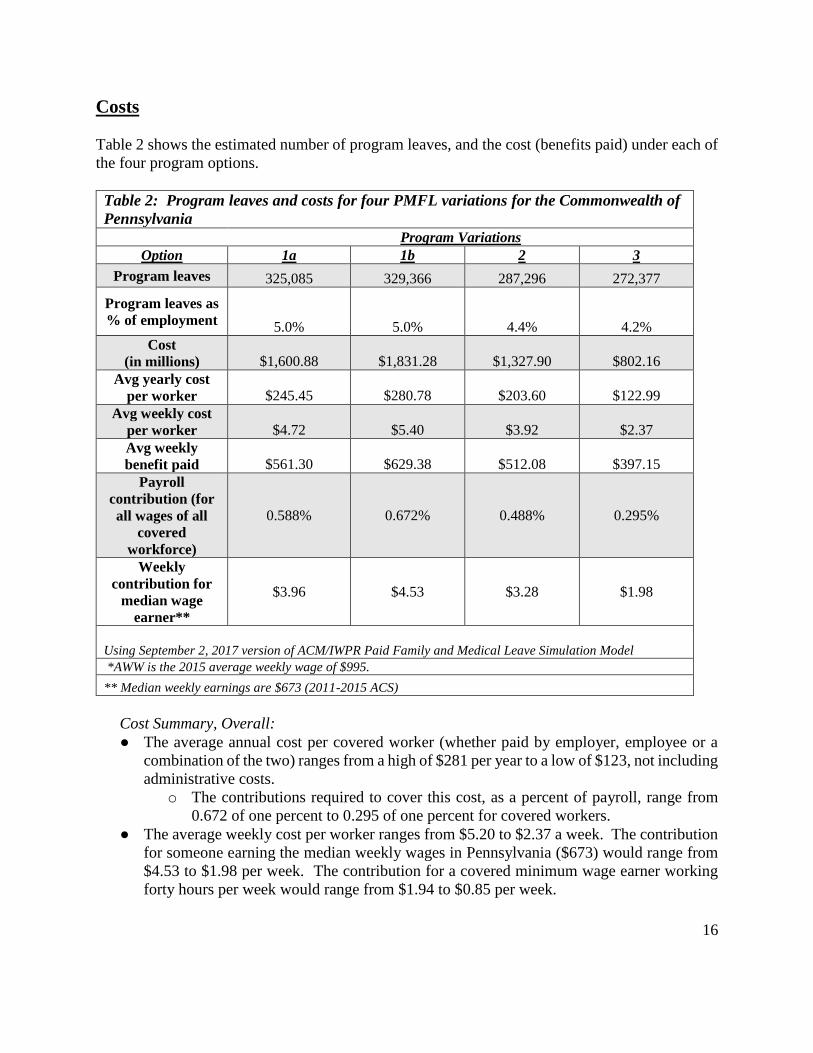
Table 2 shows the estimated number of program leaves, and the cost (benefits paid) under each of
the four program options.
Table 2: Program leaves and costs for four PMFL variations for the Commonwealth of
Pennsylvania
Program Variations
Option 1a 1b 2 3
Program leaves 325,085 329,366 287,296 272,377
Program leaves as
% of employment 5.0% 5.0% 4.4% 4.2%
Cost
(in millions) $1,600.88 $1,831.28 $1,327.90 $802.16
Avg yearly cost
per worker $245.45 $280.78 $203.60 $122.99
Avg weekly cost
per worker $4.72 $5.40 $3.92 $2.37
Avg weekly
benefit paid $561.30 $629.38 $512.08 $397.15
Payroll
contribution (for
all wages of all
covered
workforce)
0.588% 0.672% 0.488% 0.295%
Weekly
contribution for
median wage
earner**
$3.96 $4.53 $3.28 $1.98
Using September 2, 2017 version of ACM/IWPR Paid Family and Medical Leave Simulation Model *AWW is the 2015 average weekly wage of $995.
** Median weekly earnings are $673 (2011-2015 ACS)
Cost Summary, Overall:
● The average annual cost per covered worker (whether paid by employer, employee or a
combination of the two) ranges from a high of $281 per year to a low of $123, not including
administrative costs.
o The contributions required to cover this cost, as a percent of payroll, range from
0.672 of one percent to 0.295 of one percent for covered workers.
● The average weekly cost per worker ranges from $5.20 to $2.37 a week. The contribution
for someone earning the median weekly wages in Pennsylvania ($673) would range from
$4.53 to $1.98 per week. The contribution for a covered minimum wage earner working
forty hours per week would range from $1.94 to $0.85 per week.
17
● In most cases, the higher the benefit cap and replacement rate, the lower number of waiting
period days, and the longer the maximum weeks allowed, the higher the cost of the
program.
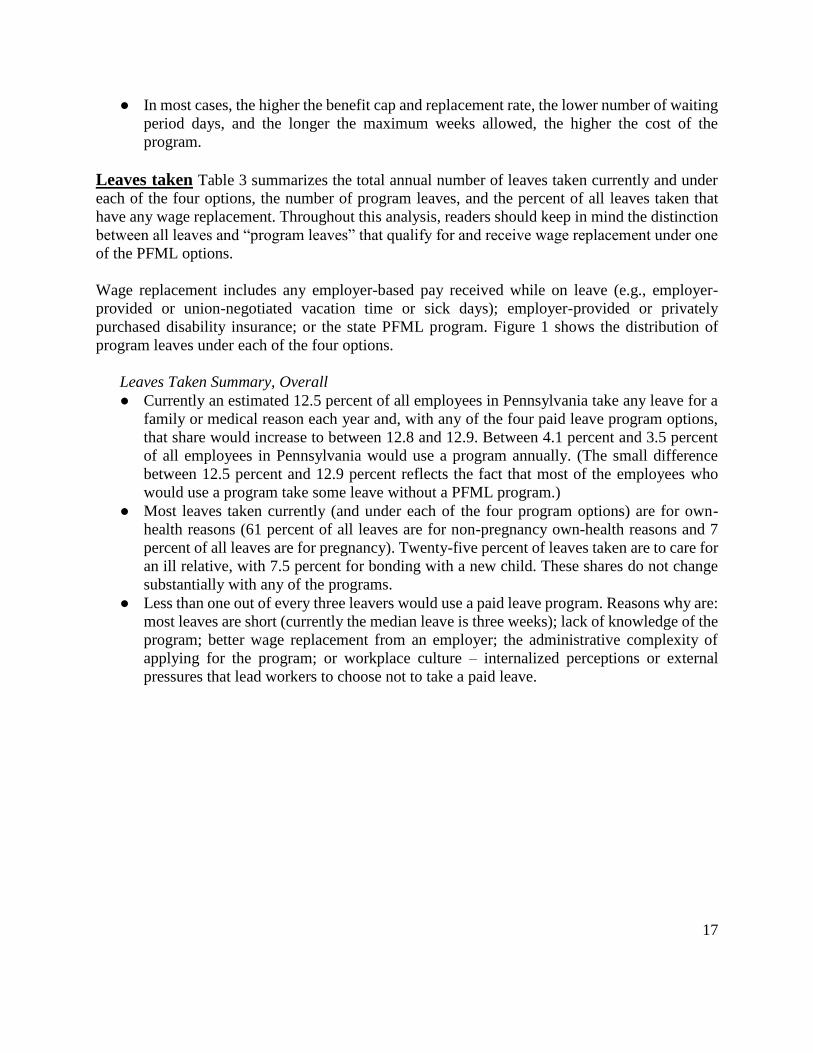
Leaves taken Table 3 summarizes the total annual number of leaves taken currently and under
each of the four options, the number of program leaves, and the percent of all leaves taken that
have any wage replacement. Throughout this analysis, readers should keep in mind the distinction
between all leaves and “program leaves” that qualify for and receive wage replacement under one
of the PFML options.
Wage replacement includes any employer-based pay received while on leave (e.g., employer-
provided or union-negotiated vacation time or sick days); employer-provided or privately
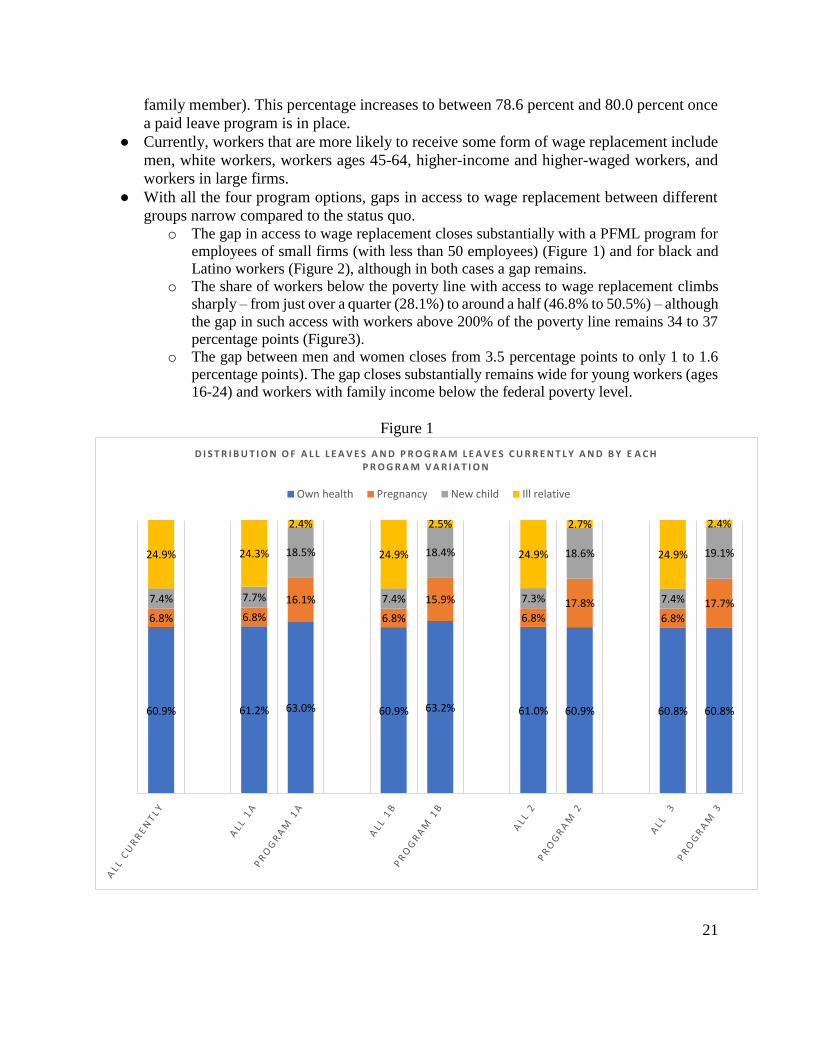
purchased disability insurance; or the state PFML program. Figure 1 shows the distribution of
program leaves under each of the four options.
Leaves Taken Summary, Overall
● Currently an estimated 12.5 percent of all employees in Pennsylvania take any leave for a
family or medical reason each year and, with any of the four paid leave program options,
that share would increase to between 12.8 and 12.9. Between 4.1 percent and 3.5 percent
of all employees in Pennsylvania would use a program annually. (The small difference
between 12.5 percent and 12.9 percent reflects the fact that most of the employees who
would use a program take some leave without a PFML program.)
● Most leaves taken currently (and under each of the four program options) are for own-
health reasons (61 percent of all leaves are for non-pregnancy own-health reasons and 7
percent of all leaves are for pregnancy). Twenty-five percent of leaves taken are to care for
an ill relative, with 7.5 percent for bonding with a new child. These shares do not change
substantially with any of the programs.
● Less than one out of every three leavers would use a paid leave program. Reasons why are:
most leaves are short (currently the median leave is three weeks); lack of knowledge of the
program; better wage replacement from an employer; the administrative complexity of
applying for the program; or workplace culture – internalized perceptions or external
pressures that lead workers to choose not to take a paid leave.
18
Table 3: Total leaves taken by workers and wage replacement currently and under four
different PFML variations for the Commonwealth of Pennsylvania
Program Variations
Conditions Currently* 1a 1b 2 3
Total leaves taken
Own health 683,503 707,319 706,659 702,937 698,798
Pregnancy 76,632 78,961 79,159 79,046 78,794
New child 82,750 88,721 884,08 86,380 86,620
Ill relative 279,277 280,451 281,674 281,025 280,497
All leaves 1,122,161 1,155,452 1,155,900 1,149,388 1,144,709
Program leaves taken
Own health NA 204,892 208,001 174,895 165,674
Pregnancy NA 52,255 52,528 51,065 48,320
New child NA 60,070 60,692 53,455 51,978
Ill relative NA 7,868 8,144 7,880 6,405
All leaves NA 325,085 329,366 287,295 272,377
Percent wage replaced
Own health 69.3% 79.1% 79.2% 77.7% 77.6%
Pregnancy 69.3% 92.6% 92.5% 91.8% 91.5%
New child 74.8% 96.2% 96.4% 93.6% 93.2%
Ill relative 72.0% 73.3% 73.5% 73.3% 73.0%
All leaves 70.4% 80.0% 80.0% 78.8% 78.6%
Using September 2, 2017 version of ACM/IWPR Paid Family and Medical Leave Simulation Model
*Because of simulation error, the number of current leaves vary slightly under each program simulation run.
Here we present the average for the four program simulation runs.
**AWW is the 2015 average weekly wage of $995.
19
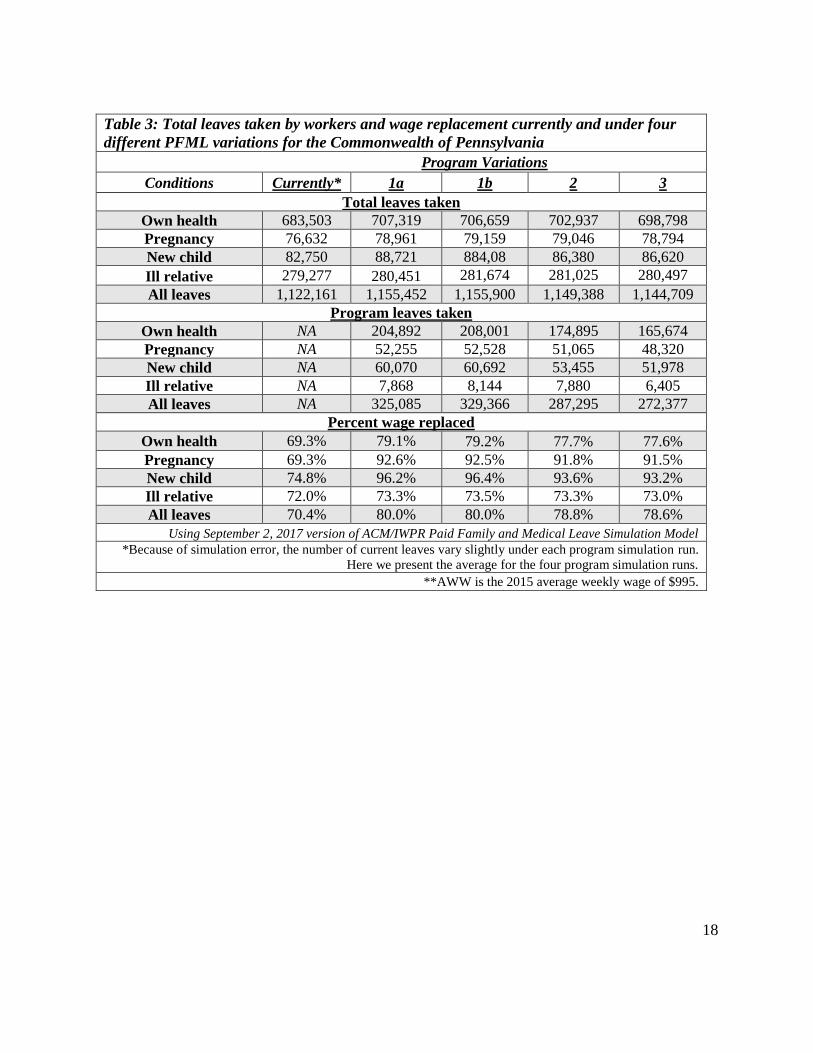
Length of leaves Table 4 shows average leave lengths – for all leavers and for program leavers
– currently and under the four options.
Table 4: Average leave lengths in weeks by type of leave and program leave lengths by
type of leave and gender, currently and under four different PFML variations
Program Variation
Option Currently* 1a 1b 2 3
Average length of all leaves (weeks)
Own health 7.1 8.9 8.9 8.8 8.4
Pregnancy 12.5 17.3 17.2 17.4 15.4
New child 5.4 7.3 7.3 7.5 7.5
Ill relative 4.0 4.0 4.0 4.0 4.0
All leaves 6.5 8.2 8.1 8.1 7.8
Average length on program (weeks)
Own health NA 10.8 10.8 11.1 8.6
Pregnancy NA 15.0 15.1 14.5 10.2
New child NA 6.3 6.4 6.5 6.4
Ill relative NA 3.1 3.1 3.1 3.0
All leaves NA 10.4 10.5 10.7 8.3
Men -- average length on program (weeks)
Own health NA 10.8 10.8 11.2 8.7
Pregnancy NA NA NA NA NA
New child NA 4.4 4.4 4.5 4.5
Ill relative NA 2.6 2.6 2.8 2.6
Women- average length on program (weeks)
Own health NA 10.8 10.8 11.1 8.6
Pregnancy NA 15.0 15.1 14.5 10.2
New child NA 9.3 9.3 9.2 9.1
Ill relative NA 3.4 3.5 3.4 3.2 Using September 2, 2017 version of ACM/IWPR Paid Family and Medical Leave Simulation Model
*Because of simulation error, the number of current leaves vary slightly under each program simulation run.
Here we present the average for the four program simulation runs.
**AWW is the 2015 average weekly wage of $995
Length of Leaves Summary, Overall
● Currently, the average length of leaves is 6.5 weeks for all leaves. The median length of
leave currently is 3 weeks. The average total length of leave increases by 1.3 weeks to
1.7 weeks (6.5 to 8.5 days) with a program in place, and the median total length of all
leaves to 4 weeks.
● The average length of all leaves for those using a program ranges from 8.3 weeks to 10.5
weeks, with pregnancy-related leaves being the longest (10.2 to 15.1 weeks) and ill-
relative leaves being the shortest (about 3 weeks).
● Average program-leave lengths for own-health, non-pregnancy related leaves are about
the same length for men and women; however, women on average take longer new-child
20
leaves (about 4.5 weeks for men compared to 9 weeks for women) and slightly more time
for ill-relative leaves than men.
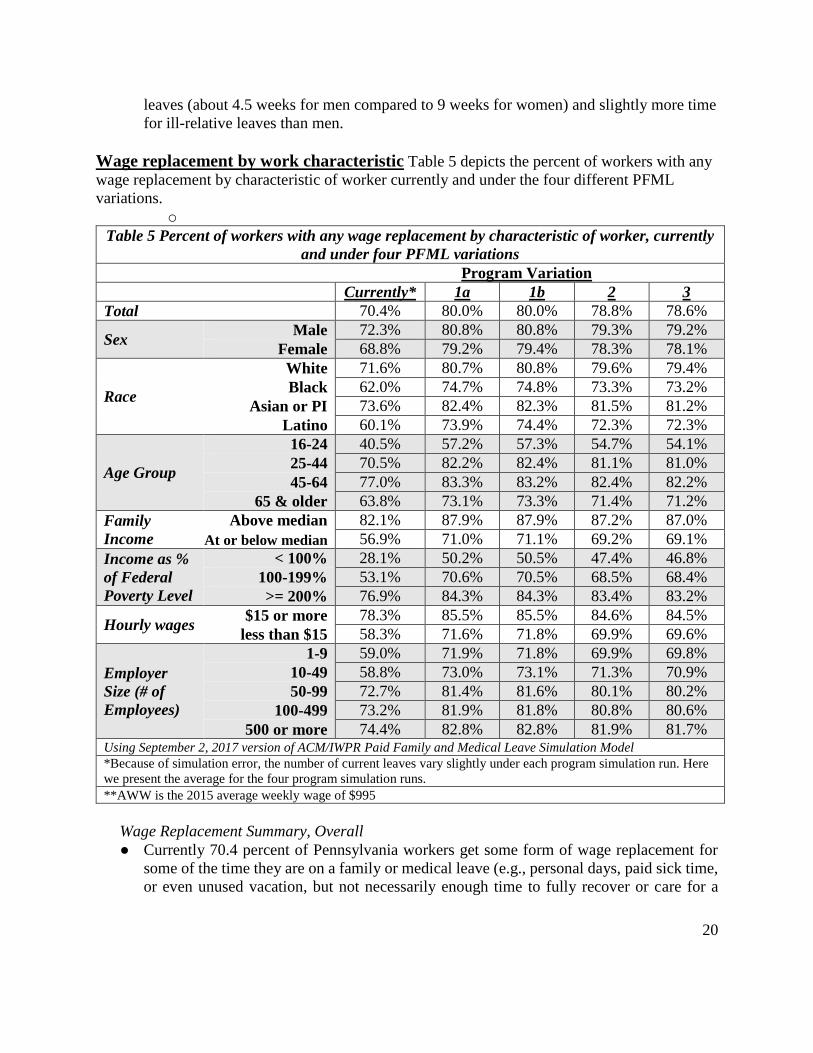
Wage replacement by work characteristic Table 5 depicts the percent of workers with any
wage replacement by characteristic of worker currently and under the four different PFML
variations.
o
Table 5 Percent of workers with any wage replacement by characteristic of worker, currently
and under four PFML variations
Program Variation
Currently* 1a 1b 2 3
Total 70.4% 80.0% 80.0% 78.8% 78.6%
Sex Male 72.3% 80.8% 80.8% 79.3% 79.2%
Female 68.8% 79.2% 79.4% 78.3% 78.1%
Race
White 71.6% 80.7% 80.8% 79.6% 79.4%
Black 62.0% 74.7% 74.8% 73.3% 73.2%
Asian or PI 73.6% 82.4% 82.3% 81.5% 81.2%
Latino 60.1% 73.9% 74.4% 72.3% 72.3%
Age Group
16-24 40.5% 57.2% 57.3% 54.7% 54.1%
25-44 70.5% 82.2% 82.4% 81.1% 81.0%
45-64 77.0% 83.3% 83.2% 82.4% 82.2%
65 & older 63.8% 73.1% 73.3% 71.4% 71.2%
Family
Income
Above median 82.1% 87.9% 87.9% 87.2% 87.0%
At or below median 56.9% 71.0% 71.1% 69.2% 69.1%
Income as %
of Federal
Poverty Level
< 100% 28.1% 50.2% 50.5% 47.4% 46.8%
100-199% 53.1% 70.6% 70.5% 68.5% 68.4%
>= 200% 76.9% 84.3% 84.3% 83.4% 83.2%
Hourly wages $15 or more 78.3% 85.5% 85.5% 84.6% 84.5%
less than $15 58.3% 71.6% 71.8% 69.9% 69.6%
Employer
Size (# of
Employees)
1-9 59.0% 71.9% 71.8% 69.9% 69.8%
10-49 58.8% 73.0% 73.1% 71.3% 70.9%
50-99 72.7% 81.4% 81.6% 80.1% 80.2%
100-499 73.2% 81.9% 81.8% 80.8% 80.6%
500 or more 74.4% 82.8% 82.8% 81.9% 81.7% Using September 2, 2017 version of ACM/IWPR Paid Family and Medical Leave Simulation Model
*Because of simulation error, the number of current leaves vary slightly under each program simulation run. Here
we present the average for the four program simulation runs.
**AWW is the 2015 average weekly wage of $995
Wage Replacement Summary, Overall
● Currently 70.4 percent of Pennsylvania workers get some form of wage replacement for
some of the time they are on a family or medical leave (e.g., personal days, paid sick time,
or even unused vacation, but not necessarily enough time to fully recover or care for a
21
family member). This percentage increases to between 78.6 percent and 80.0 percent once
a paid leave program is in place.
● Currently, workers that are more likely to receive some form of wage replacement include
men, white workers, workers ages 45-64, higher-income and higher-waged workers, and
workers in large firms.
● With all the four program options, gaps in access to wage replacement between different
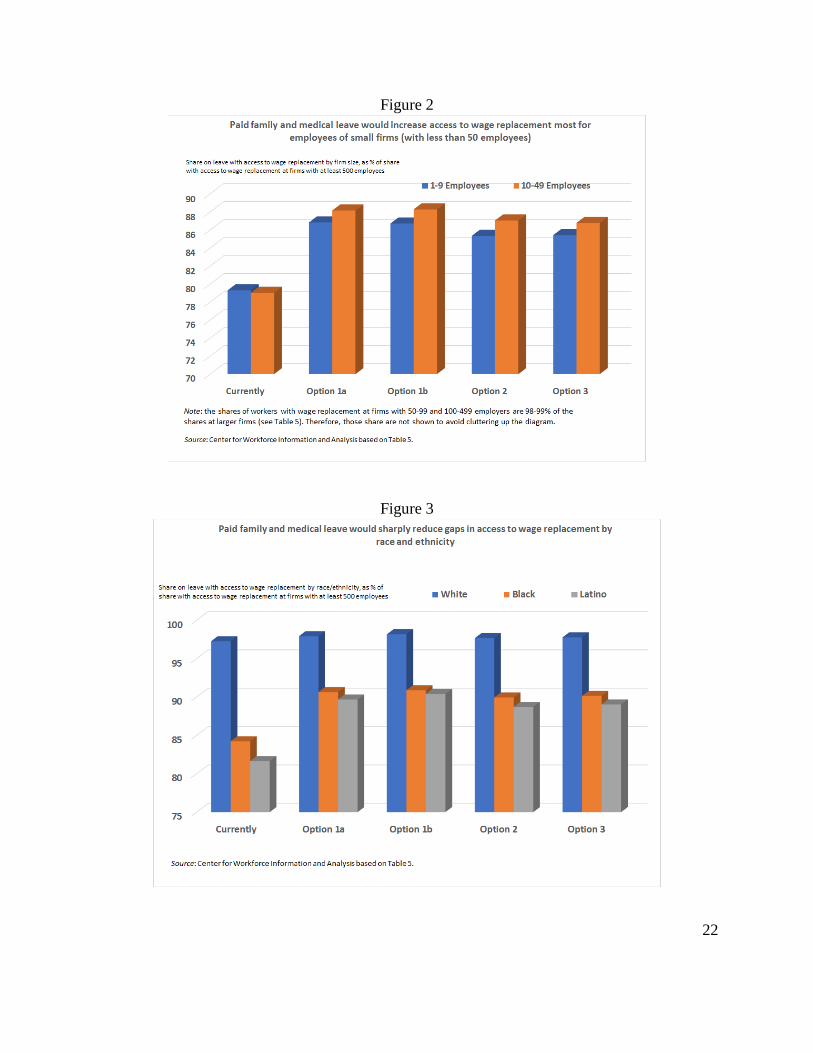
groups narrow compared to the status quo. o The gap in access to wage replacement closes substantially with a PFML program for
employees of small firms (with less than 50 employees) (Figure 1) and for black and
Latino workers (Figure 2), although in both cases a gap remains.
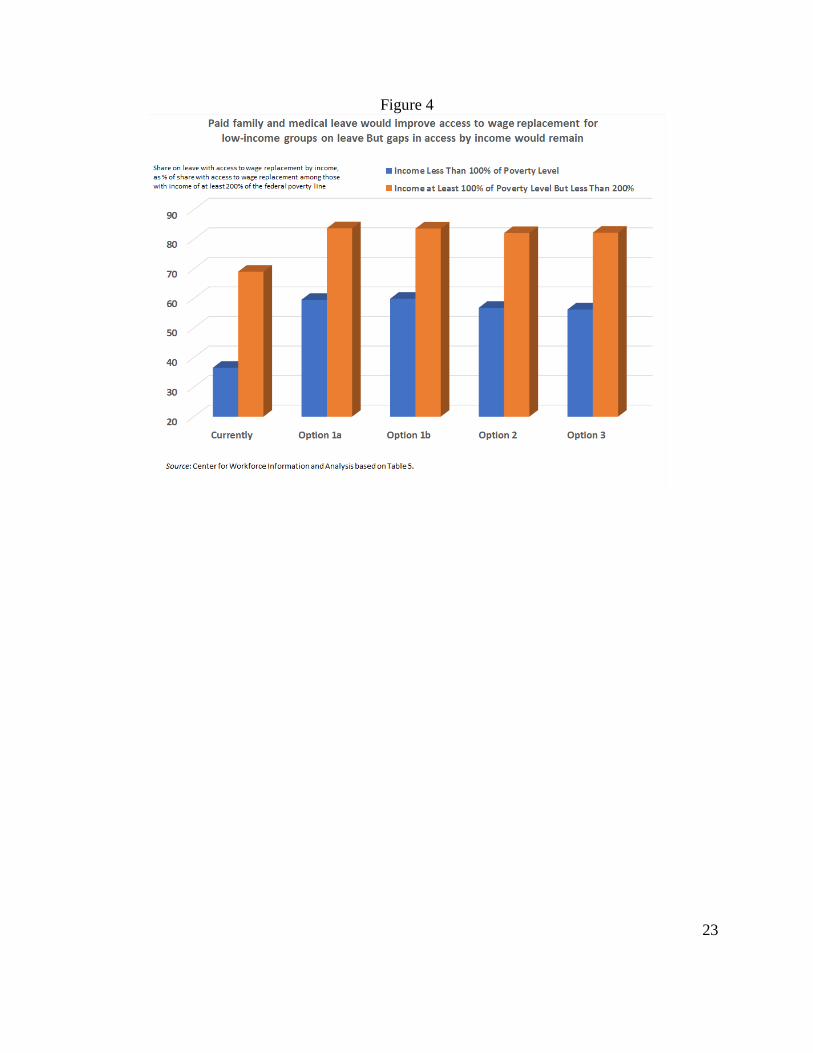
o The share of workers below the poverty line with access to wage replacement climbs
sharply – from just over a quarter (28.1%) to around a half (46.8% to 50.5%) – although
the gap in such access with workers above 200% of the poverty line remains 34 to 37
percentage points (Figure3).
o The gap between men and women closes from 3.5 percentage points to only 1 to 1.6
percentage points). The gap closes substantially remains wide for young workers (ages
16-24) and workers with family income below the federal poverty level.
Figure 1
60.9% 61.2% 63.0% 60.9% 63.2% 61.0% 60.9% 60.8% 60.8%
6.8% 6.8%
16.1%
6.8%
15.9%
6.8%17.8%
6.8%17.7%7.4% 7.7%
18.5%
7.4%
18.4%
7.3%
18.6%
7.4%
19.1%24.9% 24.3%
2.4%
24.9%
2.5%
24.9%
2.7%
24.9%
2.4%
D I S T R I B U T I O N O F A L L L E A V E S A N D P R O G R A M L E A V E S C U R R E N T L Y A N D B Y E A C H P R O G R A M V A R I A T I O N
Own health Pregnancy New child Ill relative
22
Figure 2
Figure 3
23
Figure 4
24
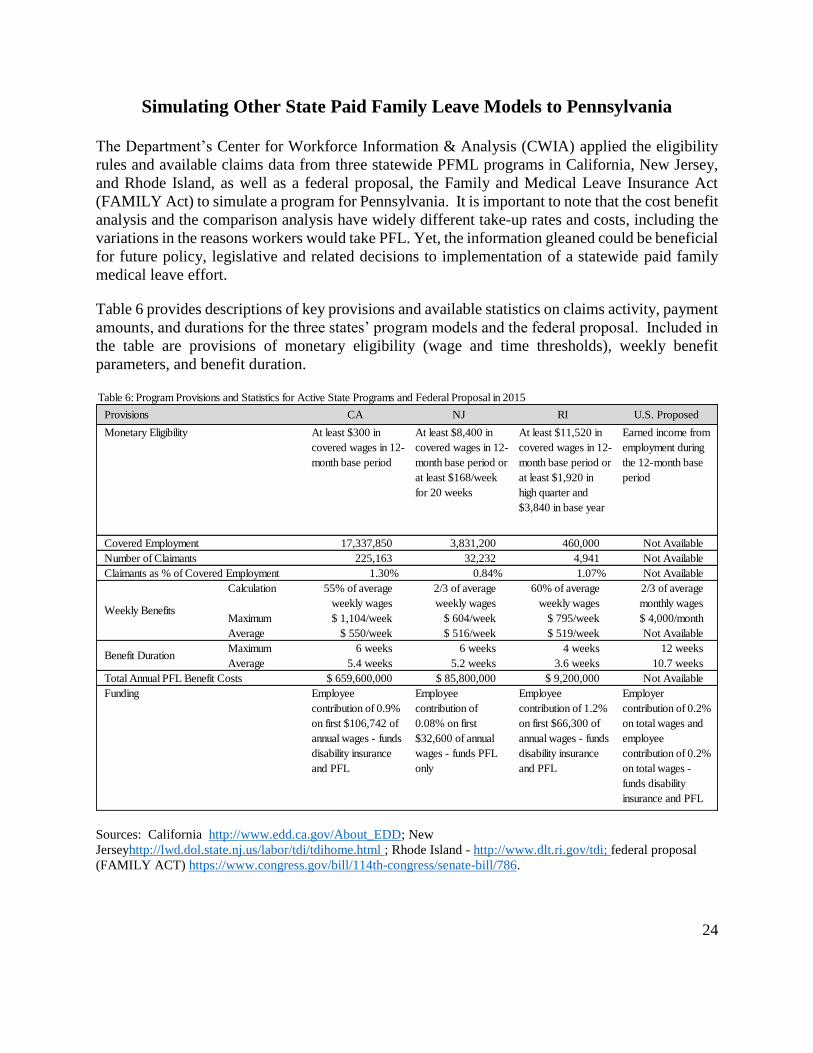
Simulating Other State Paid Family Leave Models to Pennsylvania
The Department’s Center for Workforce Information & Analysis (CWIA) applied the eligibility
rules and available claims data from three statewide PFML programs in California, New Jersey,
and Rhode Island, as well as a federal proposal, the Family and Medical Leave Insurance Act
(FAMILY Act) to simulate a program for Pennsylvania. It is important to note that the cost benefit
analysis and the comparison analysis have widely different take-up rates and costs, including the
variations in the reasons workers would take PFL. Yet, the information gleaned could be beneficial
for future policy, legislative and related decisions to implementation of a statewide paid family
medical leave effort.
Table 6 provides descriptions of key provisions and available statistics on claims activity, payment
amounts, and durations for the three states’ program models and the federal proposal. Included in
the table are provisions of monetary eligibility (wage and time thresholds), weekly benefit
parameters, and benefit duration.
Sources: California http://www.edd.ca.gov/About_EDD; New
Jerseyhttp://lwd.dol.state.nj.us/labor/tdi/tdihome.html ; Rhode Island - http://www.dlt.ri.gov/tdi; federal proposal
(FAMILY ACT) https://www.congress.gov/bill/114th-congress/senate-bill/786.
Table 6: Program Provisions and Statistics for Active State Programs and Federal Proposal in 2015
Provisions CA NJ RI U.S. Proposed
At least $300 in
covered wages in 12-
month base period
At least $8,400 in
covered wages in 12-
month base period or
at least $168/week
for 20 weeks
At least $11,520 in
covered wages in 12-
month base period or
at least $1,920 in
high quarter and
$3,840 in base year
Earned income from
employment during
the 12-month base
period
17,337,850 3,831,200 460,000 Not Available
225,163 32,232 4,941 Not Available
1.30% 0.84% 1.07% Not Available
Calculation 55% of average
weekly wages
2/3 of average
weekly wages
60% of average
weekly wages
2/3 of average
monthly wages
Maximum $ 1,104/week $ 604/week $ 795/week $ 4,000/month
Average $ 550/week $ 516/week $ 519/week Not Available
Maximum 6 weeks 6 weeks 4 weeks 12 weeks
Average 5.4 weeks 5.2 weeks 3.6 weeks 10.7 weeks
$ 659,600,000 $ 85,800,000 $ 9,200,000 Not Available
Employee
contribution of 0.9%
on first $106,742 of
annual wages - funds
disability insurance
and PFL
Employee
contribution of
0.08% on first
$32,600 of annual
wages - funds PFL
only
Employee
contribution of 1.2%
on first $66,300 of
annual wages - funds
disability insurance
and PFL
Employer
contribution of 0.2%
on total wages and
employee
contribution of 0.2%
on total wages -
funds disability
insurance and PFL
Monetary Eligibility
Benefit Duration
Weekly Benefits
Funding
Total Annual PFL Benefit Costs
Claimants as % of Covered Employment
Number of Claimants
Covered Employment
25
Potential Number of Claimants The program usage rate in California, New Jersey, and Rhode
Island provides a basis for determining the estimated number of claimants that a PFL program in
Pennsylvania would potentially serve. The calculated average usage rate across the three programs
for calendar year 2015 is 1.07%. This usage rate applied to Pennsylvania’s estimated 5,595,000
covered workers (CY2015) shows an estimated 60,000 program claimants per year.
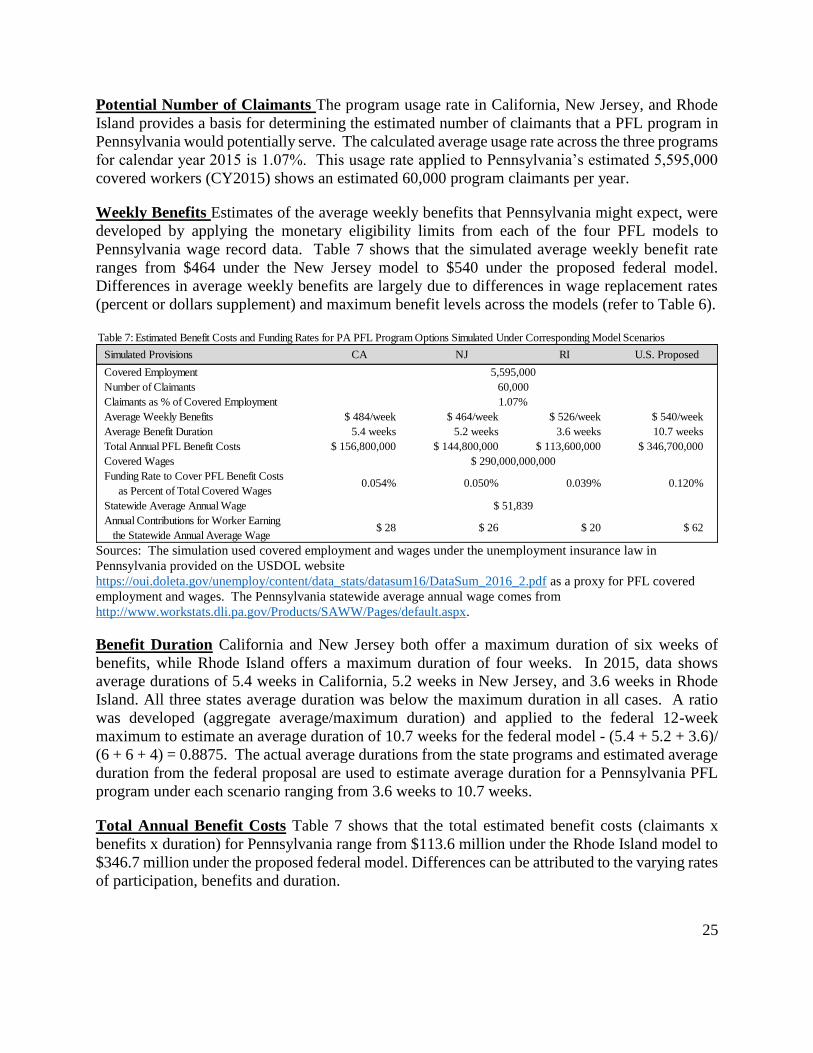
Weekly Benefits Estimates of the average weekly benefits that Pennsylvania might expect, were
developed by applying the monetary eligibility limits from each of the four PFL models to
Pennsylvania wage record data. Table 7 shows that the simulated average weekly benefit rate
ranges from $464 under the New Jersey model to $540 under the proposed federal model.
Differences in average weekly benefits are largely due to differences in wage replacement rates
(percent or dollars supplement) and maximum benefit levels across the models (refer to Table 6).
Sources: The simulation used covered employment and wages under the unemployment insurance law in
Pennsylvania provided on the USDOL website
https://oui.doleta.gov/unemploy/content/data_stats/datasum16/DataSum_2016_2.pdf as a proxy for PFL covered
employment and wages. The Pennsylvania statewide average annual wage comes from
http://www.workstats.dli.pa.gov/Products/SAWW/Pages/default.aspx.
Benefit Duration California and New Jersey both offer a maximum duration of six weeks of
benefits, while Rhode Island offers a maximum duration of four weeks. In 2015, data shows
average durations of 5.4 weeks in California, 5.2 weeks in New Jersey, and 3.6 weeks in Rhode
Island. All three states average duration was below the maximum duration in all cases. A ratio
was developed (aggregate average/maximum duration) and applied to the federal 12-week
maximum to estimate an average duration of 10.7 weeks for the federal model - (5.4 + 5.2 + 3.6)/
(6 + 6 + 4) = 0.8875. The actual average durations from the state programs and estimated average
duration from the federal proposal are used to estimate average duration for a Pennsylvania PFL
program under each scenario ranging from 3.6 weeks to 10.7 weeks.
Total Annual Benefit Costs Table 7 shows that the total estimated benefit costs (claimants x
benefits x duration) for Pennsylvania range from $113.6 million under the Rhode Island model to
$346.7 million under the proposed federal model. Differences can be attributed to the varying rates
of participation, benefits and duration.
Table 7: Estimated Benefit Costs and Funding Rates for PA PFL Program Options Simulated Under Corresponding Model Scenarios
Simulated Provisions CA NJ RI U.S. Proposed
Covered Employment
Number of Claimants
Claimants as % of Covered Employment
Average Weekly Benefits $ 484/week $ 464/week $ 526/week $ 540/week
Average Benefit Duration 5.4 weeks 5.2 weeks 3.6 weeks 10.7 weeks
Total Annual PFL Benefit Costs $ 156,800,000 $ 144,800,000 $ 113,600,000 $ 346,700,000
Covered Wages
Funding Rate to Cover PFL Benefit Costs
as Percent of Total Covered Wages0.054% 0.050% 0.039% 0.120%
Statewide Average Annual Wage
Annual Contributions for Worker Earning
the Statewide Annual Average Wage$ 28 $ 26 $ 20 $ 62
$ 51,839
1.07%
60,000
5,595,000
$ 290,000,000,000
26
Funding In California and Rhode Island, an employee payroll deduction funds both disability
insurance and PFL, while in New Jersey the employee payroll deduction funds PFL only. In the
federal proposal, equal shares of employee and employer contributions fund both disability
insurance and PFL. Note that the funding mechanisms for the active state programs and the federal
proposal, as shown at the bottom of Table 6, cover both administrative and benefit costs. The PFL
simulation for Pennsylvania does not estimate administrative costs. As shown in Table 7, the
estimated funding rate to cover benefit costs (not including administrative costs) for a PFL
program in Pennsylvania ranges from 0.039% of total covered wages to 0.12% of total covered
wages under the proposed federal model. Using average worker wages of $51,839 in 2015, annual
contributions (employer and/or employee) to cover benefit costs range from $20 per year to $62
per year.
27
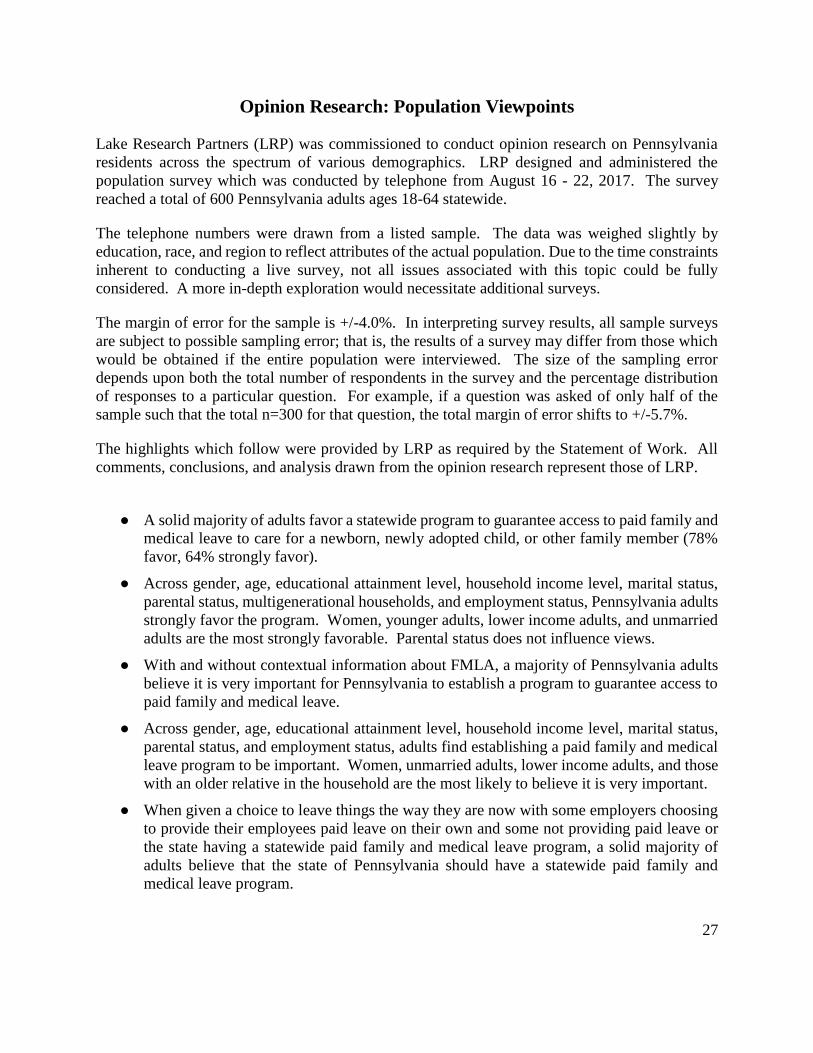
Opinion Research: Population Viewpoints
Lake Research Partners (LRP) was commissioned to conduct opinion research on Pennsylvania
residents across the spectrum of various demographics. LRP designed and administered the
population survey which was conducted by telephone from August 16 - 22, 2017. The survey
reached a total of 600 Pennsylvania adults ages 18-64 statewide.
The telephone numbers were drawn from a listed sample. The data was weighed slightly by
education, race, and region to reflect attributes of the actual population. Due to the time constraints
inherent to conducting a live survey, not all issues associated with this topic could be fully
considered. A more in-depth exploration would necessitate additional surveys.
The margin of error for the sample is +/-4.0%. In interpreting survey results, all sample surveys
are subject to possible sampling error; that is, the results of a survey may differ from those which
would be obtained if the entire population were interviewed. The size of the sampling error
depends upon both the total number of respondents in the survey and the percentage distribution
of responses to a particular question. For example, if a question was asked of only half of the
sample such that the total n=300 for that question, the total margin of error shifts to +/-5.7%.
The highlights which follow were provided by LRP as required by the Statement of Work. All
comments, conclusions, and analysis drawn from the opinion research represent those of LRP.
● A solid majority of adults favor a statewide program to guarantee access to paid family and
medical leave to care for a newborn, newly adopted child, or other family member (78%
favor, 64% strongly favor).
● Across gender, age, educational attainment level, household income level, marital status,
parental status, multigenerational households, and employment status, Pennsylvania adults
strongly favor the program. Women, younger adults, lower income adults, and unmarried
adults are the most strongly favorable. Parental status does not influence views.
● With and without contextual information about FMLA, a majority of Pennsylvania adults
believe it is very important for Pennsylvania to establish a program to guarantee access to
paid family and medical leave.
● Across gender, age, educational attainment level, household income level, marital status,
parental status, and employment status, adults find establishing a paid family and medical
leave program to be important. Women, unmarried adults, lower income adults, and those
with an older relative in the household are the most likely to believe it is very important.
● When given a choice to leave things the way they are now with some employers choosing
to provide their employees paid leave on their own and some not providing paid leave or
the state having a statewide paid family and medical leave program, a solid majority of
adults believe that the state of Pennsylvania should have a statewide paid family and
medical leave program.
28
● Men and married Pennsylvanians are slightly more likely than others to believe things
should remain the same while those making less than $40,000, unmarried adults, and adults
with older relatives in their household are most likely to think the state should have a
program.
● By wide margins, adults strongly favor all specific policies tested:
o Mothers when they have a baby, adopt, or foster a child – 73%
o Providing care for a sick child or foster child – 72%
o A serious illness, health condition, or injury of an immediate family member – 70%
o Providing care for an elderly family member – 68%
o Providing care for a person with disabilities – 67%
o Fathers when they have a baby, adopt, or foster a child – 56%
● Adults who oppose paid leave as a program in general also oppose each of the specific
policies by wide margins. On the other hand, those who favor paid leave also favor each
policy nearly universally.
● Among adults, a majority believe 12 weeks is about the right amount of time (55%), and
they split between thinking 18 weeks is about right (42%) and too long (37%). A majority
of adults see 6 weeks as being too short of a period of time (57%).
● A majority of adults favor each funding mechanism tested overall, but the strongest
favorability is toward a mechanism where employees pay $1 per week to have access to
the program, followed by $2 per week, and employer-funded.
● A majority of adults agree that 100% of employee salary is too much; however, a majority
(56%) think people receiving 75% of their salaries is about right.
● A majority of adults report not needing to take time off or reduce their hours at work to
care for a new child, seriously ill family member, an older family member, or that a family
member has needed to take time off work to care for them in the last five years (60%). Of
those who have needed leave, a majority say the leave was unpaid (52%).
● People were just as likely to take time off or reduce their hours for a new child (11%) as
they were to care for an ill family member (14%) or elderly family member (13%).
29
Opinion Research: Employer Viewpoints
Lake Research Partners (LRP) was commissioned to conduct opinion research on Pennsylvania
employers across the spectrum of industries, geography, and business size. LRP designed and
administered the employer survey which was conducted online from August 21 - September 4,
2017. The survey reached a total of 500 Pennsylvania employers statewide.
The sample were drawn from a purchased list of current business owners in the state of
Pennsylvania and screened to be at least 18 years old and in a high management/decision making
position within their company. The data was weighed slightly by sector, region, and size of
business to reflect attributes of the actual population. Due to the time constraints inherent to
conducting a survey of business owners, not all issues associated with this topic could be fully
considered. A more in-depth exploration would necessitate additional surveys.
The margin of error for the sample is +/-4.4%. In interpreting survey results, all sample surveys
are subject to possible sampling error; that is, the results of a survey may differ from those which
would be obtained if the entire population were interviewed. The size of the sampling error
depends upon both the total number of respondents in the survey and the percentage distribution
of responses to a particular question. For example, if a question was asked of only half of the
sample such that the total n=250 for that question, the total margin of error shifts to +/-6.2%.
The highlights which follow were provided by LRP as required by the Statement of Work. All
comments, conclusions, and analysis drawn from the opinion research represent those of LRP.
● A majority of employers favor creating a program to provide paid family and medical leave
to employees, but intensity is low (56% favor, 35% strongly favor). Overall, nearly one-
in-five are not sure.
● Among employers, including contextual information about FMLA slightly increases the
intensity with which employers respond to the proposal, within the margin of error.
Regardless of contextual information, employers are more evenly split on whether they
find it important to establish a program to guarantee access to paid family and medical
leave.
● A plurality of employers would prefer things stay the same with some employers choosing
to provide paid leave on their own and some not (45%).
● More than one third of employers believe there should be a statewide paid family and
medical leave program (37%).
● A plurality of employers disagree that the adoption of a statewide paid family and medical
leave program available to everyone would impact their business’s competitiveness – 46%
disagree that it would make them more competitive and 46% disagree that it would make
them less competitive; however, nearly a quarter (24%) strongly agree that it would make
their businesses less competitive, compared to 17% who strongly agree it would make them
more competitive.
30
● Employers favor each of the six specific policies proposed, but with much less intensity
than the general population survey.
● Employers do not clearly prefer any length tested as the right amount of time for a statewide
paid family and medical leave program. About a third (35%) say that six weeks is about
the right amount of time.
● Employers are more favorable toward funding mechanisms where the employee has a
“stake in the game” and are strongly opposed to the employer-funded program option.
Employers are also net unfavorable toward mechanisms that share responsibility between
employers and employees.
● Employers are split between believing 66% of the employee’s salary while on leave is too
much (29%), about right (30%), and not enough (25%).
● Nearly half (48%) of employers believe 75% of salary while on leave is too much, and a
plurality of employers (42%) believe allowing employees to receive 50% of their salary
while on leave is not enough.
● Vacation and sick days are the most common paid benefits provided by employers,
followed by bereavement leave. A plurality of employers do not provide any of the other
benefits listed, including maternity and paternity leave, and leave for an ill or injured child
or family member.
● More than two-thirds (69%) of employers do not offer paid family and medical leave to
their employees.
● Of those who do not offer leave, a majority (54%) cite the financial burden offering such
leave would have on their company as what holds them back from offering it to their
employees.
● The smaller the business, the less likely it is to offer paid leave to its employees.
● About four out of five (79%) employers believe employees should be required to work a
given amount of time before they can take paid family and medical leave. Of those who
agree, nearly half (49%) think the employee should have worked with the company for
more than one year in order to qualify.
● While one quarter of employers are not sure, a plurality (37%) believe paid family and
medical leave (PFML) should be a separate benefit, three in ten (29%) would require
employees to use vacation and sick leave first, and only a tenth (9%) believe employees
should use family and medical leave concurrently with vacation and sick leave. Employers
with less than five employees, Philadelphia employers, those who already offer paid leave,
and those in business for less than 20 years are the most likely to believe PFML should be
a separate benefit.
● The majority of employers report none of their employees have used FMLA leave over the
last five years.
● A majority (56%) also report having someone at their companies take time off or reduce
their hours to care for a new child, seriously ill family member, elderly family member, or

31
their own serious illness. Of those who have seen this happen, the most common reasons
for the leave was for the care of a new child (30%) or an ill family member (24%).
● Regardless of company size, from the employer perspective, the costs associated with
providing paid family and medical leave is the biggest concern. Secondary concerns
include finding replacements for the employee on leave and the risk of employees taking
advantage of the program.
32
Advisory Board
The Center for Workforce Information & Analysis administered the Paid Leave grant and
coordinated grant activities. A tenet of the grant proposal was the creation of an Advisory Board
to provide the subject-matter expertise and relevant context to the efforts. The selection of board
members was deliberate to include various perspectives of groups with an interest in this issue,
including business, women’s advocacy, aging, and public health and wellness.
The Advisory Board is comprised of the four primary partners that represent workers, the business
community, the current administration, and various state agencies that administer programs likely
to be complementary to paid family and medical leave initiatives. Members were instrumental in
shaping the grant activities through several virtual meetings and in some cases, small-group
regional conferences.
With the end of the research findings phase comes a new role for the Advisory Board. The
Advisory Board is expected to continue to be a primary resource; but in lieu of assistance with
research initiatives, the members will be asked to provide guidance in the development of policies
and potential legislative proposals. In addition, it is believed that the Advisory Board members
will be the program champions at local, regional, and state levels.
CWIA wishes to thank the Advisory Board members for their commitment of resources, time, and
energy. The results of the research findings were inspired and driven by their collective passion
about the subject.
33
Table Listing
Table 1: Four PMFL program variations modelled
Table 2: Program leaves and costs for four PFML Variations
Table 3: Total leaves taken by workers and wage replacement wage replacement, current and
under four different PFMP variations for the Commonwealth .
Table 4: Average leave lengths in weeks by type of leave and program leave lengths by type of
leave and gender, currently and under four different PFML variations
Table 5: Percent of workers with any wage replacements by characteristic of worker, currently
and under PFML variations
Table 6: Program Provisions and Statistics for Active State Program and Federal Proposal in
2015
Table 7: Estimated Benefit Costs and Funding Rates for PA PFL Program Options Simulated
Under Corresponding Model Scenarios
Figure Listing
Figure 1: Distribution of program leaves under four PFML variations
Figure 2: Paid family and medical leave would increase access to wage replacement most for
employees of small firms (with fewer than 50 employees)
Figure 3: Paid family and medical leave would sharply reduce gaps in access to wage
replacement by race and ethnicity
Figure 4: Paid family and medical leave would improve access to wage replacement for low-
income groups on leave but gaps in access by income would remain
34
Appendix A: Other States’ Paid Family Leave Programs and Research
States That Have Enacted or Proposed Paid Family Leave Programs
● Since 2000, five states – California (2002), Washington (2007 with a major enhancement in
2017), New Jersey (2008), Rhode Island (2013), and New York (2016) – have enacted paid
family leave programs.
● Washington’s 2007 paid family leave law lacked a funding mechanism; the funded program
enacted this year will begin offering paid leave to eligible workers on January 1, 2020.
● New York’s program will start in 2018.
● Several other states introduced paid family leave legislation in 2015: Colorado, Connecticut,
Illinois, Maine, Vermont, Louisiana, Maryland, Minnesota, Washington, Arkansas, North
Dakota, Oregon, and New Mexico.
● The National Partnership for Women & Families and A Better Balance have developed a
model state paid family and medical leave statute.
Workers Covered
● In California and Rhode Island, workers covered by state unemployment insurance laws are
covered, except for public workers. Public employers can opt in to coverage through the
collective bargaining process.
● In New Jersey, all workers covered by state unemployment insurance laws are covered.
● In New York, most private-sector workers are covered.
● In Washington, everyone who worked at least 820 hours in the past year (including in
multiple jobs) will be covered.
Eligible Purposes for Paid Leave
● In California, paid family leave can be used either (1) to bond with a child within one year of
the child’s birth or placement for foster care or adoption; or (2) to care for a family member
with a serious health condition. Workers who need time off to recover from their own
serious health condition may be eligible for payments under California’s Disability Insurance
program.
● In New Jersey, paid family leave can be used either (1) to bond with a child within one year
of the child’s birth or placement for adoption; or (2) to care for a family member with a
serious health condition. Workers who need time off to recover from their own serious
health condition may be eligible for payments under New Jersey’s Temporary Disability
Insurance program.
● In Rhode Island, paid family leave can be used either (1) to bond with a child within one year
of the child’s birth or placement for foster care or adoption; or (2) to care for a family
member with a serious health condition. Workers who need time off to recover from their
own serious health condition may be eligible for payments under Rhode Island’s Temporary
Disability Insurance program.
35
● In New York, paid family leave can be used (1) to bond with a child within one year of the
child’s birth or placement for foster care or adoption; (2) to care for a family member with a
serious health condition; or (3) to address certain military family needs. Workers who need
time off to recover from their own serious health condition may be eligible for payments
under New York’s Temporary Disability Insurance program.
● In Washington, paid family leave can be used for (1) up to 12 weeks in a year to care for a
newborn or newly placed adopted or foster child; (2) to care for a family member with a
serious health condition; (3) to address needs associated with a family member’s military
deployment; or (4) Or for up to 12 weeks in a year for a worker’s own serious health
condition, with an additional two weeks for a complication related to pregnancy.
Family Members Covered
● In California, a family member includes a worker’s child, parent, grandparent, grandchild,
sibling, spouse, registered domestic partner, or the parent of a worker’s spouse or registered
domestic partner.
● In New Jersey, a family member includes a worker’s child (under the age of 19 or unable to
care for self due to mental or physical impairment), parent, spouse, registered domestic
partner, or civil union partner.
● In Rhode Island, a family member includes a worker’s child, parent, parent-in-law,
grandparent, spouse, or registered domestic partner.
● In New York, a family member includes a worker’s child, parent, parent-in-law, spouse,
domestic partner, grandchild, or grandparent. The law’s definition of domestic partner is
flexible and does not require registration.
● In Washington, a family member includes domestic partners, grandparent/child, sibling, or
in-law.
Benefit Level
● In California, for most workers, approximately 55% of their average weekly wages up to a
cap, currently set at $1,120/week. Effective January 1, 2018, most workers will receive 60%
or 70% of their average weekly wage, depending on their income, up to cap.
● In New Jersey, for all covered workers, 2/3 of average weekly wage up to a cap, currently set
at $615/week.
● In Rhode Island, for all covered workers, 4.62% of wages in the highest earning quarter of
the base year (or approximately 60% of a worker’s average weekly wage during that quarter),
up to a cap, currently set at $795/week.
● In New York, for all covered workers, benefits will start at 50% of the worker’s average
weekly wage, up to cap of 50% of the statewide average weekly wage. When the program is
fully phased in in 2021, workers will receive 67% of their average weekly wage up to a cap
of 67% of the statewide average weekly wage.
● In Washington, for all covered workers, 90% of the workers’ average weekly wages up to
half the state average weekly wage, then 50% of the workers’ average weekly wages up to
36
$1,000 per week maximum. This translates into 90% replacement for someone earning
$28,000 per year, 71% for someone earning $54,000 per year, and 63% for someone earning
$83,000 per year.
Benefit Duration
● In California, up to 6 weeks in a 12-month period.
● In New Jersey, up to 6 weeks in a 12-month period.
● In Rhode Island, up to 4 weeks in a 52-week period.
● In New York, up to 12 weeks in a 52-week period.
● In Washington, up to16 weeks, or 18 weeks with a pregnancy-related complication, in a 52-
week period.
Job Protection
● California’s program does not provide job protection, though some workers may be eligible
for job protection under other laws, such as the federal Family and Medical Leave Act
(FMLA) or the California Family Rights Act (CFRA).
● New Jersey’s program does not provide job protection, though some workers may be eligible
for job protection under other laws, such as the FMLA or the New Jersey Family Leave Act
(NJFLA).
● Rhode Island’s program requires that a worker be restored to the position the worker held
before leave or to a comparable position. Some workers may be eligible for additional
protection under other laws, such as the FMLA or the Rhode Island Parental and Family
Medical Leave Act (RIPFMLA).
● New York’s program requires that a worker be restored to the position the worker held
before leave or to a comparable position. Some workers may be eligible for additional
protection under other laws, such as the FMLA.
● Washington has job protection with FMLA qualifications.
Utilization
● In states with family leave programs, most claims were for parents seeking time to care for
new children (California – 90%, New Jersey – 81%, and Rhode Island – 75%)
● In California, the number of fathers filing leave claims increased by more than 400 percent
between 2005 and 2013.
Program Funding
● In California, paid family leave is funded by a payroll deduction from employee wages,
currently set at 0.9%. This deduction includes funding for both paid family leave and
disability insurance and does not apply to wages above $106,742 per year.
37
● In New Jersey, paid family leave is funded by a payroll deduction from employee wages,
currently set at 0.08%. This deduction does not apply to wages over $32,000 per year.
Temporary disability insurance is funded separately from paid family leave and is jointly
funded by employers and employees.
● In Rhode Island, paid family leave is funded by a payroll deduction from employee wages,
currently set at 1.2%. This deduction includes funding for both paid family leave and
temporary disability insurance and does not apply to wages above $64,200/year.
● In New York, paid family leave is funded by a payroll deduction from employee wages, up to
a maximum set by the Department of Financial Services. Temporary disability insurance is
funded separately from paid family leave and is jointly funded by employers and employees.
● In Washington, paid family leave will be funded by 0.4% of pay, with workers paying 63%
and employers 37%, beginning January 2019.
Program Administration
● California, New Jersey, Rhode Island, and New York had pre-existing temporary disability
insurance programs to expand and build upon, so they were able to reduce implementation
costs since administrative and financing structures were already in place.
● In California, most workers are covered through the state-run disability insurance program,
which is paid for through employee payroll contributions and is centrally administered.
Employers can apply for approval of a voluntary plan.
● In New Jersey, by default, workers are covered through the state-run paid family leave
program. Employers can apply for approval of a private plan.
● In Rhode Island, all covered workers are covered through the state fund.
● In New York, employers can provide coverage by purchasing insurance (either from the state
fund or a private insurer) or by becoming an approved self-insurer.
● In Washington, the Employment Security Department (administers unemployment insurance)
will administer the paid family leave program.
● Other states have proposed paid leave legislation in 2015 to create standalone family and
medical leave insurance programs administered through labor departments and funded either
by employee payroll contributions (Colorado, Connecticut, Illinois, Maine, New York, and
Vermont) or a combination of employee- and employer-paid contributions (Louisiana,
Maryland, Minnesota, and Washington).
● Maryland proposed running a paid family leave program through the state’s unemployment
insurance program.
● Five states introduced legislation to give tax credits to businesses already providing paid
leave (Arkansas, North Dakota, Oregon, Minnesota and Connecticut)
● New Mexico introduced a bill for a paid family and medical leave program funded by state
and corporate income taxes.
38
Cost and Benefit Analyses
● Several states/other government entities (e.g., Washington, Massachusetts, Vermont, New
Hampshire, Indiana, Hawaii, DC, Montgomery County, MD) have contracted with the Institute
for Women’s Policy Research (IWPR) and Labor Resource Center (University of
Massachusetts) to develop cost-benefit analyses based on a simulation model developed by
Randy Albelda and Alan Clayton-Matthews from the University of Massachusetts. The
simulation model is a software application that mimics the sequence of decisions and events
that a person makes and experiences in the leave process based, in part, on Public Use Family
and Medical Leave survey data collected by Abt Associates in 2012 for the Department Labor
(McGarry, et al, 2013) and American Community Survey Public Use Microdata Sample. The
model estimates the number of family and medical leaves taken or needed in a state as well as
the current employer and employee wage costs associated with those leaves. According to
Albelda and Clayton-Matthews, their model has the capacity to estimate the new and
redistributed wage-replacement costs of any new proposed program.
● Indiana plans to partner with Albelda and Clayton-Matthews to develop cost-benefit models
for up to eight proposed plans, including the potential effects of paid family leave programs on
SNAP and TANF uptake rates. They plan to also use the results of this analysis to develop
education and outreach materials.
● In a paid leave analysis grant report, Montana, describes a methodology (developed by outside
vendors – Montana Budget & Policy Center in consultation with the Colorado Fiscal Institute)
for estimating benefit payouts based on statistics from California and New Jersey adjusted for
the demographics in Montana. Since the proposed paid family leave program would be
administered through the Montana Department of Labor and Industry, similar to
unemployment insurance, they looked at the cost of administering unemployment insurance to
estimate the costs to administer a paid family leave program. Montana then estimated
administrative costs based on estimates from fiscal notes on proposed paid family leave
legislation in Washington and Colorado. Montana estimated that total administrative costs
would account for 6.67% of total program costs in the first three years of the program and then
decrease to 4 percent per year thereafter.
● Estimates from paid family leave proposals in other non-disability insurance states/government
entities (Washington, Colorado, DC) show ongoing annual administration costs of
approximately 4-5% of total benefits.
● Recognizing the challenge of implementing family paid leave programs in states without
disability programs, the President’s budget includes a State Paid Leave Fund at the Department
of Labor that will help cover start-up costs for states that implement paid leave programs.
Survey and Focus Group Research
● A survey of 253 employers affected by California’s paid family leave initiative found that over
90% reported either no noticeable or a positive effect on profitability, turnover, and morale.
● In New Jersey, 76.4% of workers surveyed said they viewed the paid family leave program
favorably and the majority of both small and large businesses indicated that they have adjusted
easily.
39
● Rhode surveyed a sample of small and medium-sized businesses in Rhode Island before and
after the state’s paid family leave law went into effect. They did not find any significant
changes over time in employers’ reports about productivity, employee morale, cooperation, or
attendance. 56% of the smaller firms (10-19 employees) and 59% of the medium-sized firms
(20-49 employees) supported the program.
● In New York, 80% of New York voters supported the paid family leave proposal prior to
enactment.
● Montana conducted a mail survey of a stratified sample of employers covered under the state’s
unemployment insurance program. They found that only 5% of Montana businesses provided
paid family or parental leave to all of their employees. While businesses generally had good
opinions about paid parental leave, they generally did not feel that the benefits of providing
paid family leave outweighed the costs.
● Tennessee, through partnership with the University of Tennessee and A Better Balance, is
conducting a large-scale survey of state residents to assess the need for and availability of paid
family and medical leave.
● Vermont is conducting a survey of the public to understand public views to develop effective
communication for education efforts and a survey of businesses to understand current paid
leave practices and policies, feedback on possible funding mechanisms, impacts on businesses
and tools to develop educational materials for employers.
● Washington, in partnership with Lake Research, is conducting a statewide polling of voters’
views toward paid family leave, willingness to support a paid family leave program,
preferences on plans, and opinions on communications and outreach strategies.
● Indiana plans to use ethnographic interview research and talkback testing conducted by Topos
Partnership to refine its educational and outreach materials.
● Hawaii has proposed conducting a public poll to collect information on broad public opinion
about paid family leave, benefit design, and messaging. They also plan to conduct focus groups
with businesses, unions, families, and caregivers of children and elderly. The results will be
used to develop materials for educational and outreach efforts.
40
Appendix B: Full Report on Cost, Leave and Length Estimates Using Four
Different Leave Programs Variations for Pennsylvania, Prepared by Randy
Albelda and Alan Clayton-Matthews November 2017 Introduction
The birth of a child. A cancer diagnosis or hip replacement. A parent, spouse or child with a
serious illness. Each requires a worker to take an extended period of time off from work. And
while almost everyone will experience this type of event in their work life, the United States is
one of the few countries in the world that does not have a national policy on paid maternity and
an outlier among industrial counterparts without any guarantee of paid parental and medical
leaves.1 Six states and Washington DC, however, have such programs or have recently enacted
them2 and many others have paid family and medical leave legislation under consideration.
Understandably policy makers, advocates, employers and employees want to know what the cost
associated with providing partial wage replacement while on leave.
Currently, in states without paid family and medical leave programs, the costs associated with
taking time off from work for a serious own-health condition, to bond with a new child, or to
care for an ill-relative are born by the individual workers that take those leaves and their
employers. In 2016, only 14% of all U.S. workers had access to paid family leave from their
employers, 38% had access to short-term disability leave, and 68% had paid sick leave.3 Low-
wage, poor, black and latino, and young workers as well as those that work for small-sized
employers are the most disadvantaged by the lack of universal paid leave programs because they
are the least likely to currently be covered by these forms of wage replacement.4 Women, the
majority of whom are employed, as primary caregivers are more likely to take time off and to
take longer time off to have and bond with a child or to care for an ill relative than men.5 The
lack of paid leave policies leaves places them at a relative disadvantage. A state-wide paid leave
program will not cover all the costs of wage replacement for workers on a family or medical
leave, but the substantial portions that are covered are spread across the entire covered workforce
and is available to all worker that meet the eligibility requirements. In doing so it reduces the
individual cost to all workers and employers and at the same time reduces inequality among
workers by covering workers that did not have any wage replacement prior to a program.
This document provides estimates on the cost of benefits paid, number, leave lengths by gender,
and percent of workers with wage-replacement for family and medical leaves in Pennsylvania
currently and with four program possibilities. It also includes estimates on the percentage of
1 The OECD Database publishes information about paid parental and ill relative leave arrangements in all the OECD countries at
http://www.oecd.org/social/family/database.htm. See PF2.1 Key characteristics of parental leave systems and PF2.3 Additional
leave entitlements of working parents for a country by country description of leave provisions. In an extensive survey of
legislation in 22 OECD countries, Jody Heymann, Hye Jin Rho, John Schmitt, and Alison Earle find that the United States is the
only country that has no guaranteed paid sick leave. (Contagion Nation: A Comparison of Paid Sick Day Policies in 22 Countries,
Washington DC: Center for Economic and Policy Research at http://cepr.net/documents/publications/paid-sick-days-2009-05.pdf,
retrieved December 1, 2015). 2 The states that currently have paid family and medical leave programs are California, New Jersey and Rhode Island. Hawaii
and New York has a paid medical leave insurance program. New York recently enacted paid family leave. Washington DC and
Washington State also recently enacted paid family and medical leave legislation. 3 U.S. Department of Labor, Bureau of Labor Statistics, National Compensation Survey, 2016, Tables 16 and 32. Retrieved
September 15, 2017 at http://www.bls.gov/ncs/ebs/benefits/2016/ownership_civilian.htm. 4 See simulation estimates in Table 5 below for wage replacement rates currently. 5 We estimate that in currently in Pennsylvania, women take 54 percent of all medical and family leaves. Length of leaves by
gender are reported in Table 4.
41
employees that receive any form of wage replacement while on leave currently and with each of
the four program possibilities by some key demographic and employer characteristics. The
family and medical leaves considered are for own health reasons, including those related to
pregnancy, to bond with a new child, and to care for an ill relative. The estimates are derived
from the Albelda & Clayton-Matthews/Institute for Women’s Policy Research (ACM/IWPR)
Paid Family and Medical Leave Simulator, June 25, 2017 version. They do not include costs
associated with administering a program. What follows is a brief description of the simulator, a
summary of the four paid leave programs estimated, and the estimates on costs, coverage, and
length of the four programs.
The ACM/IWPR simulator and behavior parameters used
The simulator relies on known leave-taking behavior among workers contained in a 2012
Department of Labor (DOL) sponsored survey on family and medical leaves6 and our own
informed decision-making for unknown behavior (such as take-up rates). Using the 2012 DOL
survey, we estimate models of the likelihood of an individual taking an FMLA (Family and
Medical Leave Act) qualifying leave, and the length of that leave, based on employer pay, the
demographic characteristics of leave takers, and the need for a leave. We then use these models
to simulate leave-taking, employer costs, and program costs both with and without a state paid
leave program, using the sample individuals from the five-year American Community Survey
(ACS) for 2011-2015 for all employees in Pennsylvania. These estimates are not sensitive to
who pays for the program (i.e. if the revenue for benefits are generated through employer or
employee contributions or through tax revenues). Documentation on the model is available at
http://scholarworks.umb.edu/econ_faculty_pubs/41/.
There are two types of parameters that must be specified to generate estimates from the
simulator. One type specifies the paid leave policy. These policy parameters include the wage
replacement rate, maximum weeks of leave, maximum benefit level, waiting period, and
eligibility requirements. The policy parameters used in this report are summarized in Table 1
below. These were defined with input from members of the Pennsylvania advisory board to its
U.S. Department of Labor paid family and medical leave project.
The other type of parameters includes behaviors beyond those that can be gleaned from the DOL
survey. Behavioral parameters give the simulator decision rules about how people might behave
when faced with the option of using a state-wide paid medical and family leave (PMFL)
program. The key ones include: take-up rates (the percentage of eligible leave takers that use a
paid leave program); length of leave once on a program;7 and use of a program if an employer
already provides leave payments that are more generous than the PMFL program. We have
developed the simulator so that we can adjust each of these policy and behavioral parameters.
Using the simulator to estimate actual leaves and lengths in California and New Jersey,
generated the information used to calibrate take-up rates and behavior parameters regarding
6 Jacob Alex Klerman, Kelly Daley, and Alyssa Pozniak, Family and Medical Leave in 2012: Technical Report, Abt Associates,
prepared for Department of Labor (2013). 7 Small sample sizes and lack of information on state of residence or work, the publicly provided data from the DOL survey does
not allow an accurate measure of leave lengths for those leave takers that use one of the already existing state-wide programs.
42
length of PMFL program leaves.8 The take-up rates we use for these estimates are 40% for own
health (i.e., 40% of people taking time off from work for an own-health problem opt to take paid
leave through the program); 95% for pregnancy-related and new-child bonding leaves; and 5%
for ill relative leaves. The variation in these take-up rates reflect the type of leave taken (e.g.
almost all mothers that have a child take time off; most own-health leaves are short; far fewer
use a program for ill relative leaves as there may be many caretaker substitutes and leave time
required is less predictable) and the nature of DOL survey questions about pregnancy and
bonding leaves. Take up rates for own health and ill relative leaves might increase over time as
employers and employees become more familiar with the program.
The simulator imposes “rationality” on leave takers. That means, weekly program benefits must
equal or exceed their next best alternative for someone to choose to use the PMFL program when
taking a leave. So, if an employer’s wage replacement exceeds the amount the program benefit
would be, the leave taker chooses not to participate in the program. However, it is likely that
employers that pay full wage replacement would encourage employees to use the PMFL program
and then “top-off” program benefits to reach full wage replacement. We have built in a
behavioral parameter that allows us to input a percentage of employees with full wage
replacement that would use a program based on a minimum number of weeks of leave taken. For
these estimations, the simulator is directed to randomly select 50 percent of all leavers with full-
wage replacement taking a leave of 4 weeks (20 days) or more to use the state-mandated
program for as long as the leave is eligible.9
In addition to the behavior and policy parameters, there is a “cloning” devise employed which
reduces simulation error by creating several duplicates of the same person to run through the
simulation. A cloning factor of 30 is used for the estimations here (i.e. each person is run through
the model 30 independent times, with the weight of each person reduced by a factor of 30). This
reduces the variability of estimates for any given run of the model which uses a “random wheel”
spin for probabilities of taking and needing a leave. Still, there will be some variability in results
across runs of the simulator, but typically less than 1 percent.
The data passed through the simulator comes from the US sample of 2011-2015 ACS 5-year
Public Use Microdata Samples (PUMS), culling all individuals employed in Pennsylvania,
regardless of state of residence. Federal employees are excluded from these estimates as federal
legislation precludes states from subjecting federal employees to paid family and medical state
laws. There are 6,522,122 non-federal government workers in Pennsylvania, including all self-
employed workers (8.3% of all non-federal government workers), as the policy parameters
provided allow self-employed workers to opt in to the PMFL program (rather than be required to
participate). Their inclusion here may bias the results by overestimating the number of leaves
taken but underestimating the length of those that do use the program as not all self-employed
8 This is done by running the simulator under various take-up rates and extension of leave options for those states using
parameters of their existing programs and use those that are within the ranges that best approximate actual numbers of leaves and
leave lengths. 9 There is some evidence that firms do this. In addition, a 2015 Paid Family Leave Market Research report on California’s Paid
Family Leave program conducted for California’s Employment Development Department
(http://www.edd.ca.gov/disability/pdf/Paid_Family_Leave_Market_Research_Report_2015.pdf) finds that between 40%- 50% of
women taking paid family leave with incomes over $60,000 used “integrated” benefits – a combination of program and employer
pay (p. 41)
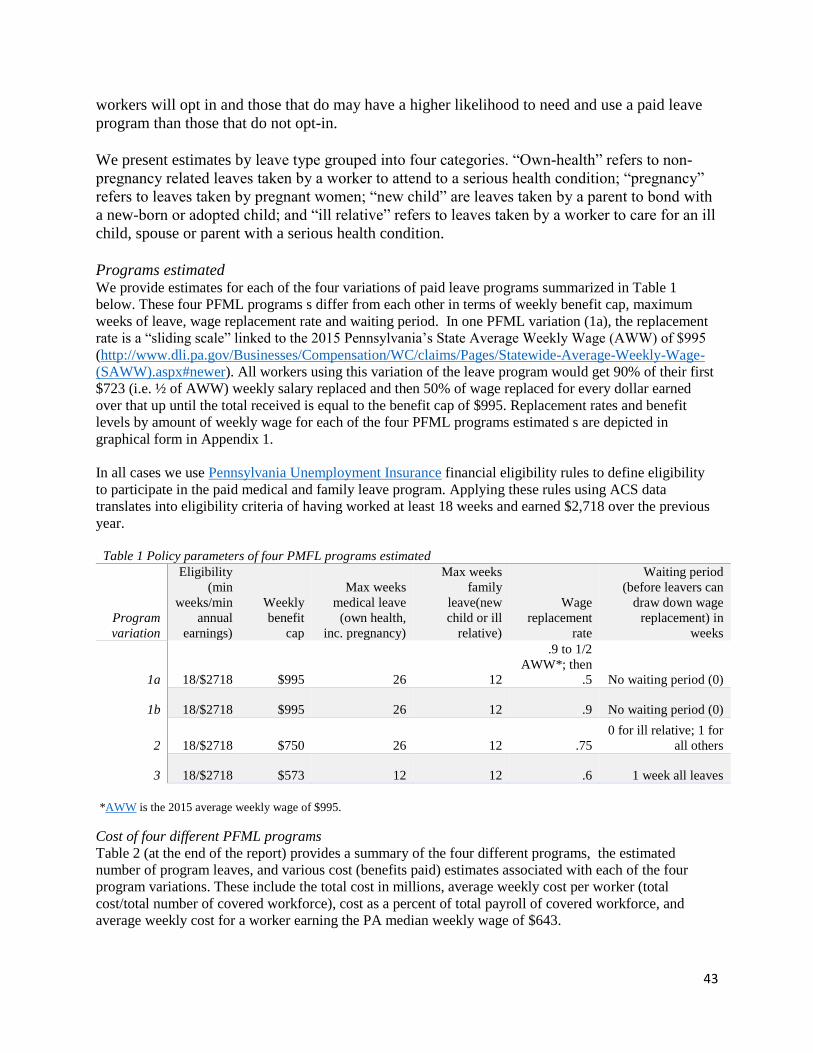
43
workers will opt in and those that do may have a higher likelihood to need and use a paid leave
program than those that do not opt-in.
We present estimates by leave type grouped into four categories. “Own-health” refers to non-
pregnancy related leaves taken by a worker to attend to a serious health condition; “pregnancy”
refers to leaves taken by pregnant women; “new child” are leaves taken by a parent to bond with
a new-born or adopted child; and “ill relative” refers to leaves taken by a worker to care for an ill
child, spouse or parent with a serious health condition.
Programs estimated We provide estimates for each of the four variations of paid leave programs summarized in Table 1
below. These four PFML programs s differ from each other in terms of weekly benefit cap, maximum
weeks of leave, wage replacement rate and waiting period. In one PFML variation (1a), the replacement
rate is a “sliding scale” linked to the 2015 Pennsylvania’s State Average Weekly Wage (AWW) of $995
(http://www.dli.pa.gov/Businesses/Compensation/WC/claims/Pages/Statewide-Average-Weekly-Wage-
(SAWW).aspx#newer). All workers using this variation of the leave program would get 90% of their first
$723 (i.e. ½ of AWW) weekly salary replaced and then 50% of wage replaced for every dollar earned
over that up until the total received is equal to the benefit cap of $995. Replacement rates and benefit
levels by amount of weekly wage for each of the four PFML programs estimated s are depicted in
graphical form in Appendix 1.
In all cases we use Pennsylvania Unemployment Insurance financial eligibility rules to define eligibility
to participate in the paid medical and family leave program. Applying these rules using ACS data
translates into eligibility criteria of having worked at least 18 weeks and earned $2,718 over the previous
year.
Table 1 Policy parameters of four PMFL programs estimated
Program
variation
Eligibility
(min
weeks/min
annual
earnings)
Weekly
benefit
cap
Max weeks
medical leave
(own health,
inc. pregnancy)
Max weeks
family
leave(new
child or ill
relative)
Wage
replacement
rate
Waiting period
(before leavers can
draw down wage
replacement) in
weeks
1a 18/$2718 $995 26 12
.9 to 1/2
AWW*; then
.5 No waiting period (0)
1b 18/$2718 $995 26 12 .9 No waiting period (0)
2 18/$2718 $750 26 12 .75
0 for ill relative; 1 for
all others
3 18/$2718 $573 12 12 .6 1 week all leaves
*AWW is the 2015 average weekly wage of $995.
Cost of four different PFML programs
Table 2 (at the end of the report) provides a summary of the four different programs, the estimated
number of program leaves, and various cost (benefits paid) estimates associated with each of the four
program variations. These include the total cost in millions, average weekly cost per worker (total
cost/total number of covered workforce), cost as a percent of total payroll of covered workforce, and
average weekly cost for a worker earning the PA median weekly wage of $643.
44
We estimate the annual number of program users to vary between about 330,000 to just above 272,000.10
In general the higher the program wage replacement rate, the more likely a worker will use a program
(rather than receive employer benefits and/or experience lost wages).
The average annual cost per covered worker (which could be paid by employees or employers or split
between the two) ranges from a high of $281 (variation 1b) per year to $123 (variation 3), not including
administrative costs. To calculate the payroll contribution rate, we divide the total cost of the program by
the sum of all eligible workers’ wages. This provides a contribution rate of 0.672 percent (variations 1b)
to 0.295 percent (variation 3).11 We apply this rate to the median weekly wages of eligible workers in
Pennsylvania and find a range of about $4.53 to $1.98 a week. Generally speaking, the higher the benefit
cap and replacement rate, the lower number of waiting period days, and the longer the maximum weeks
allowed, the higher the cost of the program. Variation 1a with a sliding scale benefit pay-out costs slightly
less than the same program (variation 1b) without a sliding scale.
The percent of all program leaves (i.e. those using a program) divided by the covered workforce is
between 5.0 percent and 4.2 percent depending on the variation. Because some workers take more than
one leave per year, the percent of employees using a program would be less. Between 4.1 percent
(variations 1a and 1b) and 3.5 (variation 3) percent of all employees would use a program annually (not
shown on table 3).
Leaves taken
Table 3 summarizes each of the program variations and depicts the total annual number of leaves taken
(currently and with each variation), the total number of eligible leaves in a program year using the state-
wide PMFL program, and percent of all leaves taken that have any wage replacement currently and under
the four different PFML variations. Wage replacement in this case includes any employer-based pay
received while on a family or medical leave including employer-provided or union negotiated vacation
time or sick days; employer-provided or privately purchased disability insurance; or the state-wide PMFL
program. (Figure # also compares the distribution of program leaves under the four options. [USE
The simulator, based on information gleaned from the DOL survey, estimates the number of FLMA
leaves workers that need and take as well as those that need a leave but do not take one currently (i.e.
without a state-wide paid leave program). The total number of leaves taken currently is lower than the
total number of leaves taken with any of the PFML variations because many workers that need but cannot
afford to take a leave currently would be able to do so with a paid leave program. The increase in total
leaves taken is lowest in the variation with lowest wage replacement rate, lowest benefit level, and
longest wait period (variation 3). About 12.5 percent of all employees currently take any leave for a
family or medical reason each year and that would increase to between 12.8 and 12.9, depending on the
program variation (not shown on Table 3). The slight increase in those taking a leave with a statewide
10 Estimates for program leaves and costs are for a “program year”—the number of people that use the program in a 12 months
period and the payments to eligible recipients associated with that 12-month period. 11 A Better Balance has done a comprehensive comparison of the policy parameters and funding mechanisms of the paid medical
and/or family leaves program in Rhode Island, California, Hawaii, and the recently enacted programs in New York and
Washington DC at http://www.abetterbalance.org/resources/paid-family-leave-laws-chart/. Because each of the programs differ
by length of leaves allowed, percentage of wage replaced, maximum benefit allowed, and waiting periods it is hard to compare
across programs. A Better Balance reports that California applies a 0.9 percent payroll deduction on the wages up to $110,902.
That program provides 55 percent of wage replacement up to the statewide average weekly wage (currently $1,173) and allows
up to 52 weeks of own-health (including pregnancy related leaves) and up to 6 weeks for family leaves, with a one-week waiting
period. New Jersey applies a .24 percent payroll deduction for employees and between a .1 and .7 percent contribution on
employers for their medical leave program and a 0.1 percent contribution on employees for their family leave program that
covers 2/3rd of weekly wage up to 53 percent of the statewide average weekly wage ($633) for up to 26 weeks of medical leave
and up to 6 weeks of family leave.
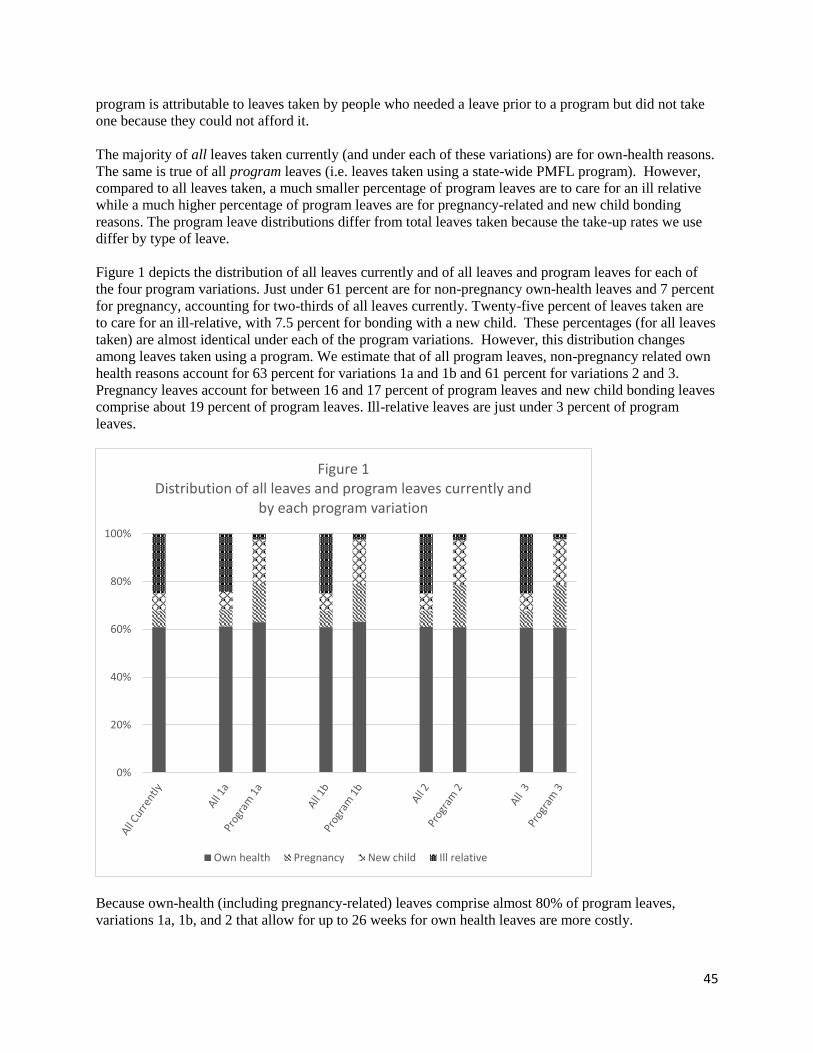
45
program is attributable to leaves taken by people who needed a leave prior to a program but did not take
one because they could not afford it.
The majority of all leaves taken currently (and under each of these variations) are for own-health reasons.
The same is true of all program leaves (i.e. leaves taken using a state-wide PMFL program). However,
compared to all leaves taken, a much smaller percentage of program leaves are to care for an ill relative
while a much higher percentage of program leaves are for pregnancy-related and new child bonding
reasons. The program leave distributions differ from total leaves taken because the take-up rates we use
differ by type of leave.
Figure 1 depicts the distribution of all leaves currently and of all leaves and program leaves for each of
the four program variations. Just under 61 percent are for non-pregnancy own-health leaves and 7 percent
for pregnancy, accounting for two-thirds of all leaves currently. Twenty-five percent of leaves taken are
to care for an ill-relative, with 7.5 percent for bonding with a new child. These percentages (for all leaves
taken) are almost identical under each of the program variations. However, this distribution changes
among leaves taken using a program. We estimate that of all program leaves, non-pregnancy related own
health reasons account for 63 percent for variations 1a and 1b and 61 percent for variations 2 and 3.
Pregnancy leaves account for between 16 and 17 percent of program leaves and new child bonding leaves
comprise about 19 percent of program leaves. Ill-relative leaves are just under 3 percent of program
leaves.
Because own-health (including pregnancy-related) leaves comprise almost 80% of program leaves,
variations 1a, 1b, and 2 that allow for up to 26 weeks for own health leaves are more costly.
0%
20%
40%
60%
80%
100%
Figure 1Distribution of all leaves and program leaves currently and
by each program variation
Own health Pregnancy New child Ill relative
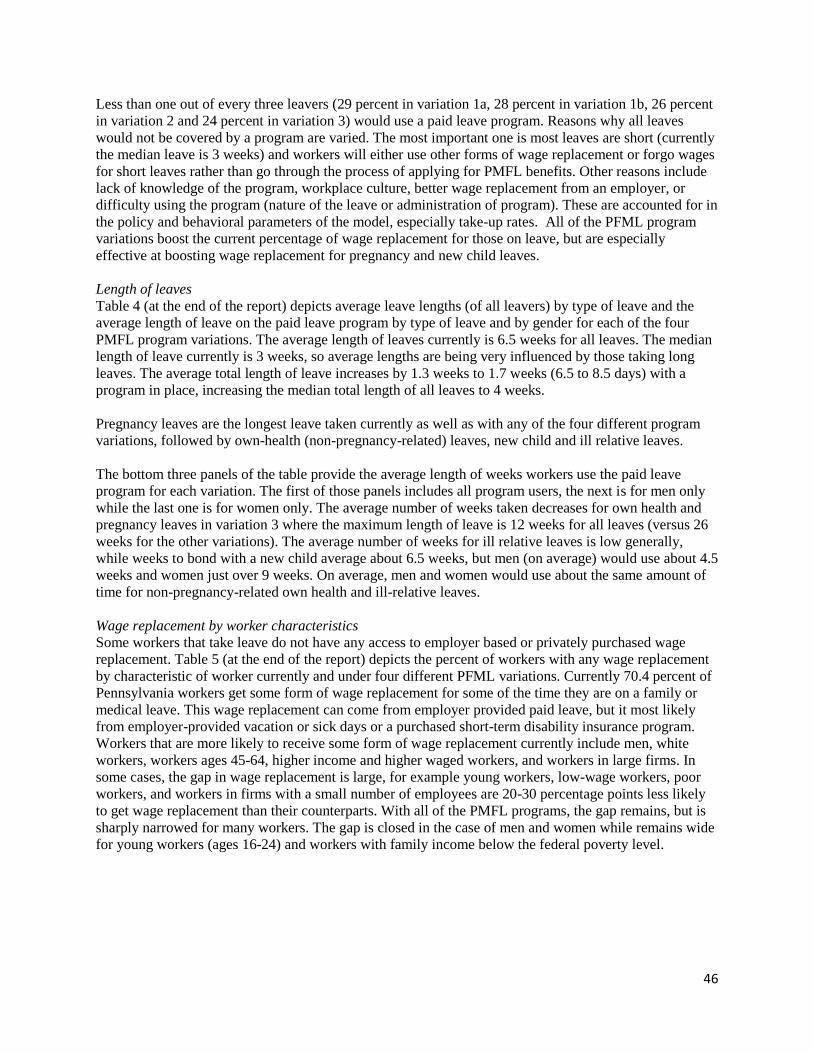
46
Less than one out of every three leavers (29 percent in variation 1a, 28 percent in variation 1b, 26 percent
in variation 2 and 24 percent in variation 3) would use a paid leave program. Reasons why all leaves
would not be covered by a program are varied. The most important one is most leaves are short (currently
the median leave is 3 weeks) and workers will either use other forms of wage replacement or forgo wages
for short leaves rather than go through the process of applying for PMFL benefits. Other reasons include
lack of knowledge of the program, workplace culture, better wage replacement from an employer, or
difficulty using the program (nature of the leave or administration of program). These are accounted for in
the policy and behavioral parameters of the model, especially take-up rates. All of the PFML program
variations boost the current percentage of wage replacement for those on leave, but are especially
effective at boosting wage replacement for pregnancy and new child leaves.
Length of leaves
Table 4 (at the end of the report) depicts average leave lengths (of all leavers) by type of leave and the
average length of leave on the paid leave program by type of leave and by gender for each of the four
PMFL program variations. The average length of leaves currently is 6.5 weeks for all leaves. The median
length of leave currently is 3 weeks, so average lengths are being very influenced by those taking long
leaves. The average total length of leave increases by 1.3 weeks to 1.7 weeks (6.5 to 8.5 days) with a
program in place, increasing the median total length of all leaves to 4 weeks.
Pregnancy leaves are the longest leave taken currently as well as with any of the four different program
variations, followed by own-health (non-pregnancy-related) leaves, new child and ill relative leaves.
The bottom three panels of the table provide the average length of weeks workers use the paid leave
program for each variation. The first of those panels includes all program users, the next is for men only
while the last one is for women only. The average number of weeks taken decreases for own health and
pregnancy leaves in variation 3 where the maximum length of leave is 12 weeks for all leaves (versus 26
weeks for the other variations). The average number of weeks for ill relative leaves is low generally,
while weeks to bond with a new child average about 6.5 weeks, but men (on average) would use about 4.5
weeks and women just over 9 weeks. On average, men and women would use about the same amount of
time for non-pregnancy-related own health and ill-relative leaves.
Wage replacement by worker characteristics
Some workers that take leave do not have any access to employer based or privately purchased wage
replacement. Table 5 (at the end of the report) depicts the percent of workers with any wage replacement
by characteristic of worker currently and under four different PFML variations. Currently 70.4 percent of
Pennsylvania workers get some form of wage replacement for some of the time they are on a family or
medical leave. This wage replacement can come from employer provided paid leave, but it most likely
from employer-provided vacation or sick days or a purchased short-term disability insurance program.
Workers that are more likely to receive some form of wage replacement currently include men, white
workers, workers ages 45-64, higher income and higher waged workers, and workers in large firms. In
some cases, the gap in wage replacement is large, for example young workers, low-wage workers, poor
workers, and workers in firms with a small number of employees are 20-30 percentage points less likely
to get wage replacement than their counterparts. With all of the PMFL programs, the gap remains, but is
sharply narrowed for many workers. The gap is closed in the case of men and women while remains wide
for young workers (ages 16-24) and workers with family income below the federal poverty level.
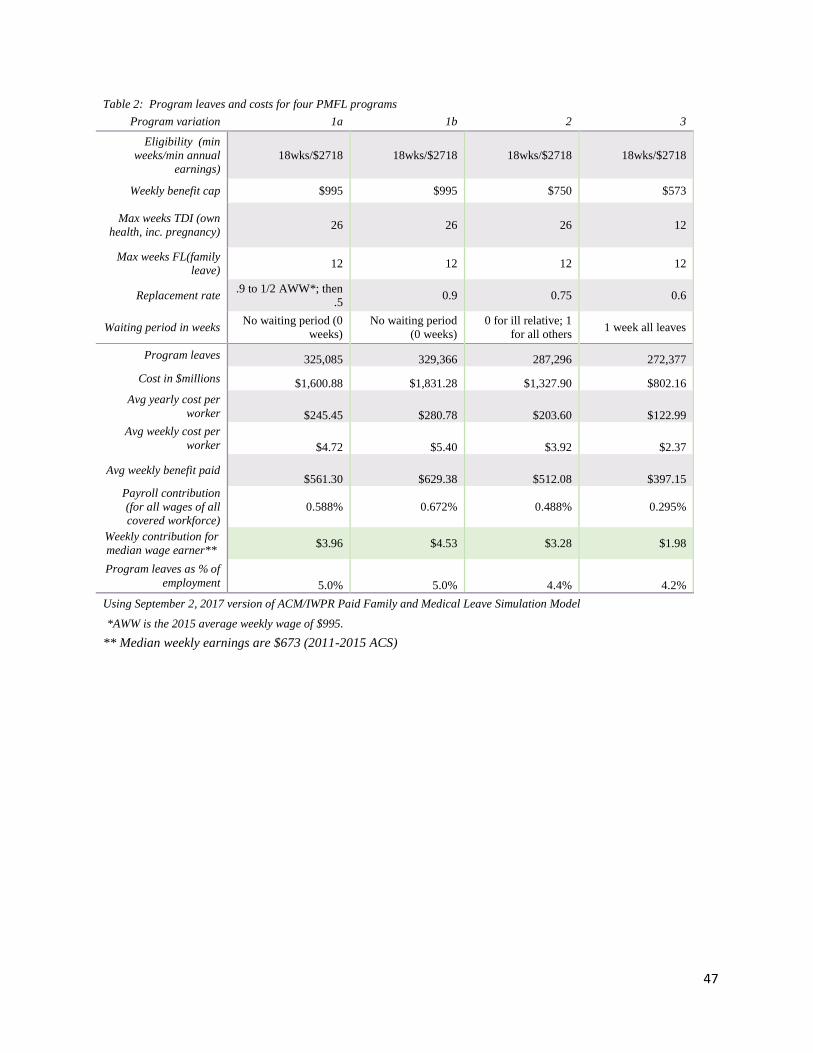
47
Table 2: Program leaves and costs for four PMFL programs
Program variation 1a 1b 2 3
Eligibility (min
weeks/min annual
earnings)
18wks/$2718 18wks/$2718 18wks/$2718 18wks/$2718
Weekly benefit cap $995 $995 $750 $573
Max weeks TDI (own
health, inc. pregnancy) 26 26 26 12
Max weeks FL(family
leave) 12 12 12 12
Replacement rate .9 to 1/2 AWW*; then
.5 0.9 0.75 0.6
Waiting period in weeks No waiting period (0
weeks)
No waiting period
(0 weeks)
0 for ill relative; 1
for all others 1 week all leaves
Program leaves 325,085 329,366 287,296 272,377
Cost in $millions $1,600.88 $1,831.28 $1,327.90 $802.16
Avg yearly cost per
worker $245.45 $280.78 $203.60 $122.99
Avg weekly cost per
worker $4.72 $5.40 $3.92 $2.37
Avg weekly benefit paid $561.30 $629.38 $512.08 $397.15
Payroll contribution
(for all wages of all
covered workforce)
0.588% 0.672% 0.488% 0.295%
Weekly contribution for
median wage earner** $3.96 $4.53 $3.28 $1.98
Program leaves as % of
employment 5.0% 5.0% 4.4% 4.2%
Using September 2, 2017 version of ACM/IWPR Paid Family and Medical Leave Simulation Model
*AWW is the 2015 average weekly wage of $995.
** Median weekly earnings are $673 (2011-2015 ACS)
48
Table 3 Total leave taken, program leaves and percent with wage replacement, currently and under four different
PFML program variations
Program variation Currently* 1a 1b 2 3
Eligibility (min weeks/min
annual earnings) NA 18wks/$2718 18wks/$2718 18wks/$2718 18wks/$2718
Weekly benefit cap NA $995 $995 $750 $573
Max weeks TDI (own health,
inc. pregnancy) NA 26 26 26 12
Max weeks FL(family leave) NA 12 12 12 12
Replacement rate NA
.9 to 1/2
AWW**; then
.5
0.9 0.75 0.6
Waiting period in weeks NA No waiting
period (0)
No waiting period
(0)
0 for ill relative; 1
for all others 1 week all leaves
Total leaves taken
Own health 683,503 707,319 706,659 702,937 698,798
Pregnancy 76,632 78,961 79,159 79,046 78,794
New child 82,750 88,721 88,408 86,380 86,620
Ill relative 279,277 280,451 281,674 281,025 280,497
All leaves 1,122,161 1,155,452 1,155,900 1,149,388 1,144,709
Program leaves taken
Own health NA 204,892 208,001 174,895 165,674
Pregnancy NA 52,255 52,528 51,065 48,320
New child NA 60,070 60,692 53,455 51,978
Ill relative NA 7,868 8,144 7,880 6,405
All leaves NA 325,085 329,366 287,295 272,377
Percent wage replaced
Own health 69.3% 79.1% 79.2% 77.7% 77.6%
Pregnancy 69.3% 92.6% 92.5% 91.8% 91.5%
New child 74.8% 96.2% 96.4% 93.6% 93.2%
Ill relative 72.0% 73.3% 73.5% 73.3% 73.0%
All leaves 70.4% 80.0% 80.0% 78.8% 78.6%
Using September 2, 2017 version of ACM/IWPR Paid Family and Medical Leave Simulation Model
*Because of simulation error, the number of current leaves vary slightly under each program simulation run. Here we present the
average for the four program simulation runs.
**AWW is the 2015 average weekly wage of $995.
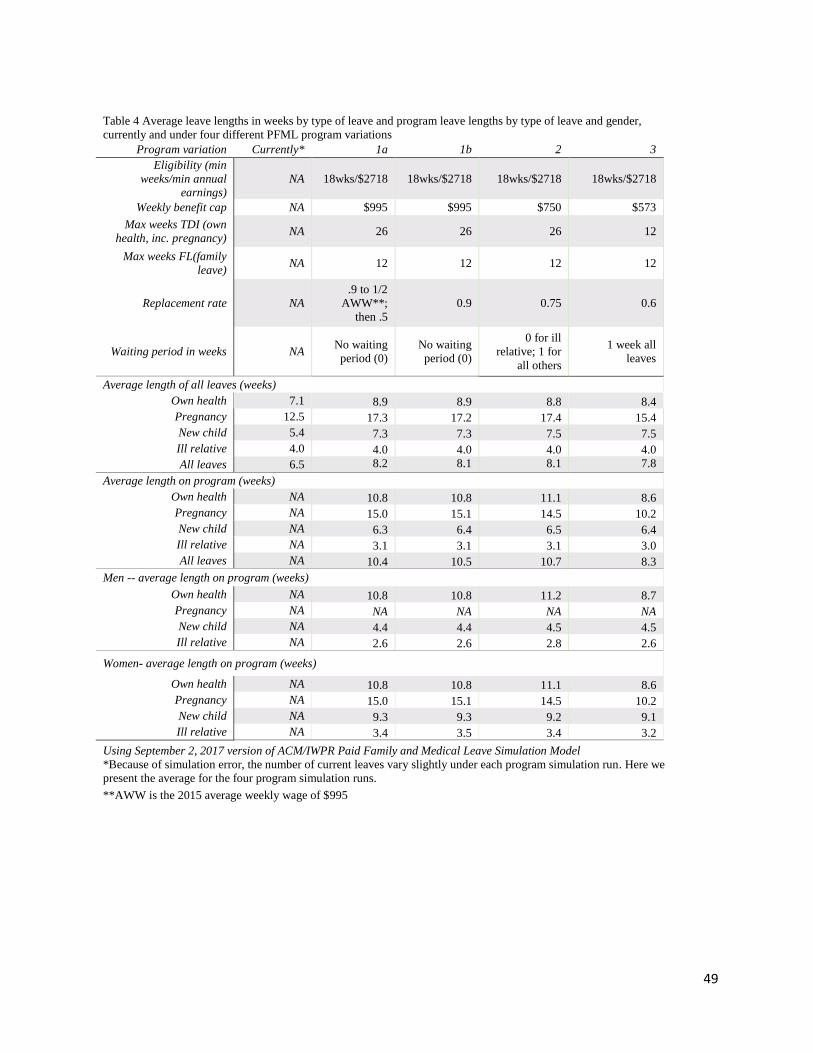
49
Table 4 Average leave lengths in weeks by type of leave and program leave lengths by type of leave and gender,
currently and under four different PFML program variations
Program variation Currently* 1a 1b 2 3
Eligibility (min
weeks/min annual
earnings)
NA 18wks/$2718 18wks/$2718 18wks/$2718 18wks/$2718
Weekly benefit cap NA $995 $995 $750 $573
Max weeks TDI (own
health, inc. pregnancy) NA 26 26 26 12
Max weeks FL(family
leave) NA 12 12 12 12
Replacement rate NA
.9 to 1/2
AWW**;
then .5
0.9 0.75 0.6
Waiting period in weeks NA No waiting
period (0)
No waiting
period (0)
0 for ill
relative; 1 for
all others
1 week all
leaves
Average length of all leaves (weeks)
Own health 7.1 8.9 8.9 8.8 8.4
Pregnancy 12.5 17.3 17.2 17.4 15.4
New child 5.4 7.3 7.3 7.5 7.5
Ill relative 4.0 4.0 4.0 4.0 4.0
All leaves 6.5 8.2 8.1 8.1 7.8
Average length on program (weeks)
Own health NA 10.8 10.8 11.1 8.6
Pregnancy NA 15.0 15.1 14.5 10.2
New child NA 6.3 6.4 6.5 6.4
Ill relative NA 3.1 3.1 3.1 3.0
All leaves NA 10.4 10.5 10.7 8.3
Men -- average length on program (weeks)
Own health NA 10.8 10.8 11.2 8.7
Pregnancy NA NA NA NA NA New child NA 4.4 4.4 4.5 4.5
Ill relative NA 2.6 2.6 2.8 2.6
Women- average length on program (weeks)
Own health NA 10.8 10.8 11.1 8.6
Pregnancy NA 15.0 15.1 14.5 10.2
New child NA 9.3 9.3 9.2 9.1
Ill relative NA 3.4 3.5 3.4 3.2
Using September 2, 2017 version of ACM/IWPR Paid Family and Medical Leave Simulation Model
*Because of simulation error, the number of current leaves vary slightly under each program simulation run. Here we
present the average for the four program simulation runs.
**AWW is the 2015 average weekly wage of $995
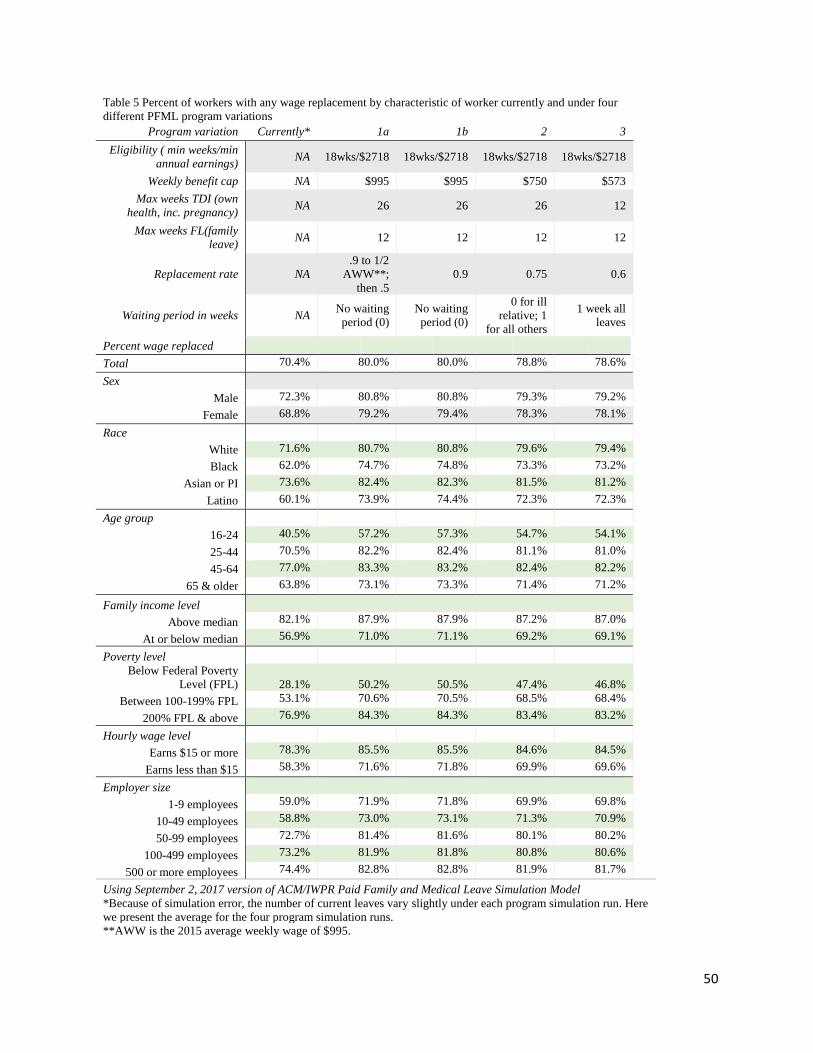
50
Table 5 Percent of workers with any wage replacement by characteristic of worker currently and under four
different PFML program variations
Program variation Currently* 1a 1b 2 3
Eligibility ( min weeks/min
annual earnings) NA 18wks/$2718 18wks/$2718 18wks/$2718 18wks/$2718
Weekly benefit cap NA $995 $995 $750 $573
Max weeks TDI (own
health, inc. pregnancy) NA 26 26 26 12
Max weeks FL(family
leave) NA 12 12 12 12
Replacement rate NA
.9 to 1/2
AWW**;
then .5
0.9 0.75 0.6
Waiting period in weeks NA No waiting
period (0)
No waiting
period (0)
0 for ill
relative; 1
for all others
1 week all
leaves
Percent wage replaced
Total 70.4% 80.0% 80.0% 78.8% 78.6%
Sex
Male 72.3% 80.8% 80.8% 79.3% 79.2%
Female 68.8% 79.2% 79.4% 78.3% 78.1%
Race
White 71.6% 80.7% 80.8% 79.6% 79.4%
Black 62.0% 74.7% 74.8% 73.3% 73.2%
Asian or PI 73.6% 82.4% 82.3% 81.5% 81.2%
Latino 60.1% 73.9% 74.4% 72.3% 72.3%
Age group
16-24 40.5% 57.2% 57.3% 54.7% 54.1%
25-44 70.5% 82.2% 82.4% 81.1% 81.0%
45-64 77.0% 83.3% 83.2% 82.4% 82.2%
65 & older 63.8% 73.1% 73.3% 71.4% 71.2%
Family income level
Above median 82.1% 87.9% 87.9% 87.2% 87.0%
At or below median 56.9% 71.0% 71.1% 69.2% 69.1%
Poverty level
Below Federal Poverty
Level (FPL) 28.1% 50.2% 50.5% 47.4% 46.8%
Between 100-199% FPL 53.1% 70.6% 70.5% 68.5% 68.4%
200% FPL & above 76.9% 84.3% 84.3% 83.4% 83.2%
Hourly wage level
Earns $15 or more 78.3% 85.5% 85.5% 84.6% 84.5%
Earns less than $15 58.3% 71.6% 71.8% 69.9% 69.6%
Employer size
1-9 employees 59.0% 71.9% 71.8% 69.9% 69.8%
10-49 employees 58.8% 73.0% 73.1% 71.3% 70.9%
50-99 employees 72.7% 81.4% 81.6% 80.1% 80.2%
100-499 employees 73.2% 81.9% 81.8% 80.8% 80.6%
500 or more employees 74.4% 82.8% 82.8% 81.9% 81.7%
Using September 2, 2017 version of ACM/IWPR Paid Family and Medical Leave Simulation Model
*Because of simulation error, the number of current leaves vary slightly under each program simulation run. Here
we present the average for the four program simulation runs.
**AWW is the 2015 average weekly wage of $995.
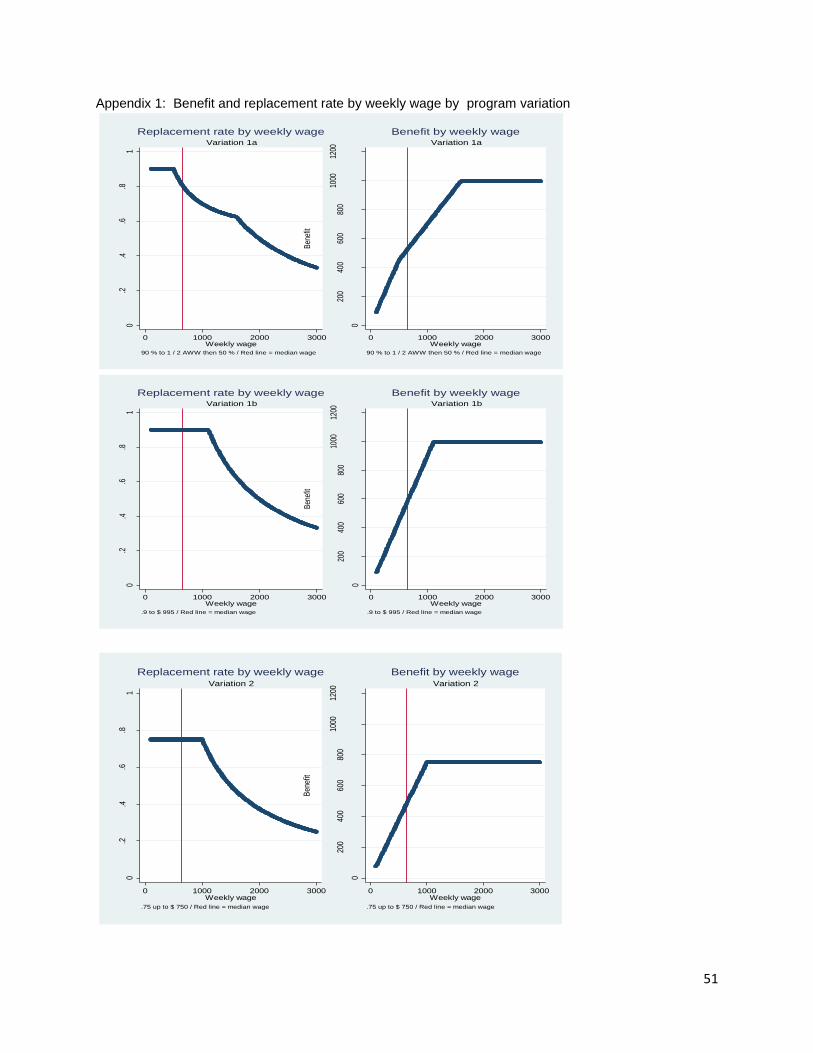
51
Appendix 1: Benefit and replacement rate by weekly wage by program variation
0.2
.4.6
.81
%W
ages
repl
aced
0 1000 2000 3000Weekly wage
90 % to 1 / 2 AWW then 50 % / Red line = median wage
Variation 1a
Replacement rate by weekly wage
0
200
400
600
800
1000
1200
Ben
efit
0 1000 2000 3000Weekly wage
90 % to 1 / 2 AWW then 50 % / Red line = median wage
Variation 1a
Benefit by weekly wage0
.2.4
.6.8
1
%W
ages
repl
aced
0 1000 2000 3000Weekly wage
.9 to $ 995 / Red line = median wage
Variation 1b
Replacement rate by weekly wage
0
200
400
600
800
1000
1200
Ben
efit
0 1000 2000 3000Weekly wage
.9 to $ 995 / Red line = median wage
Variation 1b
Benefit by weekly wage
0.2
.4.6
.81
%W
ages
rep
lace
d
0 1000 2000 3000Weekly wage
.75 up to $ 750 / Red line = median wage
Variation 2
Replacement rate by weekly wage
0
200
400
600
800
1000
1200
Ben
efit
0 1000 2000 3000Weekly wage
.75 up to $ 750 / Red line = median wage
Variation 2
Benefit by weekly wage
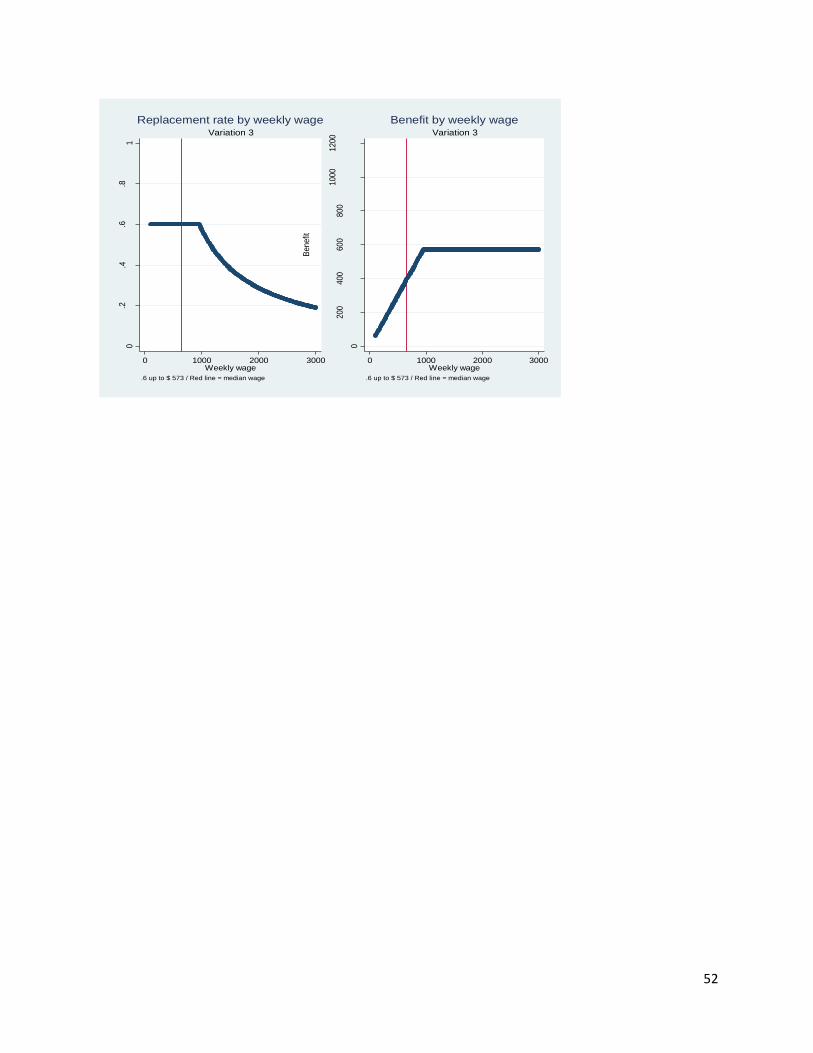
52
0.2
.4.6
.81
%W
ages
repla
ced
0 1000 2000 3000Weekly wage
.6 up to $ 573 / Red line = median wage
Variation 3
Replacement rate by weekly wage
0
200
400
600
800
1000
1200
Benefit
0 1000 2000 3000Weekly wage
.6 up to $ 573 / Red line = median wage
Variation 3
Benefit by weekly wage
53
Appendix C: Pennsylvania’s Grant Proposal Narrative
Statement of Need
Despite societal changes resulting in large increases in the number of working women,
two-working-parent and single-parent households in the United States, most labor laws and
workplace policies have not been updated accordingly. Working adults need to balance work and
family responsibilities, but they have few options available to them unless their employer offers
paid sick leave. In Pennsylvania, care for aging family members is especially important since the
Commonwealth has the fourth oldest population and the fifth most residents over age 65.xxviii
While the federal Family and Medical Leave Act (FMLA) guarantees time off to care for a new
child or ill family member, it only covers about 60 percent of all workers and it only provides
unpaid leave. Four states (California, New Jersey, Rhode Island and New York) have enacted
paid family and medical leave laws that can serve as models for other state efforts. This grant
would support activities to determine options for implementing paid family leave in
Pennsylvania.
The activities proposed include a cost and benefit analysis for different paid family leave
models and a statistical analysis to determine the populations that would benefit from them; a
feasibility study of the state administrative infrastructure for a paid family leave program; an
education, outreach and marketing analysis for implementation purposes to determine current
leave available in Pennsylvania, employer perspectives, general views toward paid leave
programs, including use by men and women, and willingness to support them; and the
establishment of an advisory group comprised of key state officials and paid family leave
advocates to guide grant activities and continue pursuit of paid family leave initiatives post-grant
completion. The Commonwealth will utilize existing state models and research conducted by
previous grant recipients to inform the design and execution of proposed grant activities.
Grant outputs will be used to build the structure and framework of a paid family and
medical leave model (paid family leave) and promote legislative support to establish a paid
family leave program. The Governor is keenly interested in this important workplace issue and
recognizes that the lack of paid family leave affects productivity and negatively impacts
economic growth. Governor Wolf’s “A Fresh Start” campaign agenda supported allowing family
members to take paid leave to care for family members.xxix The Commonwealth allows state
employees to utilize paid sick leave to care for ill family members and transport them to
treatment. Governor Wolf showed further support for paid leave when he threatened to veto
Senate Bill (SB) 333, which would preempt local mandated leave laws.xxx The Governor favors a
paid family leave program that: provides broad coverage for employees; utilizes an inclusive
definition of family members that recognizes diverse family structures to include inter-
generational families, LGBT families, and other non-traditional family structures; and provides
flexibility in when and how leave can be utilized.
Presently, the Commonwealth does not have a statewide paid family leave program or
requirement for private sector workers. A 2014 report from the Pennsylvania Center for Women
and Politics at Chatham Universityxxxi notes that Pennsylvania is one of the more populous states
that offer no family-leave protections other than those afforded by federal law, leaving workers
and their families with fewer protections than their peers in many other states.
While there are no laws at the state level, the Commonwealth’s two largest cities enacted
paid sick days in 2015. Philadelphia adopted a paid sick leave law that covers most employees
and allows for an employee’s own health need or those of a family member. Pittsburgh enacted a
54
paid sick leave ordinance that is the subject of an as yet unresolved legal challenge. These local
efforts do demonstrate the support for and challenges to enacting family-friendly work standards,
such as a paid leave program, in the Commonwealth.
Two members of the Pennsylvania General Assembly have demonstrated interest in
enacting laws providing for paid family leave. Senator Daylin Leach (D) introduced SB 541 in
March 2015 to require employers with four or more employees to provide at least 12 weeks of
paid leave to an employee to care for a child from a period extending from the beginning of the
pregnancy to one year after the birth, adoption or placement of the child. Representative Dan
Truitt (R) also introduced legislation to expand the FMLA at the state level to include siblings.
It is important to note that both the Pennsylvania House and Senate have strong
Republican majorities with many fiscal conservatives in their caucuses. Since 2013, some of
these members have attempted to pass bills interfering with local jurisdictions’ rights to pass paid
sick leave laws. These legislative hurdles to enacting paid family leave laws give credence to the
need for good data, well thought out program design, a strong business case, and documented
public support to aid in moving legislation forward. The research and analysis proposed to be
completed through this grant can assist with making the case that paid family leave programs
help businesses, workers, families and the overall economic well-being of the Commonwealth.
Expected Outcomes and Outputs
The project includes six major components which will result in the following outputs:
1) A report of findings from a statistical analysis on the populations likely to benefit
from adoption of a paid family leave program and anticipated utilization rates using
national model legislation and other models deemed viable.
2) A report of findings from a cost-benefit analysis of paid family leave programs to
include national model legislation and other models deemed viable.
3) A feasibility report on building the infrastructure for state administration of a paid
family leave program. The report will explore existing state program infrastructure
for Unemployment Compensation (UC), Workers Compensation and Labor Law
Compliance programs that may be useful in creating a new paid leave program.
4) A report on the results of a survey of Pennsylvania businesses on what types of paid
family leave employers currently provide, characteristics of the population who
benefit from paid leave, and perspectives of employers on paid leave programs,
including feedback from employers who presently benefit from offering paid leave
programs. In addition to traditional survey methodologies (phone, online) the report
will also include feedback from focus groups with employers.
5) A report on the results of a survey of the general population to include views toward
paid family leave programs, willingness to support/fund programs, preferred plan
elements, and attitudes toward specific paid leave messaging.
6) Establishment of an advisory group comprised of representatives from the Governor’s
Office, relevant state agencies, PathWays PA, Community Legal Services of
Philadelphia, the Women’s Law Project, the Women and Girls Foundation, Keystone
Research Center and other stakeholders identified during project implementation.
As stated above, the current legislative climate in Pennsylvania makes it imperative that
paid family leave proponents have sound data available to make a compelling case for enactment
of legislation. A compelling case can already be made from national statistics. Seven in 10
mothers of children under 18 hold jobs, yet 42 percent have had the experience of being unable
to take time off to care for a child, and 27 percent were unable to take time off to care for a
55
parent.xxxii Alarmingly, 20 percent of women with children reported that they or a family member
have been fired or disciplined by an employer for taking time off to cope with an illness or to
care for a sick child or family member. Among Americans who provide unpaid care to an adult
family member or child with special needs; more than one-third are male.xxxiii
While ample national data exists, members of the Pennsylvania General Assembly will
surely look to state specific data in considering paid family leave legislation. The various reports
resulting from this grant will provide the Pennsylvania-specific information necessary to make a
strong case for paid family leave laws. Advisory committee members will share reports through
their websites; social media platforms; volunteer, donor and supporter lists; and at conferences
and events. Advisory committee groups have been actively advocating for paid family leave
programs, as evidenced by a 2014 event featuring U.S. House Minority Leader Nancy Pelosi in
support of initiatives to boost women’s economic prospects,xxxiv a blog carnival supporting paid
family leave in 2014,xxxv a 2015 Lead on Leave event with White House Senior Advisor Valerie
Jarrett,xxxvi an equal pay day rally in 2016xxxvii and a report on the impact of sex bias in
caregiving on women’s health.xxxviii The advocacy group’s extensive experience supporting paid
sick daysxxxix will be leveraged in support of paid family leave. Research from this grant will
help build upon the positive momentum already established by those existing advocacy efforts.
A paid family leave program could benefit millions of workers in Pennsylvania.
Nationally, only 53 percent of workers are able to take paid sick leave.xl Assuming those
individuals who do not have paid sick leave also do not have paid family leave, roughly 2.9
million Pennsylvania workers out of a total of 6.1 million would directly benefit from a paid
leave program.
One group who may benefit from paid leave is new parents. The US Department of Labor
(US DOL) estimates that only 12 percent of private sector employees have access to paid
maternity leave through their employer. Utilizing Current Population Survey (CPS) data, in 2015
there were approximately 1.54 million women aged 15-44xli working in Pennsylvania in the
private sector. Applying the US average of an estimated 88 percent of workers without access to
paid maternity leave indicates that 1.36 million women in this age group do not have such
access. Pennsylvania has 59.1 births per 1,000 women aged 15-44 each year.xlii Therefore,
approximately 80,300 women would benefit from paid maternity leave each year. Equal access
to paid leave for fathers would roughly double the number of individuals potentially benefitting.
As this is only a measure of private sector workers, there are likely many more individuals
working in the public sector that would benefit from a paid family leave program.
Another segment of individuals who will benefit from a paid family leave program are a
subset of the 480,000 individuals who were out of the Pennsylvania labor force due to “taking
care of house or family.” A portion of those individuals may be able to enter or reenter the
workforce if provided leave to care for family members through a paid leave program.
Project Design
The goal of this project is to research both viable options for and impacts of a
Pennsylvania paid family leave program in order to inform legislation that will provide paid
leave benefits for workers in the Commonwealth. The envisioned system will provide broad
coverage for employees, utilize an inclusive definition of family members that recognizes
diverse family structures, and provide flexibility in leave usage.
Several types of data will be collected in order to meet the goals outlined for this project.
A statistical analysis will determine the populations and the number of individuals likely to
56
benefit from a paid family leave program. While we have found general information about how
many individuals would likely benefit from paid maternity and paternity leave, and the number
of individuals outside of the labor force for household and family obligations, these only account
for a portion of the people likely to benefit from a paid leave program. Data collected under this
grant will provide information on how many individuals will benefit from being able to take paid
time off to care for elderly family members, children with disabilities, and those with family
members with cancer and other debilitating diseases. This grant will also allow us to determine
what types of workers would benefit from a paid family leave program.
Cost-benefit analyses on multiple types of paid leave models will determine the
feasibility and costs and benefits of each model. The plans examined will include an employee-
funded model (such as that in California), an employer-funded model, and a hybrid plan
comprised of both employee and employer contributions (similar to New Jersey and
Pennsylvania’s existing UC program).
Focus groups of Pennsylvania employers will also be conducted to allow the collection of
current market information on what type of leave plans, if any, employers currently offer as well
as employer perspectives on the potential impacts of paid family leave legislation. A survey of
the general population in Pennsylvania will be conducted to determine views toward paid family
leave programs, including use by men and women, and to assess public support.
A list of team members who will implement the project activities is included in the
Budget Justification. The project will also leverage the expertise of the advisory committee. The
proposed approach was selected in order to provide the Commonwealth with as much
information as possible to determine the impacts on all affected communities. Engagement with
employers, workers, advocates, and government officials is crucial in understanding how each
paid family leave program will impact each group, and in determining the legislative approach
that will result in the best possible outcome for all.
Another goal is to encourage equality of leave taking between men and women. Eighty-
five percent of professional working fathers reported they felt pressure to be engaged fully in the
workforce while also serving as an engaged parent.xliii Eighty-nine percent of fathers said if they
were looking for a new job it would be important for the employer to offer paid paternity or
parental leave.xliv Paid family leave programs in other states have shown an increase in the
number of men taking leave. Polling will include questions specifically for males to determine
elements of leave programs that are appealing to them and messaging that will lead to cultural
shifts in perception of caregiving responsibilities.
Enabling more fathers to take leave would also be beneficial to women, both by more
equitably sharing caregiving responsibilities and by reducing the stigma and workplace
discrimination faced by women due to taking the majority of leave. A recent Third Way reportxlv
finds a “motherhood” wage penalty of roughly four percent for each child due to: interrupted job
experience to care for children; changing to more “mother-friendly” jobs that are easier to
combine with parenting; and employer discrimination against mothers due to an assumed lesser
work commitment or performance. Achieving more gender equality in caretaking may also have
long term positive impacts in decreasing the wage gap for women. Pennsylvania has one of the
largest gender wage gaps in the nation.xlvi
Pennsylvania has an aging population. In 2014, Pennsylvania had 1.2 million informal
caregivers providing 1.3 billion caregiving hours, valued at $13.4 billion.xlvii Nationally, nearly
two-thirds of workers between the ages of 45 and 74 provide care to an aging or other adult
loved one, and approximately 20 percent of these working caregivers expect they will need time
57
off from work in the next five years due to their caregiving responsibilities.xlviii Grant research
conducted will place emphasis on program models that allow paid leave to care for aging family
members. This type of model will help Pennsylvania address the current shortage of caregivers
(PA ranks 45th of the 50 statesxlix in the availability of professional caregivers) and will give
more elderly residents the option to age in home, a top priority of the Governor.
Organizational, Administrative and Fiscal Capacity
As lead applicant, the Department of Labor & Industry will oversee the project with its
Center for Workforce Information and Analysis (CWIA) taking the lead in data analysis and
project management. CWIA’s main function is the collection, compilation and analysis of
statistical labor market and program data. CWIA works extensively with data from the CPS and
the American Community Survey which will form the basis of the initial analysis of those likely
to benefit from a paid leave program. Through its work in support of Pennsylvania’s UC
Program, CWIA is versed in the development of various statistical models to gauge the fiscal
impact of proposed legislation on the Commonwealth, employers or employees. Pennsylvania is
one of three states that collect UC contributions from both employers and employees.
Pennsylvania could utilize and build upon the experience in administering employer and
employee UC tax contributions to develop a similar system for funding a state paid family leave
insurance program, making CWIA’s knowledge invaluable for creating a new program. CWIA’s
federal/state cooperative statistics programs rely heavily on employer surveys that involve
intimate interaction with Pennsylvania employers by CWIA staff and require extensive
knowledge of survey methodology and data estimation. This expertise lends itself well to the
survey activities in this proposal. As part of Pennsylvania’s Labor Market Information for the
Green Economy grant, CWIA conducted numerous listening sessions with employers and
experience gleaned from that process will be used to conduct similar focus groups under this
proposal. To the degree necessary, CWIA will contract with entities, in compliance with federal
and state procurement laws and regulations, to assist in completing grant deliverables.
CWIA is also experienced in the fiscal and administrative management of federal grants,
including a cooperative agreement with the Bureau of Labor Statistics for statistical programs
and US DOL grants including the Workforce Information Grant, Labor Market Information for
the Green Economy and the Workforce Data Quality Initiative. CWIA will use the same
accounting systems and processes to administer this grant. CWIA is capable of running reports
that provide the status of all reported expenditures and can further break down expenditures by
cost category or time period to provide more detailed information.
Reports produced under this grant will be utilized beyond the grant period by the Wolf
Administration, advisory group members and other interested stakeholders to encourage
enactment of a paid family and medical leave law in Pennsylvania. CWIA staff will utilize
models developed through this grant to analyze future legislation in terms of estimated program
costs and affected individuals.
58
Resources and Suggested Readings
“Paid Family Leave Market Research”, Andrew Chang & Co. LLC, July 13, 2015, Rev.
December 14, 2015.
U.S Department of Labor Website. Wage and Hour Division. Fact Sheet #28: The Family and
Medical Leave Act. 2012. http://www.dol.gov/whd/regs/compliance/whdfs28.pdf 24
“Family and Medical Leave in 2012: Technical Report”, Abt Associates Inc. September 7, 2012,
Revised April 18, 2014.
Executive Order 13706, Establishing Paid Sick Leave for Federal Contractors.
https://www.dol.gov/whd/govcontracts/eo13706/PaidLeaveFS.pdf
Pennsylvania Center for Women in Politics, “FMLA in PA: A Report on Family and Medical
Leave in the State” (Chatham University 2014).
http://lwd.dol.state.nj.us/labor/forms_pdfs/tdi/WPR-11 A Better Balance, “Overview of Paid
Family Leave Laws in the United States” (2016).CA Employment Development Dept, “Paid
Family Leave Market Research” (2015).
“Estimating Usage and Costs of Alternative Policies to Provide Paid Family and Medical Leave
in the United States”, IMPAQ International and Institute for Women’s Policy Research, January
2017. https://www.dol.gov/asp/evaluation/completed-studies/IMPAQ-Family-Leave-
Insurance.pdf
“Estimating Usage and Costs of Alternative Policies to Provide Paid Sick Days in the United
States”, IMPAQ International and Institute for Women’s Policy Research, January 2017.
https://www.dol.gov/asp/evaluation/completed-studies/IMPAQ-Paid-Sick-Days-1.pdf
“Estimating the Distributional Impacts of Alternative Policies to Provide Paid Sick Days in the
United States”, IMPAQ International and Institute for Women’s Policy Research, January 2017.
https://www.dol.gov/asp/evaluation/completed-studies/IMPAQ-Paid-Sick-Days-2.pdf
“Paid Leave and Employment Stability of First-Time Mothers”, IMPAQ International and
Institute for Women’s Policy Research, January 2017.
https://www.dol.gov/asp/evaluation/completed-studies/IMPAQ-First-Time-Mothers.pdf
“Qualifying for Unpaid Leave: FMLA Eligibility among Working Mothers”, IMPAQ
International and Institute for Women’s Policy Research, January 2017.
https://www.dol.gov/asp/evaluation/completed-studies/IMPAQ-Working-Mothers.pdf
“Family and Medical Leave-Taking among Older Workers”, IMPAQ International and Institute
for Women’s Policy Research, January 2017. https://www.dol.gov/asp/evaluation/completed-
studies/IMPAQ-Older-Workers.pdf
“The Effects of FMLA Eligibility and Awareness on Family Leave-Taking”, IMPAQ
International and Institute for Women’s Policy Research, January 2017.
https://www.dol.gov/asp/evaluation/completed-studies/IMPAQ-Eligibility-and-Awareness.pdf
“Access to paid family leave varies widely across employers, industries”, Pew Research Center,
March 23, 107. http://www.pewresearch.org/fact-tank/2017/03/23/access-to-paid-family-leave-
varies-widely-across-employers-industries/
59
“Paid Family Leave in the United States, Time for a New National Policy”, Urban Institute, May
2017. http://www.urban.org/sites/default/files/publication/90201/paid_family_leave.pdf
“Paid Family Leave Resources”, National Conference of State Legislators, July 19, 2016.
http://www.ncsl.org/research/labor-and-employment/paid-family-leave-resources.aspx
“State Paid Family Leave Insurance Laws”, National Partnership for Women & Families, July
2017. http://www.nationalpartnership.org/research-library/work-family/paid-leave/state-paid-
family-leave-laws.pdf
“Literature Review Paid Family and Medical Leave: Research and Lessons for the District of
Columbia, undated.
https://www.dol.gov/wb/media/DC%20Paid%20Leave%20Literature%20Reviews.pdf
“Paid sick leave and preventive health care service use among U.S. working adults”, LeaAnne
DeRigne and others, Preventative Medicine, Volume 99, pages 58-62, June 2017.
“The Pros and Cons of Sick Pay Schemes: Testing for Contagious Presenteeism and
Noncontagious Absenteeism Behavior”, Steven Pichler, Journal of Public Economics, July 21,
2017.
“Divergent Trends in US Maternity and Paternity Leave, 1994–2015”, Jay Zagorsky, American
Journal of Public Health, February 8, 2017.
“Leave Laws by State and Municipality”, Melissa Burdorf, XpertHR, accessed via Society for
Human Resource Management website, August 30, 2017.
https://www.shrm.org/resourcesandtools/legal-and-compliance/state-and-local-
updates/xperthr/pages/leave-laws-by-state.aspx
60
Endnotes
i Bureau of Labor Statistics, U.S. Department of Labor, “Women in the Labor Force: A Databook,” Report 1049,
May 2014, Table 7, p. 23; https://www.bls.gov/cps/wlf-databook-2013.pdf ii Source might be: http://www.pewsocialtrends.org/files/2015/12/2015-12-17_parenting-in-america_FINAL.pdf iii http://www.pewresearch.org/fact-tank/2015/11/18/5-facts-about-family-caregivers/ iv Joan Williams, Unbending Gender: Why Work and Family Conflict and What to Do About It (Oxford, U.K.:
Oxford University Press, 2011). v Pennsylvania Center for Women and Politics at Chatham University, “FMLA in PA”, 2014
https://www.chatham.edu/centers/pcwp/research/pdf/FMLAinPA.pdf vi Applebaum, E., & Milkman, R. (2011, January 19). Paid Family Leave Pays Off in California. Harvard Business
Review, HBR Blog Network. Retrieved 5 March 2015, from http://blogs.hbr.org/2011/01/paid-family-leave-
pays-off-in/ vii Linda Howser, Thomas Vartanian, “Pay Matters: The Positive Economic Impacts of Paid Family Leave for
Families, Businesses, and the Public,” Center for Women and Work, Rutgers, The State University of New
Jersey, January 2012 viii Pennsylvania Center for Women in Politics, “FMLA in PA: A Report on Family and Medical Leave in the State”
(Chatham University 2014). Sourcing: Pennsylvania Department of Aging. (2013, November 5). Department of
Aging Marks November as Caregiver Support Month. In News and Media. Retrieved April 10, 2014, from
http://www.portal.state.pa.us/portal/ server.pt/gateway/PTARGS_0_2_785_18160_0_43/
http%3B/pubcontent.state.pa.us/publishedcontent/ publish/cop_hhs/aging/dsf_mig/aging_news_and__
media_portlet/articles/de ix Citation: Ruhm, C. J. (1997). Policy watch: the family and medical leave act. Journal of Economic Perspectives,
11, 175-186. x Citation: Corporation for Enterprise Development. (2014). State Profile: Pennsylvania. In Assets and Opportunity
Scorecard. Retrieved February 26, 2014, from http:// scorecard.assetsandopportunity.org/2014/report/ state-
profile xi Citation: Equal Employment Opportunity Commission, EEOC Pregnancy Discrimination Charge Data for
FY1996-FY2005 by Race, Ethnicity, Industry, and State (July 2006), supra note 7, at Chart C. xii Source: Eileen Appelbaum and Ruth Milkman, "Leaves That Pay: Employer and Worker Experiences with Paid
Family Leave in California," Center for Economic and Policy Research, Washington D.C., January 2011,
P.4.; http://cepr.net/documents/publications/paid-family-leave-1-2011.pdf xiii Linda Howser, Thomas Vartanian, “Pay Matters: The Positive Economic Impacts of Paid Family Leave for
Families, Businesses, and the Public,” Center for Women and Work, Rutgers, The State University of New
Jersey, January 2012. xiv Brad Harrington, Fred VanDeusen, Jennifer Sabatini Fraone, Iyar Mazor. “The New Dad: A Portrait of Today’s
Father.” Boston College Center for Work & Family. 2015. xv Applebaum, E., & Milkman, R. (2011, January 19). Paid Family Leave Pays Off in California. Harvard Business
Review, HBR Blog Network. Retrieved 5 March 2015, from http://blogs.hbr.org/2011/01/paid-family-leave-
pays-off-in/ xvi Caregiving in the United States; National Alliance for Caregiving in collaboration with AARP. November 2009. xvii MetLife Study of Working Caregivers and Employer Health Costs; National Alliance for Caregiving and
MetLife Mature Market Institute. February 2010. xviii https://www.brookings.edu/wp-content/uploads/2017/06/es_20170606_paidfamilyleave.pdf page 14. The
Brookings Institute doc references a report from 2009 by Jody Heymann - Jody Heymann, Contagion Nation: A
Comparison of Paid Sick Day Policies in 22 Countries, Center for Economic and Policy Research, May 2009,
http://cepr.net/documents/publications/paid-sick-days-2009-05.pdf xix National Safety Council. (2017, March). How the Prescription Drug Crisis is Impacting American Employers.
Retrieved 24 July 2017, from http://www.nsc.org/NewsDocuments/2017/Media-Briefing-National-Employer-
Drug-Survey-Results.pdf xx See simulation estimates in Table 5 for wage replacement rates currently. xxi Rice University. (2004). Rice University Sociologists Calculate Caregivers Risk of Living in Poverty. Retrieved
(February 2015) from http://news.rice.edu/2004/08/16/rice-university-sociologists-calculate-caregivers-risk-of-
living-in-poverty/
61
xxii Abrams Widdicombe, Aimee Samantha, "State-Provided Paid Family Leave and the Gender Wage Gap"
(2016). Scripps Senior Theses. 792. http://scholarship.claremont.edu/scripps_theses/792 xxiii Lundberg, S. & Rose, E. (2000). Parenthood and the earnings of married men and women. Labour Economics, 7
, 689‐ 710. xxiv U.S. Department of Labor, Bureau of Labor Statistics, National Compensation Survey, 2016, Tables 16 and 32.
Retrieved September 15, 2017 at http://www.bls.gov/ncs/ebs/benefits/2016/ownership_civilian.htm. xxv See simulation estimates in Table 5 below for wage replacement rates currently. xxvi We estimate that in currently in Pennsylvania, women take 54 percent of all medical and family leaves. Length
of leaves by gender are reported in Table 4. xxvii Jacob Alex Klerman, Kelly Daley, and Alyssa Pozniak, Family and Medical Leave in 2012: Technical Report,
Abt Associates, prepared for Department of Labor (2013). xxviii https://www.caregiver.org/sites/caregiver.org/files/pdfs/state2014/state_profile_pa_2014_final.pdf xxix http://b.3cdn.net/tomwolf/28dc8311d9bc153b07_uabm6br2y.pdf xxx http://www.bizjournals.com/philadelphia/morning_roundup/2015/04/wolf-i-would-veto-state-bill-that-would-pre-
empt.html xxxi https://www.chatham.edu/centers/pcwp/research/pdf/FMLAinPA.pdf xxxii http://www.nationalpartnership.org/research-library/work-family/psd/working-women-need-paid-sick-days.pdf xxxiii http://www.caregiving.org/data/Caregiving_in_the_US_2009_full_report.pdf xxxiv http://www.newsworks.org/index.php/local/the-latest/64705-in-philly-visit-pelosi-urges-better-working-
conditions-for-women xxxv http://policypathwayspa.blogspot.com/2014/02/weve-come-not-so-long-way.html xxxvi http://articles.philly.com/2015-04-23/news/61422402_1_valerie-jarrett-president-obama-legislation xxxvii http://www.pghcitypaper.com/Blogh/archives/2016/04/12/pittsburghs-equal-pay-day-rally-highlights-local-
equality-efforts xxxviii http://www.womenslawproject.org/resources/TLE_Chapter1D.pdf xxxix http://www.phillyearnedsickdays.com/ xl https://www.whitehouse.gov/sites/default/files/docs/leave_report_final.pdf xli NAPHSIS age cohort used for total fertility rate xlii Kaiser Family Foundation xliii http://www.abetterbalance.org/web/images/stories/Documents/valuecarework/Reports/ABB_Rep_BeyondBread
winner.pdf xliv http://www.bc.edu/content/dam/files/centers/cwf/news/pdf/BCCWF%20The%20New%20Dad%202014%20
FINAL.pdf xlv http://content.thirdway.org/publications/853/NEXT_-_Fatherhood_Motherhood.pdf xlvi http://www.iwpr.org/publications/pubs/the-status-of-women-in-the-states-2015-2014-employment-and-earnings xlvii https://www.caregiver.org/sites/caregiver.org/files/pdfs/state2014/state_profile_pa_2014_final.pdf xlviii http://www.aarp.org/content/dam/aarp/research/public_policy_institute/ltc/2013/fmla-insight-keeping-up-with-
time-AARP-ppi-ltc.pdf xlix http://www.aarp.org/content/dam/aarp/research/public_policy_institute/ltc/2013/baby-boom-and-the-growing-
care-gap-insight-AARP-ppi-ltc.pdf