Embed Size (px)
Citation preview

PAKISTANWAVE REPORT
FII TRACKER SURVEYConducted September-October 2015
March 2016

PUTTING THE USER FRONT AND CENTER
PAKISTAN
The Financial Inclusion Insights (FII) program responds to the need identified by multiple stakeholders for
timely, demand-side data and practical insights into digital financial services (DFS), including mobile money,
and the potential for their expanded use among the poor.
The FII team conducts regular survey and qualitative research in Kenya, Tanzania, Uganda, Nigeria, India, Pakistan, Bangladesh and Indonesia to:
• Track access to and demand for financial services generally, and the uptake and use of DFS specifically;
• Measure adoption and use of DFS among key target groups (females, BOP, rural, unbanked, etc.);
• Identify drivers and barriers to further adoption of DFS;
• Evaluate the agent experience and the performance of mobile money agents; and
• Produce actionable, forward-looking insights to support product and service development and delivery, based on rigorous FII data.
The FII program is managed by InterMedia. Visit the FII Resource Center to learn more: www.finclusion.org.
2

CONTENTS
1. Executive Summary
2. Financial Inclusion
3. Pakistanis’ Financial Lives
4. Access to, Use of Mobile Phones
5. Financial Services Use
6. Banks
7. Mobile Money
8. Nonbank Financial Institutions
9. Methodology & Research Description
10. Glossary
PAKISTAN
3
4
13
19
30
39
45
52
66
70
73

EXECUTIVE SUMMARY
PAKISTAN
4

PAKISTAN
% of survey % of survey
Gender Age
Male 53% 15-24 28%
Female 47% 25-34 29%
Geography 35-44 17%
Urban 34% 45-54 15%
Rural 66% 55+ 11%
Income Aptitude
Above the $2.50/day
poverty line50% Basic literacy 65%
Below the $2.50/day
poverty line50% Basic numeracy 95%
Survey demographics
Figures are weighted to reflect national census data demographics.
5Source: InterMedia Pakistan FII Tracker survey Wave 3 (N=6,000, 15+) September-October 2015.

PAKISTAN
Country context
6
• As of June 2015, six banks and two microfinance banks were licensed to offer mobile financial services in Pakistan.
o Telenor Easypaisa remains the clear market leader.
• By the end of the second quarter of 2015, a total of 99.5 million transactions, valued at PKR 505.9 billion ($4.8 billion USD),
were conducted. This amounted to a 37 percent increase in transaction volume and a 43 percent increase in value over the
previous quarter.
o Customer transactions amounted to 94.3 million in volume and PKR 308.4 billion (2.95 billion USD) in value.
o Over-the-counter (OTC) transactions represented 70 percent of customer transactions in both volume and value; m-wallet
transactions amounted to approximately 30 percent each in volume and value.
o According to the State Bank of Pakistan, the rise in customer transactions can be attributed to the rise in cash deposits and
withdrawals, fund transfers, G2P transactions and mobile top-ups.
• According to the State Bank of Pakistan (SBP), there were 10.8 million registered mobile money accounts by the end of June
2015.
o Telenor Easypaisa accounted for 7.5 million of the registered accounts, followed by Omni with 1.8 million accounts, and Waseela
Microfinance at 1.2 million accounts.
o Between the first and second quarters of 2015, mobile money registration increased by 44 percent.
o As of the end of June 2015, an estimated 47,902 biometric identification devices were installed at agent locations to facilitate real-
time account opening. Thirty-six percent of agent locations across Pakistan had this capability as of June 2015.
o Between April and June 2015, Mobicash and Easypaisa opened 1.3 million customer accounts using the biometric verification
system, according to SBP data.
Source: InterMedia Pakistan FII Tracker survey Wave 3 (N=6,000, 15+) September-October 2015.

• Financial inclusion remained at under 10 percent of adults.
o Financial inclusion increased from 7 to 9 percent between 2014 and 2015.
o Most demographic groups saw no more than a 1 percent change in financial inclusion. Financial inclusion grew
most for women, doubling from 3 percent in 2014 to 6 percent in 2015.
• Banks are still the major contributor to financial inclusion.
o Registered bank accounts remained steady; 7 percent of adults have bank accounts.
o Mobile money and NBFI accounts both grew from less than 1 percent of adults prior to 2015, to 1 percent of
adults in 2015.
PAKISTAN
Key findings: Financial inclusion
7
7%11%
3%
11%
6%10%
5%9% 11%
6%
12%
7%11%
6%
Totalpopulation
Men Women Urban Rural Abovepoverty
Belowpoverty
2014 2015
Financially included by demographic(Shown: Percentage of Pakistani adults within each demographic group, by year)
Source: InterMedia Pakistan FII Tracker surveys Wave 2 (N=6,000, 15+) September-December 2014; Wave 3 (N=6,000, 15+), September-October 2015.

• Access to financial accounts is driven by both mobile money and banks.
o More adults (9 percent) use mobile money than use banks (8 percent). However, the
majority of mobile money users are unregistered, using the service over the counter
(OTC).
o Eighty-six percent of mobile money users are using the services OTC through an
agent rather than registering for their own accounts.
• Non-digital access is the preferred route to bank account access.
o Nearly all bank account holders reported being able to access their accounts digitally,
but the preferred way to access an account is OTC at a bank branch (82 percent).
o The second choice was through ATMs, at 72 percent.
• Males are more than twice as likely as females to be active bank account holders.
o Ten percent of males were active bank account holders, compared with 4 percent of
females.
o Urban/rural and above/below poverty line divides were 10 percent vs. 6 percent, and
9 percent vs. 5 percent, respectively.
PAKISTAN
Key findings: Account access and ownership
8
1%
8%
9%
15%
0.2%
7%
8%
14%
N/A
9%
7%
14%
Nonbank financialinstitution
Bank
Mobile money
Any financial service
Financial account access
(Shown: Percentage of Pakistani adults, by year)
2014 (N=6,000)
2015 (N=6,000)
2013 (N=6,000)
Source: InterMedia Pakistan FII Tracker surveys Wave 1 (N=6,000, 15+), November 2013-January 2014; Wave 2 (N=6,000, 15+), September-December 2014;
Wave 3 (N=6,000, 15+), September-October 2015.

• Mobile money use, as a portion of awareness, remains steady at just over
one in 10.
o Seventy-two percent of Pakistanis were aware of at least one mobile money
provider, 13 percent of whom had used mobile money at least once. This
compares with 76 percent and 11 percent, respectively, in 2014.
• Regardless of which company someone has a SIM card with, Easypaisa is
the mobile money deployment they are most likely to be able to identify.
o The largest gap between customers’ awareness of their own mobile network
operators’ mobile money products and that of Telenor’s Easypaisa is seen
among Warid customers. Thirty-nine percent of Warid SIM-card holders
could identify Warid’s Mobile Paisa product, but 86 percent could identify
Easypaisa.
o Outside of Telenor SIM card holders, Mobilink customers were most likely
to be able to identify their company’s mobile money service. Sixty percent of
Mobilink customers knew about Mobilink Mobicash.
• Use of mobile money for advanced activities is increasingly common.
o In 2013, 42 percent of mobile money users only used the services for
depositing and withdrawing cash. Now, that number has dropped to 4
percent.
o Advanced use of mobile money services, such as bill pay and loans, has
moved from 28 percent of mobile money users in 2013 to 42 percent in
2015.
PAKISTAN
Key findings: Mobile money
9
42%
7%4%
68%
55%57%
28%
36%42%
2 0 1 3 ( N = 4 2 8 ) 2 0 1 4 ( N = 4 9 3 ) 2 0 1 5 ( N = 5 8 4 )
Basic activities only (CICO and account management)
Basic activities OR P2P only
At least one advanced activity (i.e., bill pay, loan activities)
Mobile money uses, by type(Shown: Percentage of all mobile money users)
Source: InterMedia Pakistan FII Tracker surveys Wave 1 (N=6,000, 15+), November 2013-January 2014; Wave 2 (N=6,000, 15+), September-December 2014;
Wave 3 (N=6,000, 15+), September-October 2015.

• Many Pakistanis who do not have bank accounts lack the necessary information to make informed decisions about bank
account use.
o The top two reasons Pakistanis gave for not registering a bank account were they didn’t have enough money to do so or they didn’t
engage in financial activities that an account could facilitate.
o Among those who thought they did not have enough money, 71 percent admitted they did not know how much it costs to open an
account.
o Seventy-four percent of those who did not believe they could use a bank account for activities they engage in did not know that
bank accounts could be used to make retail purchases. Forty-five percent did not know that banks could be used to access credit.
• Low literacy and the inability to use a mobile phone remain significant barriers to adopting mobile-based financial services.
o Sixty-five percent of Pakistani adults are able to read and understand basic sentences in either Urdu or English.
o Seventy-six percent of adults can access a mobile phone, but just 40 percent had ever sent or received a text message. The technical
skills necessary for using mobile money are similar to those needed to send and receive text messages.
PAKISTAN
Key findings: Awareness, literacy and mobile competency
10
Estimate of cost of opening a bank account(Shown: Percentage of those who believe they don’t have
enough money to open an account, n=2,254)
I don't have enough moneyto open an account
71% Admit not knowing how much it costs to open
a bank account.
19% More than 1,000 PKR ($10 USD)
6% Less than 1,000 PKR ($10 USD)
4% Free
41%
Reason for not opening a bank account(Shown: Percentage of unbanked, n=5,518)
Source: InterMedia Pakistan FII Tracker survey Wave 3 (N=6,000, 15+) September-October 2015.

PAKISTAN
At-a-glance: Bank accounts and mobile money continue to be the primary
means of financial account access
11
1%
7%
1%
9%
0.1%
7%
0.3%
7%
N/A
7%
0.4%
8%
Nonbank financialinstitution
Bank
Mobile money
Any financial service
0.6%
7%
1%
8%
0.1%
6%
0.3%
6%
N/A
6%
0.4%
7%
Nonbank financialinstitution
Bank
Mobile money
Any financial service
Financial account access Registered financial service users(Shown: Percentage of Pakistani adults for each year)
Active* account holders
2014 (N=6,000) 2015 (N=6,000)2013 (N=6,000)
Types of account ownership are not mutually exclusive. *Used the account in the last 90 days
Source: InterMedia Pakistan FII Tracker surveys Wave 1 (N=6,000, 15+), November 2013-January 2014; Wave 2 (N=6,000, 15+), September-December 2014;
Wave 3 (N=6,000, 15+), September-October 2015.
1%
8%
9%
15%
0.2%
7%
8%
14%
N/A
9%
7%
14%
Nonbank financialinstitution
Bank
Mobile money
Any financial service

PAKISTAN
Digital stored-value accounts: accounts in which a monetary value is represented in a digital electronic format and can be retrieved/transferred by the account
owner remotely. For this particular study, DSVAs include a bank account or NBFI account with digital access (a card, online access or a mobile phone
application) and a mobile money account.
12
Main FSP Indicator2014 2015
Base Definition% %
Base n Base n
Adults (15+) who have active digital stored-value accounts6% 8%
All adults6,000 6,000
Poor adults (15+) who have active digital stored-value accounts4% 5%
All poor3,102 3,074
Rural women (15+ ) who have active digital stored-value accounts 2% 3%
All rural females1,760 1,745
Adults (15+) who have active digital stored-value accounts and use them to access
other financial services (beyond basic wallet, P2P and bill pay)
4% 3%All adults
6,000 6,000
Poor adults (15+) who have active digital stored-value accounts and use them to
access other financial services (beyond basic wallet, P2P and bill pay)
3% 2%All poor
3,102 3,074
Rural women (15+) who have active digital stored-value accounts and use them to
access other financial services (beyond basic wallet, P2P and bill pay)
0.9% 0.7%All rural females
1,760 1,745
Active digital stored-value account ownership increased between 2014 and
2015, but use of these accounts for beyond-basic services did not change
Source: InterMedia Pakistan FII Tracker surveys Wave 2 (N=6,000, 15+), September-December 2014; Wave 3 (N=6,000, 15+), September-October 2015.

FINANCIAL INCLUSION
PAKISTAN
13

PAKISTAN
Understanding financial inclusion
What is financial inclusion?
FII’s definition of financial inclusion goes beyond
“having accessed” a financial service. This
comparatively conservative definition requires account
ownership with an institution that provides a full-suite of
financial services and comes under some form of
government regulation.
These services include savings, money transfers,
insurance or investment. Institutions that only offer
loans to consumers, such as some microfinance
institutions (MFIs), are not considered to be full-service
institutions. (Source: InterMedia FII Program)
How is it measured?
To determine financial inclusion, we look at the
percentage of adults who report having an account in
their name with at least one institution offering a full-
suite of financial services.
What is included in this?
Banks, nonbank financial institutions and mobile money
services are included in the financial inclusion measure.
In the case of Pakistan, nonbank financial institutions
include MFIs, committees, and post office banks. In all
countries, individuals must have an account in their own
name.
What isn’t included?
Excluded from the financial inclusion measure are
money guards, savings collectors, hawla/hundi
networks, and digital recharge cards that are not
attached to a bank or MFI account.
Additionally, individuals who have accessed formal
financial services but do not have their own account,
such as those using another family member’s account,
are not included.
14Source: InterMedia Pakistan FII Tracker survey Wave 3 (N=6,000, 15+), September-October 2015.

PAKISTAN
Just under one-tenth of Pakistanis are financially included
9%Financially
included*
have a full-service NBFI account
have a full-service bank account**
have a mobile money account
7%
1%
1%
Individuals must have
accounts with institutions
offering a full suite of
financial services, including
savings facilities. Some
banks and many NBFIs
only offer credit services to
their customers; these are
not included.
*Overlap representing those who have multiple kinds of financial accounts is not shown.
15
**For the purposes of this study, bank account holders have accounts at full-service institutions, unless otherwise noted.
Source: InterMedia Pakistan FII Tracker survey Wave 3 (N=6,000, 15+), September-October 2015.

PAKISTAN
Incremental increases across mobile money and NBFIs grew financial
inclusion overall; product adoption by women drove progress
Overlap representing those who have multiple kinds of financial accounts is not shown.
16
7%9%
Financially included
2014 (N=6,000) 2015 (N=6,000)
Financially included(Shown: Percentage of Pakistani adults)
Source: InterMedia Pakistan FII Tracker surveys Wave 2 (N=6,000, 15+), September-December 2014; Wave 3 (N=6,000, 15+), September-October 2015.
0.3%
7%
0.1%1%
7%
1%
Mobile money Bank NBFI
7%11%
3%
9%11%
6%
Totalpopulation
Men Women
7%11%
6%9%
12%7%
Totalpopulation
Urban Rural
7%10%
5%9%
11%6%
Totalpopulation
Abovepoverty
Below poverty
Financially included by demographic(Shown: Percentage of Pakistani adults within each
demographic group, by year)

PAKISTAN
Financial inclusion corresponds to greater economic stability and financial
planning across poverty levels
17
15% 12%21%
25%
Financially includedabove poverty
(n=355)
Financially excludedabove poverty
(n=2,571)
Financially includedbelow poverty
(n=202)
Financially excludedbelow poverty
(n=2,872)
2015: Economically vulnerable(Shown: Percent of Pakistani adults by financial inclusion, poverty
levels)
2015: Have a financial plan for unexpected events(Shown: Percent of adults by financial inclusion, poverty levels)
62%57% 54% 51%
Financially includedabove poverty
(n=355)
Financially excludedabove poverty
(n=2,571)
Financially includedbelow poverty
(n=202)
Financially excludedbelow poverty
(n=2,872)
Source: InterMedia Pakistan FII Tracker survey Wave 3 (N=6,000, 15+), September-October 2015.

PAKISTAN
Few Pakistanis are digitally included; banks lead digital inclusion
8%Digitally
included*
have a digital NBFI account
have a digital bank account
have a mobile money account
7%
0.3%
1%
*Overlap representing those who have multiple kinds of financial accounts is not shown.
18
Digital access to an account means that an individual can access their account via any number of electronic platforms, including debit and credit cards,
electronic money transfers, or mobile phones.
Source: InterMedia Pakistan FII Tracker survey Wave 3 (N=6,000, 15+), September-October 2015.

PAKISTANIS’ FINANCIAL LIVES
PAKISTAN
19

PAKISTAN
Most adults are at least occasionally able to pay their bills on time
20
*Question allowed for multiple responses.
Regularly experience economic
vulnerability (i.e., can’t afford
food, medical expenses)
Have a financial plan for
unexpected events
Able to pay bills on time
19%
54%
83%
2015: Financial responsibility, vulnerability(Shown: Percentage of Pakistani adults, N=6,000)
2015: Financially
included(n=557)
2015: Financially
excluded(n=5,443)
59% 54%
17% 19%
89% 82%
Source: InterMedia Pakistan FII Tracker survey Wave 3 (N=6,000, 15+), September-October 2015.

PAKISTAN
One in five experience economic vulnerability, most often having to pass on
medical help or family engagements
21
2015: Form of economic vulnerability (Shown: Percentage of vulnerable adults, n=1,148)
%
Gone without medical help 55%
Miss an important family event
(i.e., funeral, wedding, etc.)
40%
Gone without food to eat 23%
Gone without cooking fuel 21%
Gone without fertilizer for the farm 16%
Gone without help from a veterinarian 15%
Couldn’t pay school fees 10%
Had to close down business temporarily or completely 7%
19%regularly experience
some form of
economic vulnerability
2015: Economic vulnerability(Shown: Percentage of Pakistani adults, N=6,000)
2015: Profile of vulnerable adults (n=1,148)
53% Female
62% Rural
67% Live on less than $2.50 a day
14% Live on less than $1.25 a day
93% Numerate
46% Illiterate
Source: InterMedia Pakistan FII Tracker survey Wave 3 (N=6,000, 15+), September-October 2015.

PAKISTAN
13%
24%
18%
22%
11%
24%
17%
25%
34%
28%
31%
32%
26%
15%
22%
8%
10%
4%
7%
3%
6%
6%
6%
10%
Below poverty line
Above poverty line
Unbanked
Banked
We can buy
what we want
We can buy
some expensive
goods
Have enough
money for food &
clothes and can
save some
We have enough
money for food
but buying
clothes is hard
We don’t have
enough money
for food
Don’t know/
refused
2015: Perceptions of household purchasing power(Shown: Percentage of Pakistani adults, N=6,000)
22Source: InterMedia Pakistan FII Tracker survey Wave 3 (N=6,000, 15+), September-October 2015.
Unbanked and below-poverty-line households’ perceptions of their purchasing
power are far lower than the perceptions held by their counterparts
n=482
n=5,518
n=2,926
n=3,074

PAKISTAN
Close to half the population is gainfully employed
23
Housewife/student Gainfully employed Unemployed, seeking jobsRetired, disabled or other
2015: Employment(Shown: Percentage of Pakistani adults, N=6,000)
46% gainfully employed
51% housewife or student
2% unemployed, seeking jobs
2% retired, disabled or other
Due to rounding, percentages add to 101.
Source: InterMedia Pakistan FII Tracker survey Wave 3 (N=6,000, 15+), September-October 2015.

PAKISTAN
The vast majority of gainfully employed adults are males; working on or
owning a farm is the most common occupation
24
5%
5%
6%
12%
13%
27%
Driver, including rickshaws
Factory employee
Public or health serviceworker
Manual laborer
Shop owner
Farmer/ farm owner
2015: Most common primary occupation(Shown: Percentage of gainfully employed adults, n=2,857)
2015: Employment(Shown: Percentage of Pakistani adults, N=6,000)
%Gainfully employed
53% of the population is male; but males make
up 94% of the gainfully employed.
Source: InterMedia Pakistan FII Tracker survey Wave 3 (N=6,000, 15+), September-October 2015.

0.4%
0.5%
2%
7%
7%
13%
34%
89%
MFI
State Life Insurance Corporation ofPakistan
A money guard
With people in the community
Bank
Savings or lending group
Gold
Cash at home
PAKISTAN
Many Pakistanis save money, mostly through informal means
2015: Savings(Shown: Percentage of Pakistani adults, N=6,000)
25
currently have
savings
72%8%
of savers know the interest rate
they earn on their savings.
2015: Location of savings(Shown: Percentage of adults who save, n=4,291)
Emergencies (67%) and to make
ends meet (57%) are the top two
reasons people save money.
Source: InterMedia Pakistan FII Tracker survey Wave 3 (N=6,000, 15+), September-October 2015.

2015: Borrowing(Shown: Percentage of Pakistani adults, N=6,000)
0.4%
2%
5%
6%
8%
85%
Other formal institution
Banks
MFI
A group that lends to others, withinterest
An informal moneylender
Family or friends
2015: Source of loans(Shown: Percentage of adults who borrow, n=1,123)
PAKISTAN
Few Pakistanis have borrowed money; family and friends are the primary
sources of loans
26
50% of borrowers know the
interest rates on their loans.
have borrowed
money
18%
Source: InterMedia Pakistan FII Tracker survey Wave 3 (N=6,000, 15+), September-October 2015.

0.4%
0.9%
2%
4%
18%
23%
72%
Unemployment
Retirement/pension
Property
Agriculture
Vehicle
Medical
Life
PAKISTAN
Few Pakistanis have insurance; most who do have life insurance
2015: Insurance(Shown: Percentage of Pakistani adults, N=6,000)
27
have
insurance
3%92% with life insurance bought it through
the State Life Insurance Corporation of
Pakistan; 6% acquired it through a private
insurance provider.
2015: Type of insurance(Shown: Percentage of adults with insurance, n=162)
Source: InterMedia Pakistan FII Tracker survey Wave 3 (N=6,000, 15+), September-October 2015.

PAKISTAN
28Source: InterMedia Pakistan FII Tracker survey Wave 3 (N=6,000, 15+), September-October 2015.
2015: Primary reasons for not having insurance(Shown: Percentage of uninsured adults, n=5,838)
A lack of awareness and understanding is preventing insurance coverage
from becoming more commonplace
3% 97%
uninsured
3%
3%
5%
11%
22%
39%
Registration paperwork is too complicated
I don't own anything valuable
I don't know how to get it
No reason, never thought of it before
I don't know what it is
I don't need it

17%
17%
20%
22%
26%
32%
Loss of property due to theft or burglary
Loss of harvest or livestock
Bankruptcy
Loss of house due to a natural disaster
Death in the family
Major medical emergency
PAKISTAN
29
0.8% had health
insurance (n = 1,961)
0.1% had property
insurance (n = 1,004)
1% had life
insurance (n = 1,614)
Source: InterMedia Pakistan FII Tracker survey Wave 3 (N=6,000, 15+), September-October 2015.
2015: Unexpected expenses for which people have a financial plan(Shown: Percentage of Pakistani adults, N=6,000)
Insurance may be rare, but more do plan for medical expenses, death in the
family

ACCESS TO, USE OF MOBILE PHONES
PAKISTAN
30

72%
54%
76%
59%
PAKISTAN
31
Low mobile phone ownership and a lack of competency with a phone
continue to be barriers to DFS uptake
Have access to a mobile phone(Shown: Percentage of Pakistani adults, by year)
Own a mobile phone(Shown: Percentage of Pakistani adults, by year)
37%
sent/received
SMS
2014 (N=6,000) 2015 (N=6,000)
Basic mobile phone competency (has sent/received
text messages [SMS])(Shown: Percentage of Pakistani adults, by year)
2014
2015
40%
sent/received
SMS
In 2015, 62% sent
or received an SMS
Source: InterMedia Pakistan FII Tracker surveys Wave 2 (N=6,000, 15+), September-December 2014; Wave 3 (N=6,000, 15+), September-October 2015.

PAKISTAN
SIM-card access, ownership(Shown: Percentage of Pakistani men, women by year)
SIM-card access, ownership is largely static; few discarded a SIM as a result
of the verification initiative
32
77% 76%
29% 33%
7% 6%
29%
33%
2014 2015 2014 2015
WomenMen
Own a SIM card Can access but don’t
own a SIM
7%93%
Households affected by SIM-card verification initiative(Shown: Percentage of Pakistani adults, N=6,000)
A household member
discarded a SIM card due to
the verification initiative
The SIM-card verification initiative that was part of the new
biometric registration requirement caused some disruption,
with 7 percent of adults reporting their households were
affected by it. However, it did not appear to reduce
ownership or access to SIMs among either gender.
Source: InterMedia Pakistan FII Tracker surveys Wave 2 (N=6,000, 15+), September-December 2014; Wave 3 (N=6,000, 15+), September-October 2015.

11%
28%
72%
PAKISTAN
33
Basic phones – those that only allow calling, SMS and saving phone numbers
– are more common than smartphones or feature phones
Basic phone
Feature phone
Smartphone
2015: Type of mobile phone*(Shown: Percentage of mobile phone owners, n=3,547)
59%Own a mobile
phone
Basic phone: Only allows calling, text messaging (SMS) and saving phone numbers
Feature phone: Has a camera, radio, etc., but does not have email or mobile applications
Smartphone: Provides access to email accounts, mobile applications
*Question allowed for multiple responses, depending on the number of phones owned.
Source: InterMedia Pakistan FII Tracker survey Wave 3 (N=6,000, 15+), September-October 2015.

10%
18%
19%
31%
38%
Warid
Ufone
Zong
Mobilink
Telenor
PAKISTAN
34
Telenor has the greatest market share among mobile phone owners, and its
customers tend to have the highest rate of basic phone ownership
2015: SIM card providers(Shown: Percentage of mobile phone owners, n=3,547)
Basic Feature Smart
72% 28% 11%
69% 31% 14%
64% 37% 17%
66% 33% 16%
69% 31% 11%
2015: Mobile phone ownership type, by provider(Shown: Percentage of SIM-card owners, by MNO*)
*Mobile network provider
Source: InterMedia Pakistan FII Tracker survey Wave 3 (N=6,000, 15+), September-October 2015.

PAKISTAN
Male Female Above the poverty line Below the poverty lineUrban Rural
Mobile phone owners tend to be men, urban and above the poverty line;
women, rural, lower income individuals borrow phones if they have access at all
35
2015: Dynamics of mobile phone access(Shown: Percentage of mobile phone owners, by ownership type)
59%Own a mobile
phone
78%
65%66%
36%
55%51%
18%Can borrow a
mobile phone6%
20%
18%31%
17%18%
24%Have no access to
a mobile phone15% 15% 16%
33%28%
31%
Source: InterMedia Pakistan FII Tracker survey Wave 3 (N=6,000, 15+), September-October 2015.

0.5%
0.6%
3%
PAKISTAN
36
Consumers with greater mobile phone proficiency are more likely to have
mobile money accounts or be financially included
2015: Have ever sent a text message (SMS)(Shown: Percentage of Pakistani adults, N=6,000)
15%financially
included
40% 60%SMS incapableHave sent an SMS
(SMS capable)
2%
2%
14%Bank
Mobile money
NBFI
4%financially
included
Bank
Mobile money
NBFI
2015: Full-service account ownership
(financial inclusion)(Shown: Percentage of SMS capable, n=2,335)
2015: Full-service account ownership
(financial inclusion)(Shown: Percentage of SMS incapable, n=3,665)
Source: InterMedia Pakistan FII Tracker survey Wave 3 (N=6,000, 15+), September-October 2015.

15-24 year olds
(n=1,219)
25-34 year olds
(n=1,719)
35-44 year olds
(n=1,492)
45-54 year olds
(n=1,019)
55+
(n=551)
26% 20% 17% 11% 6%15-24
PAKISTAN
37
The greatest disparity in advanced phone use is by age, not by poverty or
gender
Male
(n=3,155)
Female
(n=2,845)
Urban
(n=2,030)
Rural
(n=3,970)
Above poverty
(n=2,926)
Below poverty
(n=3,074)
24% 12% 27% 14% 23% 14%
25-34 35-44 45-54 55+
2015: Advanced phone use by demographic(Shown: Percentage of subgroups)
18%
use a mobile
phone for advanced
functions
Greatest gap between
demographics
Source: InterMedia Pakistan FII Tracker survey Wave 3 (N=6,000, 15+), September-October 2015.
Total populationN=6,000

PAKISTAN
38
Advanced users tend to take photos, browse the internet, download
multimedia or send/receive multimedia messages (MMS)
2015: Advanced phone use(Shown: Percentage of mobile phone users, n=4,605)
4%
4%
5%
7%
8%
10%
11%
11%
18%
Made a financial transaction
Navigation/ maps
Used "Call Tunes" or other on-demandaudio/video service
Downloaded any other mobile application
Used social media (i.e., WhatsApp,Facebook, etc.)
Sent/received MMS
Used/ browsed the internet
Downloaded music or video games
Took a color picture
use a mobile
phone for advanced
functions
Source: InterMedia Pakistan FII Tracker survey Wave 3 (N=6,000, 15+), September-October 2015.
15% use two or more
advanced functions
12% use three or more
Total populationN=6,000
18%

FINANCIAL SERVICES USE
PAKISTAN
39

PAKISTAN
At-a-glance: Mobile money access and use has grown vs. 2013
40
1%
7%
1%
9%
0.1%
7%
0.3%
7%
N/A
7%
0.4%
8%
Nonbank financialinstitution
Bank
Mobile money
Any financial service
0.6%
7%
1%
8%
0.1%
6%
0.3%
6%
N/A
6%
0.4%
7%
Nonbank financialinstitution
Bank
Mobile money
Any financial service
1%
8%
9%
15%
0.2%
7%
8%
14%
N/A
9%
7%
14%
Nonbank financialinstitution
Bank
Mobile money
Any financial service
Financial account access Registered financial service users(Shown: Percentage of Pakistani adults for each year)
Active account holders
2014 (N=6,000) 2015 (N=6,000)2013 (N=6,000)
Types of account ownership are not mutually exclusive.
Source: InterMedia Pakistan FII Tracker surveys Wave 1 (N=6,000, 15+), November 2013-January 2014; Wave 2 (N=6,000, 15+), September-December 2014;
Wave 3 (N=6,000, 15+), September-October 2015.

67%
96%
90%
97%
2014: Base (n) was too small to conduct analysis
87%
2013 and 2014: Bases (n) were too small to conduct analysis
87%
N/A
86%
87%
Nonbank financial institution
Bank
Mobile money
Any financial service
0.6%
7%
1%
8%
0.1%
6%
0.3%
6%
N/A
6%
0.4%
7%
Nonbank financial institution
Bank
Mobile money
Any financial service
PAKISTAN
Most account holders are active users of their financial services, bank
account holders are the most active
Active* financial account holders(Shown: Percentage of Pakistani adults)
41
Active* financial account holders(Shown: Percentage of registered users for each type of account, by year)
*A registered account used in the last 90 days. Types of accounts are not mutually exclusive.
2014 (N=6,000) 2015 (N=6,000)2013 (N=6,000) 2014 20152013
Source: InterMedia Pakistan FII Tracker surveys Wave 1 (N=6,000, 15+), November 2013-January 2014; Wave 2 (N=6,000, 15+), September-December 2014;
Wave 3 (N=6,000, 15+), September-October 2015.

5%
6%
4%
7%
10%
10%
9%
1%
1%
0.1%
1%
2%
1%
1%
0.3%
0.2%
1%
0.6%
0.3%
2%
1%
6%
6%
5%
8%
11%
12%
11%
Below poverty line (n=3,074)
Rural (n=3,970)
Females (n=2,845)
Total population (N=6,000)
Males (n=3,155)
Urban (n=2,030)
Above poverty line (n=2,926)
PAKISTAN
2015: Active account usage by demographic(Shown: Percentage of each subgroup)
There are disparities in active use by poverty level, urban/rural and gender
42Source: InterMedia Pakistan FII Tracker survey Wave 3 (N=6,000, 15+), September-October 2015.
Types of accounts are not mutually exclusive.
Active mobile-money account holders Active NBFI account holdersActive bank account holders All financial account holders

42%
7%4%
68%
55%57%
28%
36%42%
2 0 1 3 ( N = 4 2 8 ) 2 0 1 4 ( N = 4 9 3 ) 2 0 1 5 ( N = 5 8 4 )
Basic activities only (CICO and account management)
Basic activities OR P2P only
At least one advanced activity (i.e., bill pay, loan activities)
PAKISTAN
Bank uses, by type(Shown: Percentage of active bank account holders)
43
Mobile money uses, by type(Shown: Percentage of all mobile money users)
37%27% 31%
39% 32% 38%
60%
67%
61%
2 0 1 3 ( N = 4 1 9 ) 2 0 1 4 ( N = 3 9 1 ) 2 0 1 5 ( N = 4 6 7 )
Basic activities only (CICO and account management)
Basic activities OR P2P only
At least one advanced activity (i.e., bill pay, loan activities)
Due to the changes in the questionnaire some data points may not be directly comparable across years.
More consumers are utilizing advanced mobile money services vs.
previous years
Source: InterMedia Pakistan FII Tracker surveys Wave 1 (N=6,000, 15+), November 2013-January 2014; Wave 2 (N=6,000, 15+), September-December 2014;
Wave 3 (N=6,000, 15+), September-October 2015.

More adults know of a mobile money (MM) agent within 1 km of where they
live than they do of any banking point-of-service (POS)
PAKISTAN
2015: Proximity to points-of-service (POS) for financial institutions(Shown: Percentage of Pakistani adults N=6,000)
71%
47%
20%
46% 44%
32%
39%34%
10%5%
11% 13% 13% 13%18%
15%11%
8%
21%
15%18%
24%
32% 30%
7%
41%
48%
26% 25%
31%
12%
21%
Any POS ROSCA MFI Retail store with anMM agent
MM agent Retail store withbank deposit or
withdrawal
Bank branch ATM
52% know of any mobile
money agent within 1 km
of their home
44
44% know of any banking POS within
1 km of their home
Source: InterMedia Pakistan FII Tracker survey Wave 3 (N=6,000, 15+), September-October 2015.
1-5 kms from home More than 5 kms from homeLess than 1 km from home Don’t know

BANKS
PAKISTAN
45

PAKISTAN
At-a-glance: Bank account access and use is mostly static vs. 2013
46
1%
7%
1%
9%
0.1%
7%
0.3%
7%
N/A
7%
0.4%
8%
Nonbank financialinstitution
Bank
Mobile money
Any financial service
0.6%
7%
1%
8%
0.1%
6%
0.3%
6%
N/A
6%
0.4%
7%
Nonbank financialinstitution
Bank
Mobile money
Any financial service
Financial account access Registered financial service users(Shown: Percentage of Pakistani adults for each year)
Active account holders
2014 (N=6,000) 2015 (N=6,000)2013 (N=6,000)
Types of account ownership are not mutually exclusive.
Source: InterMedia Pakistan FII Tracker surveys Wave 1 (N=6,000, 15+), November 2013-January 2014; Wave 2 (N=6,000, 15+), September-December 2014;
Wave 3 (N=6,000, 15+), September-October 2015.
1%
8%
9%
15%
0.2%
7%
8%
14%
N/A
9%
7%
14%
Nonbank financialinstitution
Bank
Mobile money
Any financial service

PAKISTAN
2015: Bank account ownership, by type(Shown: Percentage of Pakistani adults, N=6,000)
47
Credit-only bank accounts make up a small portion of consumer bank
accounts
Registered full-service
bank account
Do not have a
registered bank account
7%0.6%
91%
0.7%
Registered credit-only
bank account
Source: InterMedia Pakistan FII Tracker survey Wave 3 (N=6,000, 15+), September-October 2015.
Registered neither credit-only
nor full-service bank account

PAKISTAN
2015: Preferred method of bank account access(Shown: Percentage of full-service bank account holders, n=482)
48
Bank account holders prefer to access their accounts over the counter at
a bank branch
1%
1%
6%
74%
82%
ATM
Over the counter at a
bank branch
Through a mobile app
Through the bank’s
website
Through a mobile wallet
Source: InterMedia Pakistan FII Tracker survey Wave 3 (N=6,000, 15+), September-October 2015.

PAKISTAN
2015: Top reasons for not registering for a bank account(Shown: Percentage of adults without a bank account, n=5,518)
49
The primary reasons Pakistanis do not register for bank accounts are a
perceived lack of money or the need for a bank account
2%
2%
2%
4%
6%
30%
40%I don’t have money
I don’t need one, I don’t
make transactions
I don’t have money to
make transactions
I don’t know what it is
I don’t know how to open
oneRegistration paperwork is
too complicated
93%of adults do not
have a bank
account registered
in their name
Source: InterMedia Pakistan FII Tracker survey Wave 3 (N=6,000, 15+), September-October 2015.
There is no bank close to
where I live

PAKISTAN
Estimate of cost of opening a bank
account(Shown: Percentage of those who believe they don’t
have enough money to open an account, n=2,254)
50
30%
40%
I don't need one, I don't maketransactions
I don't have money
71% Admit not knowing how
much it cost to open a
bank account
19% More than
1,000 PKR
6% Less than 1,000
PKR ($10 USD)
4% Free
Awareness of potential uses for
bank accounts(Shown: Percentage of those who believe
they don’t make transactions that warrant an
account, n=1,639)
26%
55%
70%
85%
88%
Retail shopping
Loans
Person-to-persontransfers
Cash withdrawal anddeposit
Savings
Source: InterMedia Pakistan FII Tracker survey Wave 3 (N=6,000, 15+), September-October 2015.
(Base: individuals who do not have a bank account, n=5,518)
The barriers to bank account ownership – the perceived lack of money or
need for an account -- are driven by low awareness of banking costs and uses

36%
24%
9%
8%
5%
4%
3%
2%
2%
PAKISTAN
Investment activity
Save/set aside money
Bill pay
Receive wages
Loan activity
Make bank2bank transfers
Receive G2P payments
Pay for large acquisitions
Pay for goods at a store
2015: Advanced bank account uses(Shown: Percentage of active bank account holders, n=467)
51
Active bank account holders utilize their accounts for an array of advanced
functions, including bill pay and receiving wages
61%of active registered
users have used at
least one
advanced function
through their
accounts
Source: InterMedia Pakistan FII Tracker survey Wave 3 (N=6,000, 15+), September-October 2015.
Question allowed for multiple responses.

MOBILE MONEY
PAKISTAN
52

PAKISTAN
53
65%
aware
2013 (N=6,000)
Conversion from awareness of mobile money providers* to mobile money use(Shown: Percentage of Pakistani adults for each year)
2014 (N=6,000) 2015 (N=6,000)
MM OTC use, 7%
MM registered
users, 0.4%
MM OTC use, 8%
MM registered
users, 0.3%
MM OTC use, 8%
MM registered users, 1%
7% use
mobile
money
0.11
conversion
rate
8% use
mobile
money
0.11
conversion
rate
9% use
mobile
money
0.13
conversion
rate
Awareness of mobile money providers remains high; it has not yet
translated into widespread use
76%
aware72%
aware
*Awareness of at least one mobile money provider
Source: InterMedia Pakistan FII Tracker surveys Wave 1 (N=6,000, 15+), November 2013-January 2014; Wave 2 (N=6,000, 15+), September-December 2014;
Wave 3 (N=6,000, 15+), September-October 2015.

0%
0%
1%
2%
5%
12%
20%
89%
MCB Mobile
Mobile Paisa
HBL Express
Zong Timepey
Ufone/Upayment
UBL Omni
Mobilink Mobicash
Telenor Easypaisa
PAKISTAN
Several providers have a presence in the market, with one-third using a
provider other than market leader Telenor
2015: Mobile money usage by provider(Shown: Percentage of mobile money users, n=584)
54
Don't use Telenor,
11%
Only use Telenor, 68%
Use Telenor & other MM
services, 21%
2015: Mobile money (MM) usage exclusivity(Shown: Percentage of mobile money users, n=584)
32% of mobile
money users
Source: InterMedia Pakistan FII Tracker survey Wave 3 (N=6,000, 15+), September-October 2015.

Mobile money product awareness by SIM ownership(Shown: Percentage of SIM owners, by MNO)
Telenor(n=1,354)
Uphone(n=648)
Zong(n=672)
Warid(n=354)
Mobilink(n=1,109)
Telenor Easypaisa 85% 86% 77% 86% 81%
Ufone/Upayment 38% 47% 42% 45% 33%
Zong Timepay 38% 45% 47% 40% 28%
Warid Mobile Paisa 24% 25% 31% 39% 21%
Mobilink Mobicash 58% 58% 62% 65% 60%
PAKISTAN
Source: InterMedia Pakistan FII Tracker survey Wave 3 (N=6,000, 15+), September-October 2015.
With the exception of Telenor, only portions of an MNO’s customers know
that it offers mobile money
55
Easypaisa is the
most recognized
mobile money
product regardless
of which provider an
individual has a SIM
card with.
Mobile network operators
Mo
bile m
on
ey p
rovid
ers

PAKISTAN
7%
11%
3%
8%7%
9%
6%8%
12%
4%
10%
7%9%
7%9%
14%
4%
12%
8%
11%
8%
Total populationN=6,000
Male Female Urban Rural Above poverty line Below poverty line
Demographic trends for mobile money use (Shown: Percentage of adults to ever use mobile money who fall into each category)
Mobile money use increased across almost all demographics
56
2014 20152013
Source: InterMedia Pakistan FII Tracker surveys Wave 1 (N=6,000, 15+), November 2013-January 2014; Wave 2 (N=6,000, 15+), September-December 2014;
Wave 3 (N=6,000, 15+), September-October 2015.
*Categories are not mutually exclusive.

PAKISTAN
Most account holders registered for their accounts because of a
recommendation by a mobile money user
2015: Main reason for registering for a mobile
money account(Shown: Percentage of mobile money account holders, n=74)
Source: InterMedia Pakistan FII Tracker survey Wave 3 (N=6,000, 15+), September-October 2015.
32%
5%
3%
2%
0.9%
Bill pay
Loan activities
Make MM2MM transfers
Save/set aside money
Receive government payments
2015: Most common uses for mobile money account beyond
cash-in and cash-out transactions(Shown: Percentage of mobile money account holders, n=74)
57
51%Recommendation
from a current user
25%To send money to
someone
13%To receive money
from someone
11%Miscellaneous
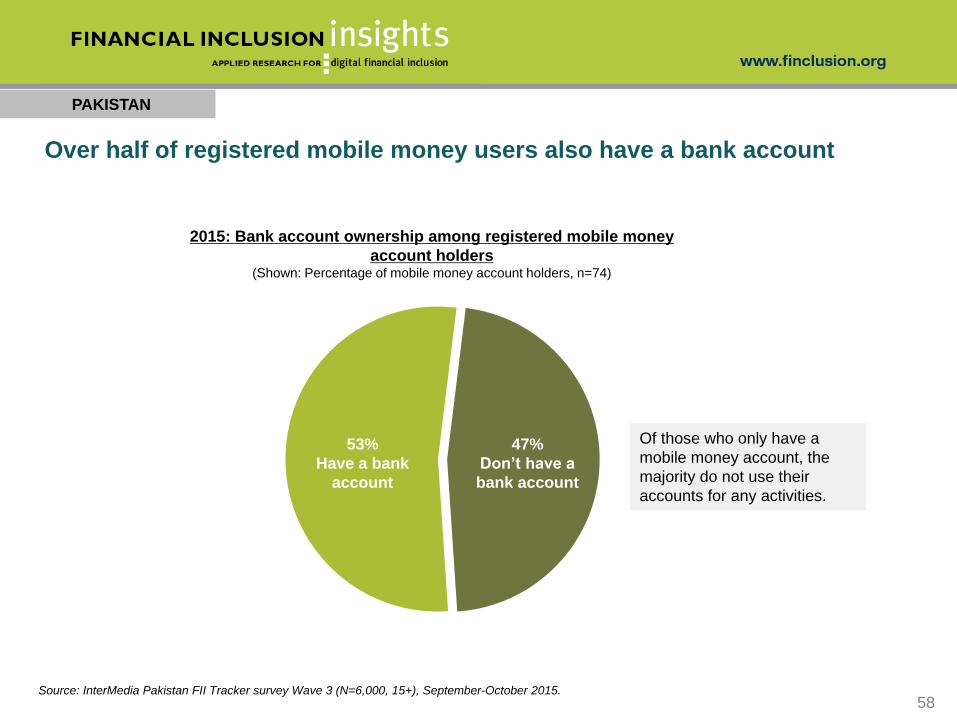
Of those who only have a
mobile money account, the
majority do not use their
accounts for any activities.
PAKISTAN
2015: Bank account ownership among registered mobile money
account holders(Shown: Percentage of mobile money account holders, n=74)
Over half of registered mobile money users also have a bank account
Source: InterMedia Pakistan FII Tracker survey Wave 3 (N=6,000, 15+), September-October 2015.58
53%
Have a bank
account
47%
Don’t have a
bank account

20%
22%
60%
78%
90%
89%
21%
17%
21%
86%
70%
78%
Make retail payments
Get a loan
Save money
Send money
Keep money on the phone
Deposit and withdraw money
PAKISTAN
2015: Awareness of mobile money account functions(Shown: Percentage of registered and unregistered mobile money users)
59
Registered users are more likely than OTC users to realize they can save money
on mobile money accounts
Source: InterMedia Pakistan FII Tracker survey Wave 3 (N=6,000, 15+), September-October 2015.
Question allowed for multiple responses.
Registered users
(n=74)
OTC
(n=510)

PAKISTAN
OTC mobile money users are much more likely than registered account
holders to live within 5 kilometers of a mobile money agent
60Source: InterMedia Pakistan FII Tracker survey Wave 3 (N=6,000, 15+), September-October 2015.
55%
82%
52%
Nonusers(n=5,416)
OTC users(n=510)
Registered users(n=74)
2015: Five-kilometer proximity to a mobile money agent from home(Shown: Percentage of adults, by mobile money use type)

51%
59%
63%
71%
75%
95%
14%
28%
46%
33%
55%
88%
Internet
Call or SMS from mobilemoney provider
Family
Official mobile moneycompany materials
Friends
Mobile money agents
PAKISTAN
2015: Source of information on mobile money(Shown: Percentage of registered and unregistered mobile money users)
61
Mobile money users are learning about the services through multiple
avenues, including word-of-mouth and official company materials
Source: InterMedia Pakistan FII Tracker survey Wave 3 (N=6,000, 15+), September-October 2015.
Question allowed for multiple responses.
Registered users
(n=74)
OTC
(n=510)

0.9%
2%
2%
6%
25%
65%
0.6%
0.7%
1%
24%
5%
69%
Friends
Customer service
Family
Mobile money transactionsnever go wrong
Resolve it oneself
Mobile money agents
PAKISTAN
2015: Preferred means of mobile money troubleshooting(Shown: Percentage of registered and unregistered mobile money users)
62
OTC mobile money users are much less likely to be able to resolve service
issues on their own
Source: InterMedia Pakistan FII Tracker survey Wave 3 (N=6,000, 15+), September-October 2015.
Registered users
(n=74)
OTC
(n=510)

PAKISTAN
86%
14%
Reason for not signing up for mobile money(Shown: Percentage of OTC users, n=510)
%
I don’t need to, I don’t make any transactions 27
I can have all the services I need through an agent 16
I never have money to make a transaction 13
Using an account is difficult 8
Fees for using such an account are too high 8
I don’t see any advantages to registration 7
I don’t understand the purpose of an account 6
OTC users continue to make up the majority of mobile money users;
perceived lack of need is an obstacle to registered use
Source: InterMedia Pakistan FII Tracker survey Wave 3 (N=6,000, 15+), September-October 2015.
2015: Mobile money use: registered vs. OTC(Shown: Percentage of mobile money users, n=584)
63
Registered use Over-the-counter (OTC) use

PAKISTAN
2015: OTC users’ mobile money confidence(Shown: Percentage of OTC mobile money users, n=510)
2015: Reasons for not being able to operate a
mobile money account(Shown: Percentage of OTC mobile money users who can’t
perform transactions on their own, n=146)
12%
43%
52%
Won't know how to problem solve
Afraid of making a mistake
Don't understand it technically
OTC users who believe they can’t use mobile money on their own feel
hindered by a lack of technical skills
Source: InterMedia Pakistan FII Tracker survey Wave 3 (N=6,000, 15+), September-October 2015.64
42%can perform
transactions on
their own 28%can’t perform
transactions on
their own
30%don’t know,
refused

PAKISTAN
Preferred location %
Near home 70
Food shops 54
Mobile phone shops 51
Transportation hubs 41
Near school/childcare 27
Near work 18
2015: OTC users’ preference for mobile
money agent locations(Shown: Percentage of OTC mobile money users, n=510)
Having a nearby mobile money agent is most important to OTC users; only
Easypaisa has agents within proximity of more than half of all OTC users
Source: InterMedia Pakistan FII Tracker survey Wave 3 (N=6,000, 15+), September-October 2015.65
4%
5%
8%
12%
16%
34%
36%
86%
MCB Mobile
Warid Mobile Paisa
HBL Express
Zong Timepey
Ufone/ Upayment
UBL Omni
Mobilink Mobicash
Easypaisa
2015: OTC users’ view of which mobile
money agents are near their homes(Shown: Percentage of OTC mobile money users, n=510)

NONBANK FINANCIAL INSTITUTIONS
PAKISTAN
66

PAKISTAN
NBFIs do not play a significant role in the Pakistani financial inclusion
landscape
Source: InterMedia Pakistan FII Tracker survey Wave 3 (N=6,000, 15+), September-October 2015.67
47%
only use
NBFIs
53%
have bank
or mobile
money
accounts
1%of adults have
used a nonbank
financial institution
This accounts
for 0.5% of the
total population.
2015: NBFI use(Shown: Percentage of Pakistani adults, N=6,000)
2015: NBFI users’ use of other financial services(Shown: Percentage of NBFI users, n=67)

PAKISTAN
0.5%
12%
90%
State Life Insurance Corporation
Microfinance institutions
ROSCA/committees
2015: Use of NBFIs, including non-full-service institutions*(Shown: Percentage of NBFI users, n=715)
2015: The gender divide in ROSCA use(Shown: Percentage of ROSCA users, n=646)
ROSCAs are the most widely used form of NBFI; women are much more
likely to be ROSCA users than are men
Source: InterMedia Pakistan FII Tracker survey Wave 3 (N=6,000, 15+), September-October 2015.68
73%
Female
27%
Male
*All numbers shown in this slide are based on access to any kind of NBFI, including credit-only and those that are neither credit-only nor full-service institutions.

PAKISTAN
2015: Negative experiences with ROSCA use(Shown: Percentage of ROSCA users, n=646)
Money/cash not available immediately 74%
Disagreement among the group 67%
Loss of membership 64%
Poor leadership 62%
Lost money through bad investments 61%
Fraud by a ROSCA member 61%
Default by members 61%
Fraud by an outsider 59%
Most ROSCA members have had at least one negative experience; lack of
available cash is the most common
Source: InterMedia Pakistan FII Tracker survey Wave 3 (N=6,000, 15+), September-October 2015.69
METHODOLOGY & RESEARCH DESCRIPTION
PAKISTAN
70

Survey Summary
• Annual, nationally representative survey (N=6,000) of Pakistani adults aged 15+
• Face-to-face interviews lasting, on average, 44 minutes
• Third survey (wave 3) conducted from 9/03/2015 to 10/30/2015
• Tracks trends and market developments in DFS based on the information gathered in the first survey,
conducted in 2013, and second survey conducted in 2014
Data Collection
• Basic demographics and poverty measurement (Grameen Progress Out of Poverty Index)
• Access/use of mobile devices
• Access/use of mobile money
• Access/use of formal financial services (e.g., bank accounts)
• Access/use of semi-formal and informal financial services (e.g., MFIs, cooperatives, village savings groups)
• Financial literacy and preparedness
• General financial behaviors
PAKISTAN
FII Pakistan Tracker Survey details
71

Sampling Frame • A nationally representative sample of adults (defined as those aged 15 or above) was developed using 2011-12 national population
projections based on 1998 Census Data.
• The total sample was distributed proportionally to the size of the population within urban and rural strata in each of Pakistan’s four
provinces – excluding the federally administered tribal areas.
• The total population was further administratively divided into 5,000 census-defined urban circles and 48,000 rural mouzas.
Primary Sampling Units (PSUs)
•Within urban strata, census circles and within rural strata, mouzas were selected proportionally to their population size.
•Ten interviews were conducted in each selected urban circle and mouza primary sampling unit.
•For security reasons, PSUs were divided randomly between male and female interviewing teams.
Sampling Start-Points, Households and Respondents
• The census circles and villages to which sampling points were assigned were mapped into blocks and a block was randomly selected. The
household within the selected block from which interviewing commenced was selected by generating a random number between one and 10,
and skipping that number of households from the first household that interviewers encountered when entering the block.
•After completing an interview at the randomly selected first household, subsequent households were selected using the right-hand rule (every
fifth household in urban areas and every third household in rural areas).
• One respondent from each household was selected using the Kish grid method, and relevant consent for eligible respondents under 18 years
of age was obtained.
PAKISTAN
SAMPLING METHODOLOGY
72

GLOSSARY
PAKISTAN
73

GLOSSARY
74
• Access – Access to a bank account or mobile money account means a respondent can use bank/mobile money services either via their own
account or via an account of another person.
• Active account holder – An individual who has a registered financial account and has used it in the last 90 days.
• Active user – An individual who has used any financial account for any type of transaction in the past 90 days via his/her own account or
somebody else’s account.
• Adults with DFS access – Adults who either own a DFS account or have access to someone else’s account.
• Below the poverty line – In this particular study, adults living on less than $2.50 per day, as classified by the Grameen PPI.
• Credit-only financial institutions – Financial institutions that only offer loan disbursement services to their customers.
• Digital financial services (DFS) – Financial services provided through an electronic platform (mobile phones, electronic cards, the internet,
etc.). For this particular study, digital financial services include bank services and mobile money services.
• Mobile money (MM) – A service in which a mobile phone is used to access financial services.
• Mobile-money value-added services –Individually branded service products offered by mobile money providers in addition to or along
with their basic mobile money services.
• Registered active user – A person with a registered DFS account that has used it in the last 90 days.
• ROSCA/committee – An informal rotating savings and credit association (ROSCA) whose members are a group of individuals who agree
to meet for a defined time period to save and borrow together, a form of combined peer-to-peer banking and peer-to-peer lending.
• Services beyond basic wallet – DFS transactions that go beyond simple deposits, withdrawals or money transfers.
• Urban/rural – Urban and rural persons are defined according to their residence in urban or rural areas as prescribed by the national bureau
of statistics.
• Grameen Progress out of Poverty Index (PPI) – A poverty measurement tool from the Grameen Foundation wherein a set of
country-specific questions are used to compute the likelihood that a household is living below the poverty line.
• Financially included – Individuals who have registered for a financial service account with a full-service financial institution.
• Full-service institutions – A financial institution that offers customers at least one of the following services: savings, money transfers,
insurance or investments.

For more information, contact:
Nat Kretchun, FII Asia Lead
Imran Khan, FII Pakistan [email protected]
Caldwell Bishop, Research Manager