Embed Size (px)
Citation preview
PAKISTAN IT & ITES
INDUSTRY SURVEY 2014
National ICT R&D Fund Islamabad
1
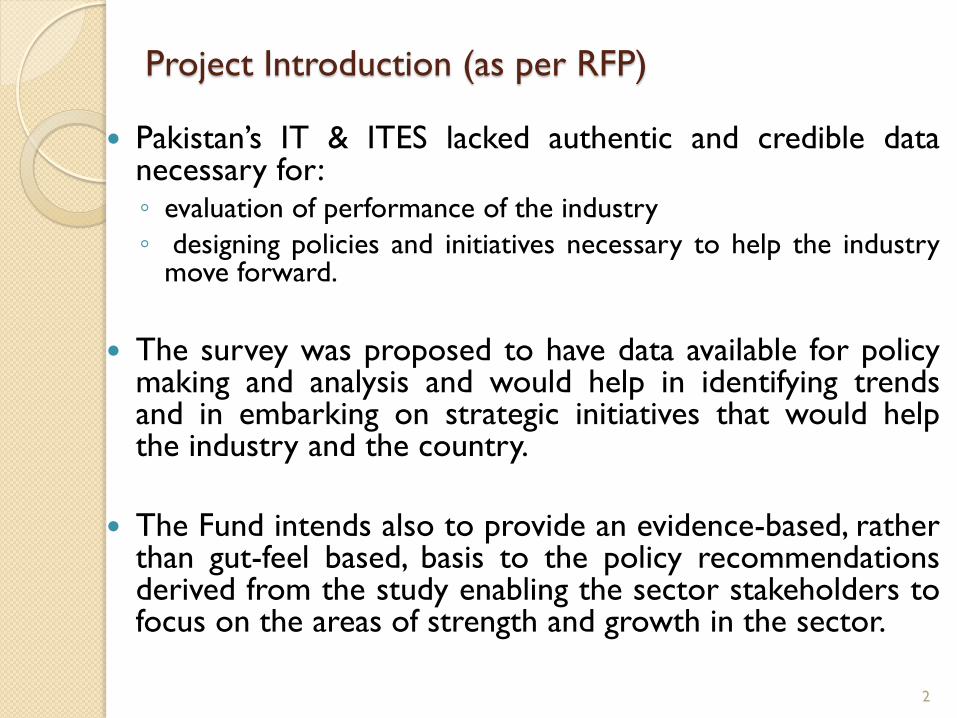
Project Introduction (as per RFP)
Pakistan’s IT & ITES lacked authentic and credible data necessary for: ◦ evaluation of performance of the industry
◦ designing policies and initiatives necessary to help the industry move forward.
The survey was proposed to have data available for policy making and analysis and would help in identifying trends and in embarking on strategic initiatives that would help the industry and the country.
The Fund intends also to provide an evidence-based, rather than gut-feel based, basis to the policy recommendations derived from the study enabling the sector stakeholders to focus on the areas of strength and growth in the sector.
2
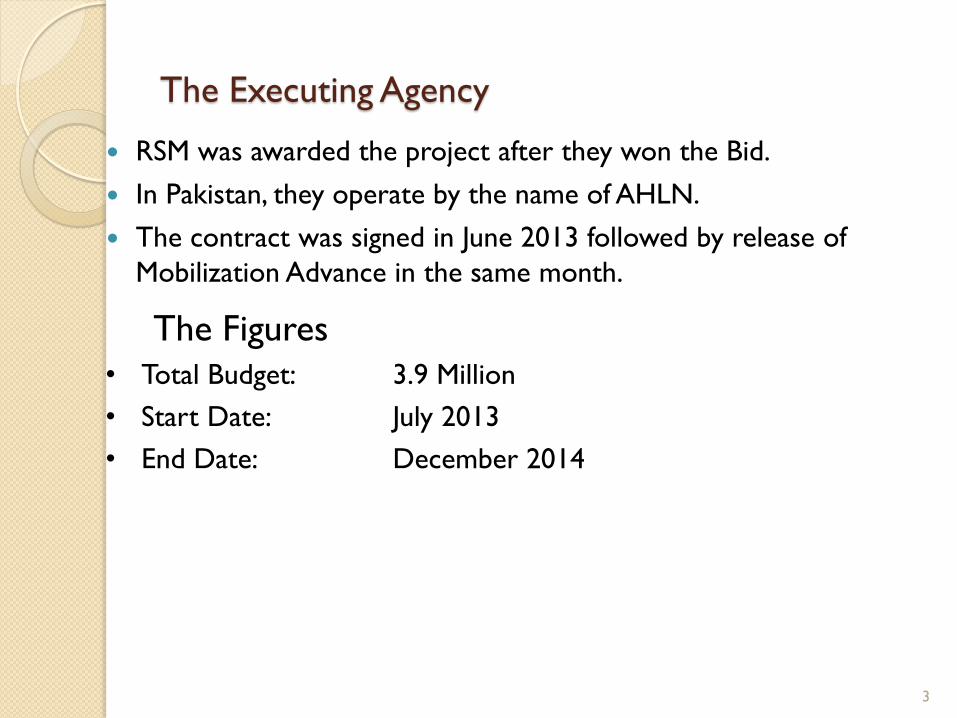
The Executing Agency
RSM was awarded the project after they won the Bid.
In Pakistan, they operate by the name of AHLN.
The contract was signed in June 2013 followed by release of
Mobilization Advance in the same month.
• Total Budget: 3.9 Million
• Start Date: July 2013
• End Date: December 2014
The Figures
3
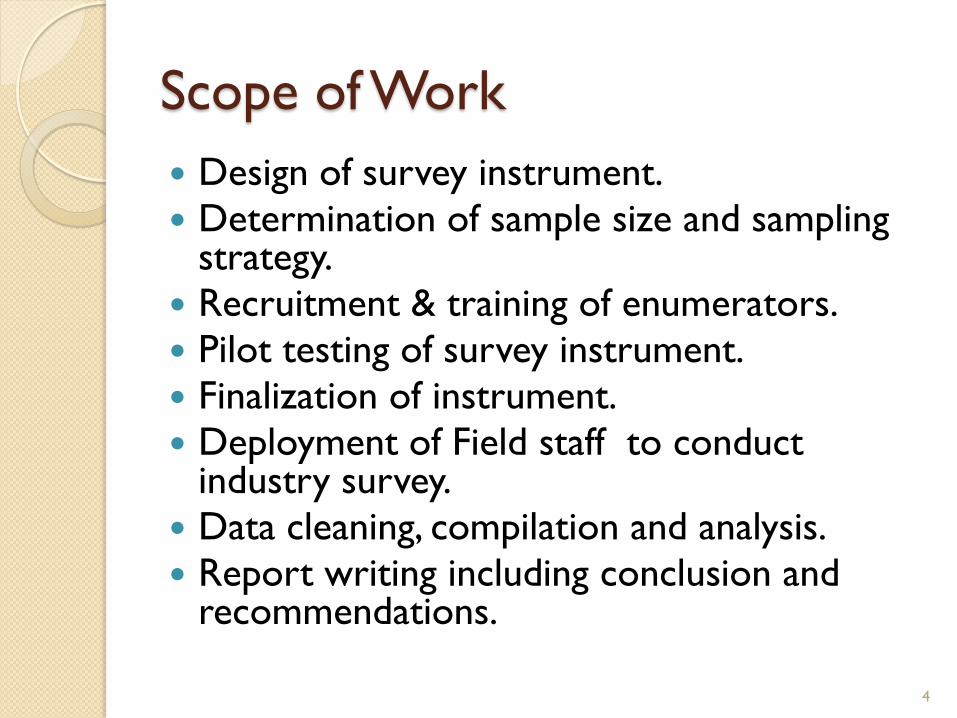
Scope of Work
Design of survey instrument.
Determination of sample size and sampling strategy.
Recruitment & training of enumerators.
Pilot testing of survey instrument.
Finalization of instrument.
Deployment of Field staff to conduct industry survey.
Data cleaning, compilation and analysis.
Report writing including conclusion and recommendations.
4
Pakistan IT ITES 2013—Project Progress
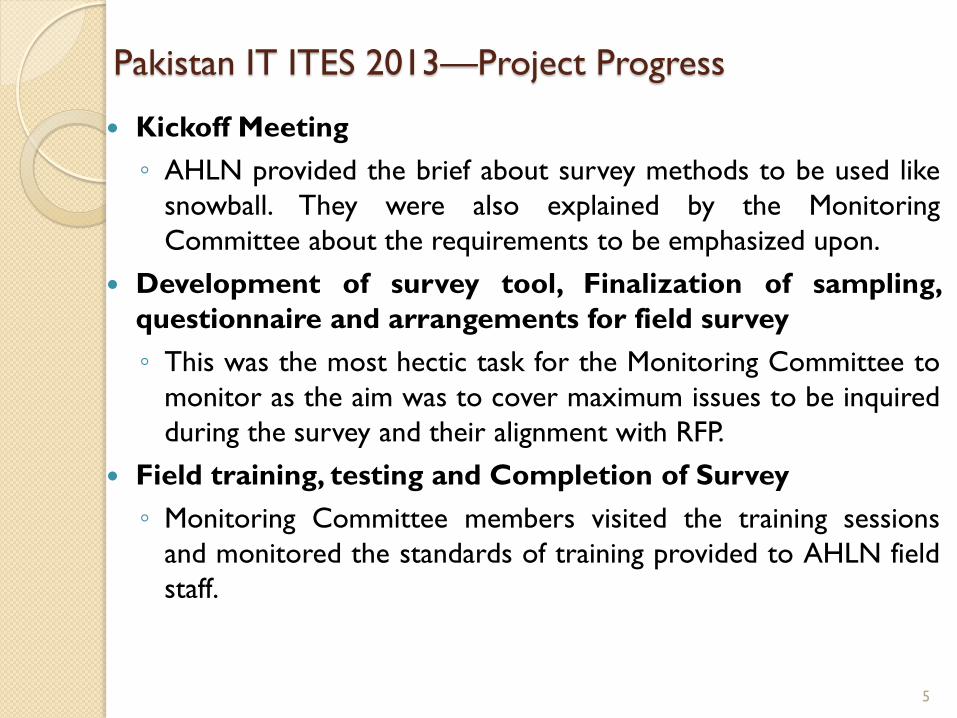
Kickoff Meeting
◦ AHLN provided the brief about survey methods to be used like
snowball. They were also explained by the Monitoring
Committee about the requirements to be emphasized upon.
Development of survey tool, Finalization of sampling,
questionnaire and arrangements for field survey
◦ This was the most hectic task for the Monitoring Committee to
monitor as the aim was to cover maximum issues to be inquired
during the survey and their alignment with RFP.
Field training, testing and Completion of Survey
◦ Monitoring Committee members visited the training sessions
and monitored the standards of training provided to AHLN field
staff.
5
IT ITES 2013—Project Progress-II
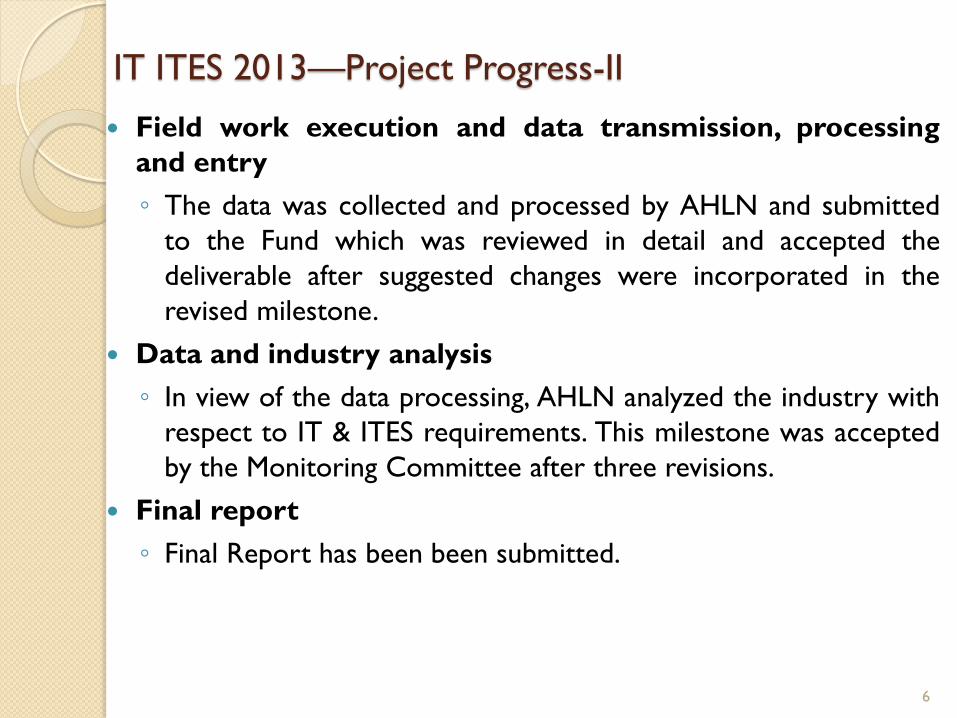
Field work execution and data transmission, processing
and entry
◦ The data was collected and processed by AHLN and submitted
to the Fund which was reviewed in detail and accepted the
deliverable after suggested changes were incorporated in the
revised milestone.
Data and industry analysis
◦ In view of the data processing, AHLN analyzed the industry with
respect to IT & ITES requirements. This milestone was accepted
by the Monitoring Committee after three revisions.
Final report
◦ Final Report has been been submitted.
6
Survey Sample
To cater for geographical coverage
following two approaches were adopted:
◦ Purposive selection of cities.
◦ Random selection of cities/towns.
7
Survey Sample
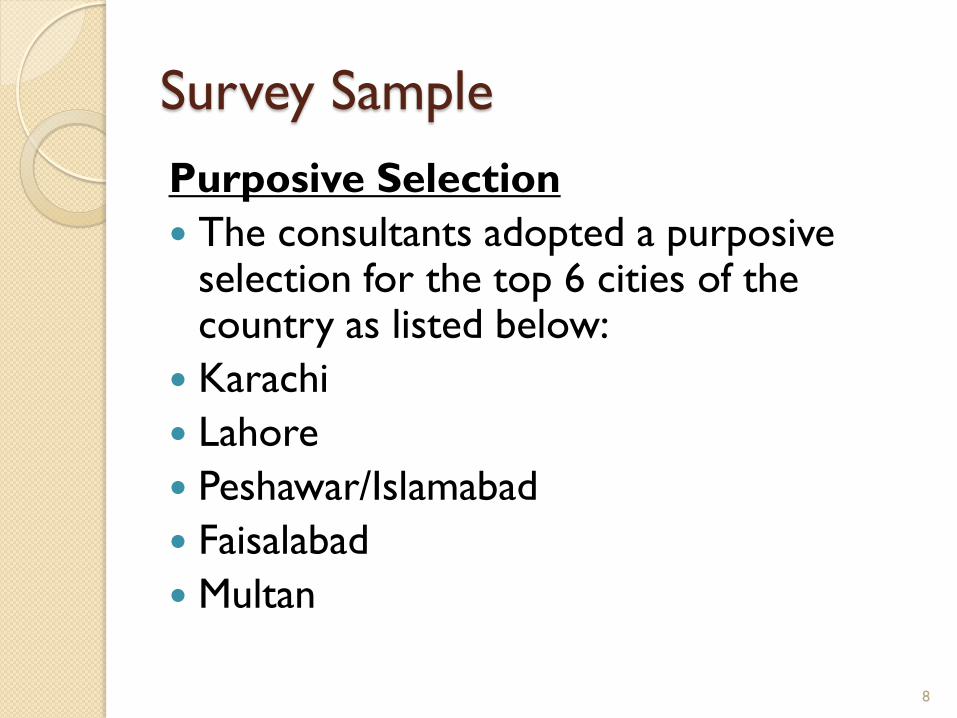
Purposive Selection
The consultants adopted a purposive selection for the top 6 cities of the country as listed below:
Karachi
Lahore
Peshawar/Islamabad
Faisalabad
Multan
8
Survey Sample
Random Selection
To have a representation of medium to
small towns, AHLN adopted a Stratified
Random Selection procedure with
population as the stratification criteria:
i. Cities & towns with population >0.5 million
ii. Cities & towns with population 0.1 and 0.5
million
9
Sample Survey
Total 10 cities were selected
◦ 6 cities were selected purposively.
◦ 4 cities were selected randomly.
10
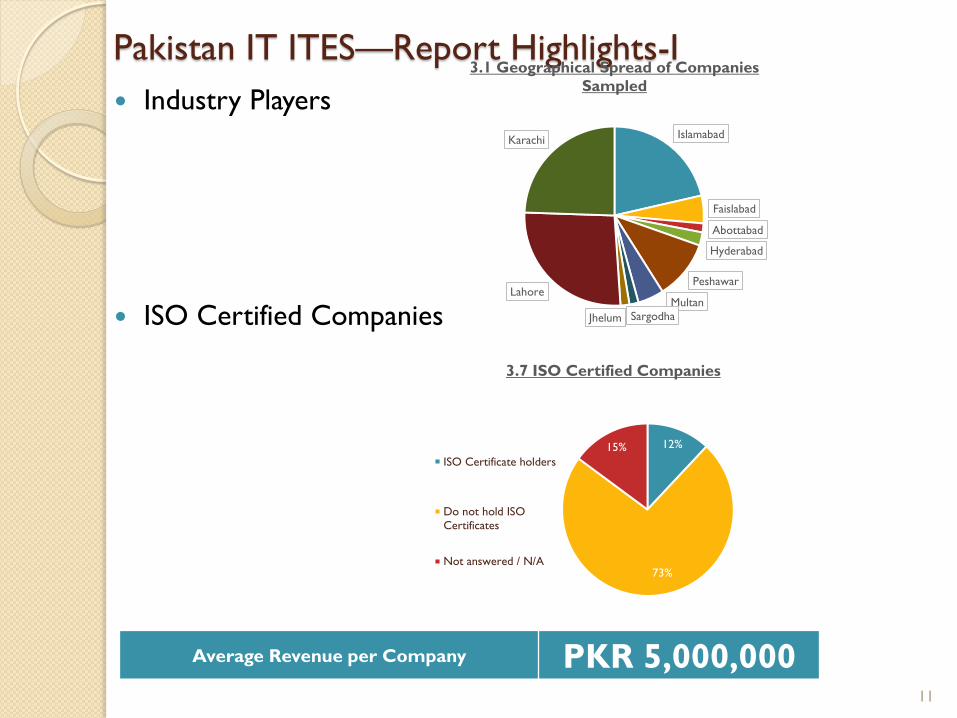
Pakistan IT ITES—Report Highlights-I
Industry Players
ISO Certified Companies
Islamabad
Faislabad
Abottabad
Hyderabad
Peshawar
Multan
Sargodha Jhelum
Lahore
Karachi
3.1 Geographical Spread of Companies
Sampled
12%
73%
15%
3.7 ISO Certified Companies
ISO Certificate holders
Do not hold ISO
Certificates
Not answered / N/A
Average Revenue per Company PKR 5,000,000 11
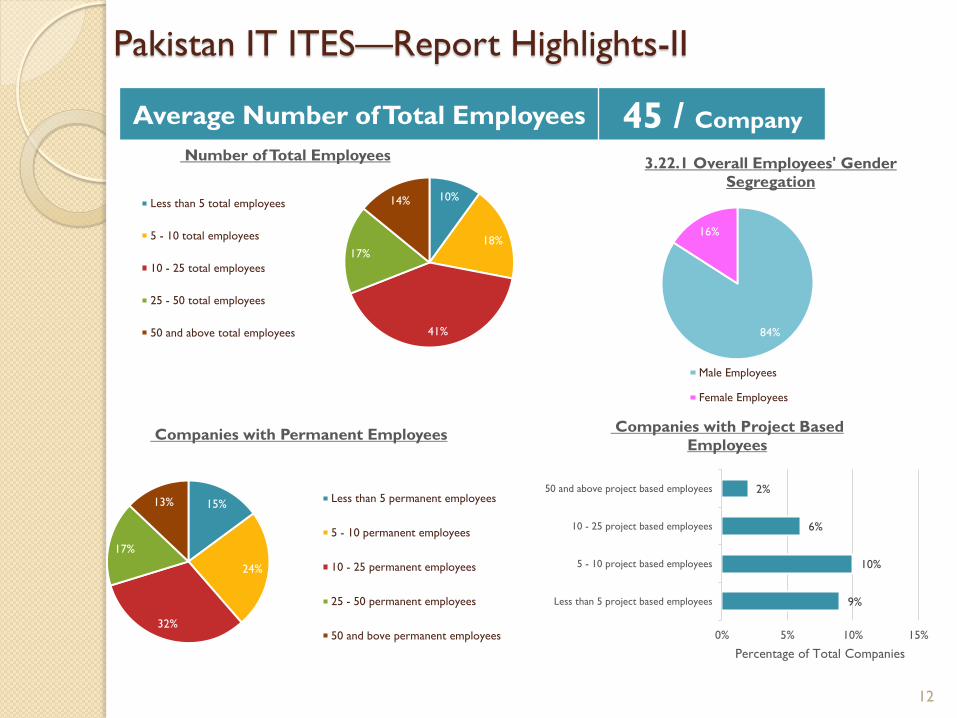
Pakistan IT ITES—Report Highlights-II
Average Number of Total Employees 45 / Company
10%
18%
41%
17%
14%
Number of Total Employees
Less than 5 total employees
5 - 10 total employees
10 - 25 total employees
25 - 50 total employees
50 and above total employees
15%
24%
32%
17%
13%
Companies with Permanent Employees
Less than 5 permanent employees
5 - 10 permanent employees
10 - 25 permanent employees
25 - 50 permanent employees
50 and bove permanent employees
9%
10%
6%
2%
Less than 5 project based employees
5 - 10 project based employees
10 - 25 project based employees
50 and above project based employees
0% 5% 10% 15%
Percentage of Total Companies
Companies with Project Based
Employees
84%
16%
3.22.1 Overall Employees' Gender
Segregation
Male Employees
Female Employees
12
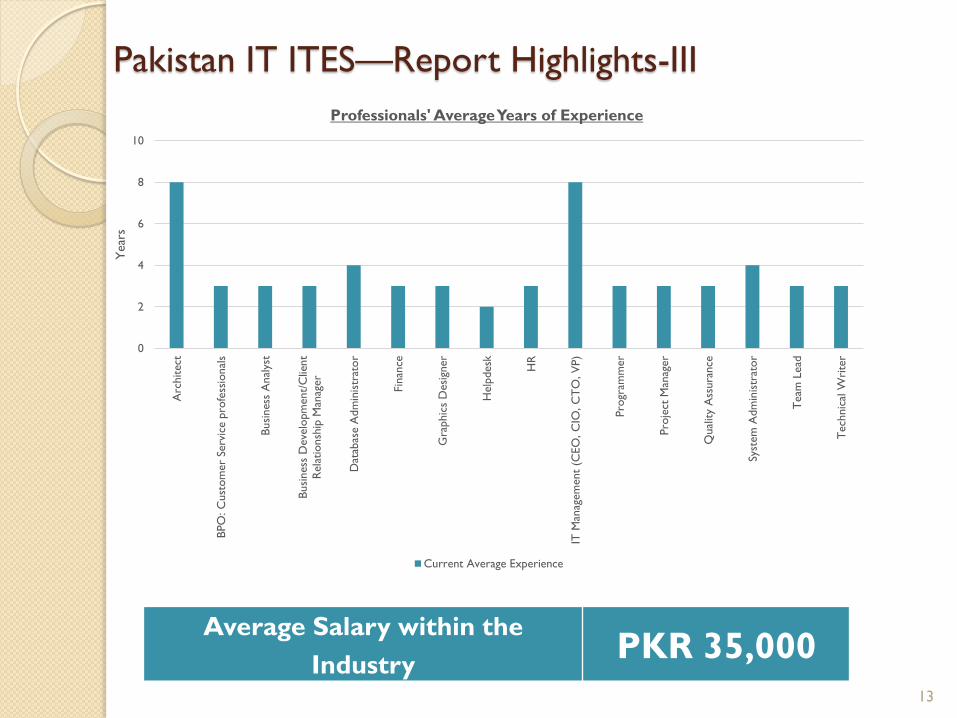
Pakistan IT ITES—Report Highlights-III
0
2
4
6
8
10
Arc
hit
ect
BPO
: C
ust
om
er
Serv
ice p
rofe
ssio
nal
s
Busi
ness
Anal
yst
Busi
ness
Deve
lopm
ent/
Clie
nt
Rela
tionsh
ip M
anag
er
Dat
abas
e A
dm
inis
trat
or
Fin
ance
Gra
phic
s D
esi
gner
Help
desk
HR
IT M
anag
em
ent
(CEO
, C
IO, C
TO
, V
P)
Pro
gram
mer
Pro
ject
Man
ager
Qual
ity
Ass
ura
nce
Syst
em
Adm
inis
trat
or
Team
Lead
Tech
nic
al W
rite
r
Year
s Professionals' Average Years of Experience
Current Average Experience
Average Salary within the
Industry PKR 35,000
13
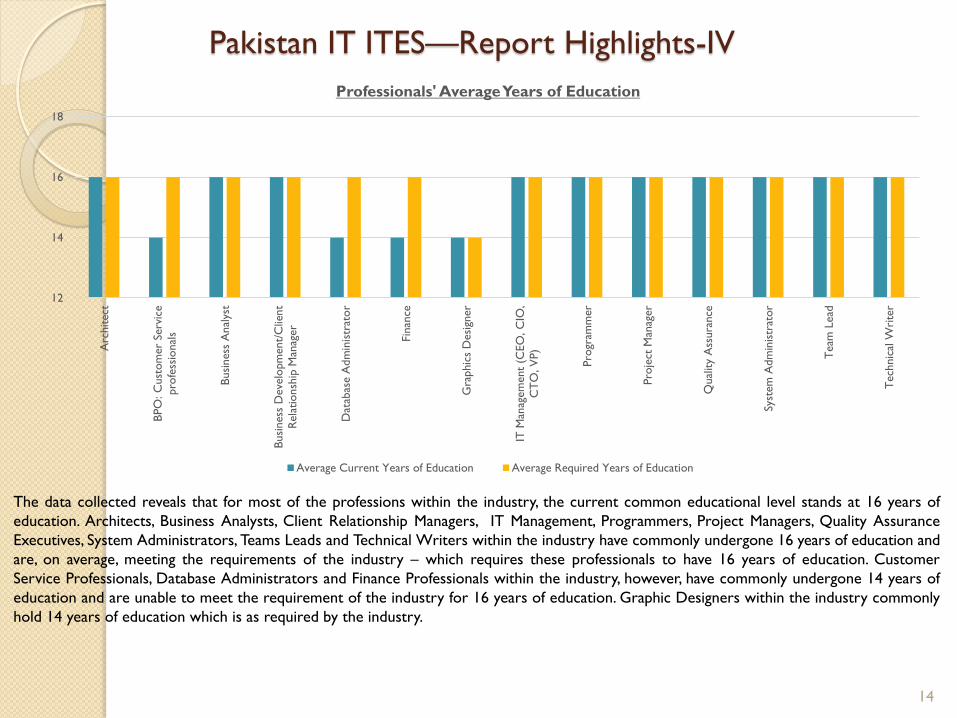
Pakistan IT ITES—Report Highlights-IV
12
14
16
18A
rchit
ect
BPO
: C
ust
om
er
Serv
ice
pro
fess
ional
s
Busi
ness
Anal
yst
Busi
ness
Deve
lopm
ent/
Clie
nt
Rela
tionsh
ip M
anag
er
Dat
abas
e A
dm
inis
trat
or
Fin
ance
Gra
phic
s D
esi
gner
IT M
anag
em
ent
(CEO
, C
IO,
CT
O, V
P)
Pro
gram
mer
Pro
ject
Man
ager
Qual
ity
Ass
ura
nce
Syst
em
Adm
inis
trat
or
Team
Lead
Tech
nic
al W
rite
r
Professionals' Average Years of Education
Average Current Years of Education Average Required Years of Education
The data collected reveals that for most of the professions within the industry, the current common educational level stands at 16 years of
education. Architects, Business Analysts, Client Relationship Managers, IT Management, Programmers, Project Managers, Quality Assurance
Executives, System Administrators, Teams Leads and Technical Writers within the industry have commonly undergone 16 years of education and
are, on average, meeting the requirements of the industry – which requires these professionals to have 16 years of education. Customer
Service Professionals, Database Administrators and Finance Professionals within the industry, however, have commonly undergone 14 years of
education and are unable to meet the requirement of the industry for 16 years of education. Graphic Designers within the industry commonly
hold 14 years of education which is as required by the industry.
14
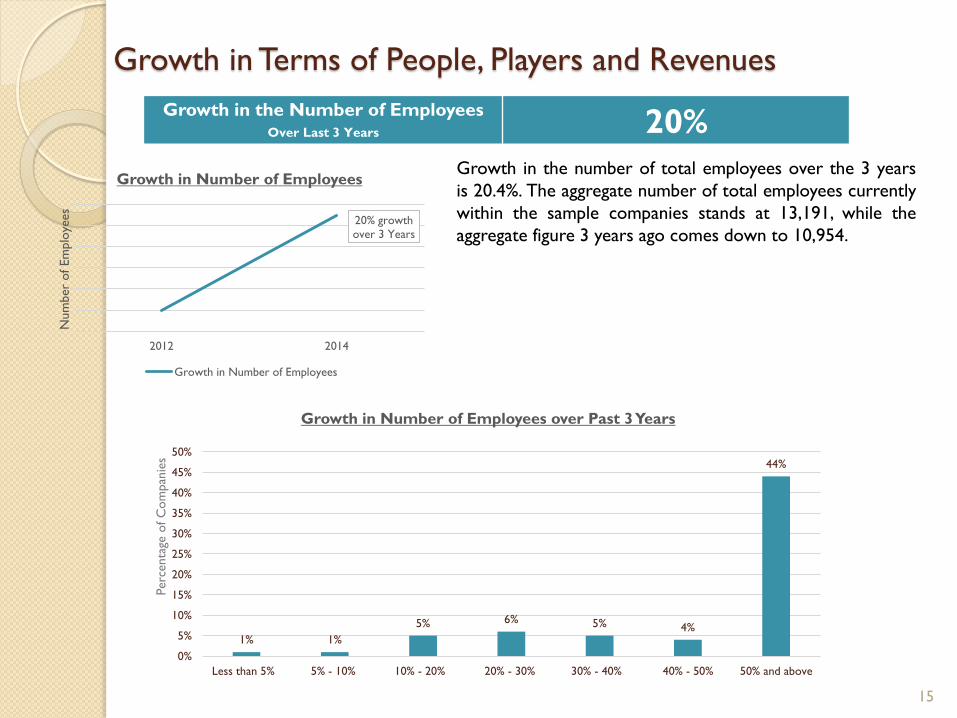
Growth in Terms of People, Players and Revenues
Growth in the Number of Employees Over Last 3 Years 20%
20% growth
over 3 Years
2012 2014
Num
ber
of Em
plo
yees
Growth in Number of Employees
Growth in Number of Employees
Growth in the number of total employees over the 3 years
is 20.4%. The aggregate number of total employees currently
within the sample companies stands at 13,191, while the
aggregate figure 3 years ago comes down to 10,954.
1% 1%
5% 6% 5% 4%
44%
0%
5%
10%
15%
20%
25%
30%
35%
40%
45%
50%
Less than 5% 5% - 10% 10% - 20% 20% - 30% 30% - 40% 40% - 50% 50% and above
Perc
enta
ge o
f C
om
pan
ies
Growth in Number of Employees over Past 3 Years
15
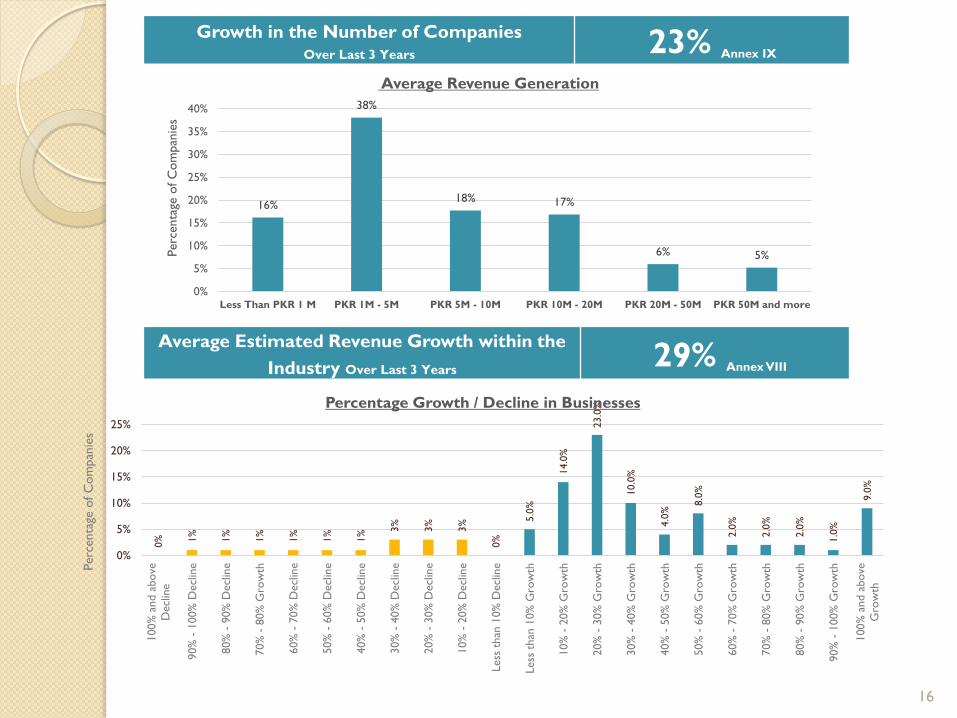
Growth in the Number of Companies Over Last 3 Years 23% Annex IX
16%
38%
18% 17%
6% 5%
0%
5%
10%
15%
20%
25%
30%
35%
40%
Less Than PKR 1 M PKR 1M - 5M PKR 5M - 10M PKR 10M - 20M PKR 20M - 50M PKR 50M and more
Perc
enta
ge o
f C
om
pan
ies
Average Revenue Generation
Average Estimated Revenue Growth within the
Industry Over Last 3 Years 29% Annex VIII
0%
1%
1%
1%
1%
1%
1%
3%
3%
3%
0%
5.0
%
14.0
%
23.0
%
10.0
%
4.0
% 8.0
%
2.0
%
2.0
%
2.0
%
1.0
%
9.0
%
0%
5%
10%
15%
20%
25%
100%
and a
bove
Decl
ine
90%
- 1
00%
Decl
ine
80%
- 9
0%
Decl
ine
70%
- 8
0%
Gro
wth
60%
- 7
0%
Decl
ine
50%
- 6
0%
Decl
ine
40%
- 5
0%
Decl
ine
30%
- 4
0%
Decl
ine
20%
- 3
0%
Decl
ine
10%
- 2
0%
Decl
ine
Less
than
10%
Decl
ine
Less
than
10%
Gro
wth
10%
- 2
0%
Gro
wth
20%
- 3
0%
Gro
wth
30%
- 4
0%
Gro
wth
40%
- 5
0%
Gro
wth
50%
- 6
0%
Gro
wth
60%
- 7
0%
Gro
wth
70%
- 8
0%
Gro
wth
80%
- 9
0%
Gro
wth
90%
- 1
00%
Gro
wth
100%
and a
bove
Gro
wth
Perc
enta
ge o
f C
om
pan
ies
Percentage Growth / Decline in Businesses
16
Industry Outlook-I
36%
63%
1%
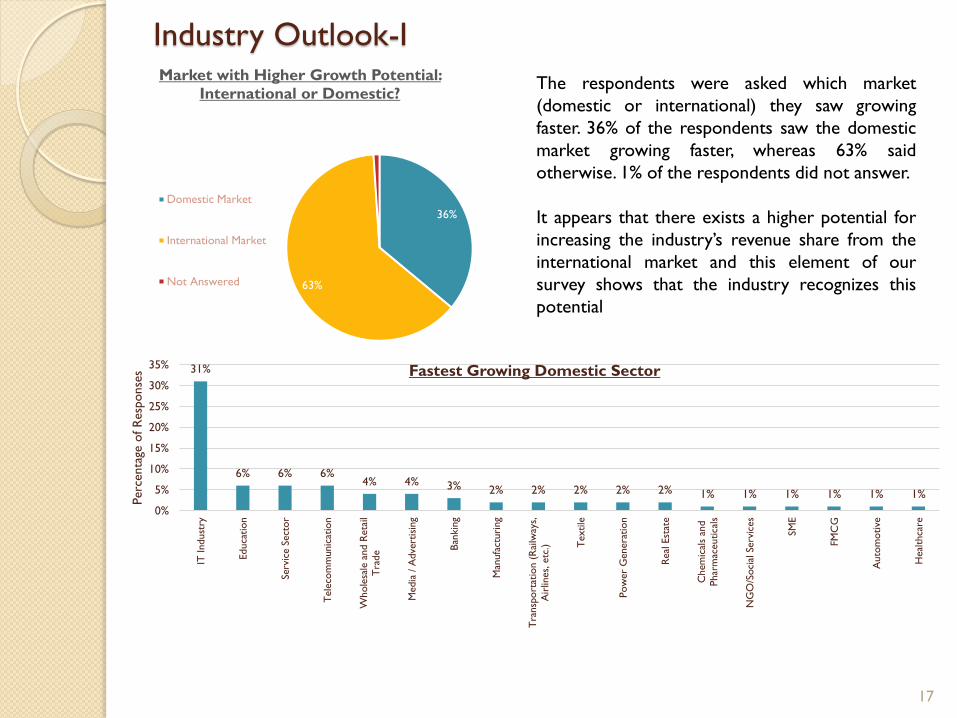
Market with Higher Growth Potential:
International or Domestic?
Domestic Market
International Market
Not Answered
The respondents were asked which market
(domestic or international) they saw growing
faster. 36% of the respondents saw the domestic
market growing faster, whereas 63% said
otherwise. 1% of the respondents did not answer.
It appears that there exists a higher potential for
increasing the industry’s revenue share from the
international market and this element of our
survey shows that the industry recognizes this
potential
31%
6% 6% 6% 4% 4% 3% 2% 2% 2% 2% 2% 1% 1% 1% 1% 1% 1%
0%
5%
10%
15%
20%
25%
30%
35%
IT Indust
ry
Educa
tion
Serv
ice S
ect
or
Tele
com
munic
atio
n
Whole
sale
and R
eta
ilT
rade
Media
/ A
dve
rtis
ing
Ban
kin
g
Man
ufa
cturi
ng
Tra
nsp
ort
atio
n (
Rai
lway
s,A
irlin
es,
etc
.) Textile
Pow
er
Genera
tion
Real
Est
ate
Chem
ical
s an
d
Phar
mac
eutica
ls
NG
O/S
oci
al S
erv
ices
SM
E
FM
CG
Auto
motive
Heal
thca
re
Perc
enta
ge o
f R
esp
onse
s Fastest Growing Domestic Sector
17
Industry Outlook-II
46%
15%
15%
10%
6%
4%
1%
1%
0% 10% 20% 30% 40% 50%
USA
UK
Middle East
EU
Africa
Australia
Far East
China
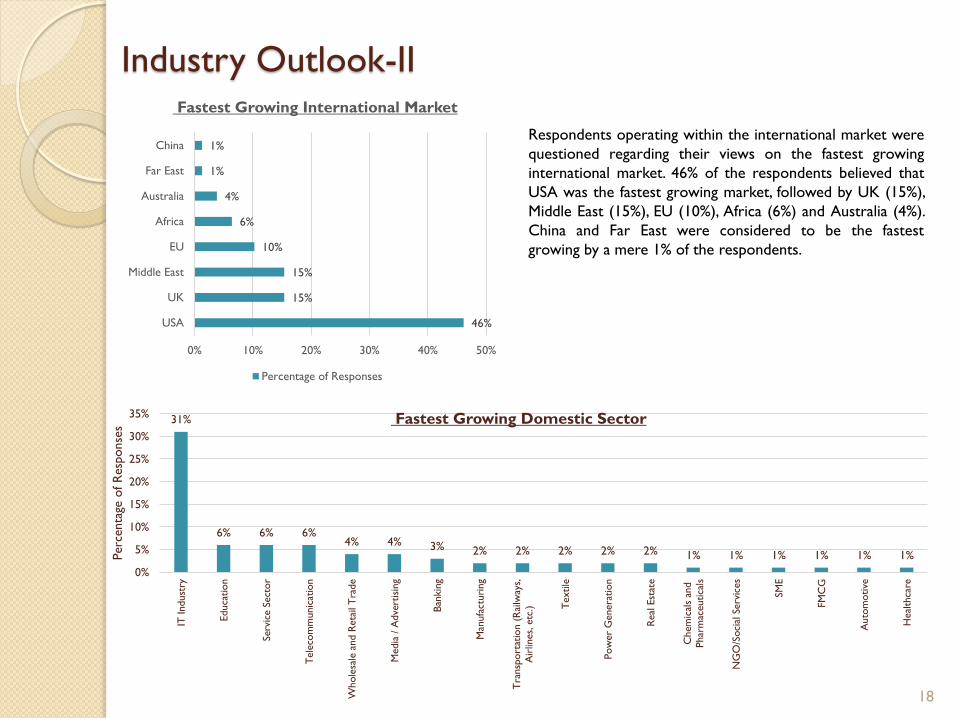
Fastest Growing International Market
Percentage of Responses
Respondents operating within the international market were
questioned regarding their views on the fastest growing
international market. 46% of the respondents believed that
USA was the fastest growing market, followed by UK (15%),
Middle East (15%), EU (10%), Africa (6%) and Australia (4%).
China and Far East were considered to be the fastest
growing by a mere 1% of the respondents.
31%
6% 6% 6% 4% 4% 3% 2% 2% 2% 2% 2% 1% 1% 1% 1% 1% 1%
0%
5%
10%
15%
20%
25%
30%
35%
IT Indust
ry
Educa
tion
Serv
ice S
ect
or
Tele
com
munic
atio
n
Whole
sale
and R
eta
il T
rade
Media
/ A
dve
rtis
ing
Ban
kin
g
Man
ufa
cturi
ng
Tra
nsp
ort
atio
n (
Rai
lway
s,A
irlin
es,
etc
.) Textile
Pow
er
Genera
tion
Real
Est
ate
Chem
ical
s an
dPhar
mac
eutica
ls
NG
O/S
oci
al S
erv
ices
SM
E
FM
CG
Auto
motive
Heal
thca
re
Perc
enta
ge o
f R
esp
onse
s
Fastest Growing Domestic Sector
18
Pakistan IT ITES—Key Challenges-I
33% 32%
13% 14%
23% 23%
5%
22%
5%
0%
5%
10%
15%
20%
25%
30%
35%
Load
sheddin
g /
energ
y cr
isis
Abse
nce
/ lac
k o
f
gove
rnm
ent
support
,
fundin
g, fac
ilita
tion,
reco
gnit
ion
Lac
k o
f aw
areness
and
kno
wle
dge
of IT
and its
benefits
Po
or
law
and o
rder
/
secu
rity
situta
tion
Po
or
infr
astr
uct
ure
Lac
k o
f qual
ity
hum
an
reso
urc
e
Hig
h s
erv
ices
tax
Lac
k o
f qual
ity
educa
tion a
nd
trai
nin
g
Lac
k o
f in
vest
ment
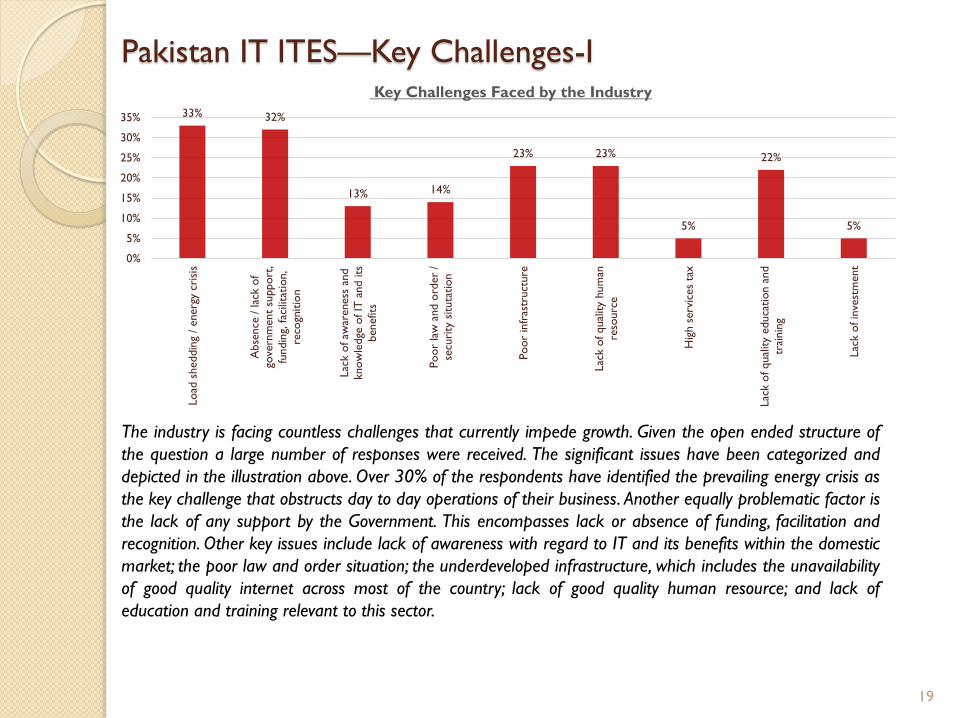
Key Challenges Faced by the Industry
The industry is facing countless challenges that currently impede growth. Given the open ended structure of
the question a large number of responses were received. The significant issues have been categorized and
depicted in the illustration above. Over 30% of the respondents have identified the prevailing energy crisis as
the key challenge that obstructs day to day operations of their business. Another equally problematic factor is
the lack of any support by the Government. This encompasses lack or absence of funding, facilitation and
recognition. Other key issues include lack of awareness with regard to IT and its benefits within the domestic
market; the poor law and order situation; the underdeveloped infrastructure, which includes the unavailability
of good quality internet across most of the country; lack of good quality human resource; and lack of
education and training relevant to this sector.
19
Pakistan IT ITES—Key Challenges-II
8%
10%
9%
21%
6%
7%
5%
30%
4%
11%
6%
8%
20%
9%
15%
12%
16%
3%
8%
7%
10%
18%
12%
13%
10%
14%
8%
0%
5%
10%
15%
20%
25%
30%
35%
Short
age o
f hum
an r
eso
urc
e
Less
than
adequat
e q
ual
ity
of hum
an r
eso
urc
e
Short
age o
f fu
nds
Lac
k o
f G
ove
rnm
ent
support
Difficu
lty
in m
arket
acce
ss
Law
and o
rder
situ
atio
n
Po
or
infr
astr
uct
ure
and fac
iliti
es
Load
sheddin
g
Hig
h e
mplo
yee t
urn
ove
r
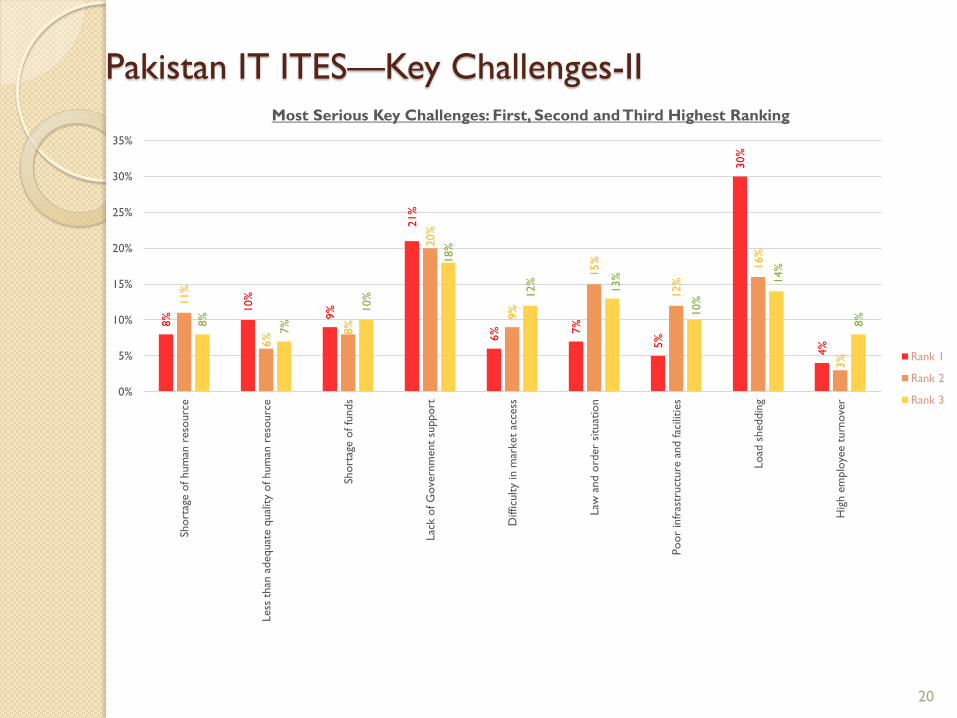
Most Serious Key Challenges: First, Second and Third Highest Ranking
Rank 1
Rank 2
Rank 3
20
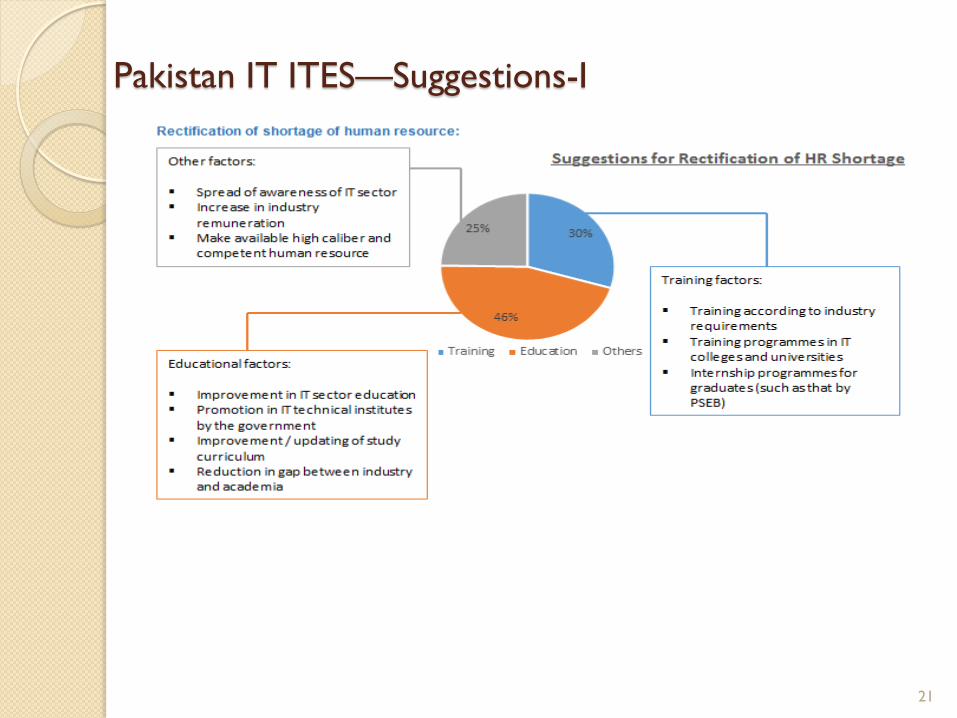
Pakistan IT ITES—Suggestions-I
21
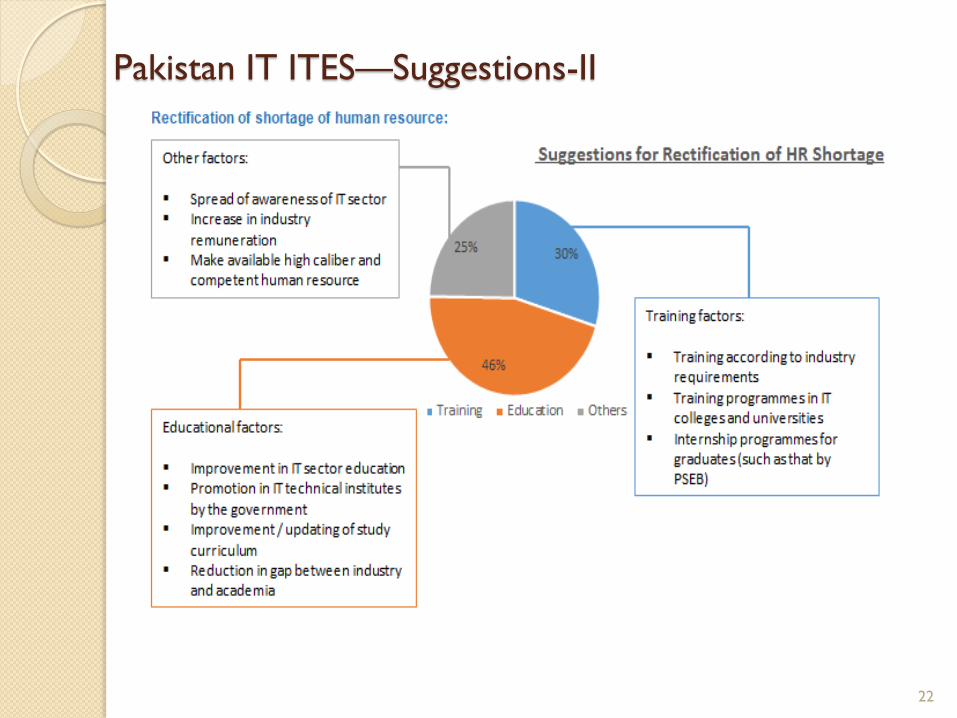
Pakistan IT ITES—Suggestions-II
22
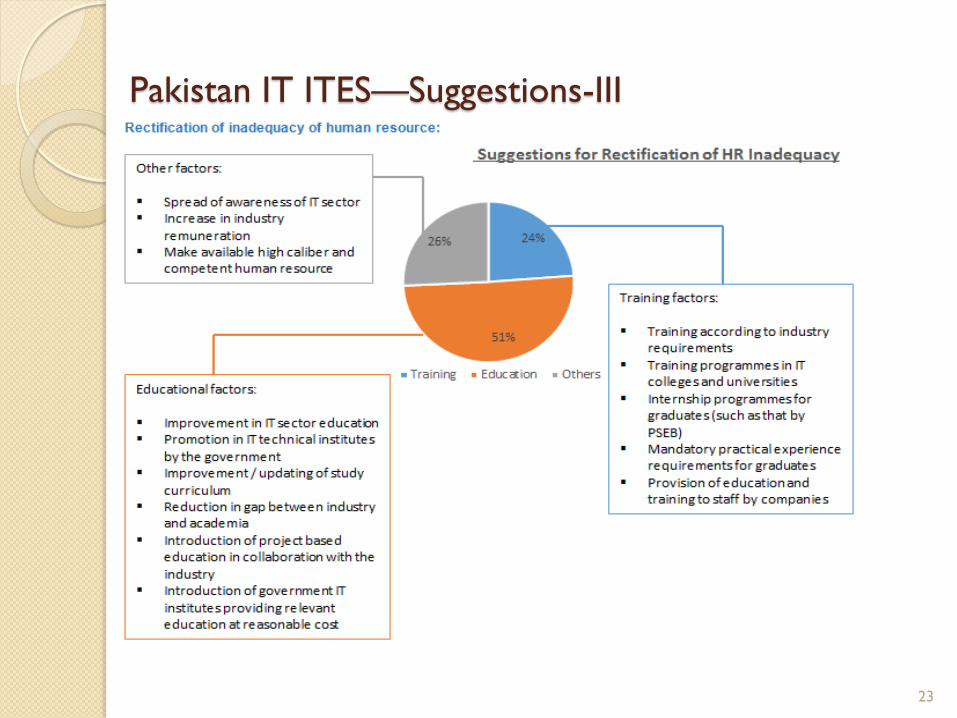
Pakistan IT ITES—Suggestions-III
23
Pakistan IT ITES—Recommendations
A government apex body, to oversee and regulate the IT & ITES
industry of Pakistan.
Issues with regard to opening of merchant accounts with renowned
payment gateways such as PayPal and World-Pay must be resolved
Expatriates appointed at notable positions, working with world
renowned IT powerhouses should be given incentives in order to
encourage them to invest their expertise for the betterment of
Pakistan’s IT & ITES industry.
IT software houses should invest in research and development
departments in top tier universities. The apex body should regulate
these developments, which could in turn produce higher caliber human
resource for the IT & ITES industry.
Various platforms should be provided where students can exhibit their
skills in software development and other IT related sectors to people
who might be interested in such ideas and would materialize them in
reality by investing in them.
24
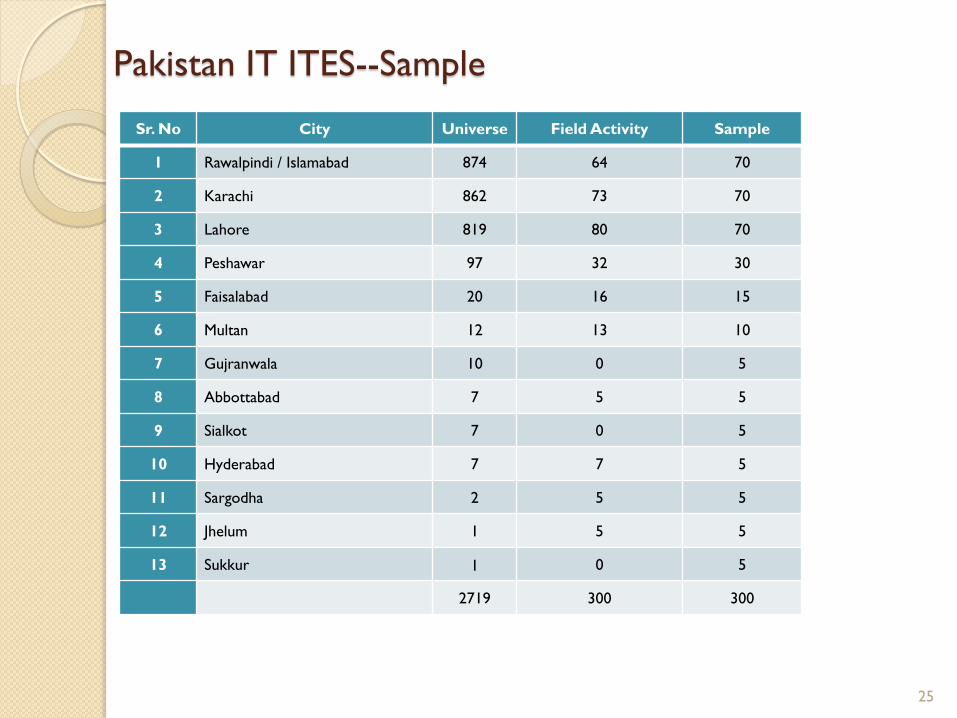
Pakistan IT ITES--Sample
Sr. No City Universe Field Activity Sample
1 Rawalpindi / Islamabad 874 64 70
2 Karachi 862 73 70
3 Lahore 819 80 70
4 Peshawar 97 32 30
5 Faisalabad 20 16 15
6 Multan 12 13 10
7 Gujranwala 10 0 5
8 Abbottabad 7 5 5
9 Sialkot 7 0 5
10 Hyderabad 7 7 5
11 Sargodha 2 5 5
12 Jhelum 1 5 5
13 Sukkur 1 0 5
2719 300 300
25
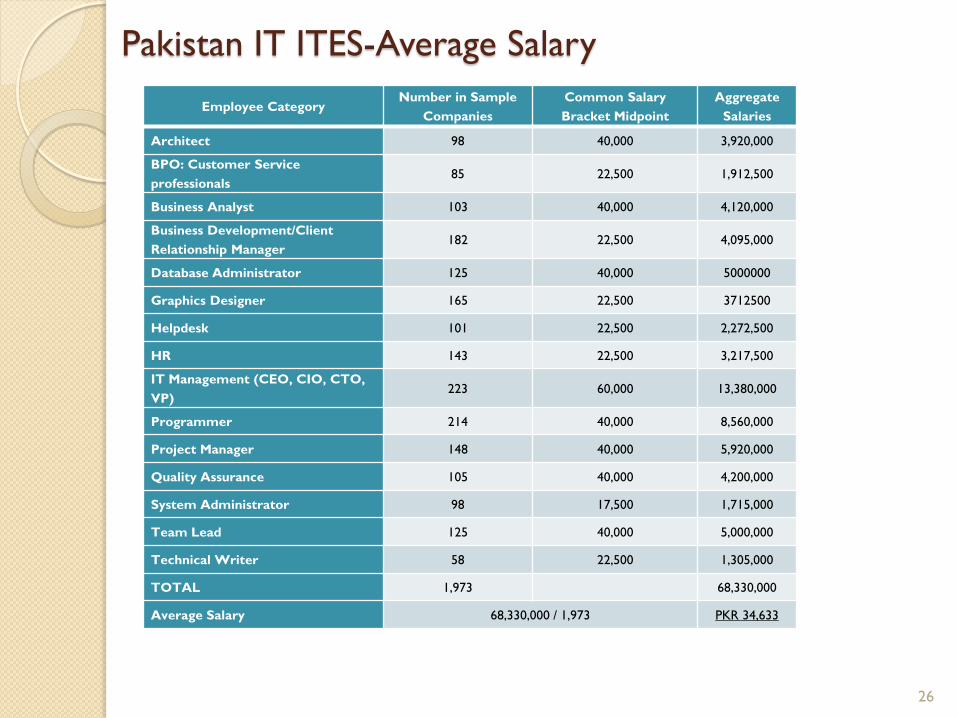
Pakistan IT ITES-Average Salary
Employee Category Number in Sample
Companies
Common Salary
Bracket Midpoint
Aggregate
Salaries
Architect 98 40,000 3,920,000
BPO: Customer Service
professionals 85 22,500 1,912,500
Business Analyst 103 40,000 4,120,000
Business Development/Client
Relationship Manager 182 22,500 4,095,000
Database Administrator 125 40,000 5000000
Graphics Designer 165 22,500 3712500
Helpdesk 101 22,500 2,272,500
HR 143 22,500 3,217,500
IT Management (CEO, CIO, CTO,
VP) 223 60,000 13,380,000
Programmer 214 40,000 8,560,000
Project Manager 148 40,000 5,920,000
Quality Assurance 105 40,000 4,200,000
System Administrator 98 17,500 1,715,000
Team Lead 125 40,000 5,000,000
Technical Writer 58 22,500 1,305,000
TOTAL 1,973 68,330,000
Average Salary 68,330,000 / 1,973 PKR 34,633
26

27