Embed Size (px)
Citation preview

Pakistan Strategy Support Program (PSSP)
PSSP Working Paper No. 007
November 2012
Pakistan Rural Household Panel Survey 2012 (Round 1):
Methodology and Community Characteristics
Hina Nazli and Syed Hamza Haider
IFPRI-Pakistan Islamabad, Pakistan Tel: +(92)-51-8355888 Fax: +(92)-51-8436774
IFPRI Headquarters International Food Policy Research Institute 2033 K Street, NW • Washington, DC 20006-1002 USA Tel: +1-202-862-5600 Skype: IFPRIhomeoffice Fax: +1-202-467-4439 E-mail: [email protected] www.ifpri.org
PSSP Working Paper Series

THE PAKISTAN STRATEGY SUPPORT PROGRAM (PSSP) WORKING PAPERS
ABOUT PSSP
The Pakistan Strategy Support Program is an initiative to strengthen evidence-based policymaking in
Pakistan related to rural and agricultural development. Funded by the United States Agency for
International Development and facilitated by the International Food Policy Research Institute (IFPRI),
PSSP works closely with the Government of Pakistan, the Innovative Development Strategies (Pvt) Ltd.
(IDS), and other development partners to provide information relevant for the design and implementation
of Pakistan’s agricultural and rural development strategies. For more info, please visit pssp.ifpri.info
ABOUT THESE WORKING PAPERS
The Pakistan Strategy Support Program (PSSP) Working Papers contain preliminary material and
research results from IFPRI and/or its partners in Pakistan. The papers are not subject to a formal peer
review. They are circulated in order to stimulate discussion and critical comment. The opinions are those
of the authors and do not necessarily reflect those of their home institutions or supporting organizations.
About the Author(s)
Hina Nazli is a Research Fellow at the Pakistan Strategy Support Program, Islamabad ([email protected])
Syed Hamza Haider is a Senior Research Assistant in the Development Strategy and Governance Division at IFPRI

Copyright © 2012 International Food Policy Research Institute. All rights reserved. Sections of this material may be reproduced for personal and not- for-profit use without the express written permission of but with acknowledgment to IFPRI. To reproduce the material contained herein for profit or commercial use requires express written permission. To obtain permission, contact the Communications Division at [email protected].
Pakistan Rural Household Panel Survey 2012 (Round 1):
Methodology and Community Characteristics
Hina Nazli and Syed Hamza Haider

i
Acknowledgements
The data collection, reporting process and key descriptive statistics from the Rural Household Panel
Survey 2012 Round 1 are presented in PSSP discussion papers 007, 008 and 009. Discussion paper no.
007 reports the details of survey processes and key descriptive statistics from the community survey
questionnaires. Discussion paper no. 008 provides the description of all the data collected from
households except for Agriculture and Health and Nutrition. Discussion paper no. 009 provides a
description and analysis of the Aspirations of these households. There will be separate discussion
papers on Agriculture and Health and Nutrition which are forthcoming.
The questionnaires of this survey are benefitted from extremely useful feedback from Dr. Nadeem Ul
Haque, Dr. Akmal Hussain, Dr. Muslehuddin, Dr. Masood Sarwar Awan, and the participants of the
workshop held at the Planning Commission in January 2012 to discuss the need and design for this
survey. We are grateful for their valuable and thoughtful comments which helped immensely in the
shaping of the questionnaires. The questionnaires design team was led by Dr. Katrina Kosec of IFPRI
and Nishat Malik of IDS. Thanks are also due to Dr. Harold Alderman, formerly of IFPRI and the World
Bank for his formal review of the questionnaire in its design stage.
This work is the joint effort of several persons from the Pakistan Strategy Support Program (PSSP), the
International Food Policy Research Institute (IFPRI), and the Innovative Development Strategies (IDS).
These teams accomplished the huge task from designing the questionnaires, translation into Urdu,
training of enumerators, monitoring the field survey implementation, data cleaning, data analysis, and
preparation of the survey reports
We are grateful to the 150 enumerators who worked diligently in extremely difficult circumstances.
Despite several security issues, they put out exemplary efforts to collect the data. We would like to thank
the 2090 households, 228 key informants, 117 school teachers, and 228 shopkeepers who participated in
this survey and provided their valuable time and useful information.
We are indebted to Dr. Muhammad Sharif, Director General and the staff of NARC for organizing the
accommodation and training space at the NARC for the 150 enumerators.
This work would not have been possible without the guidance and support provided by Dr. Sohail
Jehangir Malik, Chairman, IDS and Dr. Paul Dorosh, Director of the Development Strategy and
Governance Division at IFPRI. Their invaluable input and advice at each and every stage of this process
from survey design to the production of these discussion papers is gratefully acknowledged. We are
grateful to Dr. Nadeem ul Haque, Chairman of the National Advisory Committee of the Pakistan Strategy
Support Program and Deputy Chairman of the Planning Commission of Pakistan for always making us all
think a little harder to perfect our work.
We would like to thank Dr. Katrina Kosec, Dr. Valerie Mueller, Stephanie Hausladen, Edward Whitney,
Fatima Zaidi, Dr. Claudia Ringler, Dr. David Spielman, and Madeeha Hameed of IFPRI, and Nishat Malik,
Arshad Khurshid, Asjad Tariq, Hassan Shafiq, Saqib Shahzad, Amina Mehmood, Asma Shehzad, Azhar
Amir, Danish Javaid Satti, Muhammad Awais, Anees Majeed, Mubashir Ijaz, Muhammad Imran, Zahid
Masood, Munazza Saboohi, and Beenish Jabeen of IDS for their valuable contribution toward this paper.
The support provided by the PSSP team members – Saira Malik, Sheheryar Rashid, Wajiha Saeed, and
Mohammad Ishfaq is gratefully acknowledged. We are thankful to Col. Imran Afzal Malik and his team
including, Tahir Ahmad, Haji Afsar Khan, Afzaal Ahmed, and Asjad Iqbal for providing logistic and
administrative support. The painstaking editorial work by Mehrab Malek is also highly acknowledged.

ii
Finally we would like to thank the United States Agency for International Development (USAID) for their
generous funding without which this survey would not have been possible. In particular we are grateful to
the ATOR Dr. Michael Wyzan, and his colleague Mr. Nazim Ali for supporting us so wholeheartedly
through this process.

iii
Acronyms and Abbreviations
AKRSP Agha Khan Rural Support Programme
BHU Basic Health Units
BISP Benazir Income Support Programme
CsPro Census and Survey Processing System
DHS Demographic and Health Survey
FATA Federally Administered Tribal Areas
GDP Gross domestic Product
GOP Government of Pakistan
HIES Household Integrated Economic Survey
IFPRI International Food Policy research Institute
KPK Khyber Pakhtunkhwa
LFS Labour Force Survey
LHW Lady Health Worker
MPI Multidimensional Poverty Index
NARC National Agricultural Research Center
NGO Non-Governmental Organization
NRSP National Rural Support Programme
PPHS Pakistan Panel Household Survey
PPP Purchasing Power Parity
PPS Probability Proportionate to Size
PRSP Punjab Rural Support Programme
PSES Pakistan Socioeconomic Survey
PSLM Pakistan Social and Living Standards Measurement Survey
PSSP Pakistan Strategy Support Program
PSUs Primary Sampling Units
RHC Rural Health Clinic
RHPS Rural Household Panel Survey
SPSS Statistical Package for Social Scientists
SRSP Sarhad Rural Support Programme
SSU Secondary Sampling Units
UC Union Council
UN United Nations
ZTBL Zarai Taraqiyati Bank

iv
Table of Contents
Acknowledgements ........................................................................................................................................ i
Acronyms and Abbreviations ........................................................................................................................ iii
Table of Contents ......................................................................................................................................... iv
List of Tables ................................................................................................................................................ vi
List of Figures ............................................................................................................................................... vii
Executive Summary .................................................................................................................................... viii
1. INTRODUCTION ....................................................................................................................................... 1
2.1 Sample Design ................................................................................................................................... 5
2.1.1 Selection of districts and mouzas ................................................................................................ 5
2.1.2 Selection of households .............................................................................................................. 6
2.1.3 Sampling weights ........................................................................................................................ 7
2.2. Survey Methods ................................................................................................................................. 8
2.2.1 Survey instruments ...................................................................................................................... 8
2.3 Survey Implementation ..................................................................................................................... 11
2.3.1 Data editing and entry ............................................................................................................... 11
3. DESCRIPTION OF COMMUNITIES ....................................................................................................... 13
3.1 Basic Features of Selected Mouzas ................................................................................................. 13
3.2 Basic Characteristics of the Respondents (Key Informants) ............................................................ 13
3.3 Type of Households .......................................................................................................................... 13
3.4 Physical Infrastructure of Villages .................................................................................................... 14
3.4.1 Structure of internal and external roads .................................................................................... 14
3.4.2 Common mode of transport ....................................................................................................... 14
3.5 Access to Services ........................................................................................................................... 15
3.5.1 Access to health services .......................................................................................................... 15
3.5.2 Access to credit services ........................................................................................................... 16
3.5.3 Access to facilities ..................................................................................................................... 17
3.5.4 Distance to important locations ................................................................................................. 18
3.6 Non-farm Business Environment ...................................................................................................... 18
3.7 Outside Linkages of Village .............................................................................................................. 20
3.8 Welfare Programs of Government or NGOs ..................................................................................... 20
3.9 Development Programs During Last Five Years .............................................................................. 21
3.10 Natural Disasters ............................................................................................................................ 22
4. ANALYSIS OF SCHOOL SURVEY ........................................................................................................ 23
4.1 Physical Infrastructure of Schools .................................................................................................... 24
4.2 Student-Teacher Ratio ...................................................................................................................... 25

v
5. ANALYSIS OF PRICE SURVEY ............................................................................................................. 27
5.1 A Comparison of Prices at Different Market Levels .......................................................................... 27
References .................................................................................................................................................. 31
Appendix 1 Selected Sample ...................................................................................................................... 32
Appendix 2: Concepts and Definitions ........................................................................................................ 35

vi
List of Tables
Table 1.1: Existing Nationally Representative Household Surveys in Pakistan ........................................... 2
Table 1.2: Existing Panel Surveys in Pakistan.............................................................................................. 2
Table 1.3: Multidimensional definitions of poverty and information gaps ..................................................... 4
Table 2.1: Primary and Secondary Sampling Units of the Rural Household Panel Survey 2012 ................ 7
Table 2.2: Proportion of weighted households in RHPS-2012 and HIES-2010-11 ...................................... 8
Table 3.1: Percentage distribution of household by agricultural land ownership (%) ................................. 14
Table 3.2: Structure of internal and external roads by province ................................................................. 14
Table 3.3: Common mode of transport within and outside the village ........................................................ 15
Table 3.4: Average distance (in kilometer) to health facilities outside village by province ......................... 16
Table 3.5: Average distance (in kilometer) to credit facilities outside village by province .......................... 17
Table 3.6: Availability of public services in selected villages (Percent villages) ......................................... 17
Table 3.7: Distance to important locations from villages by province ......................................................... 18
Table 3.8: Change in nonfarm business environment during last five years .............................................. 18
Table 3.9: Presence of a social welfare programs within villages across provinces (% villages) .............. 21
Table 3.10: Percentage distribution of villages by program and their degrees of importance .................... 21
Table 3.11: Percentage distribution of villages reporting development programs in past five years .......... 22
Table 4.1: Proportion of schools by type across provinces ........................................................................ 24
Table 4.2: Physical infrastructure of schools .............................................................................................. 25
Table 4.3: Enrolment, number of teachers, and student-teacher ratio by province .................................... 25
Table 4.4: Enrolment, number of teachers, and student-teacher ratio by level of education ..................... 26
Table 5.1: Prices of selected food items at district, UC, and Mauza levels in Punjab, Sindh, and KPK
(Rs/Kg) ........................................................................................................................................................ 28

vii
List of Figures
Figure 3.1: Proportion of villages reporting the presence of a health facility .............................................. 15
Figure 3.2: Proportion of villages reporting the presence of a credit facility ............................................... 16
Figure 3.3: Major business constraints ....................................................................................................... 19
Figure 3.4: Presence of chamber of commerce or business associations at tehsil level (% villages) ........ 20
Figure 4.1: Number of schools identified but not interviewed ..................................................................... 23
Figure 4.2: Proportion of schools with highest level of education ............................................................... 24

viii
Executive Summary
The Pakistan Strategy Support Program (PSSP) conducted this Rural Household Panel Survey (RHPS)
during March-April 2012 in three provinces of Pakistan (Punjab, Sindh, and KPK). The survey aims to
provide the quantitative basis to identify and address the urgent economic policy priorities related to the
implementation of the Planning Commission’s Framework for Economic Growth.
This survey collected information on a large number of topics, such as, sources of income, nature of
employment, consumption patterns, time use, assets and savings, loans and credit, education, migration,
economic shocks, participation in social safety nets, and household aspirations. In this regard, data were
collected not only from household (called household survey) but also from key informants of the selected
mouzas (community survey), school headmaster/mistress of schools in mouza (school survey), and
shopkeepers in three markets of a district (price survey).
Given the large volume of data and information collected from this survey, the survey results are
presented in two discussion papers. The first provides details of the sample selection process, survey
instruments and implementation. It also provides details on the community, schools and prices
questionnaires. A detailed analysis of the household survey is presented in the second discussion paper.
Sample Design and Survey Process: The sample universe included all households in the rural areas of
the provinces of Punjab, Sindh and Khyber-Pakhtunkhwa (KPK). Balochistan was dropped from the
sample selection due to security reasons. The multistage stratified sampling technique was used. A total
of 19 districts were selected from within the three provinces; 12 from Punjab, 5 from Sindh and 2 from
KPK. Within each district, 4 mouzas were chosen, 48 from Punjab, 20 from Sindh and 8 from KPK, for a
total of 76 mouzas in the sample. One enumeration block was selected from each mouza and a complete
household listing was conducted in this block. Finally 28 households were randomly selected from this list
to be included in the sample. Thus a total of 2124 households were selected for survey. Of these 34
refused and the survey was conducted on 2090 households.
Six survey instruments were developed to collect the information. These included three questionnaires
(Male, Female and a household member 18-35 years old) for each household in the sample and a
community (one per mouza), schools (at least one per mouza) and prices (one district, UC and mouza)
questionnaire.
The survey was conducted by nineteen teams, each comprising two males, two females and a
supervisor. The monitoring of the whole survey process was conducted by a team of monitors. A survey
coordinator controlled all the field operations. The survey was completed by April 25, 2012 and data entry
was completed by May 22, 2012. The results of household survey are presented in Volume II of this
report.
Analysis of Community Survey: The community survey describes the conditions of mouzas surveyed.
The results indicate that a major portion of internal roads of the villages were made of mud whereas a
major portion of external roads were made of asphalt. The most common modes of transport to go to
nearest city were motorcycle, three-wheeler, four wheeler and bus. The informal health services such as
midwives dominated the villages whereas the formal health services such as hospitals were found in a
very low percentage of the villages. The most common sources of credit within villages were shopkeepers
and landlords. Formal credit institutions were found in very few villages and in most cases were more
than 15 kilometers away from these villages. The most common basic services and amenities were
cellular phone services which were available in almost all the villages whereas the least common was
garbage collection system which was available only in 1.3 percent of the villages.

ix
Most villages indicated betterment in the business environment in their villages in the last five years. A
majority of the villages identified poor quality of electricity as the major constraint for the growth of
nonfarm business. A majority of villages reported the presence of a factory/mill within 20 kilometers. A
large majority of villages reported the presence of some welfare program in their village. Nearly two-third
villages had at least one development program during last five years with the majority of these programs
related to improvements in school infrastructure or the connection to cellular or fixed phone lines.
Analysis of School Survey: A total of 117 schools were surveyed in 62 communities; 8 communities had
no schools and schools present in another 6 schools were not functional. Urdu was found to be the most
common medium of instruction in a majority of schools, however in Sindh, a large proportion of schools
used Sindhi as a medium of instruction. Private schools were very few and were mostly located in Punjab.
Almost half of the schools surveyed have co-education. More than half were primary schools. In terms of
facilities a majority of these schools used chalk board, had a boundary wall and electricity whereas only a
small proportion had a library and a laboratory. On average there were 5 teachers per school with a larger
proportion of teachers being male. A majority of the schools did not charge any tuitions fee. The average
enrolment was 156 students per school with a student-teacher ratio of 31:1.
Analysis of Price Survey: According to the price survey there were significant price differentials across
markets within a province. Prices of wheat flour, rice, milk, and milk products were significantly higher in
district markets (or urban markets) than the UC and mouza markets (rural markets). No significant
difference in the prices of pulses, fruits and vegetables, meat and poultry, edible oil and ghee, and sugar
were observed. Significant provincial differences in the prices of food items were observed.

1
1. INTRODUCTION
Pakistan’s economy has been growing at a slow pace (around 3 percent per year) during the last 5 years.
Savings and investments as percent of GDP have been declining and overall deficit has been growing.
Prices of essential items rose manifolds during the last five years. Slow production activity resulted in an
increasing number of unemployed people (GOP 2012). High and persistently increasing inflation resulted
in declining real wages of skilled and unskilled workers and real household consumption expenditure
remained stagnant. This is evident from the increasing share of food expenditure in total household
expenditure since 2007.
Different measures of poverty show considerably high levels of deprivation. The Multidimensional Poverty
Index (MPI)1 indicates that about 49.4 percent of the population suffered multiple deprivations in 2007
while an additional 11.0 percent were vulnerable to multiple deprivations. Income poverty measured by
the percentage of the population living below PPP US$1.25 per day was 22.6 percent. This indicates that
income poverty only tells part of the story. The multidimensional poverty headcount was 26.8 percentage
points higher than income poverty. This implies that individuals living above the income poverty line may
still suffer deprivations in education, health and other living conditions (UNDP 2011).
Peoples’ perception about the economic condition of their household and the community is not very
encouraging. The nationally representative household survey, the Pakistan Social and Living Standards
Measurement Survey (PSLM), asks respondents to provide their perception about the economic situation
of their household and community. In addition, subjective information on the effectiveness of public
services and facilities available to them is also asked. The most recent survey was conducted in 2010-11.
Nearly 43 percent respondents of this survey expressed either a worsening economic situation of their
household or no change compared to the previous year. Only 16 percent households reported a better or
much better economic condition. Similar responses were received when these questions were asked
about their community. In this survey, households were also asked about their level of satisfaction with
the facilities and services provided by the government. In response to this question, 31 percent reported
satisfaction with health facilities, 12 percent were satisfied with the Family Planning Services, 61 percent
with school services, 15 percent with Agriculture Extension services, and 10 percent with the police (GOP
2011).
To examine the levels and dynamics of poverty, several household surveys have been conducted in
Pakistan. The government of Pakistan conducts three different types of household surveys, namely
Pakistan Social and Living Standards Measurement Survey (PSLM), Labour Force Survey (LFS), and
Demographic and Health Survey (DHS). Table 1.1 provides details on the type of data, available
information, and what information is missing in these surveys. These surveys provide useful information
to measure income and non-income measures of poverty, nature and levels of employment,
unemployment and underemployment, and health status and demographic situation.
1 The Multidimensional Poverty Index (MPI) was developed in 2010 by the United Nations Development Program,
and uses several factors that constitute poor people’s experience of deprivation, such as poor health, lack of education, inadequate living standard, lack of income, disempowerment, poor quality of work and threat from violence.

2
Table 1.1: Existing Nationally Representative Household Surveys in Pakistan
Household Survey
Type of data Available information
Useful for Missing information
Household Integrated Economic Survey (HIES) and PSLM
Time series of cross sections
Detailed information on income, expenditure, health and education
Measuring income and non-income measures of poverty
Income and Poverty dynamics
Labour Force Survey
Time series of cross sections
Detailed information on employment
Measuring labour force participation, employment, unemployment, underemployment
Sources of income, poverty and poverty dynamics
Demographic and Health Survey
Time series of cross sections
Detailed information on health and demographic aspects
Measuring health status, and demographic situation
Sources of income, expenditure and employment
Source: Authors’ compilation
In addition to the nationally representative surveys and to examine the nature, depth, and dynamics of
poverty, three panel surveys were also conducted. Despite providing useful information, these surveys
have some limitations. These surveys and their limitations are listed in Table 1.2.
Table 1.2: Existing Panel Surveys in Pakistan
Household Survey Years Data points Available information Limitations
IFPRI panel survey 14 rounds
1986-1994 14 (rural areas)
Sources of income, expenditure, food security, health, nutrition, anthropometry, at disaggregated level
Covers only four districts and 728 households
Pakistan Socioeconomic Survey (PSES), 1999, 2002
1998-99, and 2001
2 (rural and urban areas)
Income, expenditure, health, education.
Limited access
Pakistan Panel Household Survey (PPHS)
2001, 2004, 2010
3 (2 rounds were rural, 3
rd
was rural and urban)
Detailed data on rural incomes, expenditure, various socio-economic factors
Limited access
Source: Authors’ compilation
These data sets generated a large body of economic research with useful policy implications.2 The
research identifies the levels of poverty and its concentration, nature of employment, important sources of
income, expenditure patterns, enrolment rates, health status, and so on. The data from these surveys
2 For example, research found that the rationing system of wheat flour benefitted ration shop owners rather than poor,
therefore, the Government of Pakistan took the step of abolishing the ration shop system (Islam and Garrett 1997).

3
indicate that poverty is concentrated in rural areas. The data also show that the size of farm sector is
shrinking, nonfarm employment opportunities are not enough to absorb the rural labour force, institutional
setup in rural areas is not supportive of rural people, linkages with urban areas are weak, poor
infrastructure is an obstacle in mobility, and that the existing structure favors the large farmers and the
rich. Despite identifying several problems related to persistent poverty and its concentration, these
surveys fail to dig out the deeply rooted causes of poverty. For example, the existing data sets do not
provide information on some indicators that describe the broader and multidimensional poverty defined by
the UN in 1998:
“Fundamentally, poverty is a denial of choices and opportunities, a violation of human dignity. It
means lack of basic capacity to participate effectively in society. It means not having enough to feed
and clothe a family, not having a school or clinic to go to, not having the land on which to grow one’s
food or a job to earn one’s living, not having access to credit. It means insecurity, powerlessness and
exclusion of individuals, households and communities. It means susceptibility to violence, and it often
implies living in marginal or fragile environments, without access to clean water or sanitation (UN
Statement, June 1998 – signed by the heads of all UN agencies)3”.
Table 1.3 below describes the dimensions of poverty, measurable indicators, and their availability in the
available data sets in Pakistan. This table indicates that despite having a good stock of data on various
economic, social, and demographics variables, information on insecurity, powerlessness and exclusion,
susceptibility to shocks and violence, and coping strategies, and individuals’ aspirations are still missing.
In addition, the results of the previously conducted panel data indicate a higher incidence of transitory
poverty in rural Pakistan (Dorosh and Malik 2006). Highlighting the data and research gap, Malik (2005)
writes: “The limited research available on chronic and transitory poverty indicates different determinants
for each and, therefore, implies different policy measures to reduce poverty. Further analysis is limited by
the absence of more recent panel data. With the changes occurring in policy approaches towards
poverty, inequality, and growth, the need for disaggregated and more in-depth data has increased
considerably. The existing data gaps make it extremely difficult to trace trends in the impact of various
macroeconomic indicators, and even more difficult to juxtapose them with policy initiatives in order to
observe the impact that a particular policy may have had. The availability of appropriate data is the crux
of effective policy formulation, and analyzing economic or social performance is impossible without it.
Moreover, not only is it necessary to increase the scope of data collection, but also to improve the quality
of the existing database and surveys” (see Malik, 2005, pp 60).
3 http://www.un.org/esa/socdev/unyin/documents/ydiDavidGordon_poverty.pdf

4
Table 1.3: Multidimensional Definitions of Poverty and Information gaps
Definition of Poverty Indicators Information Available
Not having enough to feed and clothe a family
Household income/expenditure Yes
Lack of basic capacity to participate effectively in society
Education and health, shelter, and access to clean water and sanitation
Yes
Lack of access to productive resources
Asset base, employment, land, credit, physical infrastructure, etc.
Yes
Lack of asset ownership Savings, durable, Yes
Insecurity, powerlessness and exclusion – Low Aspirations
Location, access to justice, exploitation, awareness about rights and responsibilities, institutional setup and their functioning, rural-urban and agriculture-non-agricultural linkages
No
Susceptibility to shocks Coping strategies, safety nets, No
Susceptibility to violence Perception, hope, aspirations No
Source: Authors’ compilation
Therefore, effective policy-making for accelerated and inclusive income growth requires better and more
detailed real-time information on various factors presented in Table 1.3. To bridge the gap in the
availability of detailed data, the Pakistan Strategy Support Program (PSSP) conducted a Rural Household
Panel Survey during March-April 2012 in three provinces of Pakistan (Punjab, Sindh, and KPK). This
survey aims to identify the urgent economic policy priorities related to the implementation of the
Framework for Economic Growth, and to inform economists in the public and academic communities of
the new data that the survey will provide. This survey collected information on a large number of topics,
such as, sources of income, nature of employment, consumption patterns, time use, assets and savings,
loans and credit, education, migration, economic shocks, participation in social safety nets, and
household aspirations. In this regard, data were collected not only from households (called household
survey) but also from key informants of the selected mouzas (community survey), school
headmaster/mistress of schools in mouza (school survey), and shopkeepers in three markets of a district
(price survey).4
Given the large volume of data and information collected from this survey, the survey results are
presented in two discussion papers. The first provides the details of the sample selection process,
selected sample and sample weights, survey instruments and implementation. In addition a description of
communities, schools in these communities, and the prevailing prices in three markets of selected
districts are also included.
This paper is divided into five sections. The second section presents the sample design and survey
processes. The description of communities is reported in Section 3. The results of the data collected from
schools are presented in Section 4. Section 5 reports the results of the price survey.
Detailed descriptive analysis of the key dimensions of rural household behavior observed through this
survey are presented in the discussion paper 008.
4Three markets are district, UC, and mouza markets.

5
2. SAMPLE DESIGN AND SURVEY PROCESSES
2.1 Sample Design
In Pakistan, there are 114 districts in Punjab, Sindh, Khyber Pakhtunkhwa (KPK), Balochistan and
Islamabad. According to the Mouza Census of 2008, there are 52,376 mouzas in the four provinces.
Mouza, a revenue village, is a unit of land organization defined by the government. It consists of one or
more villages. There are 27,059 mouzas in Punjab, 5,983 in Sindh, 11,854 in KPK and 7,480 in
Balochistan.
The Rural Household Panel survey was conducted in the rural areas of Punjab, Sindh and Khyber-
Pakhtunkhwa (KPK) provinces of Pakistan. The fourth province, Balochistan was dropped from the
sample selection process because of security reasons. The sample universe includes all households in
the rural areas of these three provinces. In this regard, the lists of revenue villages/mouzas/dehs have
been used as sampling frame as provided by the Population Census, 1998. This data provides
information on the population and the number of households in each mouza at national, provincial,
district, tehsil, union council and mouza (revenue village) level not only for 1998 but also provides
population projections up to year 2030.
To prepare the sampling frame, all enumeration blocks classified as urban in the 1998 Census were
removed. We also ignored all enumeration blocks where the estimated population is greater than 25,000
in 2011, since some areas that were rural in 1998 may have urbanized over the past 13 years.
2.1.1 Selection of districts and mouzas
The multistage stratified sampling technique was used. In the first stage, Probability Proportionate to Size
(PPS)5 was used to select districts. This method ensures that districts with more rural households have a
greater chance of being selected. The proportion of rural households in each province determined the
number of districts chosen from there. A total of 19 districts were selected from within the three provinces;
12 from Punjab, 5 from Sindh and 2 from KPK. Within each district, 4 mouzas as Primary Sampling Units
(PSUs) were chosen using an equal probability systematic selection. In other words, the mouzas with
smaller populations had the same probability of being selected as highly populated ones. The PPS at this
stage would ensure each household had same probability of being in sample. However, that would bias
our sample towards more populous mouzas, and possibly ignore the smallest mouzas. Since our survey
aims to understand the dynamics of rural Pakistan, it is imperative to include mouzas of different sizes.
The selected mouzas can be seen in Figure 2.1.
5 This method ensures that the districts with more rural households have a greater chance to be selected.

6
Figure 2.1: Pakistan Rural Household Panel Survey Sites
Source: Authors’ compilation based on (IFPRI/IDS 2012).
2.1.2 Selection of households
In each mouza, the enumeration teams conducted reconnaissance. They prepared a map of the village. A
mouza is divided into enumeration blocks. Each block consists of maximum 200 households. One
enumeration block was randomly selected. Households within each mouza or Primary Sampling Units
(PSU) have been considered as Secondary Sampling Units (SSU). A complete household listing was
conducted in this block, and 28 households were randomly selected from this list. There was no
replacement for households that refused to participate in the survey. The number of selected PSUs and
SSUs are reported in Table 2.1.

7
Table 2.1: Primary and Secondary Sampling Units of the Rural Household Panel Survey 2012
PSU (Mouzas) SSU (Households)
Punjab 48 1340
Sindh 20 560
KPK 8 224
Overall 76 2124 Source: IFPRI/IDS (2012).
2.1.3 Sampling weights
The sampling frame of the RHPS is based on the 1998 census document. It contains rural households in
Punjab, Sindh and 11 districts of KPK.6 The household sampling weights are calculated as the inverse of
the probability of being selected in the sample, where
Probability of being selected in the sample = D * M * H,
where D = probability of household’s district being chosen, M = probability of household’s mouza being
chosen, and H = probability of household being selected from within the mouza.
D = DBASIC * DADJ (1)
where DBASIC = No of districts selected from the province * (No of households in the district / No of
households in the province) and
DADJ = No of districts from the province in our sample / Proportion of households in that province
M = MSEL / MTOT (2)
where MSEL = No of mouzas selected from the district and M TOT = Total no of mouzas in the district
H = HSEL / HEA (3)
where HSEL = No of households selected from the mouza and HMA = No of households in the mouza
The final household weights are:
FW = W / SCA (4)
where FW = final household weights, W = weights calculated above and SCA = raised number of
households per province using variable weights / sampling frame number of households per province.
Using the weighted numbers, the RHPS-2012 covered 15,277,355 households, 66.4 percent in Punjab,
24.7 percent in Sindh, and 8.9 percent in KPK. Compared to the weighted sample of HIES-2010-11, the
RHPS is over-sampled in Sindh and under-sampled in KPK (see Table 2.2). This may be due to the fact
that our sampling frame for KPK includes only 11 districts of the province that are declared safe.
6 The remaining districts of KPK were removed from the sampling frame because they were considered unsafe for
surveying.

8
Table 2.2: Estimated Number of Households in RHPS-2012 and HIES-2010-11
RHPS-2012
% of total RHPS SSUs HIES-2010-11
% of total HIES SSUs
Punjab 10,143,181 66.4 8,249,162 65.3
Sindh 3,770,153 24.7 2,290,510 18.1
KPK 1,364,021 8.9 2,100,901 16.6
Total 15,277,355 100.0 12,640,573 100.0 Source: Authors’ calculation based on IFPRI/IDS (2012) and HIES (2010).
For external validation of these household weights, we look at a variable in our survey and raise it to
provincial levels using the weights. We compare these provincial estimates with an official source of data.
We choose agricultural land as the variable, and will use the Agriculture Statistics of Pakistan (2010-11)
for provincial estimates of agricultural land. It should be noted that since the weights are not constructed
based on agricultural land, we do not expect these number to be exactly the same. Also, there may be
reporting error on the agricultural land in the survey.
Our survey estimates that there are 29.5 million acres of land in Punjab, 8.6 million in Sindh and 3.1
million in KPK. This is the sum of all household managed plots in the three provinces. The Agriculture
Statistics of Pakistan shows that there are 31.1 million acres of agricultural land in Punjab, 12.6 million in
Sindh and 4.5 million in KPK. This is the sum of the Net Area Sown and Currently Fallow variables found
in their report. It should also be noted that the KPK figure is based on all districts of KPK, not the 11 that
were included in our sampling frame.
2.2. Survey Methods
The Rural Household Panel Survey was conducted during March-April 2012 in 19 districts of Punjab,
Sindh and KPK. The preparations for this survey started in January 2012. The whole survey process
consists of the following different stages:
Questionnaire designing and preparation
o Urdu translation
o Urdu typing
o Questionnaire printing
Team selection
Team training and pretesting
Field survey
o Data enumeration
o Supervision
o Monitoring
Data entry program
Data editing
Data entry
Data cleaning
2.2.1 Survey instruments
Six survey instruments were developed to collect the information. These included three household level
questionnaires (two were designed to collect household information on various household and individual

9
level aspect by males and females separately, and the third was an aspirations questionnaire, conducted
on a household member between ages 18-35), a community questionnaire, a price questionnaire, and a
school questionnaire.
Household questionnaires (male, female, and aspirations)
Three different respondents from each household were surveyed; a male, a female, and a household
member between the ages 18 to 35 years. Male and female questionnaires collected information on
household and individual information on various economic, social, demographic, variables. In addition, an
aspirations module was also a part of the male and female questionnaires. To examine the aspirations of
young people in rural Pakistan, we conducted only the aspiration module with young individuals (between
the ages 18 to 35 years).
Modules in male questionnaire
The male questionnaire gathered information from the head of the household, or from the most
knowledgeable male member of the household.
Roster (individual level information in the household)
Education (including levels of schooling, current and available schooling, reasons for attending
school)
Agriculture (plot and crop level information on all production and sales operations)
Assets (information on household, and farm assets)
Housing (housing condition, type of ownership, access to facilities)
Savings (household savings and their forms)
Household expenditures (for items less frequently consumed by the household )
Credit (credit information by type of lender and purpose by type of loan)
Employment and migration (farm and nonfarm employment and in and out migration, and
remittances)
Economic shocks and coping strategies
Participation in social safety nets
Aspirations (details are given below in aspiration module)
Modules in female questionnaire
The female questionnaire gathered information from the spouse of the household head, or from the head
in the case of female-headed households or from the most knowledgeable female of the household.
The main sections of the female questionnaire were:
Roster (basic household information by individual)
Education of female household members and all children (including levels of schooling, current
and available schooling, reasons for attending school, and security concerns with girls’ education)
Time use (time spent in different household chore and paid or self-employment)
Employment (details on paid farm and non-farm work, non-agricultural enterprises)
Consumption and expenditure (food and non-food items frequently consumed by the household)
Individual savings
Purdah, safety, and mobility (practices and perceptions of safety)
Level of household satisfaction with services and facilities

10
Health (includes birth history, anthropometry of women and children, general health of household
adults, and recent illnesses)
Nutrition (infant and young child feeding practices and the use of micronutrients, nutrition
knowledge of mothers, immunization and health status of young children, and nutrition-related
prenatal care during pregnancy with the youngest child)
Food security
Participation in and perceptions of social safety net and NGO programs
Level of Household Satisfaction with Services and Facilities
Aspirations (details are given below in aspiration module)
Modules in aspirations questionnaire
This module was adapted from an instrument previously used in Ethiopia. The standard instrument
contains four sections on:
Overall aspirations;
Psychology;
Time Preferences, risk, and self-control; and
Aspirations window
The variables in these sections collected information on individuals’ locus of control, self-esteem,
perceptions about poverty, subjective well-being, time preference, attitude towards risk, and the
consequences for future-oriented behavior. In addition, several questions related to security and
religiosity were also included in the survey instrument.
Community questionnaire
Data on community characteristics was collected through a focus group discussion with three key
informants of the village. The selected mouza was considered as one community. In each mouza one
questionnaire was conducted. This questionnaire collected the following information:
Information about respondents
Basic community characteristics and infrastructure
Health services
Credit services
Governance
Business environment and organizations
Natural disasters
Distance to important locations
Nature of land ownership
Information on watercourses
School questionnaire
The school questionnaire collected information on the physical and human infrastructure of schools in a
community (mouza). In one community at least one questionnaire was conducted. The respondent of this
questionnaire was a school principal, head master/mistress, or a senior school teacher. This
questionnaire collected the following information:
Information about the respondent
11
Physical infrastructure of school
Human infrastructure of school
Cost of running a school
Price questionnaire
The price questionnaire was conducted to collect information on important consumption items. These
data were collected from three different markets: village market, Union Council market, and district
market.
The survey instruments went through several stages. Several documents, existing questionnaires, and
other countries experiences were consulted. In addition, the questions were discussed with economists,
sociologists, psychologists, and policy makers. The prepared questionnaires were tested in the field and
the feedback was incorporated. Details are given in Appendix Table A2.
The instruments were translated into Urdu and to check the accuracy, the Urdu translation was translated
back into English. A questionnaire manual was prepared that contained instructions about the survey and
definitions of important terms used in the questionnaire.
2.3 Survey Implementation
Seventy-six enumerators and nineteen supervisors were selected from the sampled districts so that they
could speak the local language and understand the local terminology. These enumerators were provided
a two-part intensive training in Islamabad for 15 days. In the first part the supervisors were trained on all
survey instruments and preparation of household listing to select the final sample. In the second part all
enumerators and survey supervisors took part in the training process. Training was followed by two days
of pretesting in the field. For this purpose, two different locations were selected. The survey instruments
were finalized after incorporating the feedback from the training session and pretest exercise.
The survey was conducted by nineteen teams, each comprising two males, two females and a
supervisor. Monitoring of the whole survey process was conducted by a team of monitors. A survey
coordinator controlled all the field operations.
Roles and responsibilities
Supervisors were responsible for administering the survey in the districts assigned to them. This included
preparing listing and maps of the selected mouza, selecting samples from the lists, and ensuring quality
data were collected by enumerators of their team. Monitors were responsible for checking the functioning
of teams assigned to them. This included surprise visits during the survey, spot checking of enumerators,
and information validation. The survey coordinator was responsible for coordinating with teams, monitors
and giving feedback to the researchers. His additional duties were to generate daily progress reports on
the survey and to receive the incoming questionnaires from the field.
2.3.1 Data editing and entry
At the office level a team of questionnaire editors was responsible for receiving questionnaires, checking
for any inconsistencies and errors and providing codes to the open ended questions. In case of significant
errors, the team supervisor was asked to revisit the household to collect accurate information.
The database administrator was responsible for preparing a data entry program with proper checks. He
was also responsible for hiring and training the data entry operators and providing the data files in SPSS

12
format to the researcher. The survey was completed on April 25, 2012 and data entry was completed on
May 22, 2012. The data entry program was prepared in CSPro. A team of ten data entry operators were
trained to enter the data. The CSPro files were converted into SPSS and STATA. Frequency distributions,
summary statistics (means, variances, standard deviations), and graphs were used to identify the outliers
in the data which were checked with the original questionnaires and discussed with enumerators.

13
3. DESCRIPTION OF COMMUNITIES
3.1 Basic Features of Selected Mouzas
As indicated earlier, the sample of the survey “Rural Household Panel Survey (RHPS)” was drawn from
76 revenue villages (mouzas) of 19 districts located in three provinces of Pakistan (Punjab, Sindh, and
KPK). Of the total villages, 48 were from Punjab, 20 from Sindh, and 8 from KPK.7 The village level
information was collected through a community questionnaire. The respondents were the village key
informants, such as, the village head, local government officials, the principal of a school etc. The main
purpose of this questionnaire was to examine the institutional network and to understand the level of
development of the village by collecting information on the availability and accessibility of the households
to basic services and facilities, presence of institutions, such as, school, health centers, banks, post
offices, etc. This questionnaire was designed to collect village level information that is common across
households; for instance, the location of the village, its distance to the main market, agricultural input
shop, cotton ginning factory, schools, hospitals, credit services, post offices, etc.
In each village, a focus group discussion with three key informants8 was conducted to collect this
information. One common answer to each question was recorded by the enumerators. This section
presents the analysis of 76 community questionnaires.
3.2 Basic Characteristics of the Respondents (Key Informants)
The average age of the respondents was 45 years. The mean years of education were 11. Most of the
respondents were educated. The proportion of never enrolled respondents was low (12.3 percent).
Among the educated, a majority (59 percent) had education up to 10 years. The highest proportion of
respondents was those who had completed 10 years of education (21 percent). Nearly 8 percent of the
respondents had a Master’s degree or professional qualifications (degrees). Most of the respondents
were influential farmers. However, 10 percent were businessman, 20 percent were government officials, 5
percent were local councilors and 4 percent were school/college teachers or mosque imams. The mean
years of holding these positions were 19 years. The main source of income of these respondents was
crop profit, monthly salary, or business profit. The average period of residing in their respective villages
was 42 years.
3.3 Type of Households
The key informants were asked to provide information on the type of households in their villages
according to land holdings. It has been found that nearly 60 percent households did not own land. Among
the owners, only 19 percent of the households owned more than 5 acres. Provincial breakdown indicates
a larger incidence of landlessness in Sindh (67 percent), followed by Punjab (58 percent) and KPK (50
percent) (see Table 3.1).
7 Appendix 1 provides the list of villages by province, district, and agro-climatic zones.
8 The key informants are the persons who know the community well. They have knowledge about the people,
services, and important events that have taken place in a community. A school teacher, police officer, mosque leader, or large influential landowners are considered key informants in Pakistan’s rural setting.

14
Table 3.1: Percentage Distribution of Household by Agricultural Land Ownership (%)
Landless Up to 1 acre 1 to 2 acres 2 to 5 acre
More than 5 acres
Punjab 58.3 12.8 11.9 9.3 7.8
Sindh 67.3 8.7 8.5 7.2 8.3
KPK 49.9 25.3 10.0 8.5 6.4
Overall 59.7 13.0 10.8 8.7 7.8 Source: Authors’ calculation based on IFPRI/IDS (2012).
3.4 Physical Infrastructure of Villages
In 2012, the average population of these villages was 2,068 individuals, comprising of 274 households.
Population has grown at an annual rate of 4.6 percent in these villages during last five years. Highest
growth occurred in the villages of KPK and lowest in Punjab during this period.
3.4.1 Structure of internal and external roads
The structure of internal roads in most of the villages was mud. This pattern holds across provinces.
Other common structures were soling in Punjab, asphalt in KPK and concrete and asphalt in Sindh (see
Table 3.2). The structure of most of the external roads in the villages of Punjab and Sindh was asphalt,
whereas gravel roads were common in KPK. Some external roads in Sindh were mud and in KPK were
mud and concrete. A majority of the selected villages were connected with nearest city through a main
road.
Table 3.2: Structure of Internal and External Roads by Province (percent of villages)
Structure of internal roads Structure of external roads
Punjab Sindh KPK Overall Punjab Sindh KPK Overall
Mud 52.2 75.0 50.0 57.1 16.7 30.0 12.5 19.7
Asphalt 2.2 12.5 25.0 7.1 70.8 55.0 25.0 61.8
Concrete 8.7 12.5 12.5 10.0 10.4 10.0 25.0 11.8
Gravel 2.2 - - 1.4 0.0 5.0 37.5 5.3
Soling/brick 34.8 - 12.5 24.3 2.1 0.0 0.0 1.3
All roads 100.0 100.0 100.0 100.0 100.0 100.0 100.0 100.0 Source: Authors’ calculation based on IFPRI/IDS (2012).
3.4.2 Common mode of transport
Motorcycle, three-wheeler, four wheeler (e.g., suzuki van), and bus were found to be the most common
modes of transport to go to the nearest city. Motorcycle, three-wheeler, and bus were common in Punjab
whereas four wheeler, such as suzuki vans were commonly used in KPK. Mechanical transport has
become more popular in recent years. The use of bullock cart was not found as a mean of transport in
2012 whereas 5 villages (2 in Punjab and 3 in Sindh) reported bullock cart a mode of transport to go to
the nearest city in 2007. Motorcycle appeared to be the most common mode of transport in recent years
(see Table 3.3).

15
Table 3.3: Common Mode of Transport Within and Outside the Village (percent of villages)
Mode of transport to go to nearest city in 2007
Mode of transport to go to nearest city in 2012
Punjab Sindh KPK Overall Punjab Sindh KPK Overall
Foot 6.3 20.0 0.0 9.2 6.3 15.0 12.5 9.2
Bullock Cart 4.2 15.0 0.0 6.6 Bicycle 18.8 5.0 0.0 13.2 2.1 0.0 0.0 1.3
Three Wheeler 25.0 10.0 12.5 19.7 29.2 15.0 12.5 23.7 Four Wheeler 16.7 25.0 87.5 26.3 14.6 20.0 75.0 22.4
Bus 18.8 15.0 0.0 15.8 16.7 20.0 0.0 15.8
Motor Cycle 10.4 10.0 0.0 9.2 31.3 30.0 0.0 27.6
All modes 100.0 100.0 100.0 100.0 100.0 100.0 100.0 100.0 Source: Authors’ calculation based on IFPRI/IDS (2012).
3.5 Access to Services
3.5.1 Access to health services
Out of 76 villages, basic health units (BHU) were available in only 11 percent of the villages, rural health
clinics (RHC) in 9 percent villages, and clinics or dispensaries in 29 percent villages. Hospitals were found
in only one percent of the selected villages. However, nearly half of the villages had the services of a mid-
wife and lady health worker (LHW). Hakeems and quack doctors were available in nearly half of the
villages (see Figure 3.1).
Figure 3.1: Proportion of Villages Reporting the Presence of a Health Facility
Source: Authors’ calculation based on IFPRI/IDS (2012).
Although, some formal health facilities, such as, Basic Health Units, Rural Health Centers, and Hospitals
were available in very few villages, most of these services are available within a radius of 10 kilometers
11 9
29
55
1
46 43
0
10
20
30
40
50
60
Bas
ic H
ealt
h U
nit
Ru
ral H
ealt
hC
en
ter
Clin
ic/D
isp
ensa
ry
Mid
wif
e s
erv
ice
(pri
vate
)
Ho
spit
al
Lad
y h
eal
thvi
sito
r/su
per
viso
r
Hak
eem
/qu
ack
do
cto
r
% v
illag
es

16
from these villages. Average distance to health facilities is relatively larger in KPK as compared to Punjab
and Sindh (see Table 3.4)
Table 3.4: Average Distance (in kilometer) to Health Facilities Outside Village by Province
Punjab Sindh KPK Overall
Mean SD Mean SD Mean SD Mean SD
Basic Health Unit 7.0 5.7 7.8 5.3 8.4 7.4 7.4 5.7
Rural Health Center 9.5 6.6 11.6 7.3 12.3 13.0 10.3 7.7
Clinic/Dispensary 6.5 4.7 7.1 4.6 9.2 9.0 6.9 5.1
Midwife service (private) 5.9 4.7 9.2 8.9 14.3 7.1 8.1 7.2
Hospital 13.3 12.2 14.6 8.7 16.6 7.1 13.9 10.9 Lady health visitor/supervisor 6.5 4.2 8.2 6.2 4.5 2.1 7.1 5.0
Hakeem/quack doctor 4.7 3.1 9.6 11.0 11.0 8.4 7.5 8.2 Source: Authors’ calculation based on IFPRI/IDS (2012).
3.5.2 Access to credit services
The key informants were asked about the presence of credit services, such as Zarai Taraqiyati Bank
(ZTBL),9 commercial bank, cooperative bank, NGO credit, input suppliers, large landlords, money
lenders, factory, and/or commission agents. The data show that common sources of credit within villages
were landlords, shopkeepers and commission agents (see Figure 3.2).
Figure 3.2: Proportion of Villages Reporting the Presence of a Credit Facility
Source: Authors’ calculation based on IFPRI/IDS (2012).
The average distance to most of the credit services located outside village was 15 kilometers. A majority
of input suppliers and money lenders were located within an average distance of ten kilometers from
these villages. However, formal institutions, such as, ZTBL, commercial banks, cooperatives, NGOs, are
9 This is the Agricultural Development Bank of Pakistan
4 5 5 8 8
46
5
55
5
18
0
10
20
30
40
50
60
ZTB
L
Co
mm
erci
al b
ank
Co
op
era
tive
s
NG
O
Inp
ut
Sup
plie
rs
Lan
dlo
rd
Mo
ney
Le
nd
er
Sho
pke
ep
er
Fact
ory
/Mill
Co
mm
issi
on
Age
nt
% v
illag
es

17
more than 15 kilometers away from these villages. These distances are relatively larger in KPK as
compared to Punjab and Sindh (see Table 3.5).
Table 3.5: Average Distance (in kilometer) to Credit Facilities Outside Village by Province
Punjab Sindh KPK Overall
Mean SD Mean SD Mean SD Mean SD
ZTBL 18.6 9.5 16.5 7.7 19.6 10.6 18.2 9.1
Commercial bank 15.0 11.9 15.3 7.4 11.1 8.4 14.7 10.5
Cooperatives (registered) 17.3 12.6 16.1 7.9 27.4 22.3 18.3 13.4
NGO 25.2 19.6 15.3 7.4 26.9 21.2 22.4 17.5
Input Suppliers 14.3 12.7 12.8 8.8 9.4 7.9 13.4 11.4
Large landlord 14.8 12.1 9.9 5.7 25.4 25.4 15.7 14.8
Money Lender 11.7 8.5 10.5 5.6 25.1 22.6 12.9 11.1
Shopkeeper 9.9 10.8 11.2 6.7 11.3 9.0 10.5 9.0
Factory/Mill 18.5 13.6 13.9 8.0 31.1 26.4 18.9 15.4
Commission Agent /Beopari 12.0 8.1 12.7 8.9 15.3 9.3 12.6 8.4 Source: Authors’ calculation based on IFPRI/IDS (2012).
3.5.3 Access to facilities
The availability of basic services and amenities indicates the level of development in a community. The
key informants were asked about the presence of basic facilities in their communities. The data reported
in Table 3.6 indicate that the mobile phone service was available in almost all the selected 76 villages.
Nearly 93 percent of the villages were electrified. However, very few villages had access to natural gas.
About 60 percent of the villages used cylinder gas. This proportion is 87 percent in KPK and 25 percent in
Sindh. Immunization services were available in most of the villages. Very few villages had a sewerage
system. Garbage collection system was available in only one village. Less than half of the villages had a
health awareness program.
Table 3.6: Availability of Public Services in Selected Villages (percent villages)
Punjab Sindh KPK Overall
Village electrified 95.8 85.0 100.0 93.4
Availability to cylinder gas in village 68.8 25.0 87.5 59.2
Availability to sui gas in village 10.4 10.0 12.5 10.5
Availability to fixed-line phone service in village 22.9 10.0 87.5 26.3
Availability of cellular phone service in village 100.0 100.0 100.0 100.0
Availability of sewerage channel for waste water 25.0 10.0 0.0 18.4
Availability of garbage collection system in village 2.1 0.0 0.0 1.3
Availability of any immunization program in village 95.8 63.2 25.0 80.0 Availability of any family planning awareness program in village 45.8 47.4 87.5 50.7
Availability of any health awareness program in village 35.4 57.9 50.0 42.7 Source: Authors’ calculation based on IFPRI/IDS (2012).

18
3.5.4 Distance to important locations
The distance from the village to important locations is crucial in determining the access to people of such
facilities and amenities that do not exist in the village. The selected villages were located at an average
distance of 22 kilometers from tehsil headquarters and 44 kilometers from the district headquarters (see
Table 3.7). The selected villages of Punjab were located at an average distance of 52 kilometers from the
district headquarters. This distance was 27 kilometers in Sindh and 37 kilometers in KPK. However, these
villages were not very far from the city. The average distance to nearest city was 13 kilometers. These
villages were at an average distance of less than 20 kilometers from commercial center, mandi (main
market), weekly market, and commercial bank. The railway station was far away from these villages.
These distances were considerably high in KPK (see Table 3.7).
Table 3.7: Distance (in kilometers) to Important Locations from Villages by Province
Punjab Sindh KPK Overall
Mean SD Mean SD Mean SD Mean SD
Distance to nearest city 13.6 8.8 11.7 7.2 12.4 7.0 13.0 8.2
Tehsil headquarter 21.9 11.1 18.6 8.5 31.9 20.0 22.3 12.2
District headquarter 51.8 26.8 27.1 13.8 36.5 17.2 44.4 25.5 Distance to nearest commercial center 17.1 13.5 17.1 21.4 11.8 7.0 16.5 15.4
Nearest Mandi 15.6 9.8 14.1 11.5 13.3 11.1 15.0 10.3
Nearest Weekly Market 17.2 15.6 16.5 13.8 13.9 8.4 16.7 14.5 Distance to nearest post office 6.2 6.5 11.6 8.3 8.9 7.5 8.1 7.5
Nearest Bank 12.6 9.5 14.6 7.7 12.5 7.5 13.1 8.8
Nearest railways station 21.3 14.7 29.9 25.0 68.5 76.2 28.5 32.3 Source: Authors’ calculation based on IFPRI/IDS (2012).
3.6 Non-farm Business Environment
The key informants were asked about the nonfarm business environment in their villages. Most of them
indicated an improvement in the business environment in their villages during the last five years. These
responses were found consistent across provinces (see Table 3.8)
Table 3.8: Change in Nonfarm Business Environment During Last Five Years (percent of respondents)
Punjab Sindh KPK Overall
Better/more/higher 44.4 41.7 85.7 48.4
Same 22.2 33.3 0.0 21.9
Worse/less/lower 33.3 25.0 14.3 29.7
Total 100.0 100.0 100.0 100.0 Source: Authors’ calculation based on IFPRI/IDS (2012).

19
In most of the villages there was no need for any permit or license to start a new business. However,
several constraints were identified. Nearly 80 percent of the villages identified access to good quality of
electricity as the major constraint for the growth of nonfarm business. Among other constraints lack of
access to formal credit, poor quality roads, corruption, tedious loan procedures, lack of access to market
and marker information, a dysfunctional legal system, and crimes were identified as major constraints
(see Figure 3.3).
Figure 3.3: Major Business Constraints (percent of villages)
Source: Authors’ calculation based on IFPRI/IDS (2012).
Ranking the constraints, the problem of electricity, access to formal credit, and corruption were identified
as the three most important constraints to the growth of nonfarm business in the selected villages.
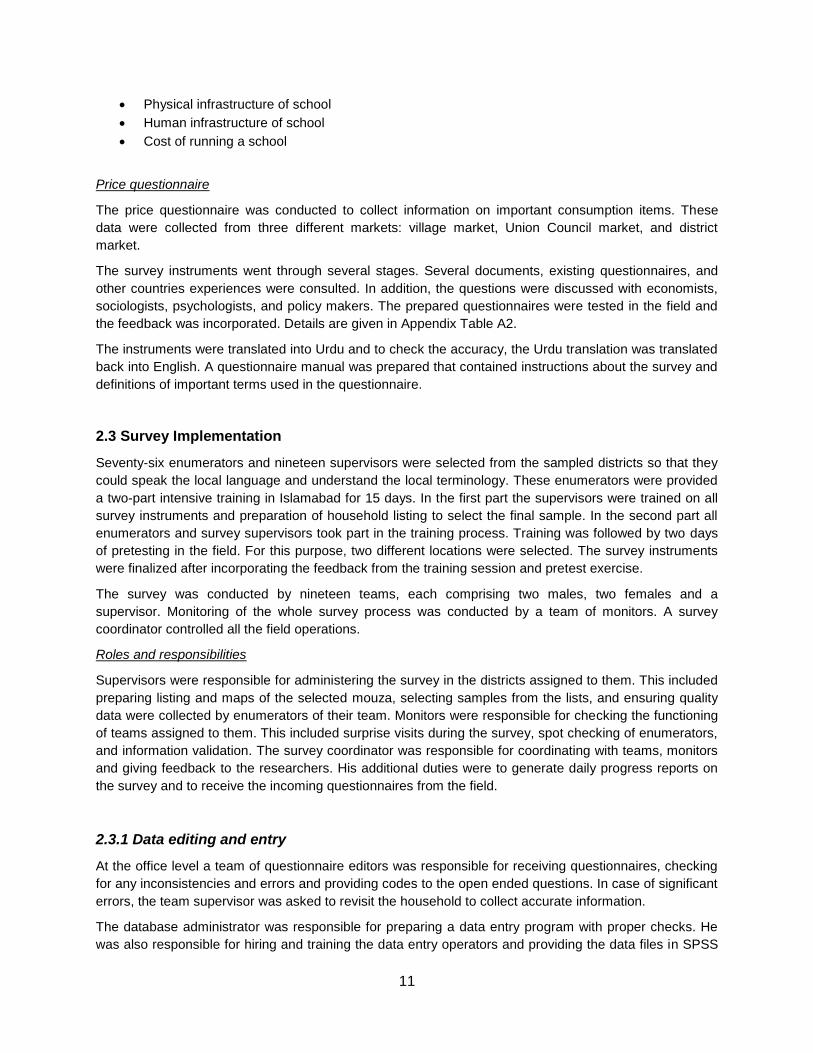
The information collected at the village level indicated a weak support for nonfarm business at tehsil level.
Key informants were asked if there was any chamber of commerce, or business association for all types
of businesses, or business association for one sector at tehsil level. None of the key informant in 11
villages knew about the presence of such associations at tehsil level. There was a tehsil level chamber of
commerce for 12 villages. About 20 villages had a tehsil level large business association and 26 villages
had a tehsil level sectoral level business association (see Figure 3.4). However, these associations were
not effective in providing market information, raw materials, or the quality of goods. Their role in
implementing government policies and plans was also not effective.
0.0 50.0 100.0
Inadequate access or poor quality of electricity
Lack of access to formal credit
Poor quality roads
Corruption
Loan procedure too tedious
Poor access to markets/market information
A dysfunctional legal system
Crime, theft and social disorder
20
Figure 3.4: Presence of Chamber of Commerce or Business Associations at Tehsil Level
(percent of villages)
Source: Authors’ calculation based on IFPRI/IDS (2012).
Many services to support businesses were available at tehsil level. Among them insurance, legal and
market services were available to more than 50 percent villages at tehsil level. Other services, such as
information technology, management consulting, accounting, and engineering services were also
available at tehsil level. Most of these services were located at a distance of one hour travel and
therefore, accessible by the villagers. However, most of the businesses in villages were so small that they
do not need such services.
3.7 Outside Linkages of Village
Nearly 75 percent of the villages in Punjab, 85 percent in Sindh, and 37 percent in KPK reported the
presence of a factory/mill within 20 kilometers. On average, nearly 5 factories/mills were located in the 20
kilometer radius of these villages. The nearest factory was located at an average distance of 15
kilometers from the village; 14 kilometers in Punjab, 13 in Sindh, and 26 in KPK. On average, about 13
persons per village worked in these factories; 15 in Punjab, 8 in Sindh, and 10 in KPK. The factories/mills
could attract more workers from villages if they are located within 5-20 kilometers radius.
3.8 Welfare Programs of Government or NGOs
Nearly 92 percent (70 out of 76) villages reported the presence of some welfare program (run by the
government or NGO). In Sindh and KPK, all the selected villages had at least one program. In Punjab 6
villages did not have any such program. Most of the villages had at least one program in Punjab and
KPK, while in Sindh, most of the villages had two programs. Of the 70 villages, 67 had BISP, 21 Watan
card, 17 NRSP, and 7 other programs (e.g., PRSP, SRSP, AKRSP, Khushal Pakistan, Edhi Foundation).
The coverage of BISP, NRSP, and other programs was higher in Punjab, whereas the watan card
program was wide spread in Sindh (see Table 3.9).
16
26
34
0
5
10
15
20
25
30
35
40
Chamber of commerce Business association for allbusinesses
Business association for onesector
% v
illag
es

21
Table 3.9: Presence of a Social Welfare Programs within Villages across Provinces (percent of villages)
Punjab Sindh KPK Overall
BISP 61.2 26.9 11.9 100.0 (67)
Watan Card 14.3 71.4 14.3 100.0 (21)
NRSP 82.4 5.9 11.8 100.0 (17)
Others 57.1 28.6 14.3 100.0 (7) Source: Authors’ calculation based on IFPRI/IDS (2012).
The key informants were asked to indicate the degree of importance of these programs in improving the
welfare of village population. According to their responses, nearly 52 percent expressed that the role of
BISP in improving the welfare of village population was ‘not very important/unimportant’. The role of
watan card and NRSP appeared important in improving the standard of living of rural people (see Table
3.10).
Table 3.10: Percentage Distribution of Villages by Program and their Degrees of Importance
Extremely important Important
Not very important Unimportant Overall
BISP 19.4 28.4 32.8 19.4 100.0
Watan Card 28.6 28.6 28.6 14.3 100.0
NRSP 41.2 17.6 29.4 11.8 100.0
Others 0.0 57.1 42.9 0.0 100.0 Source: Authors’ calculation based on IFPRI/IDS (2012).
3.9 Development Programs During Last Five Years
The key informants were asked about the presence of any development programs in their villages during
the last five years, such as, improvements in physical infrastructure, institutions, and basic amenities and
facilities. Out of 76 villages, nearly two-thirds of the villages had at least one such program during the last
five years. Most of these programs were related to improvements in school infrastructure or the
connection to cellular or fixed phone lines. The villages of KPK indicated improvements in the water
supply. About 23 percent of the villages in Sindh and 17 percent of the villages in Punjab indicated
improvement in road conditions. Most of these programs had a positive impact on the business
environment of the community (see Table 3.11).

22
Table 3.11: Percentage Distribution of Villages Reporting Development Programs in Past Five Years
Development programs for: Punjab Sindh KPK Overall
Improve road conditions (such as building a new road or improving road conditions) 16.9 23.1 5.0 16.9 Improve bridge conditions (such as build a new bridge or improve existing bridge conditions) 1.7 7.7 20.0 6.8 Improve market facilities (such as building a market or improving a markets conditions) 3.4 0.0 0.0 1.7 Improve school infrastructure(such as building a new school or improving old school facilities) 30.5 10.3 30.0 23.7 Improve water supply facilities (such as building a dam, connecting to water pipes, or other water infrastructure) 5.1 2.6 10.0 5.1 Improve health care facilities (such as building a clinic, hospital, or pharmacy, or expanding service availability ) 11.9 7.7 0.0 8.5 Improve electricity service (such as connecting to service or improving the connection) 5.1 7.7 0.0 5.1
Connection to fixed line telephone/cellular phone services 20.3 23.1 35.0 23.7
Improve irrigation facilities 3.4 5.1 0.0 3.4
Home construction for flood affected households 1.7 12.8 0.0 5.1
All programs 100.0 100.0 100.0 100.0 Source: Authors’ calculation based on IFPRI/IDS (2012).
3.10 Natural Disasters
The data indicate that less than half villages faced some kind of natural disaster during the last five years.
Among them crop failure was the most common disaster where nearly 46 percent of the villages faced
this disaster. About 43 percent of the villages experienced floods, 14 percent drought, 9 percent fire, and
5 percent experienced some epidemic. Among all these, floods, drought, and crop failure affected more
than three-fourths of the area of the village and had an adverse impact on the business activities of these
villages.
23
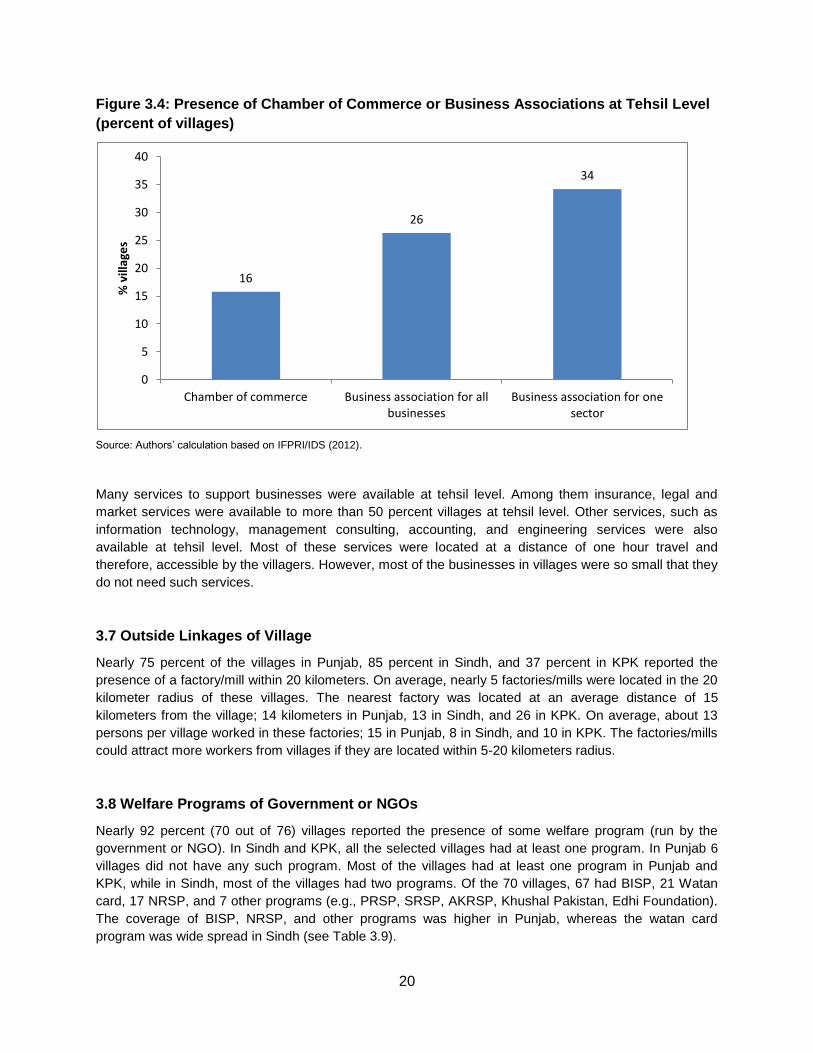
4. ANALYSIS OF SCHOOL SURVEY
The school survey was conducted in schools of surveyed communities. Eight communities had no school
at all. Enumerators identified 135 schools in the remaining 68 communities. Of these 87 percent were
surveyed. Of the remaining 18 schools that could not be surveyed, 6 percent were not functional, no
teacher was available in 6 percent schools, 1 percent schools were temporarily closed due to teachers
training during the survey period, and 1 percent schools could not be surveyed because of the refusal of
providing any information (see Figure 4.1).
Figure 4.1: Percentage Distribution of Schools Found
Source: Authors’ calculation based on IFPRI/IDS (2012).
Most of these schools (14 out of 18) were located in Sindh. Finally, 117 schools were surveyed in 62
mouzas. This indicates that nearly 1.9 schools per mouza were surveyed. In Punjab, 84 schools were
surveyed in 43 mouzas (2 schools per mouza), 13 schools were surveyed in 22 mouzas of Sindh (1.7
schools per mouza), and 6 schools in 11 mouzas of KPK (1.8 schools per mouza) were surveyed.
Urdu was the medium of instruction in a majority of schools. Very few schools in Punjab and KPK used
their regional languages as a medium of instruction. However, in Sindh, 18 out of 22 schools used Sindhi
as their medium of instruction. Of the total 117 schools, only 12 percent were private schools and they
were mostly located in Punjab. Nearly 68 percent schools did not charge any tuitions fee. Costs other
than tuition fee were not very high.
The data of schools revealed that out of 117 schools, 33 percent were girls’ schools, 23 percent boys’
schools, and 44 percent were co-education schools (see Table 4.1). The proportion of co-education
schools was much higher in Sindh. A large number of villages in Sindh had only one school. These
schools provided education to both boys and girls. It is interesting to note that the proportion of boys’
schools is less than that of girls’ in all provinces. This may be due to the fact that girls were allowed to go
to boys’ schools if no school for girls is available in the community. This explains why the number of co-
School found and interviewed
87%
No teacher available
6%
School non-functional
5%
School temporarily closed
1% Interview refused
1%

24
education schools was higher. In KPK, where Purdah is strictly observed, the proportion of co-education
schools was lower.
Table 4.1: Proportion of Schools by Type Across Provinces
Punjab Sindh KPK Overall
Only girls’ schools 35.7 13.6 45.5 32.5
Only boys’ schools 25.0 9.1 36.4 23.1
Co-education school 39.3 77.3 18.2 44.4
Total 100 100 100 100 Source: Authors’ calculation based on IFPRI/IDS (2012).
Most of the schools (65 percent) were of primary level (1-5 class). The proportion of middle (6-8 class)
and high (9-10) level schools were 26 percent and 9 percent respectively. The higher level schools had
classes of lower levels. For example, primary schools had kachi, pacci (pre-school) classes, middle
schools had primary classes, and high schools had the classes of middle and primary levels. In Sindh, 4.5
percent of the schools had only kachi and pacci classes. Villages in KPK did not have classes of higher
level available (see Figure 4.2).
Figure 4.2: Proportion of Schools with Highest Level of Education
Source: Authors’ calculation based on IFPRI/IDS (2012).
4.1 Physical Infrastructure of Schools
The data collected on the physical infrastructure of schools indicate that most of the schools had
boundary walls. Almost all schools used chalk-boards for teaching. However, the infrastructure that is
crucial for the quality of education was missing in these schools. For example, less than half of the
schools had a playground. Libraries were available in only 15 percent of the schools, and scientific
0% 20% 40% 60% 80% 100%
Punjab
Sindh
KPK
Full sample
Less than 1 class
1 to 5 class
6 to 8 class
9 to 10 class

25
laboratories were available in only 6 percent schools. Most of the schools had drinking water facility.
However, the common sources were hand or motor pumps. Toilet facility was also available in most of the
schools. However, in most of the co-education schools, separate toilets for girls and boys were not
available. For details see Table 4.2.
Table 4.2: Physical Infrastructure of Schools (percent of schools)
Punjab Sindh KPK Overall
Schools having boundary wall 84.5 50.0 100.0 79.5
Schools using chalk board 96.4 100.0 100.0 97.4
Schools having play ground 58.3 27.3 0.0 47.0
Schools having library 17.9 4.5 9.1 14.5
Schools having laboratory 7.1 4.5 0.0 6.0
Type of drinking water facility in schools
No facility 2.4 36.4 9.1 9.4
Piped water 9.5 4.5 36.4 11.1
Motor pump 54.8 9.1 36.4 44.4
Hand pump 33.3 45.5 18.2 34.2
Type of toilet facility in schools
No facility 9.5 31.8 0.0 12.8
Only for boys 32.1 13.6 45.5 29.9
Only for girls 23.8 9.1 36.4 22.2
Separate for girls and boys 13.1 9.1 0.0 11.1
Combined for girls and boys 21.4 36.4 18.2 23.9
Schools having electricity 79.8 40.9 72.7 71.8 Source: Authors’ calculation based on IFPRI/IDS (2012).
4.2 Student-Teacher Ratio
The data reveal that the average enrolment was 156 students per school; 39 at kachi-pacci level, 93 at
primary level, 83 at middle level, and 86 at higher level. The average number of teachers was 5 per
school. This gave a student-teacher ratio of 31 students per teacher (see Table 4.3). The data reveal that
girls’ enrolment was much lower than that of boys in all provinces, especially in Sindh and KPK. The
number of female teachers was extremely low in Sindh. This may be one of the reasons of the larger
number of co-education schools in this province. Despite low enrolment, few number of teachers resulted
in a higher student-teacher ratio in Sindh as compared to other two provinces.
Table 4.3: Enrolment, Number of Teachers, and Student-Teacher Ratio by Province
Enrolmenta
Teachersa
Student-teacher ratio
Boys Girls Both Male Female Both Boys Girls Both
Punjab 107.3 66.4 173.7 2.9 2.9 5.8 37.6 22.6 30.0
Sindh 59.5 29.4 88.9 2.1 0.3 2.4 28.5 92.3 36.9
KPK 104.5 50.5 154.9 2.9 2.2 5.1 35.9 23.1 30.4
Overall 98.0 57.9 155.9 2.7 2.4 5.1 36.1 24.4 30.6 Source: Authors’ calculation based on IFPRI/IDS (2012). a Average per school

26
Looking across educational levels, Table 4.4 shows that the student-teacher ratio is higher at lower level
of classes. This may be due to higher enrolment and few teachers at lower level. The data reveal that
girls’ enrolment was much lower than that of boys at each level. It is encouraging that the number of
students at higher levels is comparable with those in primary level. However, it is important to note that
these data are from Punjab and Sindh. None of the villages in KPK had higher level classes.
Table 4.4: Enrolment, number of teachers, and student-teacher ratio by level of education
Enrolment
a Number of teachers
a Student teacher ratio
Levels of education Boys Girls Both Male Female Both Boys Girls Both
Kachi-pacci 23.8 15.0 38.9 0.5 0.5 1.0 49.1 29.8 39.3
1 to 5 class 57.4 35.5 92.8 1.4 1.2 2.7 39.6 29.3 34.9
6 to 8 class 55.9 26.7 82.5 2.2 2.0 4.2 25.4 13.7 19.9 9 to 10 class 58.9 32.7 91.6 2.4 1.8 4.2 24.1 18.4 21.7
Total 98.0 58.2 156.3 2.7 2.4 5.1 36.1 24.5 30.7 Source: Authors’ calculation based on IFPRI/IDS (2012). a Average per school
The average years of education was 12 for both male and female teachers. Most of the teachers had an
experience of 7 years. Nearly one-fourth of the classes were held in open air. Very few girl students
received any kind of scholarship or financial assistance.

27
5. ANALYSIS OF PRICE SURVEY
5.1 A Comparison of Prices at Different Market Levels
As mentioned earlier, the price questionnaire collected data on the prices of important food items and
frequently used non-food items from three different markets; district, UC, and the village. In addition, the
Government of Pakistan collects and publishes monthly data on various food and non-food items. Table
5.1 presents a comparison of these prices for the month of survey (April 2012) at district, UC and village
level. This table shows significant price differentials across markets within a province. Prices of wheat
flour, rice, milk, and milk products were significantly higher in district markets (or urban markets) than the
UC and mouza markets (rural markets). No significant difference in the prices of pulses, fruits and
vegetables, meat and poultry, edible oil and ghee, and sugar was observed. This table also shows
significant provincial differences in the prices of food items. For example, price of milk was lowest in
Punjab as compared to Sindh and KPK in all markets.

28
Table 5.1: Prices of Selected Food Items at District, UC, and Mouza levels in Punjab, Sindh, and KPK (Rs/Kg)
Food items Prices in Punjab (Rs/Kg) Prices in Sindh (Rs/Kg) Prices in KPK (Rs/Kg)
District market
UC market
Mouza market F-test
District market
UC market
Mouza market F-test
District market
UC market
Mouza market F-test
Cereals
Wheat 26.6 26.4 26.0 0.61 27.8 27.5 26.4 1.13 23.0 23.0 23.7 0.294
Wheat flour 32.2 31.0 30.8 4.23* 32.2 32.1 31.2 1.01 29.6 29.2 29.7 0.499
Rice 86.4 81.4 78.2 2.93* 79.4 63.2 61.3 7.93* 69.6 64.6 64.4 0.088
Pulses
Gram 113.2 110.6 110.3 0.16 110.3 107.4 97.0 1.28 119.4 120.0 123.1 0.064
Moong 125.8 127.7 130.3 0.49 138.4 135.5 138.6 0.09 110.6 111.9 115.0 0.982
Masoor 112.8 117.8 121.8 2.09* 123.8 125.3 104.4 1.72*** 87.5 85.8 86.7 0.074
Milk and Milk Products
Milk 56.1 49.8 45.7 22.84* 59.3 58.0 55.9 0.361 64.4 64.4 62.3 0.125
Yogurt 65.2 62.7 59.9 3.99* 71.2 71.8 67.5 0.534 64.0 62.0 62.0 0.286
Oil and Ghee
Banaspati ghee 180.6 181.8 182.3 0.20 174.4 170.6 167.9 1.238 170.6 172.1 172.1 0.022
Cooking oil 182.7 186.9 187.5 1.03 182.9 181.7 174.1 1.048 166.8 169.8 172.2 0.295
Meat and Poultry
Beef 234.7 235.2 234.5 0.01 232.2 242.3 218.6 1.453 302.0 302.0 230.0 1.455
Mutton 458.1 462.8 445.5 0.86 393.7 394.6 458.3 2.689 428.0 417.5 380.0 2.147
Chicken 226.5 230.2 233.0 0.49 228.2 233.8 238.9 0.537 161.7 167.5 169.2 0.034
Vegetables and Fruits
Potatoes 19.6 20.9 20.4 0.33 18.9 19.6 20.0 0.505 21.7 22.4 23.6 0.705
Onion 30.8 32.8 32.5 0.98 24.6 24.6 26.4 0.309 30.0 31.0 32.1 0.078
Banana 48.3 51.3 51.9 0.59 38.4 40.4 41.0 0.026 43.5 47.6 50.0 2.130
Sweeteners
Sugar 56.6 57.2 58.0 1.01 62.0 60.4 59.6 0.790 55.1 55.9 58.6 11.051
Source: Authors’ calculation based on IFPRI/IDS (2012).
Notes: *, **, *** denote statistical significance at the one percent, five percent and ten percent levels, respectively.

31
References
Dorosh, Paul A. and Sohail J. Malik. 2006. Transitions Out of Poverty: Drivers of Real Income Growth for
the Poor in Rural Pakistan. Paper presented at the International Association of Agricultural
Economists Conference, Gold Coast, Australia, August 12-18, 2006
Government of Pakistan. 2011. Pakistan Social And Living Standards Measurement Survey (PSLM)
2010-11 Provincial/District. Pakistan Bureau of Statistics, Statistics Division, Government of
Pakistan. Islamabad, http://www.pbs.gov.pk/content/pakistan-social-and-living-standards-
measurement-survey-pslm-2010-11-provincial-district-0
Government of Pakistan. 2011. Household Integrated Economic Survey 2010-11. Pakistan Bureau of
Statistics, Statistics Division, Government of Pakistan. Islamabad.
Government of Pakistan. 2012. Pakistan Economic Survey, 2011-12. Economic Advisor’s Wing, Ministry
of Finance, Government of Pakistan, Islamabad.
Islam, Yassir, and James L. Garrett. 1997. IFPRI and the Abolition of the Wheat Flour Ration Shops in
Pakistan: A Case-Study on Policymaking and the Use and Impact of Research. Impact
Assessment Discussion Paper No. 1. International Food Policy Research Institute, Washington,
DC.
Malik, Sohail J. 2005. Agricultural Growth and Rural Poverty: A Review of the Evidence. Pakistan
Resident Mission. Working Paper Series. Working Paper No. 2. Islamabad: Asian Development
Bank.
IFPRI/IDS (International Food Policy Research Institute/Innovative Development Strategies. Pvt. Ltd.).
2012. Pakistan Rural Household Panel Survey 2012. Pakistan Strategy Support Program (PSSP)
of IFPRI Washington, DC, and IDS Islamabad,
UNDP. 2011. Sustainability and Equity: A Better Future for All. Human Development Report 2011. New
York. http://hdr.undp.org/en/reports/global/hdr2011/download/

32
Appendix 1 Selected Sample
Table A.1: Selected sample of Rural Household Panel Survey
Province Districts Mouzas
Punjab Attock SHERANI
URTAKPUR (KAMRA)
KALU KHURD
QUTBAL
Sargodha HARYANA
SALEEM ABAD
BUNGA SIGHWAL
CHAK NO 118/S.B
Faisalabad CHAK 077/RB LOHKA KALAN
CHAK 223/GB BHOJAIN
CHAK 530/GB NARANGWAL
CHAK 496/GB PANJLASA
Jhang CHAK SARKAR BAHI WAL
WIJHI
CHAK NO.007/2 THAL JANUBI
UMRANA SHUMALI
Kasur GARA SINGH WALA
BHUNE KI HITHAR
DHAN [DHON]
CHAK NO 027(DHOLAN GANGA )
Multan BOHAR
CHAK NO 075/M
KEKERY
CHAK NO 001/GULZAR
Khanewal CHAK NO 020/V
CHAK NO 137/16-L
CHAK NO 004/8-R
CHAK NO 053/10-R
Vehari SHAH PUR SANI
CHIADHAR BHINDAH
CHAK NO 172/E.B.
CHAK NO 471/E.B.
Rahim Yar Khan CHAK NO 018/ABS
FAZIL PUR
AMIR PUR
CHAK NO 029/P.
Bahawalnagar CHAK NO 181/7-R
NOOR JAHANIAN

33
CHAK NO 122/MURAD
MASSA SINGH KOHNA
D.G.Khan CHAK JALUHAR
HAN THAL
CHIT SARKANI
JAN PUR
Bhakkar CHAK NO 053/T.D.A.
CHAK NO 064/T.D.A.
DAGGAR SHADA NO.2
BARANGA N0 3
Sindh Hyderabad NARKI
CHARO
SAEED PUR
KACHO KHANOTH
Sanghar ONATHADA
SAMATHRI
BOCHNA
LAKHA
Dadu KHUDABAD JAGIR
ANDHEJI-KASI
SHORI JAGIR
GHARO
Thatta SHAIKH HAJI TURABI
UHEB
TALLI
CHARBATTI
jaccobabad DASTI
PHATANWAH
SORAH
HAZARO
KPK Nowsehra CHAK AGRA
RAKH SARKAR
KALANJAR
TOHA GHARIB PURA
Mansehra RATTIAN
HUSSANIAN
LACHI MANG
HASSARI
Source: IFPRI/IDS (2012).

34
Table A.2: Locations of pilot test and pre-test of the survey instrument (Round 1)
Total Fields District Tehsil UC Mouza Village Date
Pilot Test 1 Attock Jand Not
Available Not Available
Not Available
01/04/2012
Pilot Test 2 Faisalabad Sumandari 108 479 GB 473 GB 27/1/2012
Pre-Test 1 Islamabad Islamabad Sehala Chak Kamdar Chak
Kamdar 03/01/2012
Pre-Test 2 Attock Hassanabdal Pind Mehri Sultanpur Hanifabad 03/04/2012
Source: IFPRI/IDS (2012).
Table A.3: Activity-wise survey schedule is given below:
Activity Start date End date
Training February 26, 2012 March 8, 2012
Enumeration March 15, 2012 April 25, 2012
Editing April 15, 2012 May 20, 2012
Data entry April 29, 2012 May 22, 2012
Data cleaning May 28, 2012 July 27, 2012
Source: IFPRI/IDS (2012).

35
Appendix 2: Concepts and Definitions
A brief explanation of the key concepts and definitions used in the report are as follows.
Beopari is a commission agent .
District is the third order of administrative division, below provinces and divisions. There are 114 districts in Pakistan.
Formal source of Credit are those sources that provide credit in a transparent and regulated manner. Some formal sources of credit include commercial banks, ZTBL, Microfinance banks, etc.
Imam is the leader of a mosque.
Informal source of Credit are those sources that provide credit without any legal and regulated procedures. Some informal sources of credit include landlords, input dealers, money lenders, friends/relatives/neighbor, etc.
Mouza or Deh is a demarcated territorial unit for which separate revenue record including a cadastral
map is maintained by the provincial revenue departments. One Mouza / Deh may contain one or more
population settlements or may have no settlement.
Multidimensional Poverty is a denial of choices and opportunities, a violation of human dignity. It means
lack of basic capacity to participate effectively in society. It means not having enough to feed and clothe a
family, not having a school or clinic to go, not having the land on which to grow one’s food or a job to earn
one’s living, not having access to credit. It means insecurity, powerlessness and exclusion of individuals,
households and communities. It means susceptibility to violence, and it often implies living in marginal or
fragile environments, without access to clean water or sanitation.
Non-agricultural Enterprises are those in which main proprietor of the business is a household member. Such as cobbler, tailor, handicrafts etc.
Probability Proportionate to Size is a sampling technique for use with surveys or mini-surveys in which the probability of selecting a sampling unit (e.g., village, zone, district, and health center) is proportional to the size of its population.
Province is a principal administrative unit of Pakistan. Pakistan have four provinces (Punjab, Sindh, Khyber Pakhtunkhwa, Balochistan) and two territories (Federally Administered Tribal Areas, and Islamabad Capital Territory).
Reconnaissance Survey represents a type of field survey that is often used to gather initial information regarding the presence or absence of historic properties within a project area.
Small Farmers include farmers who cultivate land up to 12.5 acres but more than 5 acres.
Student-Teacher Ratio is the number of students who attend a school or university divided by the number of teachers in the institution.
Tehsil is the fifth administrative unit of Pakistan and third lowest tier of local government. The term tehsil is generally used except in Sindh where the term “Taluka” predominates. As an entity of local government, it exercises certain fiscal and administrative power over the villages and municipalities within its jurisdiction. It is the ultimate executive agency for land records and related administrative matters. Its chief official is called the tehsildar or less officially the talukdar.
Union Council is the sixth administrative unit of government and fourth tier of local government. Union councils were responsible for local agricultural and community development and for rural law and order maintenance; they were empowered to impose local taxes for local projects.


![Household Consumer Expenditure in Karnataka, 2007-08 64th round... · DES NO. 4 OF 2012 Household Consumer Expenditure in Karnataka, 2007-08 [State Sample] NSS 64th Round(July 2007](https://img.pdfslide.net/doc/110x75/604175ec0353aa418d6f5b19/household-consumer-expenditure-in-karnataka-2007-08-64th-round-des-no-4-of.jpg)