Embed Size (px)
Citation preview

Palaeogeography, Palaeoclimatology, Palaeoecology 337–338 (2012) 14–22
Contents lists available at SciVerse ScienceDirect
Palaeogeography, Palaeoclimatology, Palaeoecology
j ourna l homepage: www.e lsev ie r .com/ locate /pa laeo
Carbon- and sulfur-isotope geochemistry of the Hirnantian (Late Ordovician)Wangjiawan (Riverside) section, South China: Global correlation andenvironmental event interpretation
Paul Gorjan a,⁎, Kunio Kaiho b, David A. Fike a, Chen Xu c
a Department of Earth and Planetary Sciences, Washington University in St Louis, Campus Box 1169, 1 Brookings Drive, St Louis, Missouri 63130, USAb Graduate School of Science, Tohoku University, Aoba-ku, Sendai 980-8578, Japanc State Key Laboratory of Palaeontology and Stratigraphy, Nanjing, Institute of Geology and Palaeontology, Chinese Academy of Sciences, 39 East Beijing Road, 210008 Nanjing, PR China
⁎ Corresponding author. Tel.: +1 314 935 9088.E-mail address: [email protected] (P. Gorjan
0031-0182/$ – see front matter © 2012 Elsevier B.V. Alldoi:10.1016/j.palaeo.2012.03.021
a b s t r a c t
a r t i c l e i n f oArticle history:Received 24 May 2011Received in revised form 8 March 2012Accepted 13 March 2012Available online 19 March 2012
Keywords:HirnantianStratigraphyWangjiawanGlaciationCarbon isotopesSulfur isotopes
Detailed geochemical analyses (δ13Ccarb, δ13Corg, δ34Ssulfide, and abundance of sulfide, carbonate and organiccarbon) were performed on samples from theWangjiawan (Riverside) section, close to the GSSP (Global Strato-type Section and Point) for the Hirnantian stage of the Ordovician. New data show two increases in carbonatecontent coincident with two glacial pulses that reduced detrital input. The new δ34Ssulfide data show distinctchanges in this section, with relatively high values in the Kuanyinchiao Formation, a pattern observed through-out the Yangtze Platform. However, there is no consensus on the cause of these changes. The new δ13Ccarb datashow a sharp rise and peak in the extraordinarius zone, below the previously published δ13Corg peak in thepersculptus zone. A compilation of the new results with other sections indicates the Hirnantian carbon-isotopeexcursion starts near the pacificus–extraordinarius boundary and elevated values remain until the end of theexcursion in the persculptus zone for both δ13Corg and δ13Ccarb. The controversy over correlating Hirnantiangraptolite zones with chitinozoan zones can also be addressed. The new δ13Ccarb data also allow direct compar-ison with Hirnantian δ13Ccarb data from Anticosti Island and the Baltic region, which are zoned by chitinozoanfossils. This comparison favors a correlation of the taugourdeaui and scabra chitinozoan zones with the extraordi-narius graptolite zone.
© 2012 Elsevier B.V. All rights reserved.
1. Introduction
The Hirnantian stage of the Late Ordovician hosts a confluence ofseveral significant events, including a glaciation, sea level changes, asevere mass extinction, and a global positive carbon-isotope (δ13C)excursion (e.g., Finney et al., 1999; Melchin and Holmden, 2006; Fanet al., 2009; LaPorte et al., 2009; Young et al., 2010; Jones et al., 2011).The relationship between these events is only partially understoodand the initial cause of the glaciation and its relationship to the carboncycle perturbation remain unknown.
The Hirnantian glaciation was recognized from glacial sediments innorth Gondwana (Saharan Africa, South Africa and Arabia) (Deynouxand Trompette, 1981; Deynoux, 1985; Ghienne, 2003; Ghienne et al.,2007; Le Heron et al., 2007). Trotter et al. (2008) used temperature-dependent oxygen isotopes (δ18Oapatite) in Ordovician conodonts toshow a global temperature fall in the late Ordovician. This conclusionwas reinforced by clumped-isotope paleothermometry on Hirnantiancalcites (Finnegan et al., 2011) that shows cooling and rapid ice
).
rights reserved.
accumulation at this time — perhaps twice the ice volume as the LastGlacial Maximum. Detailed geochemical and sedimentological workhas identified more than one episode of glacial advance and retreat(Ghienne, 2003; Yan et al., 2010).
The Hirnantian extinction is recognized as the second most devas-tating extinction in the Phanerozoic, after the Permian–Triassic extinc-tion, with the elimination of about 86% of species (Sheehan, 2001;Bambach et al., 2004). Although a gradual decline in biodiversity is rec-ognized during the Katian (Kaljo et al., 2011), fine-scaled paleontologi-cal work demonstrates that the greatest loss was across the Katian–Hirnantian boundary (Brenchley et al., 1994; Sheehan, 2001; Ronget al., 2002; Chen et al., 2005a; Fan et al., 2009), thought to coincidewith the onset of a severe cooling (Finnegan et al., 2011). This coinci-dence has provided a solid case for linking the extinction withdecreased temperature and a drop in sea level, the latter, in turn, elim-inating vast epeiric sea habitats (Brenchley et al., 1994; Sheehan, 2001).Further graptolite and brachiopod extinctions also occur later in theHirnantian (Rong et al., 2002; Chen et al., 2005a; Fan et al., 2009).
The Hirnantian stage also records a sharp perturbation in the carboncycle, seen in the enrichment of 13C in both sedimentary carbonate andorganic matter. Some have attributed this to an increased burial oforganic matter (e.g., Brenchley et al., 2003). An alternative hypothesis

15P. Gorjan et al. / Palaeogeography, Palaeoclimatology, Palaeoecology 337–338 (2012) 14–22
is that a global regression exposed carbonate platforms that were thenpreferentially weathered, resulting in an increase in riverine δ13C(Kump et al., 1999; Melchin and Holmden, 2006). This would thendrive a corresponding increase in oceanic δ13C composition.
The uncertainty in correlating sections from different continents hashampered the study of the glaciation, the mass extinction, and thechanges in carbon cycling that mark the Hirnantian (Delabroye andVecoli, 2010). There is no one correlative fossil group (graptolites,chitinozoans, brachipods or conodonts) present in all sections world-wide. Graptolites are common in the shaly deposits of South China,where the GSSP at Wangjiawan (North) is established, but thecarbonate-dominated successions of Anticosti Island and Estonia aredominated by conodont and chitinozoan fossils (Soufiane and Achab,2000; Copper, 2001; Brenchley et al., 2003; Kaljo et al., 2008; Achabet al., 2011); graptolites from these areas are only tenuously related toChinese graptolites (Riva, 1988; Melchin, 2008; Young et al., 2010). Itis similarly challenging to correlate Gondwanan glacial sedimentswith tropical sections that often have the best fossil and isotope records.Thus, precisely comparing the timing of the glacial onset with other(biological and geochemical) events is difficult.
Furthermore, the use of carbon isotopes to correlate sections has notbeen straightforward (Chen et al., 2006; Delabroye and Vecoli, 2010).To date no Chinese section – including the GSSP section for the Hirnan-tian stage (Wangjiawan North) – has any published carbonate-carbonisotope (δ13Ccarb) data, which is the most commonly used chemostrati-graphic tool (e.g., Gradstein et al., 2004).
This study presents high-resolution (cm-scale) characterization ofcarbon- and sulfur-cycling, including isotopic (δ13Ccarb, δ13Corg, δ34Ssulfide)and abundance (sulfide, or %S, and total organic carbon, or TOC) data,across the Hirnantian interval of the Wangjiawan (Riverside) sectionin order to constrain changes in the local geochemistry aswell as linkingthese to global trends in δ13Ccarb, organic deposition (TOC), and theglaciation.
2. Geology, stratigraphy and the extinction boundary
Numerous studies have beenpublished on the Late Ordovician of theYangtze platform, including biostratigraphic (e.g., Chen et al., 2000;Vandenbroucke et al., 2005), paleogeographic (Zhang et al., 2000;Chen et al., 2004), chemostratigraphic (Chen et al., 2005b; Fan et al.,2009), as well as carbon and sulfur isotope-event studies (Yan et al.,2008, 2009; Zhang et al., 2009).
TheWangjiawan site was an outer shelf location on the South Chinacraton during the Ordovician–Silurian transition (Chen et al., 2004;Fig. 1A). The Wufeng, Kuanyinchiao and Lungamachi Formations spanthe uppermost Ordovician and Lower Silurian, in ascending order. The
submerged highs
105°E
Wangjiawan
25°
30°N
C A
Y
T HA
S I A
NL
A
NORTH CHINABLOCK
0
A
Fig. 1. (A) Paleogeographical map of the Hirnantian Yangtze Platform showing location of theWshowing location of Wangjiawan (Riverside) and Wangjiawan (North) sections adjacent to theWufeng and Lungamachi Formations, and its thickness exaggerated to make it easily seen. Sam(A) is after Chen et al., 2004, (B) is adapted from Chen et al., 2006.
Wufeng and Lungamachi Formations are comprised of dark shales andoccasional chert with abundant graptolite fossils (Chen et al., 2000;Chen et al., 2006). The Kuanyinchiao Formation is a thin (less than 50-cm thick) argillaceous limestone that contains abundant shelly fossils(Hirnantian fauna) (Chen et al., 2000). The Kuanyinchiao Formationmarks a drop in eustatic sea level (Fan et al., 2009) and the associatedHirnantian fauna are recognized as cool/cold water fauna (Rong et al.,2002). This is consistent with global cooling and sequestration ofwater into Gondwanan ice caps during the Hirnantian glacial episode.
The Wangjiawan (Riverside) section is found on the banks of theWangjiawan River by the southeastern end of Wangjiawan village,located about 42 km north of Yichang city. The Wangjiawan (North)section, located ~180 m northwest of the Riverside section, hosts theGlobal Stratotype Section and Point (GSSP) for the Hirnantian (LateOrdovician) (Fig. 1B). The Riverside section is less weathered than theNorth section and thus provides better material for geochemicalanalysis.
3. Methods
An almost continuous section of approximately 2.5 m of sedimen-tary rock was sampled across the Hirnantian interval at the Wangjia-wan (Riverside) section (Fig. 1B). Samples were chipped and pieceswithout weathering or veining were selected for powdering.
Sedimentary sulfide was extracted from 0.1 to 0.3 g of powderedsample for δ34Ssulfide analysis. The sulfide extraction procedure isbased on the method presented by Burton et al. (2008). The samplewas placed in a tube along with an inner vial of zinc acetate solution.The tube was sealed with a cap and the air removed under vacuum.Acidified 6 M chromium(II) chloride solution was then injected intothe tube through an opening. The mixture was shaken for 48 h. TheCr(II) ions reacted with any sulfide to form H2S, which then diffusedto the zinc acetate solution to form solid ZnS. The ZnS was then cen-trifuged, rinsed and dried. The sulfide content (%S) was determined byboiling some powdered sample in acidified Cr(II) solution and collec-tion of the evolved H2S as Ag2S in a silver nitrate solution. The driedAg2S was then weighed and the %S calculated (Canfield et al., 1986).
Total organic carbon (TOC) was determined by treating powderedsampleswith 6 MHCl to remove carbonate. The samplewas then rinsedto remove the acid. The mass difference between the original sampleand acid-treated residue was used to determine carbonate content.The dried sample was then combusted and the evolved CO2 analyzedon the mass spectrometer. During the mass spectrometric analysis thesample peak height was calibrated against organic carbon standardsto estimate the organic carbon content.
120°
Wan
gjia
wan
villa
ge
Wuf
eng
Fm
RIV
ER
SID
E
SE
CT
ION
Lung
amac
hi F
m
RoadSection
100 m
NorthB
N D
Black graptolitic shale
Silty shale
Detrital wedge
Algal-reef fac ies andlimestone
200
NORTHSECTION
km
Kuan-yinchiao
Fm
Wangjiawanvillage
angjiawan site and extent of the epeiric Yangtze Sea atWufeng Formation time. (B)MapWangjiawan village, Hubei, China. The Kuanyinchiao Formation is exposed between thepling was performed about a meter on either side of the Kuanyinchiao Formation.

16 P. Gorjan et al. / Palaeogeography, Palaeoclimatology, Palaeoecology 337–338 (2012) 14–22
Isotopic determinations for sulfide (δ34Ssulfide) were carried outusing a Costech ECS 4010 Elemental Analyzer coupled to a Thermo-Finnigan Delta V Plus mass spectrometer. Approximately 300 μg ofZnS was combusted in a tin cup at 1000 °C, and the evolved SO2 gas isthen sampled by the mass spectrometer. Sulfur-isotope compositions(δ34S) were calibrated against NBS-127, IAEA-S1, and IAEA-S3 and areexpressed as a permil (‰) deviation, relative to the V-CDT (Vienna Can-yon Diablo Troilite) scale. Reproducibility, based on replicate analyses isbetter than 0.4‰ (1σ).
Isotopic determinations for organic carbon (δ13Corg) were carriedout using the above elemental analyzer–mass spectrometer system.Approximately 300 μg of acidified sample was combusted at 1000 °C,and the evolved CO2 gas was then sampled by the elemental analyzer–mass spectrometer. Carbon-isotope compositions were calibrated againstIAEA-NBS-21 graphite, IAEA-C6 sucrose and in-house acetanilide stan-dards and are expressed as a permil (‰) deviation, relative to the V-PDB (Vienna PeeDee Belemnite) scale. Duplicate sampleswere reproduc-ible within 0.25‰ (1σ).
Carbonate carbon isotopes (δ13Ccarb) were carried out using aThermo-FinniganGas Bench II coupled to a Delta V Plusmass spectrom-eter. Approximately 150 μg of bulk-powdered sample was reacted for4 h at 72 °C with excess 100% phosphoric acid in a helium-flushed,sealed tube. The evolved CO2 was then sampled by the gas bench–mass spectrometer. Isotopic measurements were calibrated againstNBS-19, NBS-20, and two in-house standards, with analytical errors of0.2‰ (1σ) for δ13Ccarb and 0.4‰ (1σ) for δ18Ocarb and are expressed asa permil (‰) deviation relative to the V-PDB (Vienna Pee Dee Belem-nite) scale.
4. Results
The δ13Ccarb profile shows a positive excursion from about −4‰ to−1‰, beginning in the extraordinarius zone, with a sharp negativespike down to −8‰ in the Kuanyinchiao Formation. A return to pre-excursion values occurs in the persculptus zone of the Lungamachi Forma-tion. Carbonate content is less than 5% for the pacificus zone except in theuppermost 2 cm where it begins to rise, peaking at ~60% in the basalextraordinarius zone. Carbonate then declines to 10–30% until a secondpeak at ~85% in the Kuanyinchiao Formation (Hirnantian Fauna zone).Values drop abruptly to under 10% at the start of the LungamachiFormation.
The δ13Corg generated in this study is broadly consistent with previ-ously published δ13Corg data for the Wangjiawan (Riverside) section(Chen et al., 2005b; Fan et al., 2009). However, the new data show ahigher peak and steeper decline in the upper Kuanyinchiao Formation(Hirnantian Fauna zone), probably due to the greater sampling densityof this study. This sharp decline in δ13Corg within the Hirnantian Faunazone is also seen at the Wangjiawan (North) (Wang et al., 1997; Fanet al., 2009), Huanghuachang (Wang et al., 1997), Nanbazi (Yan et al.,2009), and Fenxiang (Wang et al., 1997) sections within China. In theLungamachi Formation some δ13Corg values vary by 1 to 1.5‰ from pre-viously published values (Fig. 2). The reason for this is uncertain.
Total organic carbon (TOC) is generally above 5% in theWufeng For-mation, but dips sharply in the Kuanyinchiao Formation and remainslow (b1%) until the Lungamachi Formation. Peak δ13Corg values occurin the low TOC interval. However, δ13Corg appears to move indepen-dently of TOC. Even the transitions from low to high (or high to low)TOC in the Wufeng and Lungamachi Formations (2–10%) do not affectthe δ13Corg signals.
The new δ34Ssulfide results produced a smooth profile between −20‰ and −10‰ in the pacificus and lower extraordinarius zones.The upper extraordinarius zone exhibits a large range of values, butthen the smooth profile resumes in the Kuanyinchiao Formation(Hirnantian Fauna zone), although values are about 20‰ heavier thanin the pacificus zone. In the overlying Lungamachi Formation valuesreturn to the pre-excursion baseline of around−20‰. These δ34Ssulfide
profiles are consistent with previously published results from theWangjiawan (North), Nanbazi (Yan et al., 2009) and Honghuayuan(Zhang et al., 2009) sections, all of which document an ~20‰enrichment in δ34Ssulfide. Further upsection into the Silurian (ascen-sus zone and above) δ34Ssulfide values are highly variable, between−30‰ and +22‰.
5. Discussion
5.1. Sulfur geochemistry
Sulfide in the sediment comes mainly in the form of pyrite. It is pro-duced by sulfate reducing bacteria, whichmetabolize sulfate (SO4
2−) tosulfide (S2−). The sulfide then reacts with any available iron in the sed-iment to form pyrite (FeS2), a stable mineral that is preserved in sedi-ments (Goldhaber and Kaplan, 1974). The metabolic activity of thesulfate reducing bacteria generally depletes (or fractionates) the result-ing sulfide in 34S, by up to 70‰ (Goldhaber and Kaplan, 1974; Canfield,2001; Sim et al., 2011a). The final isotopic composition of sulfide isdetermined by the isotopic composition of the source sulfate, and themagnitude of fractionation, which depends on various factors. Firstly,metabolic activity generally results in minimal fractionation undersulfate-limited conditions where most of the sulfate will be metabo-lized. Secondly, increasing the rate of bacterial sulfate reduction, byincreasing the amount and reactivity of organic matter (Berner, 1984),will reduce the amount of fractionation (Habicht and Canfield, 1997;Canfield, 2001; Habicht and Canfield, 2001; Sim et al., 2011b). Thirdly,increasing the presence of additional sulfur cycles (i.e., partial sulfideoxidation to elemental sulfur (S0) followed by disproportionation,forming sulfide and sulfate from S0), will increase the fractionation(Habicht and Canfield, 1997; Canfield, 2001; Habicht and Canfield,2001). Sedimentation rate has also been cited in affecting δ34Ssulfide(Goldhaber and Kaplan, 1974), although this is probably because ofthe way it affects the supply of organic matter (Berner, 1978) andsulfate (Chambers, 1982).
The new δ34Ssulfide data show values from−20‰ and−14‰ in thepacificus zone but form a very tight cluster around −10‰ across thepacificus–extraordinarius boundary and through much of the extraordi-narius zone, despite other major geochemical changes at this time, in-cluding sharp changes in sulfide content. The fact that δ34Ssulfide islittle changed would indicate that those factors most responsible forthe fractionation of sulfur isotopes (i.e., the sulfate δ34S and availability,reduction rate, and disproportionation) were surprisingly stable. Yanet al. (2008) suggested this boundary hosted a change from euxinic tooxic conditions from iron, carbon and sulfur studies from the Wangjia-wan (North) section. However, the constant δ34Ssulfide values suggestthis did not occur, as a change in sulfide source would generally bringa change in δ34Ssulfide. Alternatively, the redox change may haveoccurred 10–20 cm below the pacificus–extraordinarius boundary,where the δ34Ssulfide pattern changes slightly.
In the upper extraordinarius zone, just before the Kuanyinchiao For-mation, δ34Ssulfidefluctuates between about−20‰ and+15‰. There islittle change in TOC or carbonate deposition and redox indicators fromthe Wangjiawan (North) section (reactive iron and degree of pyritiza-tion; Fig. 2) suggest the water column was still oxygenated (Yan et al.,2008). Yan et al. (2010) determined a chemical alteration index(CAI) – a compilation of cation ratios that indicate weathering rates –that shows a coincident shift to greaterweathering, i.e., a less arid inter-glacial episode (Fig. 2). However, the cause of the δ34Ssulfide variability isuncertain. It could be due to changes in sulfate δ34S, sulfate availabilityor disproportionation as the relevant factors. Although distinguishingbetween these requires other data.
In the Kuanyinchiao Formation there is a δ34Ssulfide increase, withvalues consistently elevated, from about −6‰ to +4‰. TOC valuesplunge below 1%. Two hypotheses have been proposed to explain thisδ34Ssulfide excursion. Yan et al. (2009) interpret the heavier δ34Ssulfide

Fig. 2. New geochemical data covering the Hirnantian portion of the Wangjiawan (Riverside) section, South China. White δ13Ccarb data points may be influenced by organic matteroxidation (discussed in Section 5.2). Water column redox and weathering data from the Wangjiawan (North) section. Start of the carbon isotope excursion, taking into account bothcarbonate and organic carbon, is judged as the inflection point where values begin to form the ascending limb of the excursion.Formations and graptolite zonation from Chen et al. (2006). Published δ13Corg data (gray line) from Chen et al. (2006) and Fan et al. (2009). CAI (chemical alteration index) and associatedWangjiawan (North) graptolite boundaries from Yan et al. (2010). Reactive iron (dashed red line) and degree of pyritization (DOP; solid black line) from Yan et al. (2008). Kuanyin.=Kuanyinchiao; Hirnan.=Hirnantian; Rhudd.=Rhuddanian.
17P. Gorjan et al. / Palaeogeography, Palaeoclimatology, Palaeoecology 337–338 (2012) 14–22
values as a change from anoxic to oxic waters that forced the sulfate re-ducing bacteria further into the sediment, where sulfate can becomelimited because the supply of water, and therefore sulfate, from theoverlyingwater column is limited. However, Zhang et al. (2009) suggestthat the increase in δ34Ssulfide was caused by a proportional increase inseawater sulfate δ34S on the Yangtze Platform, the sulfate δ34S risebeing caused by the rapid burial of sulfide, and organic carbon, in localanoxic deep-water sub-basins, although such a situation has not yetbeen demonstrated in modern or ancient settings. It is also possiblethat bacterial reduction rate increased through the delivery of a morereactive type of organic matter, albeit less of it. Alternatively, it is possi-ble that the new environment of the Kuanyinchiao Formation hadhosted a different mix of sulfur cycling bacteria that may not havedisproportionated sulfur as much.
The Kuanyinchiao–Lungamachi boundary hosts a sharp transition toanoxic or euxinic conditions (Yan et al., 2008) with high TOC and highsulfide contents, associated with the deglaciation (Fig. 2). δ34Ssulfide isconsistently around −20‰ in the persculptus zone. These values areat least 10‰ lower than the sulfides of the lower extraordinarius zone.This can be explained as the result of anoxic conditions allowingbacterial sulfate reduction to occur at or above the sediment–water in-terface, thereby having an unlimited sulfate supply, i.e., the hypothesisof Yan et al. (2009). However, this explanation is not consistent withthe δ34Ssulfide values in the overlying ascensus zone, which are erratic,fluctuating from −30‰ to +22‰, even though there is no apparentchange in redox conditions (Fig. 2). Again, the reactivity of the organicmatter or changing bacterial populations may be the cause of this, butfurther work is required to test this.
The new δ34Ssulfide data from the Wangjiawan (Riverside) section(Fig. 2) are broadly consistent with results at other Yangtze Platformsections: the Wangjiawan (North) and Nanbazi sections (Yan et al.,2009), as well as the Honghuayuan section (Zhang et al., 2009). Alldata sets show a rise in δ34Ssulfide in the upper Wufeng Formation andan abrupt drop at the Kuanyinchiao–Lungamachi transition. The consis-tency in δ34Ssulfide patterns over suchwidespread sections (hundreds ofkilometers apart) indicates that the mechanism operates basin-wide.
In short, there is no simple and consistent explanation for theδ34Ssulfide values in this section. Increased TOC can increase bac-terial reduction rate, which in turn increases the δ34Ssulfide. ButTOC has no apparent effect in this section (in fact the intervalswith lowest TOC have the highest δ34Ssulfide). Likewise, changingsedimentation conditions, as recorded by carbonate content,also has no effect.Availability of sulfate is consistent with control-ling δ34Ssulfide in some portions of this section, but not all. Chang-ing sulfate δ34S is also a possibility but further work, perhaps oncarbonate-associated sulfate, is required to test this. Changing oforganic matter reactivity, thereby encouraging or discouraginghigher bacterial metabolic rates, could be the cause but organicgeochemical work is required to investigate this. Alternatively,changes in the bacterial communities may be a solution but thiscannot be tested in ancient strata.
5.2. Reliability of δ13Ccarb as a primary signal
The new δ13Ccarb results show a positive excursion in the extraordi-narius zone. This excursionmatches the timing andmagnitude of otherknown Hirnantian δ13Ccarb excursions from sections around the worldwhere graptolite biostratigraphic analysis has been done (Fig. 3). Thisis strong evidence that this signal is derived fromHirnantian seawater.However, the absolute values are shifted to the negative by about3–4‰ compared to the δ13Ccarb of most other sections where the base-line is about 0‰ (Fig. 3).
Differences in δ13Ccarb values between open ocean and platformsettings, and even different parts of platforms, have been demon-strated in modern and ancient settings (Patterson and Walter,1994; Immenhauser et al., 2002, 2003; Panchuk et al., 2005, 2006;LaPorte et al., 2009; Cramer et al., 2010). The more proximal plat-form sites can have either more negative or more positive δ13Ccarb
values. In some modern settings δ13Ccarb is more negative comparedto the open ocean due to 13C-depleted organic matter being oxidizedbut not adequately mixed with the open ocean (Patterson andWalter, 1994), commonly referred to as ‘aging’ of waters. However,
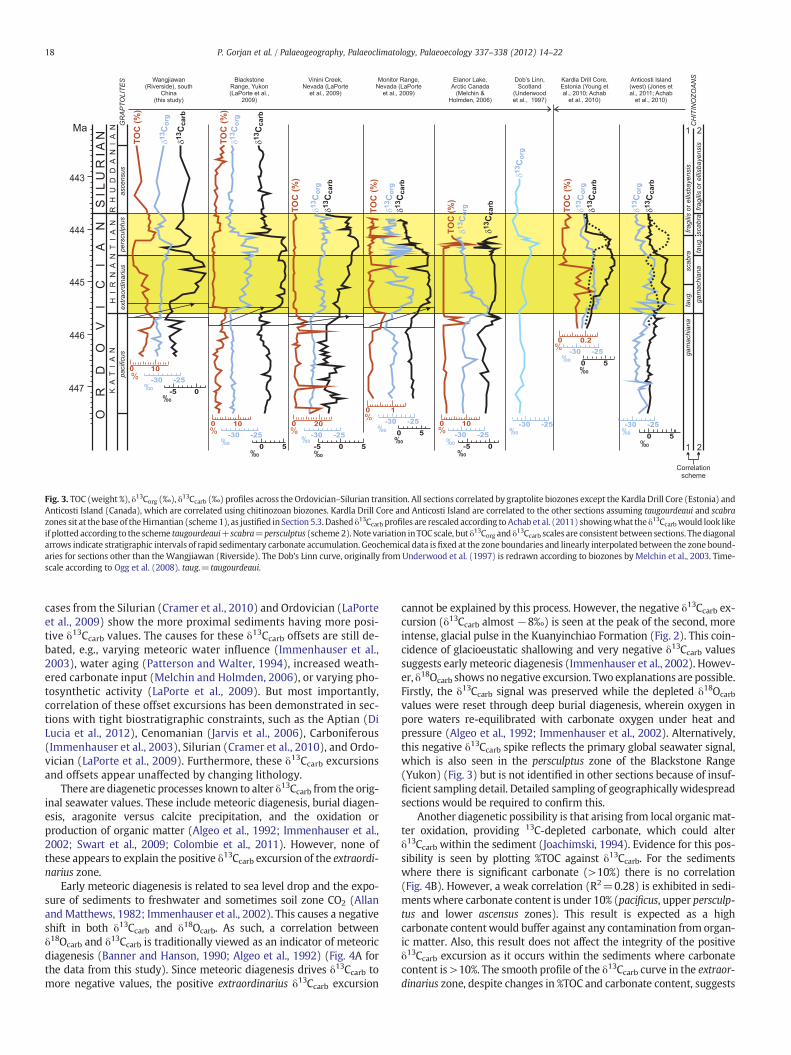
Fig. 3. TOC (weight %), δ13Corg (‰), δ13Ccarb (‰) profiles across the Ordovician–Silurian transition. All sections correlated by graptolite biozones except the Kardla Drill Core (Estonia) andAnticosti Island (Canada), which are correlated using chitinozoan biozones. Kardla Drill Core and Anticosti Island are correlated to the other sections assuming taugourdeaui and scabrazones sit at the base of theHirnantian (scheme 1), as justified in Section 5.3. Dashed δ13Ccarb profiles are rescaled according to Achab et al. (2011) showingwhat the δ13Ccarbwould look likeif plotted according to the scheme taugourdeaui+scabra=persculptus (scheme 2). Note variation in TOC scale, but δ13Corg and δ13Ccarb scales are consistent between sections. Thediagonalarrows indicate stratigraphic intervals of rapid sedimentary carbonate accumulation. Geochemical data is fixed at the zone boundaries and linearly interpolated between the zone bound-aries for sections other than the Wangjiawan (Riverside). The Dob's Linn curve, originally from Underwood et al. (1997) is redrawn according to biozones by Melchin et al., 2003. Time-scale according to Ogg et al. (2008). taug.=taugourdeaui.
18 P. Gorjan et al. / Palaeogeography, Palaeoclimatology, Palaeoecology 337–338 (2012) 14–22
cases from the Silurian (Cramer et al., 2010) and Ordovician (LaPorteet al., 2009) show the more proximal sediments having more posi-tive δ13Ccarb values. The causes for these δ13Ccarb offsets are still de-bated, e.g., varying meteoric water influence (Immenhauser et al.,2003), water aging (Patterson and Walter, 1994), increased weath-ered carbonate input (Melchin and Holmden, 2006), or varying pho-tosynthetic activity (LaPorte et al., 2009). But most importantly,correlation of these offset excursions has been demonstrated in sec-tions with tight biostratigraphic constraints, such as the Aptian (DiLucia et al., 2012), Cenomanian (Jarvis et al., 2006), Carboniferous(Immenhauser et al., 2003), Silurian (Cramer et al., 2010), and Ordo-vician (LaPorte et al., 2009). Furthermore, these δ13Ccarb excursionsand offsets appear unaffected by changing lithology.
There are diagenetic processes known to alter δ13Ccarb from the orig-inal seawater values. These include meteoric diagenesis, burial diagen-esis, aragonite versus calcite precipitation, and the oxidation orproduction of organic matter (Algeo et al., 1992; Immenhauser et al.,2002; Swart et al., 2009; Colombie et al., 2011). However, none ofthese appears to explain the positive δ13Ccarb excursion of the extraordi-narius zone.
Early meteoric diagenesis is related to sea level drop and the expo-sure of sediments to freshwater and sometimes soil zone CO2 (AllanandMatthews, 1982; Immenhauser et al., 2002). This causes a negativeshift in both δ13Ccarb and δ18Ocarb. As such, a correlation betweenδ18Ocarb and δ13Ccarb is traditionally viewed as an indicator of meteoricdiagenesis (Banner and Hanson, 1990; Algeo et al., 1992) (Fig. 4A forthe data from this study). Since meteoric diagenesis drives δ13Ccarb tomore negative values, the positive extraordinarius δ13Ccarb excursion
cannot be explained by this process. However, the negative δ13Ccarb ex-cursion (δ13Ccarb almost −8‰) is seen at the peak of the second, moreintense, glacial pulse in the Kuanyinchiao Formation (Fig. 2). This coin-cidence of glacioeustatic shallowing and very negative δ13Ccarb valuessuggests early meteoric diagenesis (Immenhauser et al., 2002). Howev-er, δ18Ocarb shows nonegative excursion. Two explanations are possible.Firstly, the δ13Ccarb signal was preserved while the depleted δ18Ocarb
values were reset through deep burial diagenesis, wherein oxygen inpore waters re-equilibrated with carbonate oxygen under heat andpressure (Algeo et al., 1992; Immenhauser et al., 2002). Alternatively,this negative δ13Ccarb spike reflects the primary global seawater signal,which is also seen in the persculptus zone of the Blackstone Range(Yukon) (Fig. 3) but is not identified in other sections because of insuf-ficient sampling detail. Detailed sampling of geographically widespreadsections would be required to confirm this.
Another diagenetic possibility is that arising from local organic mat-ter oxidation, providing 13C-depleted carbonate, which could alterδ13Ccarb within the sediment (Joachimski, 1994). Evidence for this pos-sibility is seen by plotting %TOC against δ13Ccarb. For the sedimentswhere there is significant carbonate (>10%) there is no correlation(Fig. 4B). However, a weak correlation (R2=0.28) is exhibited in sedi-ments where carbonate content is under 10% (pacificus, upper persculp-tus and lower ascensus zones). This result is expected as a highcarbonate content would buffer against any contamination from organ-ic matter. Also, this result does not affect the integrity of the positiveδ13Ccarb excursion as it occurs within the sediments where carbonatecontent is >10%. The smooth profile of the δ13Ccarb curve in the extraor-dinarius zone, despite changes in %TOC and carbonate content, suggests
A
B
Fig. 4. A. Crossplot of δ13Ccarb versus δ18Ocarb, showing regression line, correlation coefficient(R2). Note poor correlation. B. Crossplot of δ13Ccarb versus %TOC. White points are fromsamples with b10% carbonate content, black points are from samples with >10% carbonatecontent. Regression lines and correlation coefficients (R2) shown for both data sets.
19P. Gorjan et al. / Palaeogeography, Palaeoclimatology, Palaeoecology 337–338 (2012) 14–22
the cause of the excursion was δ13C changes in the overlying water andthat the data were not significantly altered during diagenesis.
Another source of δ13Ccarb variation arises fromdifferences inmineral-ogy. Laboratory experiments have shown that aragonite is enriched in 13Cby about 1.7‰ compared to calcite precipitated from the same water(Romanek et al., 1992). Observations from natural environments haveshown an even greater difference, up to 4–5‰ (e.g., Swart, 2008). As ara-gonite is not easily preserved in the sedimentary record, it is not easyto determine what role variable mineralogy had in the Wangjiawan(Riverside) δ13Ccarb values. However, as the Hirnantian δ13Ccarb
excursion is global, and recognized in sections from varying waterdepths and lithologies, it cannot be attributed to local aragoniteformation. Alternatively, it is possible that an increase in globalseawater Mg2+ could have led to widespread aragonite formation(de Choudens-Sanchez and Gonzalez, 2009). However, a rapid globalMg2+ increase and subsequent decrease within about a million years(the duration of the δ13Ccarb excursion) would be unlikely as theresidence time of magnesium in the oceans is currently about 13 mil-lion years (Broecker and Peng, 1982).
Thus, the positive δ13Ccarb excursion in the extraordinarius zone ismost probably a reliable chemostratigraphic tool. It is unlikely that dia-genetic factors created a positive excursion, where there was not one,and that such an excursionwould be of the same timing andmagnitudeas is recorded in other sectionsworldwide. However, the negative spikein theKuanyinchiao Formation is probably the result of diagenetic influ-ences. Also, where the carbonate content is less than 10%, there may besome diagenetic alteration due to organic matter oxidation, but thisdoes not include the positive or negative δ13Ccarb excursions.
5.3. δ13Corg, δ13Ccarb and stratigraphic correlations
TheWangjiawan data show that the δ13Ccarb excursion begins at thebase of, or just below, the extraordinarius zone (see Fig. 2) and peakswithin the extraordinarius zone. The δ13Corg curve also begins to rise inparallel with the δ13Ccarb, but peaks in the Hirnantian Fauna zone, coin-cident with a negative spike in δ13Ccarb values. As Chen et al. (2005b,2006) have identified the upper half of the Kuanyinchiao Formation tobe the basal persculptus graptolite zone, it places the δ13Corg peak in
the lower persculptus zone. Thus, the δ13Ccarb and δ13Corg data reachtheir peak values in different biozones.
This pattern of δ13Ccarb and δ13Corg starting to rise near the pacificus–extraordinarius boundary is evident in other sections where graptolitestratigraphy is available (Fig. 3). δ13Ccarb also peaks in the extraordinar-ius zone (Fig. 3), with the exception of the Vinini Creek section, Nevada(Fig. 3; LaPorte et al., 2009). δ13Corg is not as consistent, peaking ineither the extraordinarius (e.g., Monitor Range, Nevada; LaPorte et al.,2009) or the persculptus (e.g., Dob's Linn, Scotland; Underwood et al.,1997) zones, or plateauing throughout (e.g., Vinini Creek, Nevada;LaPorte et al., 2009). But δ13Ccarb and δ13Corg all return to baseline valuesin the persculptus zone (Fig. 3), marking the end of the Hirnantiancarbon-isotope excursion. The rise in δ13Ccarb and δ13Corg in the latepacificus–early extraordinarius zones and the return to baseline valuesin the persculptus zone appear to be the most significant chemostrati-graphic features.
At Anticosti Island and Estonia, where graptolite stratigraphy ispoorly constrained (Delabroye and Vecoli, 2010), chitinozoans areused (Fig. 3). However, debate arises in the correlation of chitinozoanwith graptolite biozones. Some workers (e.g., Melchin and Holmden,2006; Fan et al., 2009; Achab et al., 2011) correlate the chitinozoanstaugourdeaui and scabra with the graptolite persculptus zone. Howev-er, Baltic stratigraphers (e.g., Brenchley et al., 2003; Kaljo et al., 2007,2008) place taugourdeaui and scabra within the extraordinarius zone(see Delabroye and Vecoli (2010) and Young et al. (2010) for reviewsof the biostratigraphic debate).
Workers preferring the former correlation scheme (taugourdeaui+scabra=persculptus) have based this on the correlation of Anticosti/Esto-nian δ13Ccarb profiles with the δ13Corg profiles of Wangjiawan and Dob'sLinn (e.g., Achab et al., 2011). This scheme matches the shallow rises inthe extraordinarius zone and strong rises in the persculptus zone. Howev-er, comparison of the Anticosti/Estonian δ13Ccarb curves with other pro-files shows that the taugourdeaui+scabra=persculptus scheme is illfitting (see dashed lines in Fig. 3). All δ13Ccarb curves show the strongestrise near the pacificus–extraordinarius zone. Furthermore, in thegraptolite-zoned sections once the Hirnantian carbon-isotope excursionbegins, both δ13Ccarb and δ13Corg values remain elevated until returningto baseline in the persculptus zone (Jones et al., 2011). This condition isbroken in the Anticosti δ13Ccarb profile if the taugourdeaui+scabra=persculptus scheme is adopted (Fig. 3).
By correlating the taugourdeaui and scabra chitinozoan zones withthe extraordinarius zone, the Anticosti/Estonian δ13Ccarb and δ13Corgcurves produce a much more comfortable fit with the graptolite-zoned sections, and conform to the pattern of beginning in the extraor-dinarius zone and ending in the persculptus zone (Fig. 3).
Thus, the Baltic stratigraphers appear correct in correlating the tau-gourdeaui and scabra chitinozoan zones with the extraordinarius zone.This scheme would also predict that a δ13Ccarb analysis of the Dob'sLinn section, Scotland, the GSSP for the base of the Silurian – if at allpossible – would also show a δ13Ccarb excursion beginning in the nearthe pacificus–extraordinarius zone even though it shows a δ13Corg peakin the persculptus zone.
The Wangjiawan (Riverside) carbon isotope data also cautionsagainst assuming that the δ13Corg profile will necessarily match theδ13Ccarb profile. δ13Ccarb values are derived from local seawaterdissolved inorganic carbonate δ13CDIC and can be diagenetically altered(as outlined in Section 5.2). δ13Corg values are the result of photosyn-thetic activity taking carbon from atmospheric and dissolved CO2, indi-cating some connection between δ13Corg and δ13Ccarb. However,different primary producers can fractionate carbon differently (e.g.,Pancost et al., 1999; Takahashi et al., 2010). Also, varying environmentalconditions can alter the rate of carbon fixation that, in turn, can alterδ13Corg (Laws et al., 1995). Furthermore, the degree of remineralizationcan also affect δ13Corg (Burdige, 2007). Given that the δ13Corg peak oc-curs in the Kuanyinchiao Formationwhere TOC is diminished, itmay in-dicate that a different primary producer wasmore prominent. This may

20 P. Gorjan et al. / Palaeogeography, Palaeoclimatology, Palaeoecology 337–338 (2012) 14–22
also tie in with the sulfur isotope results, where it is possible that theelevated δ34Ssulfide of the Kuanyinchiao Formation was the result of amore reactive organic matter supply that increased sulfate reductionrates (Section 5.1).
The consistent pattern of δ13Corg profiles across the Yangtze Platformat Wangjiawan (Wang et al., 1997; Fan et al., 2009), Huanghuachang(Wang et al., 1997), Nanbazi (Yan et al., 2009), and Fenxiang (Wanget al., 1997) indicates that whatever factors caused the δ13Corg shifts,these have to be basin-wide mechanisms.
5.4. δ13C rise and Hirnantian environmental events
Explanations for the Hirnantian δ13C excursion have fallen into twocamps. According to the first, the rise of δ13C is attributed to an increasein primary productivity and organic burialwhich sequesters 12C, leavingthe inorganic carbon pool enriched in 13C (e.g., Marshall andMiddleton,1990; Brenchley et al., 1994; Marshall et al., 1997; Brenchley et al.,2003). This is known as the “productivity” hypothesis. On the otherhand, the second explanation invokes an alteration of weathering pat-terns due to ice sheets covering high-latitude land, but lowered sealevels exposing more carbonate platforms in lower latitudes (e.g.,Kump et al., 1999; Melchin and Holmden, 2006). This is known as the“weathering” hypothesis. Workers suggest that carbonate platformswere preferentially exposed during the glacial sea level fall, providingmore carbonate and less organic matter for weathering. Silicate weath-ering was also reduced as ice sheets covered continental Gondwana,leading to a build up of CO2 in the atmosphere (Kump et al., 1999) untilsufficient greenhouse warming caused the deglaciation.
The available TOC data (Fig. 3) argues against the productivity hy-pothesis. If increased organic matter burial was responsible for the pos-itive δ13Ccarb and δ13Corg excursions, then a coincident increase in TOCwould be expected. But TOC actually declines in most sections coinci-dentwith the elevated δ13C values. Although one could argue for organ-ic matter deposition in some yet to be analyzed basin, or even the deepsea, the available evidence is not favorable to this hypothesis. Othersections, not shown in Fig. 3, that also show low TOC at this intervalinclude Nanbazi (China; Yan et al., 2009), Cape Manning and TruroLake (Arctic Canada; Melchin and Holmden, 2006).
The weathering hypothesis could be bolstered by examples of posi-tive δ13Ccarb excursions coincident with sea level falls. Comparableevents could be the Carboniferous–Permian glaciations, which occa-sionally show coincident δ13C shifts, although they are not as consistentas the Hirnantian (Mii et al., 2001; Grossman et al., 2008; Birgenheieret al., 2010; Buggisch et al., 2011). On the other hand, the Pleistoceneglacial cycles show δ13Ccarb falling during glacial maxima (i.e., sealevelminima) (e.g., Curry and Oppo, 2005), indicating that an increasedweathering of carbonate is not significant. However, one could arguethat carbonate platforms were much more extensive during the Paleo-zoic compared with the Pleistocene (Kump et al., 1999).
The lack of consensus on the interpretation of the δ13C shifts (duringthe Hirnantian, as well as other time periods) hampers our ability to ro-bustly interpret the events causing this geochemical signal. Under-standing the causal relationships between the Hirnantian glaciationand carbon-cycle perturbation may await a more fundamental under-standing of the mechanisms behind the δ13C signal.
6. Conclusions
New geochemical data provide a record of changing environmentalconditions associated with the Hirnantian of South China. Two glacialpulses coincide with increases in sediment carbonate content. δ34Ssulfidedata shows elevated values in the Kuanyinchiao Formation, consistentwith other sections throughout the Yangtze Platform. However, thereis no consensus on the cause of these changes.
New δ13Ccarb data shows a peak in the extraordinarius zone, beforethewell-established δ13Corg peak in thepersculptus zone. Previous global
Hirnantian correlations have matched δ13Ccarb peaks with the Wangjia-wan δ13Corg peak, making correlative sections comparatively too youngand promoting a correlation of taugourdeaui and scabra chitinozoanswith the persculptus graptolite zone. Instead, the new data suggeststhat the taugourdeaui and scabra zones correlatewith the extraordinariuszone. Although the ultimate cause of theHirnantian glaciation and its re-lationship to the δ13Ccarb perturbation remain elusive, the new data andrefined correlation framework presented here provide another step to-ward addressing these issues.
Acknowledgments
P.G. andD.A.F. were partially supported by a grant from the AgouronInstitute. K.K. was partly supported by a grant-in-aid for scientificresearch from the Ministry of Education, Science and Culture of Japan.Thanks to Dwight McCay for contributions to data generation. Thanksalso go to two anonymous reviewers and the editor (F. Surlyk) whosecontributions greatly improved the manuscript.
References
Achab, A., Asselin, E., Desrochers, A., Riva, J.F., Farley, C., 2011. Chitinozoan biostratigraphyof a new Upper Ordovician stratigraphic framework for Anticosti Island, Canada.Geological Society of America Bulletin 123, 186–205.
Algeo, T.J., Lohmann, K.C., Wilkinson, B.H., 1992. Meteoric-burial diagenesis of middlePennsylvanian limestones in the Orogrande Basin, NewMexico: water/rock interactionsand basin geothermics. Journal of Sedimentary Petrology 62, 652–670.
Allan, J.R., Matthews, R.K., 1982. Isotope signatures associated with early meteoric dia-genesis. Sedimentology 29, 797–817.
Bambach, R.K., Knoll, A.H., Wang, S.C., 2004. Origination, extinction, and mass depletionsof marine diversity. Paleobiology 30, 522–542.
Banner, J.L., Hanson, G.H., 1990. Calculation of simultaneous isotopic and trace elementvariations during water-rock interaction with application to carbonate diagenesis.Geochimica et Cosmochimica Acta 54, 3123–3137.
Berner, R.A., 1978. Sulfate reduction and the rate of deposition of marine sediments.Earth and Planetary Science Letters 37, 492–498.
Berner, R.A., 1984. Sedimentary pyrite formation: An update. Geochimica et Cosmochi-mica Acta 48, 605–615.
Birgenheier, L.P., Frank, T.D., Fielding, C.R., Rygel, M.C., 2010. Coupled carbon isotopic andsedimentological records from the Permian system of eastern Australia reveal theresponse of atmospheric carbon dioxide to glacial growth and decay during the latePalaeozoic Ice Age. Palaeogeography, Palaeoclimatology, Palaeoecology 286, 178–193.
Brenchley, P.J., Marshall, J.D., Carden, G.A.F., Robertson, D.B.R., Long, D.G.F., Meidla, T.,Hints, L., Anderson, T.F., 1994. Bathymetric and isotopic evidence for a short–livedLate Ordovician glaciation in a greenhouse period. Geology 22, 295–298.
Brenchley, P.J., Carden, G.A.F., Hints, L., Kaljo, D., Marshall, J.D., Martma, T., Meidla, T.,Nolvak, J., 2003. High-resolution stable isotope stratigraphy of Upper Ordoviciansequences: constraints on the timing of bioevents and environmental changes asso-ciated with mass extinction and glaciation. Geological Society of America Bulletin115, 89–104.
Broecker, W.S., Peng, T.-H., 1982. Tracers in the Sea. Eldigo Press, NY Palisades.Buggisch, W., Wang, X., Alekseev, A.S., Joachimski, M.M., 2011. Carboniferous–Permian
carbon isotope stratigraphy of successions fromChina (Yangtze platform), USA (Kansas)and Russia (Moscow Basin and Urals). Palaeogeography, Palaeoclimatology, Palaeoecol-ogy 301, 18–38.
Burdige, D.J., 2007. The preservation of organic matter in marine sediments: controls,mechanisms and an imbalance in sediment organic carbon budgets? ChemicalReviews 107, 467–485.
Burton, E.D., Sullivan, L.A., Bush, R.T., Johnston, S.G., Keene, A.F., 2008. A simple and inex-pensive chromium-reducible sulfur method for acid-sulfate soils. Applied Geochem-istry 23, 2759–2766.
Canfield, D.E., 2001. Geochemistry of sulphur isotopes. In: Valley, J.W., Cole, D.R. (Eds.),Stable Isotope Geochemistry: Mineralogical Society of America Reviews andMineralogy and Geochemistry, vol. 43, pp. 607–636. Washington D.C.
Canfield, D.E., Raiswell, R., Westrich, J.T., Reaves, C.M., Berner, R.A., 1986. Chemical Ge-ology 54, 149–155.
Chambers, L.A., 1982. Sulfur isotope study of a modern intertidal environment, and theinterpretation of ancient sulfides. Geochimica et Cosmochimica Acta 46, 721–728.
Chen, X., Rong, J., Mitchell, C.E., Harper, D.A.T., Fan, J.-X., Zhan, R., Zhang, Y., Li, R., Wang, Y.,2000. Late Ordovician to earliest Silurian graptolite and brachiopod biozonation fromthe Yangtze region, South China, with a global correlation. Geological Magazine 137,623–650.
Chen, X., Rong, J.Y., Li, Y., Boucott, A.J., 2004. Facies patterns and geography of the Yangtzeregion, South China, through the Ordovician and Silurian transition. Palaeogeography,Palaeoclimatology, Palaeoecology 204, 353–372.
Chen, X., Fan, J.-X., Melchin, M.J., Mitchell, C.E., 2005a. Hirnantian (latest Ordovician)graptolites from the Upper Yangtze region, China. Palaeontology 48, 235–280.
Chen, X., Melchin, M.J., Sheets, H.D., 2005b. Patterns and processes of latest Ordoviciangraptolite extinction and recovery based on data from south China. Journal of Paleon-tology 79, 842–861.

21P. Gorjan et al. / Palaeogeography, Palaeoclimatology, Palaeoecology 337–338 (2012) 14–22
Chen, X., Rong, J.-Y., Fan, J.-X., Zhan, R.-B., Mitchell, C.E., Harper, D.A.T., Melchin, M.J.,Peng, P.A., Finney, S.C., Wang, X.-F., 2006. The Global Stratotype Section andPoint (GSSP) for the base of the Hirnantian Stage (the uppermost of the OrdovicianSystem). Episodes 29, 183–196.
Colombie, C., Lecuyer, C., Strasser, A., 2011. Carbon- and oxygen-isotope records of palaeoen-vironmental and carbonate production changes in shallow-marine carbonates(Kimmeridgian, Swiss Jura). Geological Magazine 148, 133–153.
Copper, P., 2001. Reefs during the multiple crises towards the Ordovician–Silurianboundary: Anticosti Island, eastern Canada, and worldwide. Canadian Journal ofEarth Sciences 38, 153–171.
Cramer, B.D., Loydell, D.K., Samtleben, C., Munnecke, A., Kaljo, D., Männik, P., Martma, T.,Jeppsson, L., Kleffner, M.A., Barrick, J.E., Johnson, C.A., Emsbo, P., Joachimski, M.M.,Bickert, T., Saltzman, M.R., 2010. Testing the limits of Paleozoic chronostratigraphiccorrelation via high-resolution (b500 k.y.) integrated conodont, graptolite, andcarbon isotope (δ13Ccarb) biochemostratigraphy across the Llandovery–Wenlock(Silurian) boundary: is a unified Phanerozoic time scale achievable? GeologicalSociety of America Bulletin 122, 1700–1716.
Curry, W.B., Oppo, D.W., 2005. Glacial water mass geometry and the distribution ofδ13C of ΣCO2 in the western Atlantic Ocean. Palaeoceanography 20, PA1017.
De Choudens-Sanchez, V., Gonzalez, L.A., 2009. Calcite and aragonite precipitation undercontrolled instantaneous supersaturation: elucidating the role of CaCO3 saturationstate and Mg/Ca ratio on calcium carbonate polymorphism. Journal of SedimentaryResearch 79, 363–376.
Delabroye, A., Vecoli, M., 2010. The end-Ordovician glaciation and the HirnantianStage: a global review and questions about the Late Ordovician event stratigraphy.Earth-Science Reviews 98, 269–282.
Deynoux, M., 1985. Terrestrial or waterlain glacial diamictites? Three case studies fromthe Late Precambrian and Late Ordovician glacial drifts in West Africa. Palaeogeogra-phy, Palaeoclimatology, Palaeoecology 51, 97–141.
Deynoux, M., Trompette, R., 1981. Late Ordovician tillites of the Taoudeni Basin, WestAfrica. In: Hambrey, M.J., Harland, W.B. (Eds.), Earth's Pre-Pleistocene Glacial Record.Cambridge University Press, Cambridge, pp. 89–96.
Di Lucia, M., Trecalli, A., Mutti, M., Parente, M., 2012. Bio-chemostratigraphy of the Barre-mian–Aptian shallow-water carbonates of the southern Apennines (Italy): pinpointingthe OAE1a in a Tethyan carbonate platform. Solid Earth 3, 1–28.
Fan, J., Peng, P., Melchin, M.J., 2009. Carbon isotopes and event stratigraphy near theOrdovician–Silurian boundary, Yichang, South China. Palaeogeography, Palaeocli-matology, Palaeoecology 276, 160–169.
Finnegan, S., Bergmann, K., Eiler, J.M., Jones, D.S., Fike, D.A., Eisenman, I., Hughes, N.C.,Tripati, A.K., Fischer, W.W., 2011. Magnitude and duration of Late Ordovician–EarlySilurian glaciation. Science 331, 903–906.
Finney, S.C., Berry, W.B.N., Cooper, J.D., Ripperdan, R.L., Sweet, W.C., Jacobson, S.R.,Soufiane, A., Achab, A., Noble, P.J., 1999. Late Ordovician mass extinction: a newperspective from stratigraphic sections in central Nevada. Geology 27, 215–218.
Ghienne, J.-F., 2003. Late Ordovician sedimentary environments, glacial cycles, andpostglacial transgression in the Taoudeni Basin, West Africa. Palaeogeography,Palaeoclimatology, Palaeoecology 189, 117–145.
Ghienne, J.-F., Le Heron, D., Moreau, J., Denis, M., Deynoux, M., 2007. The Late Ordovicianglacial sedimentary system of the North Gondwana platform. In: Hambrey, M.,Christoffersen, P., Glasser, N., Janssen, P., Hubbard, B., Siegert, M. (Eds.), GlacialSedimentary Processes and Products. Special Publication. International Associationof Sedimentologists, Blackwells, Oxford, pp. 295–319.
Goldhaber, M.B., Kaplan, I.R., 1974. The sulfur cycle. In: Goldberg, E.D. (Ed.), The Sea,Volume 5. Wiley, New York, pp. 569–655.
Gradstein, F.M., Ogg, J.G., Smith, A.G., 2004. A Geologic Time Scale 2004. CambridgeUniversity Press, Cambridge, UK.
Grossman, E.L., Yancey, T.E., Jones, T.E., Bruckschen, P., Chuvashov, B., Mazzullo, S.J., Mii, H.-S.,2008. Glaciation, aridification, and carbon sequestration in the Permo-Carboniferous:the isotopic record from low latitudes. Palaeogeography, Palaeoclimatology, Palaeoecol-ogy 268, 222–233.
Habicht, K.S., Canfield, D.E., 1997. Sulfur isotope fractionation during bacterial sulfate re-duction in organic-rich sediments. Geochimica et Cosmochimica Acta 61, 5351–5361.
Habicht, K.S., Canfield, D.E., 2001. Isotope fractionation by sulfate-reducing natural popula-tions and the isotopic composition of sulfide inmarine sediments. Geology 29, 555–558.
Immenhauser, A., Kenter, J.A.M., Ganssen, G., Bahamonde, J.R., Van Vliet, A., Saher, M.H.,2002. Origin and significance of isotope shifts in Pennsylvanian carbonates (Asturias,NW Spain). Journal of Sedimentary Research 72, 82–94.
Immenhauser, A., Della Porta, G., Kenter, J.A.M., Bahamonde, J.R., 2003. An alternativemodel for the positive shifts in shallow-marine carbonate δ13C and δ18O. Sedimen-tology 50, 953–959.
Jarvis, I., Gale, A.S., Jenkyns, H.C., Pearce, M.A., 2006. Secular variation in Late Cretaceous car-bon isotopes: a new δ13C carbonate reference curve for the Cenomanian–Campanian(99.6–70.6 Ma). Geological Magazine 143, 561–608.
Joachimski, M.M., 1994. Subaerial exposure and deposition of shallowing-upward se-quences: evidence from stable isotopes of Purbeckian peritidal carbonates (basalCretaceous), Swiss and French Jura Mountains. Sedimentology 41, 805–824.
Jones, D.S., Fike, D.A., Finnegan, S., Fischer, W.W., Schrag, D.P., McCay, D., 2011. Termi-nal Ordovician carbon isotope stratigraphy and glacioeustatic sea-level changeacross Anticosti Island (Québec, Canada). Geological Society of America Bulletin123, 1645–1664.
Kaljo, D., Martma, T., Saadre, T., 2007. Post-Hunnebergian Ordovician carbon isotopetrend in Baltoscandia, its environmental implications and some similarities withthat of Nevada. Palaeogeography, Palaeoclimatology, Palaeoecology 245, 138–155.
Kaljo, D., Hints, L., Männik, P., Nolvak, J., 2008. The succession of Hirnantian events basedon data from Baltica: brachiopods, chitinozoans, conodonts, and carbon isotopes.Estonian Journal of Earth Sciences 57, 197–218.
Kaljo, D., Hints, L., Hints, O., Mannik, P., Martma, T., Nolvak, J., 2011. Katian prelude tothe Hirnantian (Late Ordovician) mass extinction: a Baltic perspective. GeologicalJournal 46, 464–477.
Kump, L.R., Arthur, M.A., Patzkowsky, M.E., Gibbs, M.T., Pinkus, D.S., Sheehan, P.M., 1999.A weathering hypothesis for glaciation at high atmospheric pCO2 during the LateOrdovician. Palaeogeography, Palaeoclimatology, Palaeoecology 152, 173–187.
LaPorte, D.F., Holmden, C., Patterson, W.P., Loxton, J.D., Melchin, M.J., Mitchell, C.E.,Finney, S.C., Sheets, H.D., 2009. Local and global perspectives on carbon and nitrogencycling during the Hirnantian Glaciation. Palaeogeography, Palaeoclimatology,Palaeoecology 276, 182–195.
Laws, E.A., Popp, B.N., Bidigare, R.R., Kennicutt, M.C., Macko, S.A., 1995. Dependence of phy-toplankton carbon isotopic composition on growth rate and [CO2]aq: theoretical consid-erations and experimental results. Geochimica et Cosmochimica Acta 59, 1131–1138.
Le Heron, D.P., Ghienne, J.-F., El Houicha, M., Khoukhi, K., Rubino, J.-L., 2007. Maximumextent of ice sheets in Morocco during the Late Ordovician glaciation. Palaeogeogra-phy, Palaeoclimatology, Palaeoecology 245, 200–226.
Marshall, J.D., Middleton, P.D., 1990. Changes in marine isotopic composition and theLate Ordovician glaciation. Journal of the Geological Society of London 147, 1–4.
Marshall, J.D., Brenchley, P.J., Mason, P., Wolff, G.A., Astini, R.A., Hints, L., Meidla, T., 1997.Global carbon isotopic events associated with mass extinction and glaciation in thelate Ordovician. Palaeogeography, Palaeoclimatology, Palaeoecology 132, 195–210.
Melchin, M.J., 2008. Restudy of some Ordovician–Silurian boundary graptolites fromAnticosti Island, Canada, and their biostratigraphic significance. Lethaia 41, 155–162.
Melchin, M.J., Holmden, C., 2006. Carbon isotope chemostratigraphy in Arctic Canada:sea-level forcing of carbonate platform weathering and implications for Hirnantianglobal correlation. Palaeogeography, Palaeoclimatology, Palaeoecology 234, 186–200.
Melchin, M.J., Holmden, C., Williams, S.H., 2003. Correlation of graptolite biozones, chiti-nozoan biozones, and carbon isotope curves through the Hirnantian. In: Albanesi,G.L., Beresi, M.S., Peralta, S.H. (Eds.), Ordovician from the Andes, INSUEGO, Serie deCorrelacion Geologica, vol. 17, pp. 101–104.
Mii, H.-S., Grossman, E.L., Yancey, T.E., Chuvashov, B., Egorov, A., 2001. Isotope recordsof brachiopod shells from the Russian Platform — evidence for the onset of Mid-Carboniferous glaciation. Chemical Geology 175, 133–147.
Ogg, J.G., Ogg, G., Gradstein, F.M., 2008. A Concise Geologic Time Scale. Cambridge UniversityPress, Cambridge, UK.
Panchuk, K.M., Holmden, C., Kump, L.R., 2005. Sensitivity of the epeiric sea carbon iso-tope record to local-scale carbon cycle processes: tales from the Mohawkian Sea.Palaeogeography, Palaeoclimatology, Palaeoecology 228, 320–337.
Panchuk, K.M., Holmden, C., Leslie, S.A., 2006. Local controls on carbon cycling in theOrdovician mid-continent region of North America with implications for carbonisotope secular curves. Journal of Sedimentary Research 76, 200–211.
Pancost, R.D., Freeman, K.H., Patzkowsky, M.E., 1999. Organic-matter source variation andthe expression of a late Middle Ordovician carbon isotope excursion. Geology 27,1015–1018.
Patterson, W., Walter, L., 1994. Depletion of 13C in seawater CO2 on modern carbonateplatforms: significance for the carbon isotopic record of carbonates. Geology 22,885–888.
Riva, J., 1988. Graptolites at and below the Ordovician–Silurian boundary on AnticostiIsland, Canada. Bulletin of the British Museum, Natural History. Geology Series,43, pp. 221–237.
Romanek, C.S., Grossman, E.L., Morse, J.W., 1992. Carbon isotopic fractionation in synthet-ic aragonite and calcite: effects of temperature and precipitation rate. Geochimica etCosmochimica Acta 56, 419–430.
Rong, J.-Y., Chen, X., Harper, D.A.T., 2002. The latest Ordovician Hirnantian Fauna (Brachio-poda) in time and space. Lethaia 35, 213–249.
Sheehan, P.M., 2001. The Late Ordovician mass extinction. Annual Review of Earth andPlanetary Sciences 29, 331–364.
Sim, M.S., Bosak, T., Ono, S., 2011a. Large sulfur isotope fractionation does not requiredisproportionation. Science 333, 74–77.
Sim, M.S., Ono, S., Donovan, K., Templer, S.P., Bosak, T., 2011b. Effect of electron donorson the fractionation of sulfur isotopes by a marine Desulfovibrio sp. Geochimica etCosmochimica Acta 75, 4244–4259.
Soufiane, A., Achab, A., 2000. Upper Ordovician and Lower Silurian chitinozoans from centralNevada and Arctic Canada. Review of Palaeobotany and Palynology 113, 165–187.
Swart, P.K., 2008. Global synchronous changes in the carbon isotopic composition ofcarbonate sediments unrelated to changes in the global carbon cycle. Proceedingsof the National Academy of Science 105, 13741–13745.
Swart, P.K., Reijmer, J.J.G., Otto, R., 2009. A re-evaluation of facies on Great Bahama BankII: variations in the δ13C, δ18O and mineralogy of surface sediments. In: Swart, P.K., etal. (Ed.), Perspectives in Carbonate Geology: International Association of Sedimentol-ogists Special Publication, 41, pp. 47–59.
Takahashi, S., Kaiho, K., Oba, M., Kakegawa, T., 2010. A smooth negative shift of organiccarbon isotope ratios at an end-Permian mass extinction horizon in central pelagicPanthalassa. Palaeogeography, Palaeoclimatology, Palaeoecology 292, 532–539.
Trotter, J.A., Williams, I.A., Barnes, C.R., Lécuyer, C., Nicoll, R.S., 2008. Did cooling oceanstrigger Ordovician biodiversification? Evidence from conodont thermometry. Science321, 550–554.
Underwood, C.J., Crowley, S.F., Marshall, J.D., Brenchley, P.J., 1997. High-resolutioncarbon isotope stratigraphy of the basal Silurian Stratotype (Dob's Linn, Scot-land) and its global correlation. Journal of the Geological Society of London154, 709–718.
Vandenbroucke, T.R.A., Chen, X., Verniers, J., 2005. A study on the preliminary results oflatest Ordovician chitinozoan from Wangjiawan, Yichang, China. Acta Palaeontolo-gica Sinica 44, 203–208.
Wang, K., Chatterton, B.D.E., Wang, Y., 1997. An organic carbon isotope record of LateOrdovician to Early Silurian marine sedimentary rocks, Yangtze Sea, South China:

22 P. Gorjan et al. / Palaeogeography, Palaeoclimatology, Palaeoecology 337–338 (2012) 14–22
implications for CO2 changes during the Hirnantian glaciation. Palaeogeography,Palaeoclimatology, Palaeoecology 132, 147–158.
Yan, D., Chen, D., Wang, Q., Wang, J., Chu, Y., 2008. Environmental redox changes of theYangtze Sea during the Ordo-Silurian transition. Acta Geologica Sinica (English Edition)82, 679–689.
Yan, D.T., Chen, D.Z., Wang, Q.C., Wang, J.G., Wang, Z.Z., 2009. Carbon and sulfur isotopicanomalies across the Ordovician–Silurian boundary on the Yangtze Platform, SouthChina. Palaeogeography, Palaeoclimatology, Palaeoecology 274, 32–39.
Yan, D., Chen, D., Wang, Q., Wang, J., 2010. Large-scale climatic fluctuations in the latestOrdovician on the Yangtze block, south China. Geology 38, 599–602.
Young, S.A., Saltzman, M.R., Ausich,W.I., Desrochers, A., Kaljo, D., 2010. Did changes in atmo-spheric CO2 coincide with latest Ordovician glacial interglacial cycles? Palaeogeography,Palaeoclimatology, Palaeoecology 296, 376–388.
Zhang, T., Kershaw, S., Wan, Y., Lan, G., 2000. Geochemical and facies evidence forpalaeoenvironmental change during the Late Ordovician Hirnantian glacia-tion in South Sichuan Province, China. Global and Planetary Change 24,133–152.
Zhang, T., Shen, Y., Zhan, R., Shen, S., Chen, X., 2009. Large perturbations of the carbon andsulfur cycle associatedwith the Late Ordovicianmass extinction in South China. Geology37, 299–302.