Embed Size (px)
Citation preview
PP69CH28_McElwain ARI 7 April 2018 9:39
Annual Review of Plant Biology
Paleobotany and GlobalChange: Important Lessonsfor Species to Biomes fromVegetation Responses to PastGlobal ChangeJennifer C. McElwainBotany Department, Trinity College Dublin, The University of Dublin, Dublin 2, Ireland;email: [email protected]
Annu. Rev. Plant Biol. 2018. 69:761–87
The Annual Review of Plant Biology is online atplant.annualreviews.org
https://doi.org/10.1146/annurev-arplant-042817-040405
Copyright c© 2018 by Annual Reviews.All rights reserved
Keywords
CO2, polar amplification, migration, adaptation, resilience, leaf traits,extinction, leaf mass per area, paleoclimate, paleoatmosphere
Abstract
Human carbon use during the next century will lead to atmospheric car-bon dioxide concentrations ( pCO2) that have been unprecedented for thepast 50–100+ million years according to fossil plant-based CO2 estimates.The paleobotanical record of plants offers key insights into vegetation re-sponses to past global change, including suitable analogs for Earth’s climaticfuture. Past global warming events have resulted in transient poleward mi-gration at rates that are equivalent to the lowest climate velocities requiredfor current taxa to keep pace with climate change. Paleobiome reconstruc-tions suggest that the current tundra biome is the biome most threatenedby global warming. The common occurrence of paleoforests at high polarlatitudes when pCO2 was above 500 ppm suggests that the advance of woodyshrub and tree taxa into tundra environments may be inevitable. Fossil pollenstudies demonstrate the resilience of wet tropical forests to global changeup to 700 ppm CO2, contrary to modeled predictions of the future. Thepaleobotanical record also demonstrates a high capacity for functional traitevolution as an additional strategy to migration and maintenance of a species’climate envelope in response to global change.
761
Click here to view this article's online features:
• Download figures as PPT slides• Navigate linked references• Download citations• Explore related articles• Search keywords
ANNUAL REVIEWS Further
Ann
u. R
ev. P
lant
Bio
l. 20
18.6
9:76
1-78
7. D
ownl
oade
d fr
om w
ww
.ann
ualr
evie
ws.
org
Acc
ess
prov
ided
by
Uni
vers
idad
de
Cos
ta R
ica
(UC
R)
on 0
2/21
/19.
For
per
sona
l use
onl
y.
PP69CH28_McElwain ARI 7 April 2018 9:39
Contents
INTRODUCTION . . . . . . . . . . . . . . . . . . . . . . . . . . . . . . . . . . . . . . . . . . . . . . . . . . . . . . . . . . . . . . . 762GEOLOGICAL CONTEXT FOR CONTEMPORARY GLOBAL CHANGE . . . . . 762VASCULAR PLANTS AND ATMOSPHERE EVOLUTION . . . . . . . . . . . . . . . . . . . . . 763THE FOSSIL PLANT RECORD AND PAST GLOBAL CHANGE . . . . . . . . . . . . . . . 764POLAR AMPLIFICATION AND PAST VEGETATION RESPONSES . . . . . . . . . . . 770PAST GLOBAL CHANGE AND IMPACTS ON PLANT
COMMUNITY COMPOSITION. . . . . . . . . . . . . . . . . . . . . . . . . . . . . . . . . . . . . . . . . . . . . . 771Extinction, Migration, and Past Global Change . . . . . . . . . . . . . . . . . . . . . . . . . . . . . . . . . . 772Paleobotany, Adaptation, and Past Global Change. . . . . . . . . . . . . . . . . . . . . . . . . . . . . . . . 773The End-Triassic Mass Extinction Event . . . . . . . . . . . . . . . . . . . . . . . . . . . . . . . . . . . . . . . . 773Case Study of Past Global Change: Astartekløft, East Greenland . . . . . . . . . . . . . . . . . . 775
TRAIT ADAPTATION AND PHYSIOLOGICAL FEEDBACK . . . . . . . . . . . . . . . . . . . 776PALEOBOTANICAL INSIGHTS ON CO2 FERTILIZATION
OF PHOTOSYNTHESIS. . . . . . . . . . . . . . . . . . . . . . . . . . . . . . . . . . . . . . . . . . . . . . . . . . . . . . 777
INTRODUCTION
Paleobotany is the study of fossil plants in deep geological time. It is concerned with the history ofthe Earth’s vegetation on evolutionary time scales, encompassing on a global scale both long peri-ods of relative climatic stability and episodes of intense atmospheric and climatic upheaval. DuringEarth’s geological history, there have been many episodes of global climate change that were ofa similar magnitude to the anthropogenically forced climate change that has occurred during thepast century. Equally, there are climatic and atmospheric events in the pre-Quaternary past thathave been identified as good analogs of Earth’s climatic future under a doubling of atmosphericcarbon dioxide concentrations ( pCO2) and our aspirational global warming target of no morethan 2◦C above preindustrial temperatures. What the paleobotanical record offers in abundanceto the study of global change is the dimension of time coupled with a combined set of Earth systemboundary conditions, which are more representative of our climate future than any interval duringthe past approximately 2 million years (the Quaternary period). However, the limitation of usingthe pre-Quaternary climate record to better understand biological response to global change is alsorelated to time. The temporal resolution available in the geological record of fossil plants is on theorder of tens of thousands of years at best, but more often, it is on the order of hundreds of thou-sands to millions of years. Therefore, the paleobotanical record is imperfect, as it offers a windowonto individual species, communities, and biome-level responses to global change, in particular toelevated CO2 and global mean surface terrestrial temperature, yet this view is blinkered by irregu-lar snapshots taken every 10,000 to 100,000 years. This review synthesizes studies in paleobotanythat provide important insights into plant and vegetation responses to past global change, from thespecies to the biome scale, with a particular focus on times in Earth’s history that represent climatictransitions from icehouse to greenhouse states and from mild greenhouse to super-greenhousestates, as it is these intervals that are most representative of Earth’s climate future.
GEOLOGICAL CONTEXT FOR CONTEMPORARY GLOBAL CHANGE
The primary drivers of climatic change on a global scale are solar forcing, atmospheric com-position, plate tectonics, and the Earth’s biota (25, 56, 129). The relative position of Earth in
762 McElwain
Ann
u. R
ev. P
lant
Bio
l. 20
18.6
9:76
1-78
7. D
ownl
oade
d fr
om w
ww
.ann
ualr
evie
ws.
org
Acc
ess
prov
ided
by
Uni
vers
idad
de
Cos
ta R
ica
(UC
R)
on 0
2/21
/19.
For
per
sona
l use
onl
y.
PP69CH28_McElwain ARI 7 April 2018 9:39
Clathrate: an ice–likesolid compoundcomposed of methanetrapped in the crystalstructure of water
Thermogenesis:the process by whichhydrocarbon gasses,including methane, arereleased from kerogensor organic-richsediments due to hightemperatures andpressure
Volcanic intrusion:occurs when magmacools before it reachesthe surface; also calledigneous intrusion
Physiognomy(ic):the architecture of aleaf, including shapetraits of the leaf base,tip and margin,characteristics ofvenation, and leaf size
Paleophytic: the timein geological historywhen spore-bearingvascular plants(pteridophytes) wereecologically dominantin the majority ofterrestrial ecosystems;often considered frommid-Silurian to lateCarboniferous
Mesophytic: the timein geological historywhen nonangiospermseed plants(gymnosperms) wereecologically dominantin most terrestrialecosystems; usuallyconsidered from lateCarboniferous tomid-Cretaceous
relation to the sun and the age of the sun (51) determines the total solar irradiance at any pointin Earth’s geological history. On geological timescales, atmospheric composition is determinedby the carbon, oxygen, sulfur, and phosphorous cycles (16, 18), and how they are influenced byEarth system processes. Constituents of the atmosphere that have changed dramatically on ge-ological timescales include CO2 and O2, both of which force global climate (116, 129). In thegeological past, intense episodes of global cooling and warming have been linked, respectively, tothe massive release of SO2 from volcanism (158) and CH4 from marine clathrates (70, 91), andthermogenically to volcanic intrusions (59, 152). These gasses, too, have shaped global climateand had an impact on Earth’s biota, particularly at faunal mass-extinction boundaries (99, 159),but on much shorter timescales than CO2 and O2. Both SO2 and CH4 are relatively short lived inthe atmosphere; SO2 rains out within years of release and CH4 is highly unstable, soon oxidizingto CO2, but both have left their signatures in the fossil record of plants via isotopic (133) andphysiognomic and cellular signatures in leaves (4, 44). However, they are not considered furtherin this review. Perhaps the most valuable understanding that has come from a deep-time per-spective on global climate change is that current Earth system models likely underestimate thesensitivity of the global mean temperature to atmospheric CO2 (52, 129). Climate sensitivity refersto the change in global mean temperature in response to a doubling of CO2 over the preindustrialconcentration of 280 ppm (113). Most climate and Earth system models use a climate sensitivityof approximately 3 Kelvin (reviewed in 129); however, analyses of climate sensitivities on longergeological timescales have concluded that these sensitivities are likely to be underestimated whenconsidering global temperature and proxy or model CO2 estimates for greenhouse intervals in thegeological past (52, 129). This is of considerable concern for policy-makers because knowledgeof the deep-time record argues for much more severe increases in future global temperature thanany current climate model predicts under a doubling of CO2. According to Foster et al.’s (52,p. 1) assessment of greenhouse forcing through time, “If CO2 continues to rise further into thetwenty-third century, then the associated large increase in radiative forcing, and how the Earthsystem would respond, would likely be without geological precedent in the last half a billion years.”
VASCULAR PLANTS AND ATMOSPHERE EVOLUTION
Broadly, the evolution of vascular plants during the past 420 million years can be subdividedinto three distinct evolutionary phases: Paleophytic (old plants), Mesophytic (middle plants), andCenophytic (young plants). The evolutionary phases are temporally offset to those of the evo-lutionary faunas that define three stratigraphic eras: Paleozoic, Mesozoic, and Cenozoic, whichsubdivide the Phanerozoic Eon (155, 166). Plant extinctions at the taxonomic levels of family andorder do not coincide with all of the faunal mass-extinction boundaries that characterize the startand end of eras and tend to be more protracted in their nature and more difficult to pinpoint ingeological history (30, 99). Traditionally, the evolutionary floras defined intervals of reproductivedominance (30, 110).
Paleophytic ecosystems are typically dominated by vascular spore-bearing plants (pterido-phytes), including extant lineages such as lycophytes and monilophytes (ferns and Equisetales)and extinct groups, such as progymnosperms. The Mesophytic era ushered in the dominance ofseed- over spore-based reproduction for the first time, with gymnosperms typically having greaterrelative abundance in fossil floras than pteridophytes. Extant gymnosperm lineages that had animportant role in the Mesophytic era include conifers, cycads, and ginkgos. Finally, the Ceno-phytic era represents a time in Earth’s history when flowering plants (angiosperms) underwentrapid diversification and became dominant within terrestrial ecosystems, ultimately giving rise tothe modern flora. It is now recognized that plant evolutionary eras are not only characterized by
www.annualreviews.org • Paleobotany and Global Change 763
Ann
u. R
ev. P
lant
Bio
l. 20
18.6
9:76
1-78
7. D
ownl
oade
d fr
om w
ww
.ann
ualr
evie
ws.
org
Acc
ess
prov
ided
by
Uni
vers
idad
de
Cos
ta R
ica
(UC
R)
on 0
2/21
/19.
For
per
sona
l use
onl
y.
PP69CH28_McElwain ARI 7 April 2018 9:39
Cenophytic: the timein geological historywhen angiospermswere ecologicaldominant; usuallyconsidered frommid-Cretaceous topresent
Monilophytes:spore-bearing plantevolutionary groupcomprising all ferns,horsetails, and whiskferns
Progymnosperms:an extinct group ofwoody spore-bearingplants from which allseed plants likely arose
Pennsylvanian:a subperiod of theCarboniferous datingbetween 323.2 and298.9 Mya accordingto the InternationalCommission onStratigraphy
reproductive innovations but also distinguished by unique vegetative and ecophysiological traits(25, 50, 54, 168, 169, 179) that may have changed the competitive landscape in each successiveevolutionary era.
The exact geological boundaries of the plant evolutionary eras are quite loose, which is whyplants were not used to define the stratigraphic time span of eras, having not been formally definedor officially recognized by the International Commission on Stratigraphy. For the purpose of thisreview, the boundary of the Paleophytic and Mesophytic is placed in the late Carboniferous, basedon studies that have pushed back the timing of seed-dominated ecosystems, with a distinctly Meso-phytic look back to the Carboniferous and Permian (30, 41, 120). In this review, the boundary of theMesophytic and Cenophytic is not defined by the origin of angiosperms in the earliest Cretaceous(30) but at the time when multiple lines of evidence suggest that angiosperms had attained a globalgeographical occurrence and many of their reproductively and vegetatively distinctive traits, suchas increasing floral complexity and high vein densities, are evident, approximately 127–120 Mya(9, 35, 49, 58). Alternatively, the boundary of the Mesophytic and Cenophytic could be placed atapproximately 90 Mya, when angiosperms became ecologically dominant in the majority of worldbiomes (89, 166).
The Paleophytic era of plant evolution occurred against a backdrop of strongly fluctuatingatmospheric CO2 and global climate at multiple different temporal scales. The earliest vascularplants belonging to the Paleophytic era evolved approximately 423 Mya (139) in an atmosphere ofstrongly elevated CO2 that was more than 10 times higher than preindustrial levels (57, 95, 126),which then declined by the Carboniferous to levels similar to those of our contemporary icehouseworld (10, 106), as plant diversity and geographical coverage increased (Figure 1). In turn, theradiation of land plants resulted in increased carbon sequestration through the chemical weatheringof silicates and the burial of organic matter in the great coal swamps of the Carboniferous (3, 106).New high-resolution, multiproxy records for the late Pennsylvanian document glacial–interglacialatmospheric [CO2] fluctuations of between approximately 200 and 800 ppm, which coincided withice sheet contraction and expansion and resultant sea level rise (106). In large part, the Mesophyticera was characterized by CO2 concentrations above 500 ppm (11, 12, 29, 43, 57, 94, 100, 114, 124,145, 151, 178) and as high as 2,000 ppm or greater at the boundary of the Triassic and Jurassicperiods (23, 135, 143, 177). The Cenophytic era was characterized by a pattern of long-termdecline in CO2 and by global cooling leading to our current icehouse conditions (Figure 2) (7,52, 57, 63, 65, 68, 82, 93, 119, 122, 132, 140, 144, 149, 160, 162, 180). It has been suggestedthat the evolution and rise to ecological dominance of flowering plants may have contributedto the long-term decline in CO2 of the Cenophytic by increasing carbon sequestration throughimpacts on the long-term carbon cycle (17); however, this hypothesis has not been rigorouslytested and, therefore, remains speculative. CO2 was not the only atmospheric constituent gas tochange dramatically throughout Earth history; O2 likely also fluctuated wildly, according to somemodels (16, 19, 61, 105) from lows of <10% to peaks as high as 30%. O2 has an important role inforcing global climate (116) and likely plant evolutionary patterns as well (67, 166, 179). However,as it will not change considerably during the next two centuries, only CO2 and its impact on plantbiology are considered in this review.
THE FOSSIL PLANT RECORD AND PAST GLOBAL CHANGE
The Earth’s vegetation has undoubtedly been shaped by climatic and atmospheric evolution duringmillions of years of geological time. Climate, specifically the mean annual temperature (MAT) andmean annual precipitation (MAP), defines the geographical extent of our modern biomes and playsa fundamental part in defining the ecological niche of species. Often, views of the vegetated Earth
764 McElwain
Ann
u. R
ev. P
lant
Bio
l. 20
18.6
9:76
1-78
7. D
ownl
oade
d fr
om w
ww
.ann
ualr
evie
ws.
org
Acc
ess
prov
ided
by
Uni
vers
idad
de
Cos
ta R
ica
(UC
R)
on 0
2/21
/19.
For
per
sona
l use
onl
y.
PP69CH28_McElwain ARI 7 April 2018 9:39
050
100
150
200
250
Tim
e (M
ya)
300
350
400
450
500
Bryo
phyt
es
Pter
idop
hyte
s
Gym
nosp
erm
s
Ang
iosp
erm
s
Gra
ss
Seed
pl
ants
Spor
e pl
ants
Trop
ical
eve
rwet
Trop
ical
sum
mer
wet
Subt
ropi
cal d
eser
tW
arm
tem
pera
teCo
ld te
mpe
rate
Ice
shee
t
Win
terw
etSu
btro
pica
l sum
mer
wet
Gra
ssla
nd
Ord
ovic
ian
Silu
rian
Dev
onia
nCa
rbon
ifero
usPe
rmia
nTr
iass
icJu
rass
icCr
etac
eous
P.Eo
cene
O.
Mio
.
Ceno
phyt
icM
esop
hyti
cPa
leop
hyti
c
Figu
re1
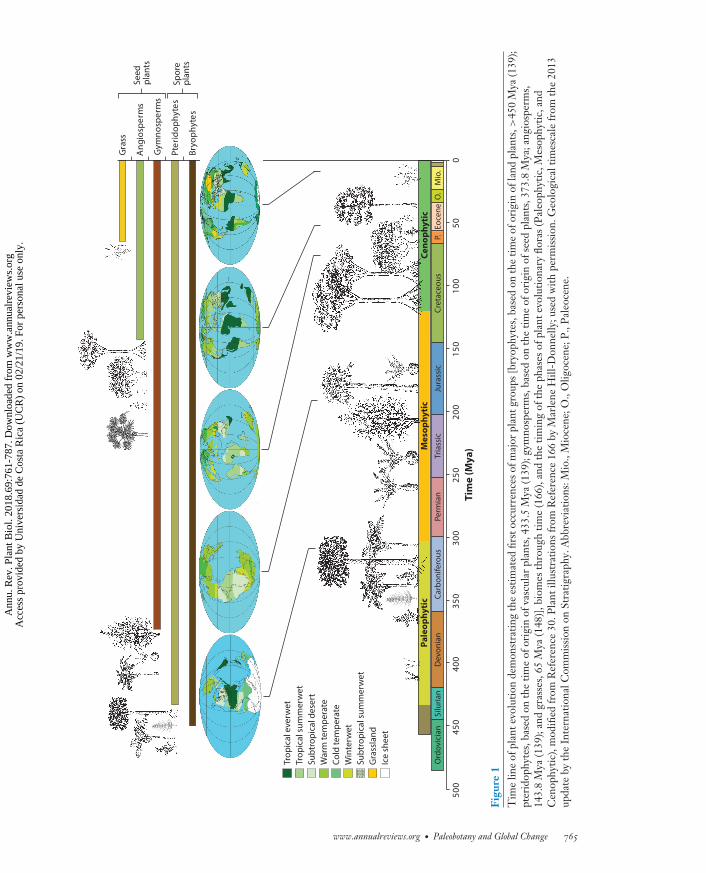
Tim
elin
eof
plan
tevo
lutio
nde
mon
stra
ting
the
estim
ated
first
occu
rren
ceso
fmaj
orpl
antg
roup
s[br
yoph
ytes
,bas
edon
the
time
ofor
igin
ofla
ndpl
ants
,>45
0M
ya(1
39);
pter
idop
hyte
s,ba
sed
onth
etim
eof
orig
inof
vasc
ular
plan
ts,4
33.5
Mya
(139
);gy
mno
sper
ms,
base
don
the
time
ofor
igin
ofse
edpl
ants
,373
.8M
ya;a
ngio
sper
ms,
143.
8M
ya(1
39);
and
gras
ses,
65M
ya(1
48)]
,bio
mes
thro
ugh
time
(166
),an
dth
etim
ing
ofth
eph
ases
ofpl
ante
volu
tiona
ryflo
ras
(Pal
eoph
ytic
,Mes
ophy
tic,a
ndC
enop
hytic
),m
odifi
edfr
omR
efer
ence
30.P
lant
illus
trat
ions
from
Ref
eren
ce16
6by
Mar
lene
Hill
-Don
nelly
;use
dw
ithpe
rmis
sion
.Geo
logi
calt
imes
cale
from
the
2013
upda
teby
the
Inte
rnat
iona
lCom
mis
sion
onSt
ratig
raph
y.A
bbre
viat
ions
:Mio
.,M
ioce
ne;O
.,O
ligoc
ene;
P.,
Pal
eoce
ne.
www.annualreviews.org • Paleobotany and Global Change 765
Ann
u. R
ev. P
lant
Bio
l. 20
18.6
9:76
1-78
7. D
ownl
oade
d fr
om w
ww
.ann
ualr
evie
ws.
org
Acc
ess
prov
ided
by
Uni
vers
idad
de
Cos
ta R
ica
(UC
R)
on 0
2/21
/19.
For
per
sona
l use
onl
y.
PP69CH28_McElwain ARI 7 April 2018 9:39
0
500
1,000
1,500
2,000
2,500
50100150200250300350400450
Carb
on d
ioxi
de c
once
ntra
tion
(ppm
)
Time (Mya)Year
Beerling et al., 1998; 205 to 168 Mya (4)
Beerling & Royer, 2002; 168 Mya (1)
Quan et al., 2009; 81 to 72 Mya (9)
McElwain, 1998; 47.8 to 44.5 Mya (5)
Grein et al., 2013; 33 to 17 Mya (4)**
Wu et al., 2016; 205 to 171 Mya (3)
Yan et al., 2009; 168 Mya (5)
Steinthorsdottir et al., 2016b; 67 to 60 Mya (4)
Grein et al., 2011; 47 Mya (1)
Roth-Nebelsick et al., 2014; 33 Mya (1)
Bonis et al., 2010; 203 Mya (1)
Haworth et al., 2005; 133 to 104 Mya (9)
Beerling et al., 2002; 66 to 63 Mya (5)*
Kürschner et al., 2001; 44.5 Mya (1)
Erdei et al., 2012; 30 Mya (5)
Chen et al., 2001; 187 to 135 Mya (3)
Du et al, 2016; 121 to 112 Mya (1)
Royer, 2003; 61 to 54 Mya (2)*
Maxbauer et al., 2014; 43 Mya (1)
Sun et al., 2017; 28.5 Mya (1)
van der Burgh et al.,1993; 10 to 2 Mya (5)***Wan et al., 2011; 8.5 Mya (3)Stults et al., 2011; 8.3 to 3.1 Mya (2)Kürschner et al., 1996; 4.6 to 2.8 Mya (4) Retallack, 2009a; 233 to 3.9 Mya (17)
Steinthorsdottir & Vajda, 2015; 186 Mya (1)
Passalia, 2009; 121 to 101 Mya (16)
Royer et al., 2001b; 60 to 15 Mya (24)*
Doria et al., 2011; 38 Mya (1)
Kürschner et al., 2008; 26 to 12 Mya (18)*
Sun et al., 2007; 186 to 139 Mya (7)
Mays et al, 2015; 97 Mya (1)
Smith et al., 2010; 50 Mya (3)
Steinthorsdottir et al., 2016a; 36 to 23 Mya (5)
Reichgelt et al., 2016; 23 Mya (2)
McElwain & Chaloner, 1995; 407 to 400 Mya (1)Franks et al., 2014; 409 to 13 Mya (15)Roth & Konrad, 2003; 409 Mya (1)Beerling, 2002; 324 to 270 Mya (24)Montanez et al. 2016; 312 to 303 Mya (25)McElwain et al., 1999; 202 to 199 Mya (8) Steinthorsdottir et al., 2011; 202 to 199 Mya (17)
McElwain et al., 2005; 183 to 182 Mya (6)
Barclay et al., 2010; 94.5 to 93.9 Mya (17)
Greenwood et al., 2003; 49.9 Mya (9)
Roth-Nebelsick et al., 2012; 35 Mya (1)
Wang et al, 2015; 13.8 to 1 Mya (7)
a
b
0
2150
2050
2300
RCP 2.6 (0.3 to 1.7°C)RCP 4.5 (1.1 to 2.6°C)RCP 6.0 (1.4 to 3.1°C)RCP 8.5 (2.6 to 4.8°C)
Triassic
Cretaceous
Neogene Paleogene
Jurassic
Permian
(Caption appears on following page)
766 McElwain
Ann
u. R
ev. P
lant
Bio
l. 20
18.6
9:76
1-78
7. D
ownl
oade
d fr
om w
ww
.ann
ualr
evie
ws.
org
Acc
ess
prov
ided
by
Uni
vers
idad
de
Cos
ta R
ica
(UC
R)
on 0
2/21
/19.
For
per
sona
l use
onl
y.
PP69CH28_McElwain ARI 7 April 2018 9:39
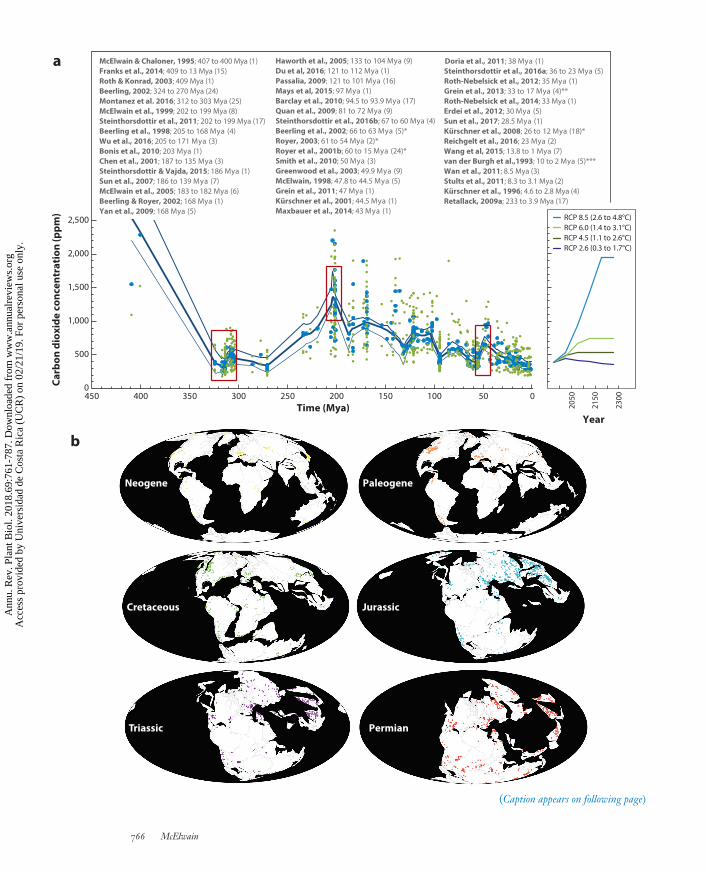
Figure 2 (Figure appears on preceding page)
(a) A record of atmospheric carbon dioxide concentration ( pCO2) in parts per million (ppm) during the Phanerozoic based on 47independent, stomatal-based CO2 proxy studies (7, 10, 12, 14, 23, 29, 34, 42, 43, 46, 52, 57, 63–65, 68, 82, 83, 92–95, 100, 106, 114,119, 122, 123, 125–128, 132, 135, 140, 143–145, 149–151, 160–162, 177, 178, 180). See Reference 52 for a compilation of raw datafrom all of these studies, with the exception of 106, which is added here to produce the Lowess regression (heavy blue line) and upperand lower uncertainty bounds. The number in parentheses after each citation refers to the number of pCO2 estimates generated fromeach study together with the age range of fossils used to reconstruct CO2. Asterisks indicate use of updated data: single asterisk (∗) fordata updated by Beerling et al. (2009); double asterisk (∗∗) for data updated by Roth-Nebelsick et al. (2004); and triple asterisk (∗∗∗) fordata updated by Kurschner et al. (1996). Blue dots represent mean pCO2 levels from individual studies listed in the figure. Small greendots represent the minimum and maximum pCO2 estimates from the same studies. The inset graph plots the projected CO2 rise duringthe next two centuries based on different Representative Concentration Pathways (RCPs) (104) with the anticipated rise in global meantemperature (113). Red boxes highlight the intervals that are a focus of this review. (b) Paleogeographic maps illustrate the occurrenceof fossil plant localities (colored dots) possessing evidence for woody fossil taxa (tracheophytes) in time and space derived from thePaleobiology Database (https://paleobiodb.org, CC BY 4.0 International License). Occurrence data were plotted using thePaleobiology Database on June 15, 2017, using the group name tracheophyta. Note the high proportion of exceptionally high-latitudesites with trees through time. Inset graph in panel a has a noncontinuous scale. Abbreviation: Mya, million years ago.
and how it will respond under anthropogenic global change are biased by a contemporary-onlyview that has insufficient consideration for deep evolutionary history. However, because our cli-mate future will likely be more similar to the Eocene of approximately 50 Mya or stages within theJurassic or Cretaceous (203 to 65 Mya), it has been argued that we should look back and have greaterappreciation for the origin of the modern flora. Many in-depth reviews (25, 30, 99, 139) and books(31, 35, 147, 154) have been dedicated to paleobotany and the evolution of plants. The aim of thissection is to provide a brief overview of the past 420 million years of vascular plant evolution thathave relevance for, and should be considered in the context of, vegetation responses to contempo-rary global change. The following six lessons have been gleaned from the deep-time fossil record.
1. All living species, with the exception of those that originated during the past century, natu-rally or through human intervention, have survived an approximately 20-million-year win-dow of time when the atmospheric CO2 concentration has been at its lowest level (lessthan approximately 300 ppm)—that is, during the past 304 million years since the LatePennsylvanian ice age (Figures 1 and 2). Unsurprisingly, this 20-million-year window oflow atmospheric CO2 was accompanied by the lowest mean global temperatures recordedduring the past 400 million years (52, 180). Therefore, our contemporary global flora areadapted to low CO2 in relative terms and, remarkably, have survived global cooling and de-clines in atmospheric CO2 since the Eocene–Oligocene boundary (approximately 34 Mya.)without exceeding normal background levels of extinction (99, 117, 166). This suggests thatthe vast majority of plant species are resilient and adaptable to climate and atmosphericchanges, given sufficient time.
2. Among modern flora are families, genera, and species that have exceptionally long evolution-ary histories dating back to the Mesophytic era of plant evolution (Figure 1) when elevatedCO2 and equable global temperatures prevailed (Figure 2). These are predominantly vascu-lar seed plants within the gymnosperms. However, this grouping also includes vascular spore-bearing taxa, which although they may have originated during the icehouse climate of theCarboniferous and early Permian, are lineages that have survived up to the present. All theselineages experienced nearly 230 million years of Earth’s history when CO2 was considerablyelevated above present levels (e.g., >500 ppm). Thus, despite the fact that all of the longest-lived lineages have survived the past 20 million years of relatively low CO2, they are likelymore adapted to a high CO2 atmosphere, such as that predicted to occur during the next fewcenturies, than are very recently evolved lineages (such as many angiosperms) that lack the
www.annualreviews.org • Paleobotany and Global Change 767
Ann
u. R
ev. P
lant
Bio
l. 20
18.6
9:76
1-78
7. D
ownl
oade
d fr
om w
ww
.ann
ualr
evie
ws.
org
Acc
ess
prov
ided
by
Uni
vers
idad
de
Cos
ta R
ica
(UC
R)
on 0
2/21
/19.
For
per
sona
l use
onl
y.
PP69CH28_McElwain ARI 7 April 2018 9:39
RepresentativeConcentrationPathway (RCP):four future greenhousegas trajectoriesproposed by theIntergovernmentalPanel on ClimateChange
Paleocene–Eocenethermal maximum(PETM): the timingof a rapid globaltemperature warmingat the boundary of thePaleocene and Eoceneepochs around55.5 Mya
genetic memory of super-greenhouse conditions. It is highly likely that many gymnospermsand pteridophytes with the oldest geological origins are preadapted to our climate future(45, 102, 179). These include taxa in which the carbon assimilation rates today (<400 ppm)are strongly limited by CO2 diffusion from the atmosphere to the site of carboxylation at thechloroplast, due to either low stomatal or mesophyll conductance (102, 108, 109). Both the-oretical studies (109) and experimental observations (102) project that diffusion-limited taxawill benefit more significantly from future increases in CO2 and will have strong increasesin carbon assimilation rates than those with high stomatal or mesophyll conductance.
3. The grass family, Poaceae, to which all grass-based food crops (such as wheat, barley, andrice) belong, originated relatively recently, approximately 65 Mya during the Late Creta-ceous (148). Grass-dominated biomes—such as steppes, prairies, and savannahs—have anexceptionally recent origin in the context of land plant evolution, expanding globally in themajority of continents during the Late Eocene to Oligocene (<35 Mya) (148), concurrentlywith falling CO2 levels (Figure 2 and references therein), declining global temperature, andincreasing continental aridity. Therefore, in relative terms and in the context of long-termclimatic and atmospheric history, the evolutionary success of grasses occurred under thedeclining atmospheric CO2 that led to our current icehouse. Prior to the origin of grass-dominated ecosystems, savannahs of pteridophytes (ferns and Equisetales) prevailed whereclimate conditions did not support fully wooded vegetation.
4. It is clear from a wealth of paleobotanical studies (69, 97, 120, 121, 148, 166) that pa-leobiomes have waxed and waned in lockstep with global climate over geological time(Figure 1). A few observations from these studies stand out. First, during times of highatmospheric CO2 concentrations and global warmth, the temperature gradient betweenthe equator and pole is shallow (Figure 3), which results in fewer (<5) distinct vegetationbiomes compared with today’s 10 biomes in an icehouse climate (Figure 1). Second, basedon current understanding of atmospheric composition using stomatal proxy records, it ap-pears that a tropical rainforest biome was absent from the low latitudes when atmosphericCO2 was higher than approximately 700 ppm (Figures 1 and 2, and references therein).According to the future carbon use projections in Representative Concentration Pathway(RCP) 6, CO2 will reach 700 ppm by 2150, and RCP 8.5 projects that this level will bereached well within this century (Figure 2) (113). Further paleobotanical studies are ur-gently required to establish whether such an apparent CO2 threshold for the existence of atropical everwet biome (tropical rainforest) is robust or whether its absence for much of theMesophytic was due to the fact that the traits that are used to define our understanding ofa modern tropical rainforest, such as high leaf-vein density (25), had not yet evolved in thegymnosperm-dominated taxa of the Mesophytic. Alternatively, there is also a chance thata tropical rainforest biome was present in the Mesophytic but remains undetected becauseof an absence of fossils, localities, or both in the low tropical latitudes (Figure 2) or be-cause existing fossil plant assemblages have been wrongly classified in terms of their biomecharacterization.
Palynological (or palynomorph, meaning pollen and spore) studies of low-latitude tropi-cal rainforests with modern characteristics have shown that they date back to the Paleo-cene (75, 78, 174). It appears that these forests survived the extreme global warmingevent of approximately 5 to 8◦C MAT during more than 200,000 years at the Paleocene–Eocene thermal maximum (PETM) (103) 56 Mya, with little evidence of extinction, butinstead showed a strong signal of resilience. In the tropics of Colombia and westernVenezuela, a palynological study suggested that tropical rainforest vegetation increaseddiversity in response to global warming at the PETM (76). This finding strongly contradicts
768 McElwain
Ann
u. R
ev. P
lant
Bio
l. 20
18.6
9:76
1-78
7. D
ownl
oade
d fr
om w
ww
.ann
ualr
evie
ws.
org
Acc
ess
prov
ided
by
Uni
vers
idad
de
Cos
ta R
ica
(UC
R)
on 0
2/21
/19.
For
per
sona
l use
onl
y.
PP69CH28_McElwain ARI 7 April 2018 9:39
Fossil forest 1
Modern
Eocene
Fossil forest 1 profile
Fossil forest 2
Fossil forest 2 profile
25 m
40 m
0
5
10
15
20
25
30
35
40
90°S60°S0
MA
T (°
C)
–60
–40
–20
0
20
40a c
b
MA
T (°
C)
30°S30°N60°N90°NLatitude
90°S60°S0 30°S30°N60°N90°NLatitude
Land surface MAT (modeled)Land surface MAT (from proxies)Tropical sea surface temperatures (from proxies)Tropical sea surface temperatures (modeled)
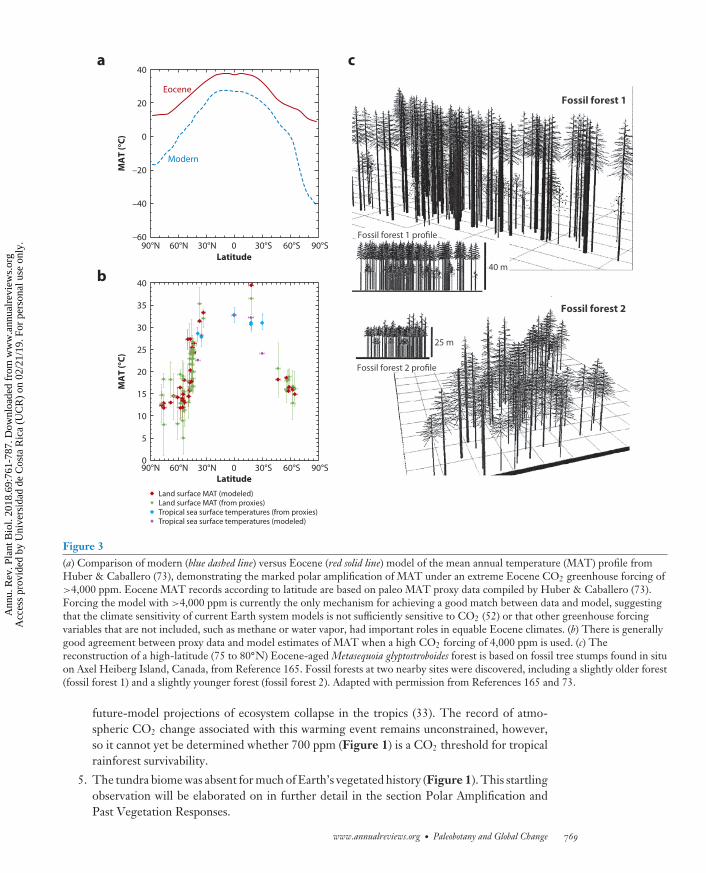
Figure 3(a) Comparison of modern (blue dashed line) versus Eocene (red solid line) model of the mean annual temperature (MAT) profile fromHuber & Caballero (73), demonstrating the marked polar amplification of MAT under an extreme Eocene CO2 greenhouse forcing of>4,000 ppm. Eocene MAT records according to latitude are based on paleo MAT proxy data compiled by Huber & Caballero (73).Forcing the model with >4,000 ppm is currently the only mechanism for achieving a good match between data and model, suggestingthat the climate sensitivity of current Earth system models is not sufficiently sensitive to CO2 (52) or that other greenhouse forcingvariables that are not included, such as methane or water vapor, had important roles in equable Eocene climates. (b) There is generallygood agreement between proxy data and model estimates of MAT when a high CO2 forcing of 4,000 ppm is used. (c) Thereconstruction of a high-latitude (75 to 80◦N) Eocene-aged Metasequoia glyptostroboides forest is based on fossil tree stumps found in situon Axel Heiberg Island, Canada, from Reference 165. Fossil forests at two nearby sites were discovered, including a slightly older forest(fossil forest 1) and a slightly younger forest (fossil forest 2). Adapted with permission from References 165 and 73.
future-model projections of ecosystem collapse in the tropics (33). The record of atmo-spheric CO2 change associated with this warming event remains unconstrained, however,so it cannot yet be determined whether 700 ppm (Figure 1) is a CO2 threshold for tropicalrainforest survivability.
5. The tundra biome was absent for much of Earth’s vegetated history (Figure 1). This startlingobservation will be elaborated on in further detail in the section Polar Amplification andPast Vegetation Responses.
www.annualreviews.org • Paleobotany and Global Change 769
Ann
u. R
ev. P
lant
Bio
l. 20
18.6
9:76
1-78
7. D
ownl
oade
d fr
om w
ww
.ann
ualr
evie
ws.
org
Acc
ess
prov
ided
by
Uni
vers
idad
de
Cos
ta R
ica
(UC
R)
on 0
2/21
/19.
For
per
sona
l use
onl
y.
PP69CH28_McElwain ARI 7 April 2018 9:39
6. Finally, the current differentiation of biomes into 10 distinctive vegetation units is a distinctlymodern phenomenon that likely had its origin in the Miocene, only 11 Mya (Figure 1) (166).
POLAR AMPLIFICATION AND PAST VEGETATION RESPONSES
Greenhouse gas–induced global change will not result in equivalent warming levels in all partsof the world. Due to a phenomenon referred to as polar amplification, the Earth’s poles havewarmed (72) and will continue to warm at a faster rate and reach a higher magnitude of relativewarming than the average planetary warming (138). This is because heat is readily transportedpoleward by oceans and the atmosphere due to positive feedback effects involving snow cover,albedo, vegetation, soot, and algal cover in the Arctic and Antarctic, and to many other Earthsystem phenomena that appear to amplify polar warming as the greenhouse gas concentration inthe atmosphere rises (for a detailed review, see 138). The question is, Will global change havea disproportionate impact on plant biology, ecosystem function, ecology, and feedback in thehighest latitudes of our planet due to the phenomenon of polar amplification?
Recent, historical satellite data sets document the greening of the tundra biome (79), therange expansion of woody shrub (107) and tree taxa (reviewed in 28) into tundra systems, anda general increase in woody plant biomass and relative abundance (107). Considerable scientificeffort is focusing on how such vegetation changes will feed back to the Arctic climate system viachanges in carbon sequestration and the water cycle and changes to surface irradiance (reviewedin 107). Increasing shrubiness has likely already had an unexpected negative impact on herbivorepopulations, such as caribou, by decreasing browse quality (48). Furthermore, field-based evidencefor woody plant responses to amplified Arctic warming is not all positive. Reduced tree growthhas been observed for some taxa due to drought-induced stress (6) and negative biotic interaction,such as bark beetle infestation. Satellite normalized difference vegetation index data have recordedareas of browning that indicate productivity loss as well as greening in Arctic vegetation (79).Furthermore, a large percentage of Arctic vegetation among all plant functional types has shownno perceptible change in productivity in response to contemporary global change (79). Owingto the fact that shifts in ecological composition, the ecophysiological function of vegetation, orboth can have a large impact on the climate and on the biotic system as a whole, it is importantto predict whether short-term temporal trends in Arctic vegetation change will continue underCO2-induced global warming. The paleobotanical record of high Arctic floras may provide broadinsight into these questions.
The geological record is replete with high polar fossil floras demonstrating fully wooded ecosys-tems at paleolatitudes as high as 79◦N (62, 142, 163, 165) and 75◦S (36, 47, 53, 80, 115, 118),ranging in age from 290 Mya in the Permian Antarctic (153) to approximately 23 Mya (earlyMiocene) in the Arctic (71) and to approximately 37 Mya in the Antarctic (late Eocene) (Figure 2)(156). Collectively, these polar fossil forests demonstrate that fully wooded terrestrial ecosystemswith tree densities similar to modern forests, occurring today at temperate and tropical latitudes(115, 165), can be sustained in the high Arctic and Antarctic when the global atmospheric CO2
concentration is >500 ppm (Figure 2 and references therein) and greenhouse-induced forcing of5 W/m2 is evident (52). The presence of high-latitude forests in the geological past also highlightsthe extreme vulnerability of the contemporary tundra biome, which is notable for its apparentabsence for millions of years of Earth history during times of high global warmth and elevatedCO2 concentrations (Figures 1 and 2). Based on biome reconstructions (Figure 1) (166) andthe documented presence of polar forests (Figure 2), it appears that the tundra biome as definedtoday did not exist for the majority of the Mesophytic era of vascular plant evolution and the early
770 McElwain
Ann
u. R
ev. P
lant
Bio
l. 20
18.6
9:76
1-78
7. D
ownl
oade
d fr
om w
ww
.ann
ualr
evie
ws.
org
Acc
ess
prov
ided
by
Uni
vers
idad
de
Cos
ta R
ica
(UC
R)
on 0
2/21
/19.
For
per
sona
l use
onl
y.
PP69CH28_McElwain ARI 7 April 2018 9:39
Cenophytic up to the time of the inception of Antarctic ice sheets at around the Eocene–Oligoceneboundary, approximately 34 Mya (180).
Paleobotanical studies have demonstrated that during the early Eocene (56 to 49 Mya), a timeof peak sustained global warmth during the past 65 million years (Figure 3) (73), the Arctic Oceanwas ice free (Figure 1) and fringed by a mosaic of mixed deciduous (Carya, Liquidambar, Ulmus,Larix), evergreen (Picea, Pinus), and swamp (Metasequoia, Glyptostrobus) forests (62), and teemingwith high densities of the aquatic fern Azolla (8). Estimated canopy heights of between 25 and40 m have been reconstructed for Metasequoia forests at 79◦N, with aboveground paleoproductivityestimates ranging from 2.8 to 5.5 Mg/(ha·year) (Figure 3), which is thought to be similar to thatobserved today in old growth temperate rain forests in the north Pacific (165). The presence ofAzolla is attributed to high levels of runoff into the Arctic Ocean resulting in a sufficient fresheningof the seawater or the development of a freshwater cap suitable for its survival and proliferation (27,32). Substantially higher precipitation in the Arctic than modern levels is also supported by isotopicanalyses of fossil tree rings (136) and leaf physiognomy studies (163), although the definition of theseasonal pattern of rainfall remains disputed—that is, whether it was predominantly summerwet(136) or year round (163). The eventual demise of Azolla in the Arctic Ocean is attributed toreduced runoff and a slight salinity increase (8).
The presence of a freshwater fern in the Eocene Arctic Ocean is a remarkable demonstrationof the possible consequences of global change in Arctic terrestrial ecosystems and of thresholdbehavior linking terrestrial and ocean systems via runoff (27). Numerous Earth system modelspredict increased global runoff under future elevated concentrations of CO2 as a direct responseto reduced transpiration of global vegetation (60). Although the Eocene Azolla studies have notconsidered that physiological forcing of the climate by Arctic vegetation affected fluctuations inrunoff and, instead, attributed changes to altered precipitation patterns and amount alone, sucha study is warranted and possible through the examination of fossil cuticle archives in Arcticfossil floras. Such studies are discussed later in this review, with a case example from the lateTriassic mass-extinction event (approximately 200 Mya). An interesting side note is that Azolla isnow considered a potential candidate taxa for negative carbon emission measures because of itsphenomenal growth rate and carbon sequestration potential.
Based on overwhelming paleobotanical evidence, it is highly likely that the current northwardmigration of woody tree and shrub taxa into the Arctic, along with the general greening (reviewedin 28, 107), will continue and, in doing so, will drive positive feedback of the climate system thatwill further accelerate the warming and wetting of the Arctic (74, 163). In the past, high polarforests had carbon sequestration potentials (13, 115, 131, 165) equivalent to those of the muchlower temperate latitudes, and they impacted the hydrological cycle sufficiently to alter ecologicaldominance patterns within oceans (8, 27). These findings from paleobotanical studies suggest thatthe role of Arctic vegetation in the global biogeochemical cycling of water and carbon will becomeincreasingly important if we continue on a path of intense petroleum use.
PAST GLOBAL CHANGE AND IMPACTS ON PLANTCOMMUNITY COMPOSITION
Future global change is predicted to alter the ecological composition of plant communities be-cause species are highly individualistic in their responses to climate change. Species differences inmigration rate, invasive capacity, resilience in the face of climate change, and extinction tolerancewill all result in the emergence of plant communities that have no past or modern analogs and thatoccupy climate envelopes or niches that may not have a historical or modern precedent. Whatwill these future communities look like? This complex question can be addressed using different
www.annualreviews.org • Paleobotany and Global Change 771
Ann
u. R
ev. P
lant
Bio
l. 20
18.6
9:76
1-78
7. D
ownl
oade
d fr
om w
ww
.ann
ualr
evie
ws.
org
Acc
ess
prov
ided
by
Uni
vers
idad
de
Cos
ta R
ica
(UC
R)
on 0
2/21
/19.
For
per
sona
l use
onl
y.
PP69CH28_McElwain ARI 7 April 2018 9:39
Free-air CO2enrichment (FACE):in situ open-airelevated CO2experiments wheremature establishednative vegetation orcrops are exposed toelevated CO2treatments over longdurations andcompared withambient CO2 controls
approaches that include, but are not limited to, climate niche modelling and in-situ field-basedexperiments with elevated CO2 concentrations, such as free-air CO2 enrichment (FACE) studies,demographic modeling, examination of plant trait relationships along spatial gradients of MATand MAP, and comparative ecophysiological modeling and experimentation. Rarely are insightsfrom the pre-Quaternary paleobotanical record incorporated or discussed in the context of thesedifferent methodologies. In the next section, I briefly review some of the key findings from thesestudies of contemporary vegetation and examine predictions of future plant community–level re-sponses to global change in the context of the paleocommunity responses to past global change.Does the fossil plant record support or refute some of the landmark findings and predictions ofmodern ecological and ecophysiological studies?
Extinction, Migration, and Past Global Change
The deep-time fossil record paints a picture of remarkable resilience in the face of extreme cli-mate change that surpasses in magnitude both contemporary and future predicted mean globalterrestrial temperature rises (76, 99, 166, 170). However, one important distinction is that the rateof anthropogenic climate change far exceeds that of any well-characterized greenhouse-inducedglobal warming event in the deep geological past. Plant family- and generic-level extinctions arerare in the fossil record even at the big five mass extinction boundaries, which recalibrated theevolutionary clock of the animal kingdom with family-level extinctions of more than 50% (166).Some of the best-studied intervals of global change in the fossil plant record include the Triassic–Jurassic boundary, 201.36 ± 0.17 Mya (175); the PETM, 56 Mya; and the Eocene–Oligoceneboundary, 33.9 Mya. The first two events represent rapid greenhouse gas–induced global warmingepisodes; the last coincides with the initiation of the Antarctic ice sheet and global cooling leadingto our current icehouse. Therefore, I focus on the first two events and the common patterns thathave emerged from studying them, despite the fact that they are separated by millions of years ofplant evolution and, thus, are characterized by vastly different phylogenetic landscapes from eachother and from the modern world.
Analyses of the Triassic–Jurassic boundary and the PETM have documented clear evidenceof local extinction, but not global extinction, and both intra- and intercontinental-scale migra-tion resulting in dramatically altered plant community composition and dominance patterns (76,90, 98, 103). During the PETM, compositional shifts in terrestrial vegetation were marked buttransient in temperate latitudes (103) and long-lived in the tropics (76). High temperatures andlikely increased aridity in the North American temperate biomes resulted in geologically rapidcompositional changes as local mixed deciduous and evergreen forest taxa—such as Betula, Lau-rus, Ulmus, Cercidiphyllum, Carya, and Taxodium—decreased in relative abundance, and southernsubtropical Leguminosae expanded their range northward by up to 1,000 km (103). A somewhatsurprising finding in the tropics was an increase in standing diversity as global temperatures roseby 5◦C within 10,000 to 20,000 years but tropical precipitation remained at least stable, resultingin only muted levels of extinction and a large increase in originations (103). However, despitelow extinction rates, significant compositional shifts are evident in the tropical pollen and sporerecords at the PETM (76) and during the End-Triassic (90). These paleo examples strongly sug-gest that global warming has a marked effect on the composition of terrestrial plant communitiesthat is driven predominantly by migration rather than extinction. Admittedly, it is difficult to drawparallels with Anthropocene warming and vegetation responses because they are occurring at aminimum of 20 times faster than any past warming episode in Earth’s history (reviewed in 40).A rough comparison of climate velocities (the distance per unit of time that a species needs tomigrate to keep within its existing climate envelope) for the PETM (0.05 to 0.1 km/year, based on
772 McElwain
Ann
u. R
ev. P
lant
Bio
l. 20
18.6
9:76
1-78
7. D
ownl
oade
d fr
om w
ww
.ann
ualr
evie
ws.
org
Acc
ess
prov
ided
by
Uni
vers
idad
de
Cos
ta R
ica
(UC
R)
on 0
2/21
/19.
For
per
sona
l use
onl
y.
PP69CH28_McElwain ARI 7 April 2018 9:39
172) and that predicted for the end of this century under an RCP 8.5 scenario [0.5 to 128 km/year(40, 88)] identifies a stark mismatch between what the fossil record demonstrates is possible andwhat future predictions indicate will be necessary for taxa to remain within their climate niches.Closer examination of an alternative future scenario with less elevated CO2 concentrations (andclimate velocities of 0.01 to 12 km/year) (40, 88) provides some hope, however, as PETM climatevelocities at least map onto the lower range of future predictions.
Paleobotany, Adaptation, and Past Global Change
Plants have alternative strategies for surviving global change beyond migrating and maintainingtheir existing climate envelope, including acclimation and adaptation. However, investigating theadaptive capacity of individual species is complex because it requires observations of multiplegenerations and, therefore, requires experiments of long duration, which are rarely feasible. Al-ternatively, space-for-time studies are often employed using the spatial gradients in MAT, MAP,or both as surrogates for climate change; however, these studies are limited because they cannotaccount for the impact of anthropogenic CO2 rise. Paleobotanical studies offer a means of exam-ining plants’ capacity to adapt to global change on timescales of tens of thousands to millions ofyears and, perhaps more importantly, help to define the limits of species’ environmental tolerancein the geological past. An important set of prerequisites for such fossil-based studies is that (a) themagnitude and pace of paleoenvironmental change is well characterized from plant-based proxiesand independently verified with nonplant-based proxy approaches so that circularity is avoided,and (b) multiple fossil plant beds are preserved in the same geological sections, thus offeringregular snapshots of plant community composition, paleophysiology, and diversity from before,during, and after the global change interval. Such fossil localities provide rare study systems wherespecies-, generic-, and community-level attributes that provide measures of ecosystem stabilityand resilience can be tracked in response to past global change. They can also be examined toelucidate traits that increase extinction risk and those likely to confer resilience in the face ofglobal change, both of which may have relevance for current conservation efforts. One studysystem that has yielded a wealth of data relevant to contemporary issues of climate change andvegetation responses occurs at a field locality called Astartekløft in East Greenland. This fossilplant locality preserves sediments and fossil plant beds within the Kap Stewart Group that spanthe End-Triassic mass extinction event (ETE) and the ensuing recovery interval that occurred inthe Earliest Jurassic (Figure 2).
The End-Triassic Mass Extinction Event
The ETE, dated at 201.56 Mya (175), was the third greatest faunal mass extinction event in Earth’shistory (137). It is characterized by an episode of intense CO2-induced global warming (98) thatwas triggered by both intrusive and extrusive volcanism (reviewed in 38) associated with the CentralAtlantic Magmatic Province. Atmospheric CO2 and global temperature changes associated withthe ETE are well characterized from multiple proxy sources, and they document a geologicallyrapid trebling of CO2 concentrations from pre-excursion levels of approximately 600 ppm to levels>2,000 ppm (Figures 2 and 4) (23, 94, 135, 143, 177). These paleo CO2 estimates were made usingthe stomatal-based proxy method applied to Triassic and Jurassic fossil cuticles from Greenland(94, 143), Sweden (94), Germany (23), Northern Ireland (143), and China (177), and they wereindependently verified from fossil soil–based proxies (135). The End-Triassic global change eventoccurred at a substantially slower pace than contemporary anthropogenic CO2 increases, and itwas initiated at a time when the pre-excursion atmospheric CO2 concentration was higher than
www.annualreviews.org • Paleobotany and Global Change 773
Ann
u. R
ev. P
lant
Bio
l. 20
18.6
9:76
1-78
7. D
ownl
oade
d fr
om w
ww
.ann
ualr
evie
ws.
org
Acc
ess
prov
ided
by
Uni
vers
idad
de
Cos
ta R
ica
(UC
R)
on 0
2/21
/19.
For
per
sona
l use
onl
y.
PP69CH28_McElwain ARI 7 April 2018 9:39
0
1,000
2,000
3,000
4,000
pCO
2 (pp
m)
0
1
2
3
4
5
Ecol
ogic
al c
ompo
siti
on(D
CA 1
)
30
40
50
60
70
0 1,000 2,000 3,000 4,000 5,000 6,000 7,000 8,000 9,000 10,000
Pale
olat
itud
e si
gnal
(°N
)
Height in cliff section (cm)
Immigration fromlower latitudes
Peak extinction and global warmthPeak extinction and global warmthPeak extinction and global warmth
Generic diversity
(number of fossil plant genera)
30
20
40
Triassic Jurassic
a
b
c
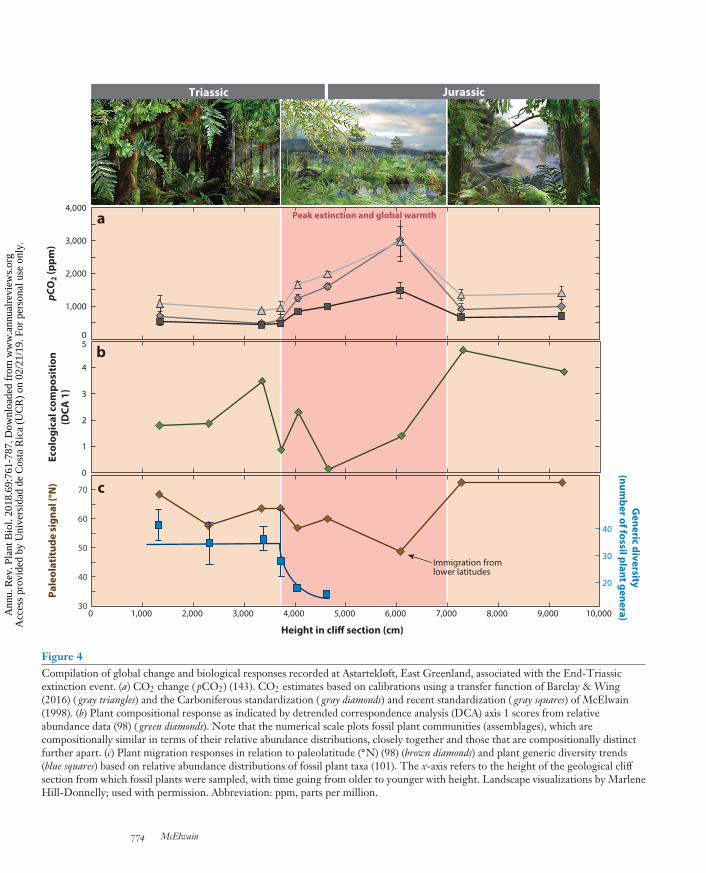
Figure 4Compilation of global change and biological responses recorded at Astartekløft, East Greenland, associated with the End-Triassicextinction event. (a) CO2 change ( pCO2) (143). CO2 estimates based on calibrations using a transfer function of Barclay & Wing(2016) ( gray triangles) and the Carboniferous standardization ( gray diamonds) and recent standardization ( gray squares) of McElwain(1998). (b) Plant compositional response as indicated by detrended correspondence analysis (DCA) axis 1 scores from relativeabundance data (98) ( green diamonds). Note that the numerical scale plots fossil plant communities (assemblages), which arecompositionally similar in terms of their relative abundance distributions, closely together and those that are compositionally distinctfurther apart. (c) Plant migration responses in relation to paleolatitude (◦N) (98) (brown diamonds) and plant generic diversity trends(blue squares) based on relative abundance distributions of fossil plant taxa (101). The x-axis refers to the height of the geological cliffsection from which fossil plants were sampled, with time going from older to younger with height. Landscape visualizations by MarleneHill-Donnelly; used with permission. Abbreviation: ppm, parts per million.
774 McElwain
Ann
u. R
ev. P
lant
Bio
l. 20
18.6
9:76
1-78
7. D
ownl
oade
d fr
om w
ww
.ann
ualr
evie
ws.
org
Acc
ess
prov
ided
by
Uni
vers
idad
de
Cos
ta R
ica
(UC
R)
on 0
2/21
/19.
For
per
sona
l use
onl
y.
PP69CH28_McElwain ARI 7 April 2018 9:39
Bennettitales: anextinct group of seedplants with unisexualor bisexual flower-likereproductivestructures; diverse andgeographicallywidespread from theEarly Triassic to EarlyCretaceous
Pangea:a supercontinent madeup of Eurasia, Africa,North and SouthAmerica, Australia,Antarctica, and Indiathat existed betweenapproximately 355 and170 Mya
today (approximately 600 ppm). However, the total estimated magnitude of CO2 increase thatprevailing plants were exposed to (e.g., an addition of approximately, 1,740 ppm) is similar to thatexpected by the year 2250 under RCP 8.5 (e.g., an addition of approximately 1,660 ppm betweenpreindustrial years and the year 2100) (Figure 4). If more conservative estimates of Late TriassicCO2 rise are considered (e.g., an addition of 990 ppm to the Late Triassic atmosphere), an equiv-alent magnitude of CO2 rise will occur well before 2150 under an RCP 8.5 scenario (Figure 4).Therefore, the Late Triassic global warming event occurred at a considerably slower pace (12times slower than RCP 2.6 and a whopping 280 times slower than RCP 8.5) than modern globalwarming, but the event had a greater overall magnitude than contemporary anthropogenic forc-ing. Although it is an imperfect analog, it highlights the acuteness of current global change andprovides a window through which to study the adaptive capacity of plant traits, species, and wholecommunities in the past.
Case Study of Past Global Change: Astartekløft, East Greenland
Paleobotanical studies indicate that forested, gymnosperm-dominated ecosystems at Astartekløft,East Greenland, underwent rapid compositional shifts during the Late Triassic as atmosphericCO2 reached 1,000 ppm (94), which was followed by 85% species-level turnover coincident witha further CO2 rise to 1,500 ppm (94, 143). Although only one plant family suffered global extinc-tion, extirpation was marked at the species level (98, 158, 159), on the basis of detailed study ofmacrofossils (mainly fossil leaves), and at the generic level (112), on the basis of detailed study ofpalynomorphs (fossil pollen and spores).The extinction of reproductive specialists ranged fromregional extinction (Bennettitales) to global extinction (Lepidopteris), whereas wind-pollinated gen-eralists proliferated in the aftermath of the species turnover event (ferns and fern allies, Ginkgoales)in East Greenland and Southern Sweden (90, 98). In other regions of the supercontinent Pangeaand in East Greenland, the ETE is marked by a geologically transient ecological dominance offerns and fern allies (87) belonging to extant fern families, many of which today have exclusivelytropical and subtropical biogeographical distributions. Thermophilic conifers belonging to theextinct Cheirolepidiaceae family became dominant in the continental interiors in many globallocalities (22), perhaps aided by widespread fire disturbance (15) and their likely capacity forwhole-genome duplication (81), which is generally rare in gymnosperms.
Therefore, the pattern of global vegetation responses under super-elevated CO2 is character-ized by a loss of evenness (101) and local-to-regional–scale turnover (22, 87, 90, 98), but remarkablylittle global extinction at higher taxonomic ranks (30, 166). Competition was the predominant fac-tor shaping the assembly of communities under progressively rising CO2 concentrations, and theecological dominance of some taxa increased sharply (101). Rare taxa appeared to be preferentiallylost from the Late Triassic ecosystems of East Greenland as a result of rising CO2 (101). Thisdeep-time case study supports many of the predictions of ecological theory about how communitiesrespond to environmental stress but do so on evolutionary timescales. The studies also highlightthe idea that catastrophic predictions of a dead zone future Earth are likely unfounded but thatdramatic ecological shifts should be expected. Modern global change is occurring at a much fasterpace than that characterizing the ETE; however, there is strong evidence for widespread transientmigration to higher latitudes in the Northern Hemisphere that coincided with the zenith of CO2
rise and global warming (90, 98), similar to the pattern seen at the PETM in North America(103, 171, 173). A rough calculation based on the macrofloras in East Greenland documented theoccurrence of species usually found at paleolatitudes of 45◦N occurring >2,000 km northward infossil localities higher than 65◦N during the peak global temperature excursion, which coincideswith fossil plant bed 6 at Astartekløft (Figure 4) (98). This migration rate (approximately 0.01 to
www.annualreviews.org • Paleobotany and Global Change 775
Ann
u. R
ev. P
lant
Bio
l. 20
18.6
9:76
1-78
7. D
ownl
oade
d fr
om w
ww
.ann
ualr
evie
ws.
org
Acc
ess
prov
ided
by
Uni
vers
idad
de
Cos
ta R
ica
(UC
R)
on 0
2/21
/19.
For
per
sona
l use
onl
y.
PP69CH28_McElwain ARI 7 April 2018 9:39
Climate velocity: theestimated rate at whicha species must migratealong the Earth’ssurface to maintain aconstant mean annualtemperature underglobal climate change
Maximum stomatalconductance ( gmax):calculated as a functionof stomatal density andpore size; measures themaximum rate atwhich CO2 can diffuseinto a leaf and watercan diffuse out
0.02 km/year) represents a climate velocity at the very lowest estimated rates required by modernfloras to keep pace with anthropogenic climate change under an A1B future CO2 scenario (88).
Despite evidence for a strong pattern of northward migration in the Northern Hemisphere,immigrants accounted for only a small percentage of early Jurassic floras, and within approximately200,000 years, stable forested ecosystems had been reestablished and were predominantly madeup of species that were already present in the forest communities of the latest Triassic (90, 98).Therefore, the major ecological pattern to emerge from both fossil leaf and palynomorph studiesof Astartekløft is generic-level resilience to extreme global warming with lower environmental andecological tolerances at the species level. Furthermore, although migration is evident, suggestingthat species moved to maintain their climate envelope as global and regional temperatures warmed,there is also strong indirect evidence for in situ adaptation in leaf functional traits (4, 5, 15, 94, 141,146) and speciation (66, 98) on 100,000-year timescales in response to the ETE global warmingevent. This is a facet of vegetation response to climate change that is not well accounted for inclimate niche, physiological, or dynamic vegetation models because the prevailing paradigm basedon Quaternary palynological studies assumes climate niche conservatism (164).
TRAIT ADAPTATION AND PHYSIOLOGICAL FEEDBACK
DNA is not preserved in the deep-time fossil record (166). So how can pre-Quaternary-agedfossil plants or parts of them be used to investigate the capacity of a species to adapt to globalchange? This is particularly complicated by the paleobotanical species concept, which is based onmorphological or anatomical traits, or both, which may not be plastic. For example, two fossil plantspecies defined using aspects of their leaf morphology may represent ecotypes providing evidencefor adaptation in response to global change or two separate species in which the speciation eventis completely unrelated to the prevailing global change. Trait-based paleobotanical studies offerone method of addressing this limitation.
Paleoecological studies of important traits relating to the leaf economics spectrum (176) demon-strate the adaptation of leaf mass per area (LMA) in response to CO2-induced global warmingassociated with the ETE (141), PETM (37), and the Cretaceous–Tertiary (21) mass extinctionevent. Soh et al.’s (141) study showed that global warming selected for fossil plant taxa with highLMA following the ETE, thus providing the first evidence on evolutionary timescales that highCO2 selects for an ecological stress tolerance strategy. The widespread dominance of evergreentaxa during the Eocene (157), which likely had high LMA, provides further support for this pat-tern. Soh et al.’s study (141) determined that high plasticity in leaf economics traits, such as LMA,was a clear advantage for the longevity of the genus Ginkgo, a living-fossil taxon that has survivedto the present.
Other examples of important ecophysiological traits that have been tracked in response topast global change include water-use efficiency (11, 39, 54, 168), maximum stomatal conductance( gmax) (55, 84, 102, 169), and xylem conductive capacity (24, 167). Although studies of these typesof traits are in their infancy, results suggest that plants have adapted to past elevated CO2-inducedglobal change by decreasing stomatal conductance (54) and increasing their water-use efficiency,which on geological timescales has had a positive feedback effect on the regional hydrologicalcycle by increasing runoff (146, 168) and on the carbon cycle by changing the sink strength ofthe terrestrial biosphere (106). Differences in the magnitude of the water-use efficiency responseto CO2 among fossil taxa have also significantly impacted the competitive landscape at criticalclimatic thresholds, such as the transitions from interglacial to glacial in the Late Pennsylvanian(168) and elevated to super-elevated CO2 climate states during the ETE (146).
776 McElwain
Ann
u. R
ev. P
lant
Bio
l. 20
18.6
9:76
1-78
7. D
ownl
oade
d fr
om w
ww
.ann
ualr
evie
ws.
org
Acc
ess
prov
ided
by
Uni
vers
idad
de
Cos
ta R
ica
(UC
R)
on 0
2/21
/19.
For
per
sona
l use
onl
y.
PP69CH28_McElwain ARI 7 April 2018 9:39
Predictions from general circulation models (GCM) that have proposed dramatic increasesin future global runoff in response to a doubling of CO2 (20, 60) have been strongly criticizedbased on results from FACE studies at mature temperate forest sites (86, 134). Schafer et al.(134) argued that forest feedback on the hydrological cycle under elevated CO2 concentrationswould be highly dependent on species composition because the directionality and magnitude ofcanopy transpiration responses to elevated CO2 following 3.5 years of exposure were found to bespecies specific. Leuzinger & Korner (86) suggested that the physiological effect of elevated CO2
concentrations on transpiration was much lower than expected from theory and from leaf-levelobservations of stomatal conductance responses to CO2. They argue that the seasonal pattern ofprecipitation was a much more important predictor or determinant of flood risk than physiolog-ical forcing of the hydrological cycle via reduced transpiration in temperate forests. However,when the potential physiological forcing of climate and the hydrological cycle are viewed throughthe lens of paleobotany, the global predictions of enhanced runoff using GCMs are by no meansextreme. A change in river architecture in the Jameson Land basin in East Greenland—fromslow-moving and meandering in the Late Triassic to fast, erosive braided systems in the ear-liest Jurassic—was likely driven by an estimated 50% reduction in canopy-level transpirationunder intense CO2-induced global warming (146). Geological evidence of increased runoff asso-ciated with the ETE includes changes in stream current directions and transient oceanic anoxiain marine sediments (146). Furthermore, within-genus reductions in leaf-level stomatal conduc-tance were accompanied by ecosystem-level shifts in community composition that resulted incommunity-weighted reduction in overall canopy transpiration. Specifically, Late Triassic forestsdominated by Bennettitales with high leaf-level transpiration rates (146) and low LMA (141) werereplaced by dominants from within the Ginkgoales family that had higher LMA and lower leaf-level transpiration. This is an example in which exposure to CO2 over hundreds of thousandsof years resulted in both species-level adaptation (a reduction in stomatal density and pore sizeand hence gmax) and community-level compositional changes (98), which altered the function ofthe vegetation as a whole toward more conservative water use, less recycling of water throughthe vegetation, and, hence, enhanced runoff. These observations on more than 100,000-yeartimescales support predictions from general circulation models of increased runoff due to a re-duction in canopy-level transpiration resulting from elevated CO2 concentrations (60), and theyare contrary to findings from some FACE studies that have been too short to account for com-munity composition changes as well as leaf-level adaptation of functional and economic traits (86,134).
PALEOBOTANICAL INSIGHTS ON CO2 FERTILIZATIONOF PHOTOSYNTHESIS
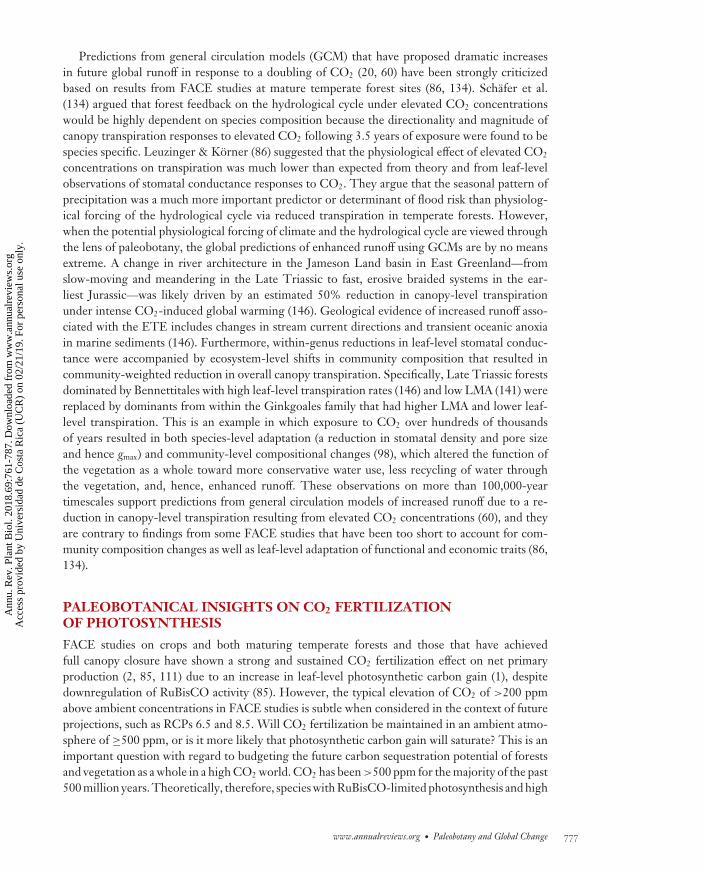
FACE studies on crops and both maturing temperate forests and those that have achievedfull canopy closure have shown a strong and sustained CO2 fertilization effect on net primaryproduction (2, 85, 111) due to an increase in leaf-level photosynthetic carbon gain (1), despitedownregulation of RuBisCO activity (85). However, the typical elevation of CO2 of >200 ppmabove ambient concentrations in FACE studies is subtle when considered in the context of futureprojections, such as RCPs 6.5 and 8.5. Will CO2 fertilization be maintained in an ambient atmo-sphere of ≥500 ppm, or is it more likely that photosynthetic carbon gain will saturate? This is animportant question with regard to budgeting the future carbon sequestration potential of forestsand vegetation as a whole in a high CO2 world. CO2 has been >500 ppm for the majority of the past500 million years. Theoretically, therefore, species with RuBisCO-limited photosynthesis and high
www.annualreviews.org • Paleobotany and Global Change 777
Ann
u. R
ev. P
lant
Bio
l. 20
18.6
9:76
1-78
7. D
ownl
oade
d fr
om w
ww
.ann
ualr
evie
ws.
org
Acc
ess
prov
ided
by
Uni
vers
idad
de
Cos
ta R
ica
(UC
R)
on 0
2/21
/19.
For
per
sona
l use
onl
y.
PP69CH28_McElwain ARI 7 April 2018 9:39
resistance to CO2 diffusion (102, 109) likely had much higher leaf-level saturation of photosyn-thetic rates for much of the past than their ancestors do today in a comparatively CO2-starvedworld.
There is no clear consensus on the deep-time evolution of photosynthesis in vascular plantsfrom studies using proxy estimates from fossil leaves (26, 96, 102) or model estimates derivedfrom fossil leaf traits (54). Similarly, there remains a wide range of opinions on the evolution ofthe productivity of terrestrial ecosystems through time and whether modern systems are the mostproductive (24, 25) or less so than those of the geological past (such as the Eocene), assuming apositive correlation between diversity and productivity (77, 130). What is clear, however, is thatthe total area of forested ecosystems expands dramatically poleward during greenhouse intervals(Figures 1 and 2), which on evolutionary timescales enabled a greater speciation rate duringthe Cenophytic era and likely higher productivity in many biomes because of a species-area effect(77). Therefore, the fossil record of Mesophytic and Cenophytic paleobiome distribution suggeststhat the carbon sequestration potential may increase under moderate greenhouse climates ofbetween 500 and 700 ppm CO2 (Figure 1). However, a detailed carbon stock assessment ofthe Paleophytic era has highlighted the switching of carbon sequestration potential between theglacial and interglacial climate, with glacials surprisingly sequestering more carbon in the tropicsthan during the interglacials (106). Thus, the jury remains out on the CO2 fertilization effectat concentrations >500 ppm. It is essential and possible, now that the boundary atmosphericconditions are better constrained than ever (Figure 2), to undertake a quantitative inventoryof the carbon sequestration potential of the terrestrial biosphere through geological time usinga combination of paleo leaf economics traits and dynamic vegetation modeling to address thiscritical question further.
SUMMARY POINTS
1. The majority of extant plant species, with the exception of those that originated duringthe Anthropocene, have survived a period of approximately 20 million years when theatmospheric CO2 concentration was exceptionally low (<300 ppm) as viewed in thecontext of atmospheric composition during the past 400 million years of Earth’s history.
2. Paleobotanical studies of the tropical rainforest biome suggest that it is much moreresilient to global change than predicted by Earth system models.
3. The widespread occurrence of fully forested ecosystems at high polar latitudes in the ge-ological past during conditions of elevated CO2 concentrations confirms that the tundrabiome is the biome most threatened by future global changes.
4. Paleoclimate data and the presence of polar forests support the concept of the polaramplification of climate during elevated CO2 concentrations.
5. Evidence for enhanced runoff into the Arctic during episodes of past global warmth, suchas the Eocene, support suggestions that high Arctic vegetation will have a much moreimportant role in the biogeochemical cycling of carbon and water toward the end of thiscentury if we continue on a path of profligate fossil fuel use and changes in land use.
6. The estimated climate velocities for plant migration associated with the PETM and ETEglobal warming events were much slower than those that are believed to be required forextant taxa to keep pace with future climate change based on future worst-case carbon-usescenarios, such as RCP 8.5.
778 McElwain
Ann
u. R
ev. P
lant
Bio
l. 20
18.6
9:76
1-78
7. D
ownl
oade
d fr
om w
ww
.ann
ualr
evie
ws.
org
Acc
ess
prov
ided
by
Uni
vers
idad
de
Cos
ta R
ica
(UC
R)
on 0
2/21
/19.
For
per
sona
l use
onl
y.
PP69CH28_McElwain ARI 7 April 2018 9:39
7. The pace of Anthropocene climate change is without geological precedent, yet past globalchange events of much greater overall magnitude are evident in the fossil plant record.
8. Catastrophic predictions of a future dead zone planet Earth and direct climate-drivenextinctions are unfounded based on evidence from the plant fossil record; however, dra-matic ecological shifts in dominance patterns should be expected.
9. Trends in paleoproductivity based on evidence from the plant fossil record and theevolution of photosynthesis remain hotly debated and are important areas for futureresearch.
10. Overall, the Earth’s vegetation is much more resilient to global change than manycontemporary-only studies would predict because the fossil record demonstrates thatmany taxa are preadapted to our climate future and others can adapt in situ, and manythat have unchangeable climatic envelopes likely have climate velocities that are just aboutsufficient to keep pace with future global change as long as we take a more sustainablepath of future carbon use.
DISCLOSURE STATEMENT
The author is not aware of any affiliations, memberships, funding, or financial holdings that mightbe perceived as affecting the objectivity of this review.
ACKNOWLEDGMENTS
Shanan E. Peters is thanked for generating the fossil plant occurrence maps through time forFigure 2 from The Paleobiology Database (https://paleobiodb.org/#/). Funding from ScienceFoundation Ireland is gratefully acknowledged (grant number 11/PI/1103). Joseph White andIsabel Montanez are thanked for discussions on the subject of this invited review.
LITERATURE CITED
1. Ainsworth EA, Long SP. 2005. What have we learned from 15 years of free-air CO2 enrichment (FACE)?A meta-analytic review of the responses of photosynthesis, canopy properties and plant production torising CO2. New Phytol. 165:351–71
2. Ainsworth EA, Rogers A. 2007. The response of photosynthesis and stomatal conductance to rising[CO2]: mechanisms and environmental interactions. Plant Cell Environ. 30:258–70
3. One of the earliestpapers highlighting theimportance of plantevolution foratmospheric carbonsequestration viachemical weathering.
3. Algeo TJ, Scheckler SE. 1998. Terrestrial-marine teleconnections in the Devonian: links be-tween the evolution of land plants, weathering processes, and marine anoxic events. Philos.Trans. R. Soc. B 353:113–28
4. Bacon KL, Belcher CM, Haworth M, McElwain JC. 2013. Increased atmospheric SO2 detected fromchanges in leaf physiognomy across the Triassic-Jurassic boundary interval of East Greenland. PLOSONE 8:e60614
5. Bacon KL, Belcher CM, Hesselbo SP, McElwain JC. 2011. The Triassic-Jurassic boundary carbon-isotope excursions expressed in taxonomically identified leaf cuticles. Palaios 26:461–69
6. Barber VA, Juday GP, Finney BP. 2000. Reduced growth of Alaskan white spruce in the twentiethcentury from temperature-induced drought stress. Nature 405:668
7. Demonstratesimportant linkagesbetween geologicalprocesses such asvolcanism, atmosphericCO2 concentration, andanoxia in the world’soceans.7. Barclay RS, McElwain JC, Sageman BB. 2010. Carbon sequestration activated by a volcanic CO2
pulse during Ocean Anoxic Event 2. Nat. Geosci. 3:205–8
www.annualreviews.org • Paleobotany and Global Change 779
Ann
u. R
ev. P
lant
Bio
l. 20
18.6
9:76
1-78
7. D
ownl
oade
d fr
om w
ww
.ann
ualr
evie
ws.
org
Acc
ess
prov
ided
by
Uni
vers
idad
de
Cos
ta R
ica
(UC
R)
on 0
2/21
/19.
For
per
sona
l use
onl
y.
PP69CH28_McElwain ARI 7 April 2018 9:39
8. Barke J, Abels HA, Sangiorgi F, Greenwood DR, Sweet AR, et al. 2011. Orbitally forced Azolla bloomsand Middle Eocene Arctic hydrology: clues from palynology. Geology 39:427–30
9. Barrett PM, Willis KJ. 2001. Did dinosaurs invent flowers? Dinosaur-angiosperm coevolution revisited.Biol. Rev. 76:411–47
10. Beerling DJ. 2002. Low atmospheric CO2 levels during the Permo-Carboniferous glaciation inferredfrom fossil lycopsids. PNAS 99:12567–71
11. Beerling DJ, Lomax BH, Royer DL, Upchurch GR, Kump LR. 2002. An atmospheric pCO2 reconstruc-tion across the Cretaceous-Tertiary boundary from leaf megafossils. PNAS 99:7836–40
12. Beerling DJ, McElwain JC, Osborne CP. 1998. Stomatal responses of the ‘living fossil’ Ginkgo biloba L.to changes in atmospheric CO2 concentrations. J. Exp. Bot. 49:1603–7
13. Beerling DJ, Osborne CP. 2002. Physiological ecology of Mesozoic polar forests in a high CO2 envi-ronment. Ann. Bot. 89:329–39
14. Beerling DJ, Royer D. 2002. Fossil plants as indicators of the Phanerozoic global carbon cycle. Annu.Rev. Earth Planet. Sci. 30:527–56
15. Belcher CM, Mander L, Rein G, Jervis FX, Haworth M, et al. 2010. Increased fire activity at theTriassic/Jurassic boundary in Greenland due to climate-driven floral change. Nat. Geosci. 3:426–29
16. Presents one of themost important modelsof atmospheric oxygenevolution of the past500 million years.
16. Bergman NM, Lenton TM, Watson AJ. 2004. COPSE: a new model of biogeochemical cyclingover Phanerozoic time. Am. J. Sci. 304:397–437
17. Berner RA. 1997. The rise of plants and their effect on weathering and atmospheric CO2. Science 276:544–46
18. A seminal paper andmodel on atmosphericCO2 and O2 changethroughout Earth’shistory.
18. Berner RA. 2006. GEOCARBSULF: a combined model for Phanerozoic atmospheric O2 andCO2. Geochim. Cosmochim. Acta 70:5653–64
19. Berner RA. 2009. Phanerozoic atmospheric oxygen: new results using the GEOCARBSULF model. Am.J. Sci. 309:603–6
20. Betts RA, Boucher O, Collins M, Cox PM, Falloon PD, et al. 2007. Projected increase in continentalrunoff due to plant responses to increasing carbon dioxide. Nature 448:1037–41
21. Blonder B, Royer DL, Johnson KR, Miller I, Enquist BJ. 2014. Plant ecological strategies shift acrossthe Cretaceous-Paleogene boundary. PLOS Biol. 12:e1001949
22. Bonis NR, Kurschner WM. 2012. Vegetation history, diversity patterns, and climate change across theTriassic/Jurassic boundary. Paleobiology 38:240–64
23. Bonis NR, Van Konijnenburg-Van Cittert J, Kurschner W. 2010. Changing CO2 conditions during theEnd-Triassic inferred from stomatal frequency analysis on Lepidopteris ottonis (Goeppert) Schimper andGinkgoites taeniatus (Braun) Harris. Palaeogeogr. Palaeoclim. Palaeoecol. 295:146–61
24. Boyce CK, Brodribb TJ, Feild TS, Zwieniecki MA. 2009. Angiosperm leaf vein evolution was physio-logically and environmentally transformative. Proc. R. Soc. B 276:1771–76
25. Boyce CK, Lee J-E. 2017. Plant evolution and climate over geological timescales. Annu. Rev. EarthPlanet. Sci. 41:61–87
26. Boyce CK, Zwieniecki MA. 2012. Leaf fossil record suggests limited influence of atmospheric CO2 onterrestrial productivity prior to angiosperm evolution. PNAS 109:10403–8
27. Documents theremarkable finding offreshwater ferns in theArctic Ocean during theEocene. 27. Brinkhuis H, Schouten S, Collinson ME, Sluijs A, Damste JSS, et al. 2006. Episodic fresh surface
waters in the Eocene Arctic Ocean. Nature 441:60628. Callaghan TV, Tweedie CE, Akerman J, Andrews C, Bergstedt J, et al. 2011. Multi-decadal changes
in tundra environments and ecosystems: synthesis of the International Polar Year-Back to the Futureproject (IPY-BTF). AMBIO 40:705–16
29. Chen LQ, Li CS, Chaloner WG, Beerling DJ, Sun QG, et al. 2001. Assessing the potential for thestomatal characters of extant and fossil Ginkgo leaves to signal atmospheric CO2 change. Am. J. Bot.88:1309–15
30. Provides anexcellent overview ofthe concept and timingof the three greatevolutionary floras:Paleophytic,Mesophytic, andCenophytic.
30. Cleal CJ, Cascales-Minana B. 2014. Composition and dynamics of the great Phanerozoic Evo-lutionary Floras. Lethaia 47:469–84
31. Cleal CJ, Thomas BA. 2009. An Introduction to Plant Fossils. Cambridge, MA: Cambridge Univ. Press32. Collinson ME, Barke J, van der Burgh J, van Konijnenburg-van Cittert JH. 2009. A new species of the
freshwater fern Azolla (Azollaceae) from the Eocene Arctic Ocean. Rev. Palaeobot. Palynol. 155:1–14
780 McElwain
Ann
u. R
ev. P
lant
Bio
l. 20
18.6
9:76
1-78
7. D
ownl
oade
d fr
om w
ww
.ann
ualr
evie
ws.
org
Acc
ess
prov
ided
by
Uni
vers
idad
de
Cos
ta R
ica
(UC
R)
on 0
2/21
/19.
For
per
sona
l use
onl
y.
PP69CH28_McElwain ARI 7 April 2018 9:39
33. Cox PM, Betts R, Collins M, Harris PP, Huntingford C, Jones C. 2004. Amazonian forest dieback underclimate-carbon cycle projections for the 21st century. Theor. Appl. Climatol. 78:137–56
34. Crepet WL. 1974. Investigations of North American cycadeoids: the reproductive biology of Cycadeoidea.Palaeontogr. Abt. B 148:144–69
35. Crepet WL, Niklas KJ. 2009. Darwin’s second “abominable mystery”: Why are there so many an-giosperm species? Am. J. Bot. 96:366–81
36. Cuneo NR, Taylor EL, Taylor TN, Krings M. 2003. In situ fossil forest from the upper FremouwFormation (Triassic) of Antarctica: paleoenvironmental setting and paleoclimate analysis. Palaeogeogr.Palaeoclim. Palaeoecol. 197:239–61
37. Currano ED, Wilf P, Wing SL, Labandeira CC, Lovelock EC, Royer DL. 2008. Sharply increased insectherbivory during the Paleocene-Eocene Thermal Maximum. PNAS 105:1960–64
38. Davies J, Marzoli A, Bertrand H, Youbi N, Ernesto M, Schaltegger U. 2017. End-Triassic mass extinctionstarted by intrusive CAMP activity. Nat. Commun. 8:15596
39. Diefendorf AF, Mueller KE, Wing SL, Koch PL, Freeman KH. 2010. Global patterns in leaf 13Cdiscrimination and implications for studies of past and future climate. PNAS 107:5738–43
40. Diffenbaugh NS, Field CB. 2013. Changes in ecologically critical terrestrial climate conditions. Science341:486–92
41. DiMichele WA, Mamay SH, Chaney DS, Hook RW, Nelson WJ. 2001. An early Permian flora withLate Permian and Mesozoic affinities from north-central Texas. J. Paleontol. 75:449–60
42. Doria G, Royer DL, Wolfe AP, Fox A, Westgate JA, Beerling DJ. 2011. Declining atmospheric CO2
during the late Middle Eocene climate transition. Am. J. Sci. 311:63–7543. Du B, Sun B, Zhang M, Yang G, Xing L, et al. 2016. Atmospheric palaeo-CO2 estimates based on the
carbon isotope and stomatal data of Cheirolepidiaceae from the Lower Cretaceous of the Jiuquan Basin,Gansu Province. Cretac. Res. 62:142–53
44. Elliott-Kingston C, Haworth M, McElwain J. 2014. Damage structures in leaf epidermis and cuticleas an indicator of elevated atmospheric sulphur dioxide in early Mesozoic floras. Rev. Palaeobot. Palynol.208:25–42
45. Elliott-Kingston C, Haworth M, Yearsley JM, Batke SP, Lawson T, McElwain JC. 2016. Does sizematter? Atmospheric CO2 may be a stronger driver of stomatal closing rate than stomatal size in taxathat diversified under low CO2. Front. Plant Sci. 7:1253
46. Erdei B, Utescher T, Hably L, Tamas J, Roth-Nebelsick A, Grein M. 2012. Early Oligocene continentalclimate of the Palaeogene Basin (Hungary and Slovenia) and the surrounding area. Turk. J. Earth Sci.21:153–86
47. Falcon-Lang H, Cantrill D. 2001. Leaf phenology of some mid-Cretaceous polar forests, AlexanderIsland, Antarctica. Geol. Mag. 138:39–52
48. Fauchald P, Park T, Tømmervik H, Myneni R, Hausner VH. 2017. Arctic greening from warmingpromotes declines in caribou populations. Sci. Adv. 3:e1601365
49. Feild TS, Brodribb TJ, Iglesias A, Chatelet DS, Baresch A, et al. 2011. Fossil evidence for Cretaceousescalation in angiosperm leaf vein evolution. PNAS 108:8363–66
50. Feild TS, Upchurch GR, Chatelet DS, Brodribb TJ, Grubbs KC, et al. 2011. Fossil evidence for low gasexchange capacities for Early Cretaceous angiosperm leaves. Paleobiology 37:195–213
51. Feulner G. 2012. The faint young Sun problem. Rev. Geophys. 50:RG200652. Foster GL, Royer DL, Lunt DJ. 2017. Future climate forcing potentially without precedent in the last
420 million years. Nat. Commun. 8:1484553. Francis J, Ashworth A, Cantrill D, Crame J, Howe J, et al. 2008. 100 million years of Antarctic climate
evolution: evidence from fossil plants. In Antarctica: A Keystone in a Changing World, ed. A Cooper,C Raymond, pp. 19–28. Washington, DC: Natl. Acad. Press
54. Franks PJ, Beerling DJ. 2009. CO2-forced evolution of plant gas exchange capacity and water-use effi-ciency over the Phanerozoic. Geobiology 7:227–36
55. Franks PJ, Beerling DJ. 2009. Maximum leaf conductance driven by CO2 effects on stomatal size anddensity over geologic time. PNAS 106:10343–47
www.annualreviews.org • Paleobotany and Global Change 781
Ann
u. R
ev. P
lant
Bio
l. 20
18.6
9:76
1-78
7. D
ownl
oade
d fr
om w
ww
.ann
ualr
evie
ws.
org
Acc
ess
prov
ided
by
Uni
vers
idad
de
Cos
ta R
ica
(UC
R)
on 0
2/21
/19.
For
per
sona
l use
onl
y.
PP69CH28_McElwain ARI 7 April 2018 9:39
56. Franks PJ, Royer DL. 2017. Comment on “Was atmospheric CO2 capped at 1000 ppm over the past300 million years?” by McElwain JC et al. [Palaeogeogr. Palaeoclim. Palaeoecol. 2016;441:653–58].Palaeogeogr. Palaeoclim. Palaeoecol. 472:256–59
57. Franks PJ, Royer DL, Beerling DJ, Van de Water PK, Cantrill DJ, et al. 2014. New constraints onatmospheric CO2 concentration for the Phanerozoic. Geophys. Res. Lett. 41:4685–94
58. Friis EM, Pedersen KR, Crane PR. 2006. Cretaceous angiosperm flowers: innovation and evolution inplant reproduction. Palaeogeogr. Palaeoclim. Palaeoecol. 232:251–93
59. Ganino C, Arndt NT. 2009. Climate changes caused by degassing of sediments during the emplacementof large igneous provinces. Geology 37:323–26
60. One of the firstpapers to demonstratethe potential impact ofchanging plantphysiology in responseto elevated CO2 on theglobal hydrologicalcycle.
60. Gedney N, Cox PM, Betts RA, Boucher O, Huntingford C, Stott PA. 2006. Detection of a directcarbon dioxide effect in continental river runoff records. Nature 439:835–38
61. Glasspool IJ, Scott AC. 2010. Phanerozoic concentrations of atmospheric oxygen reconstructed fromsedimentary charcoal. Nat. Geosci. 3:627
62. Greenwood DR, Basinger JF. 1994. The paleoecology of high-latitude Eocene swamp forests from AxelHeiberg Island, Canadian High Arctic. Rev. Palaeobot. Palynol. 81:83–97
63. Greenwood DR, Scarr MJ, Christophel DC. 2003. Leaf stomatal frequency in the Australian tropi-cal rainforest tree Neolitsea dealbata (Lauraceae) as a proxy measure of atmospheric pCO2. Palaeogeogr.Palaeoclim. Palaeoecol. 196:375–93
64. Grein M, Konrad W, Wilde V, Utescher T, Roth-Nebelsick A. 2011. Reconstruction of atmosphericCO2 during the early middle Eocene by application of a gas exchange model to fossil plants from theMessel Formation, Germany. Palaeogeogr. Palaeoclim. Palaeoecol. 309:383–91
65. Grein M, Oehm C, Konrad W, Utescher T, Kunzmann L, Roth-Nebelsick A. 2013. Atmospheric CO2
from the Late Oligocene to Early Miocene based on photosynthesis data and fossil leaf characteristics.Palaeogeogr. Palaeoclim. Palaeoecol. 374:41–51
66. Harris TM. 1926. The Rhaetic flora of Scoresby Sound, East Greenland. Meddelelser Om Grønland68:1–43
67. Haworth M, Elliott-Kingston C, McElwain JC. 2011. Stomatal control as a driver of plant evolution.J. Exp. Bot. 62:2419–23
68. Haworth M, Hesselbo SP, McElwain JC, Robinson SA, Brunt JW. 2005. Mid-Cretaceous pCO2 basedon stomata of the extinct conifer Pseudofrenelopsis (Cheirolepidiaceae). Geology 33:749–52
69. Herman AB, Spicer RA. 1997. New quantitative palaeoclimate data for the Late Cretaceous Arctic:evidence for a warm polar ocean. Palaeogeogr. Palaeoclim. Palaeoecol. 128:227–51
70. Hesselbo SP, Grocke DR, Jenkyns HC, Bjerrum CJ, Farrimond P, et al. 2000. Massive dissociation ofgas hydrate during a Jurassic oceanic anoxic event. Nature 406:392–95
71. Hickey LJ, Johnson KR, Dawson MR. 1988. The stratigraphy, sedimentology, and fossils of theHaughton Formation: a post-impact crater-fill, Devon Island, N.W.T., Canada. Meteorit. Planet. Sci.23:221–31
72. Hinzman LD, Bettez ND, Bolton WR, Chapin FS, Dyurgerov MB, et al. 2005. Evidence and implicationsof recent climate change in northern Alaska and other arctic regions. Clim. Chang. 72:251–98
73. Reviewspaleotemperature proxydata and paleoclimatemodels of Eoceneclimate.
73. Huber M, Caballero R. 2011. The Early Eocene equable climate problem revisited. Clim. Past7:603
74. Jahren AH, Sternberg LS. 2008. Annual patterns within tree rings of the Arctic middle Eocene (ca.45 Ma): isotopic signatures of precipitation, relative humidity, and deciduousness. Geology 36:99–102
75. Jaramillo C, Hoorn C, Silva SA, Leite F, Herrera F, et al. 2010. The origin of the modern Amazonrainforest: implications of the palynological and palaeobotanical record. In Amazonia: Landscape andSpecies Evolution: A Look into the Past, ed. C Hoorn, FP Wesselingh, pp. 317–34. Oxford, UK: WileyBlackwell
76. Jaramillo C, Ochoa D, Contreras L, Pagani M, Carvajal-Ortiz H, et al. 2010. Effects of rapid globalwarming at the Paleocene-Eocene boundary on Neotropical vegetation. Science 330:957–61
77. Jaramillo C, Rueda MJ, Mora G. 2006. Cenozoic plant diversity in the Neotropics. Science 311:1893–9678. Johnson KR, Ellis B. 2002. A tropical rainforest in Colorado 1.4 million years after the Cretaceous-
Tertiary boundary. Science 296:2379–83
782 McElwain
Ann
u. R
ev. P
lant
Bio
l. 20
18.6
9:76
1-78
7. D
ownl
oade
d fr
om w
ww
.ann
ualr
evie
ws.
org
Acc
ess
prov
ided
by
Uni
vers
idad
de
Cos
ta R
ica
(UC
R)
on 0
2/21
/19.
For
per
sona
l use
onl
y.
PP69CH28_McElwain ARI 7 April 2018 9:39
79. Ju J, Masek JG. 2016. The vegetation greenness trend in Canada and US Alaska from 1984–2012 Landsatdata. Remote Sens. Environ. 176:1–16
80. Kooyman RM, Wilf P, Barreda VD, Carpenter RJ, Jordan GJ, et al. 2014. Paleo-Antarctic rainforestinto the modern Old World tropics: the rich past and threatened future of the “southern wet forestsurvivors.” Am. J. Bot. 101:2121–35
81. Kurschner WM, Batenburg SJ, Mander L. 2013. Aberrant Classopollis pollen reveals evidence for unre-duced (2n) pollen in the conifer family Cheirolepidiaceae during the Triassic-Jurassic transition. Proc. R.Soc. Lond. B 280:20131708
82. Kurschner WM, Kvacek Z, Dilcher DL. 2008. The impact of Miocene atmospheric carbon dioxidefluctuations on climate and the evolution of terrestrial ecosystems. PNAS 105:449–53
83. Kurschner WM, Wagner F, Dilcher DL, Visscher H. 2001. Using fossil leaves for the reconstruction ofCenozoic paleoatmospheric CO2 concentrations. In Geological Perspectives of Global Climate Change, ed.LC Gerhard, WE Harrison, BM Hanson, pp. 169–89. Tulsa, OK: Am. Assoc. Pet. Geol.
84. Lammertsma EI, de Boer HJ, Dekker SC, Dilcher DL, Lotter AF, Wagner-Cremer F. 2011. GlobalCO2 rise leads to reduced maximum stomatal conductance in Florida vegetation. PNAS 108:4035–40
85. Leakey ADB, Ainsworth EA, Bernacchi CJ, Rogers A, Long SP, Ort DR. 2009. Elevated CO2 effects onplant carbon, nitrogen, and water relations: six important lessons from FACE. J. Exp. Bot. 60:2859–76
86. Leuzinger S, Korner C. 2010. Rainfall distribution is the main driver of runoff under future CO2-concentration in a temperate deciduous forest. Glob. Chang. Biol. 16:246–54
87. Lindstrom S, van de Schootbrugge B, Hansen KH, Pedersen GK, Alsen P, et al. 2017. A new correlationof Triassic-Jurassic boundary successions in NW Europe, Nevada and Peru, and the Central AtlanticMagmatic Province: a time-line for the End-Triassic mass extinction. Palaeogeogr. Palaeoclim. Palaeoecol.478:80–102
88. Loarie SR, Duffy PB, Hamilton H, Asner GP, Field CB, Ackerly DD. 2009. The velocity of climatechange. Nature 462:1052
89. Lupia R, Lidgard S, Crane PR. 1999. Comparing palynological abundance and diversity: implicationsfor biotic replacement during the Cretaceous angiosperm radiation. Paleobiology 25:305–40
90. Mander L, Kurschner WM, McElwain JC. 2010. An explanation for conflicting records of Triassic-Jurassic plant diversity. PNAS 107:15351–56
91. Maslin M, Owen M, Betts R, Day S, Jones TD, Ridgwell A. 2010. Gas hydrates: past and future geo-hazard? Philos. Trans. R. Soc. A 368:2369–93
92. Maxbauer DP, Royer DL, LePage BA. 2014. High Arctic forests during the middle Eocene supportedby moderate levels of atmospheric CO2. Geology 42:1027–30
93. Mays C, Steinthorsdottir M, Stilwell JD. 2015. Climatic implications of Ginkgoites waarrensis Douglasemend. from the south polar Tupuangi flora, Late Cretaceous (Cenomanian), Chatham Islands. Palaeo-geogr. Palaeoclim. Palaeoecol. 438:308–26
94. McElwain JC, Beerling DJ, Woodward FI. 1999. Fossil plants and global warming at the Triassic-Jurassicboundary. Science 285:1386–90
95. McElwain JC, Chaloner WG. 1995. Stomatal density and index of fossil plants track atmospheric carbondioxide in the Palaeozoic. Ann. Bot. 76:389–95
96. McElwain JC, Montanez I, White JD, Wilson JP, Yiotis C. 2016. Was atmospheric CO2 capped at1000 ppm over the past 300 million years? Palaeogeogr. Palaeoclim. Palaeoecol. 441:653–58
97. McElwain JC, Montanez I, White JD, Wilson JC, Yiotis C. 2017. Reply to Comment on “Was atmo-spheric CO2 capped at 1000 ppm over the past 300 million years?” [Palaeogeogr. Palaeoclim. Palaeoecol.2016;441:653–58]. Palaeogeogr. Palaeoclim. Palaeoecol. 472:260–63
98. McElwain JC, Popa ME, Hesselbo SP, Haworth M, Surlyk F. 2007. Macroecological responses ofterrestrial vegetation to climatic and atmospheric change across the Triassic/Jurassic boundary in EastGreenland. Paleobiology 33:547–73
99. McElwain JC, Punyasena SW. 2007. Mass extinction events and the plant fossil record. Trends Ecol. Evol.22:548–57
100. McElwain JC, Wade-Murphy J, Hesselbo SP. 2005. Changes in carbon dioxide during an oceanic anoxicevent linked to intrusion into Gondwana coals. Nature 435:479–82
www.annualreviews.org • Paleobotany and Global Change 783
Ann
u. R
ev. P
lant
Bio
l. 20
18.6
9:76
1-78
7. D
ownl
oade
d fr
om w
ww
.ann
ualr
evie
ws.
org
Acc
ess
prov
ided
by
Uni
vers
idad
de
Cos
ta R
ica
(UC
R)
on 0
2/21
/19.
For
per
sona
l use
onl
y.
PP69CH28_McElwain ARI 7 April 2018 9:39
101. McElwain JC, Wagner PJ, Hesselbo SP. 2009. Fossil plant relative abundances indicates sudden loss ofLate Triassic biodiversity in East Greenland. Science 324:1554–56
102. McElwain JC, Yiotis C, Lawson T. 2016. Using modern plant trait relationships between observed andtheoretical maximum stomatal conductance and vein density to examine patterns of plant macroevolution.New Phytol. 209:94–103
103. McInerney FA, Wing SL. 2011. The Paleocene-Eocene Thermal Maximum: a perturbation of carboncycle, climate, and biosphere with implications for the future. Annu. Rev. Earth Planet. Sci. 39:489–516
104. Meinshausen M, Smith SJ, Calvin K, Daniel JS, Kainuma M, et al. 2011. The RCP greenhouse gasconcentrations and their extensions from 1765 to 2300. Clim. Chang. 109:213
105. Mills BJ, Belcher CM, Lenton TM, Newton RJ. 2016. A modeling case for high atmospheric oxygenconcentrations during the Mesozoic and Cenozoic. Geology 44:1023–26
106. Montanez IP, McElwain JC, Poulsen CJ, White JD, DiMichele WA, et al. 2016. Climate, pCO2 andterrestrial carbon cycle linkages during late Palaeozoic glacial-interglacial cycles. Nat. Geosci. 9:824–28
107. Myers-Smith IH, Forbes BC, Wilmking M, Hallinger M, Lantz T, et al. 2011. Shrub expansion in tundraecosystems: dynamics, impacts and research priorities. Environ. Res. Lett. 6:045509
108. Niinemets U, Dıaz-Espejo A, Flexas J, Galmes J, Warren CR. 2009. Role of mesophyll diffusion con-ductance in constraining potential photosynthetic productivity in the field. J. Exp. Bot. 60:2249–70
109. Niinemets U, Flexas J, Penuelas J. 2011. Evergreens favored by higher responsiveness to increased CO2.Trends Ecol. Evol. 26:136–42
110. Niklas KJ, Tiffney BH. 1994. The quantification of plant biodiversity through time. Philos. Trans. R. Soc.B 345:35–44
111. Norby RJ, Zak DR. 2011. Ecological lessons from free-air CO2 enrichment (FACE) experiments. Annu.Rev. Ecol. Evol. Syst. 42:181–203
112. Olsen PE, Fowell SJ, Cornet B. 1990. The Triassic/Jurassic boundary in continental rocks of easternNorth America: a progress report. In Global Catastrophes in Earth History: An Interdisciplinary Conferenceon Impacts, Volcanism, and Mass Mortality, ed. VL Sharpton, PD Ward, pp. 585–93. Boulder, CO: Geol.Soc. Am.
113. Pachauri RK, Meyer LA, eds. 2014. Climate Change 2014: Synthesis Report. Contribution of WorkingGroups I, II and III to the Fifth Assessment Report of the Intergovernmental Panel on Climate Change. Geneva:Intergov. Panel Clim. Chang.
114. Passalia MG. 2009. Cretaceous pCO2 estimation from stomatal frequency analysis of gymnosperm leavesof Patagonia, Argentina. Palaeogeogr. Palaeoclim. Palaeoecol. 273:17–24
115. Pole M. 1999. Structure of a near-polar latitude forest from the New Zealand Jurassic. Palaeogeogr.Palaeoclim. Palaeoecol. 147:121–39
116. Poulsen CJ, Tabor C, White JD. 2015. Long-term climate forcing by atmospheric oxygen concentrations.Science 348:1238–41
117. Pound MJ, Salzmann U. 2017. Heterogeneity in global vegetation and terrestrial climate change duringthe late Eocene to early Oligocene transition. Sci. Rep. 7:43386
118. Pross J, Contreras L, Bijl PK, Greenwood DR, Bohaty SM, et al. 2012. Persistent near-tropical warmthon the Antarctic continent during the early Eocene epoch. Nature 488:73–77
119. Quan C, Sun CL, Sun YW, Sun G. 2009. High resolution estimates of paleo-CO2 levels through theCampanian (Late Cretaceous) based on Ginkgo cuticles. Cretac. Res. 30:424–28
120. Rees PM, Ziegler AM, Gibbs MT, Kutzbach JE, Behling PJ, Rowley DB. 2002. Permian phytogeographicpatterns and climate data/model comparisons. J. Geol. 110:1–31
121. Rees PM, Ziegler AM, Valdes PJ. 2000. Jurassic phytogeography and climates: new data and modelcomparisons. In Warm Climates in Earth History, ed. BT Huber, KG Macleod, SL Wing, pp. 297–318.Cambridge, UK: Cambridge Univ. Press
122. Reichgelt T, D’Andrea WJ, Fox BR. 2016. Abrupt plant physiological changes in southern New Zealandat the termination of the Mi-1 event reflect shifts in hydroclimate and pCO2. Earth Planet. Sci. Lett.455:115–24
123. Retallack GJ. 2001. A 300-million-year record of atmospheric carbon dioxide from fossil plant cuticles.Nature 411:287
784 McElwain
Ann
u. R
ev. P
lant
Bio
l. 20
18.6
9:76
1-78
7. D
ownl
oade
d fr
om w
ww
.ann
ualr
evie
ws.
org
Acc
ess
prov
ided
by
Uni
vers
idad
de
Cos
ta R
ica
(UC
R)
on 0
2/21
/19.
For
per
sona
l use
onl
y.
PP69CH28_McElwain ARI 7 April 2018 9:39
124. Retallack GJ. 2002. Carbon dioxide and climate over the past 300 Myr. Philos. Trans. R. Soc. A 360:659–73125. Roth-Nebelsick A, Grein M, Utescher T, Konrad W. 2012. Stomatal pore length change in leaves of
Eotrigonobalanus furcinervis (Fagaceae) from the Late Eocene to the Latest Oligocene and its impact ongas exchange and CO2 reconstruction. Rev. Palaeobot. Palynol. 174:106–12
126. Roth-Nebelsick A, Konrad W. 2003. Assimilation and transpiration capabilities of rhyniophytic plantsfrom the Lower Devonian and their implications for paleoatmospheric CO2 concentration. Palaeogeogr.Palaeoclim. Palaeoecol. 202:153–78
127. Roth-Nebelsick A, Oehm C, Grein M, Utescher T, Kunzmann L, et al. 2014. Stomatal density and indexdata of Platanus neptuni leaf fossils and their evaluation as a CO2 proxy for the Oligocene. Rev. Palaeobot.Palynol. 206:1–9
128. Royer DL. 2002. Estimating Latest Cretaceous and Tertiary atmospheric CO2 concentration fromstomatal indices. In Causes and Consequences of Globally Warm Climates in the Early Paleogene, ed. SLWing, PD Gingerich, B Schmitz, E Thomas, pp. 79–93. Boulder, CO: Geol. Soc. Am.
129. Royer DL. 2016. Climate sensitivity in the geologic past. Annu. Rev. Earth Planet. Sci. 44:277–93130. Royer DL, Chernoff B. 2013. Diversity in Neotropical wet forests during the Cenozoic is linked more
to atmospheric CO2 than temperature. Proc. R. Soc. Lond. B 280:20131024131. Royer DL, Osborne CP, Beerling DJ. 2003. Carbon loss by deciduous trees in a CO2-rich ancient polar
environment. Nature 424:60–62132. Royer DL, Wing SL, Beerling DJ, Jolley DW, Koch PL, et al. 2001. Paleobotanical evidence for near
present-day levels of atmospheric CO2 during part of the Tertiary. Science 292:2310–13133. Ruhl M, Bonis NR, Reichart G-J, Damste JSS, Kurschner WM. 2011. Atmospheric carbon injection
linked to End-Triassic mass extinction. Science 333:430–34134. Schafer KV, Oren R, Lai CT, Katul GG. 2002. Hydrologic balance in an intact temperate forest ecosys-
tem under ambient and elevated atmospheric CO2 concentration. Glob. Chang. Biol. 8:895–911135. Schaller MF, Wright JD, Kent DV. 2011. Atmospheric pCO2 perturbations associated with the Central
Atlantic Magmatic Province. Science 331:1404–9136. Schubert BA, Jahren AH, Eberle JJ, Sternberg LS, Eberth DA. 2012. A summertime rainy season in the
Arctic forests of the Eocene. Geology 40:523–26137. Sepkoski JJ, Miller AI. 1998. Analysing diversification through time. Trends Ecol. Evol. 13:158–59138. Serreze MC, Barry RG. 2011. Processes and impacts of Arctic amplification: a research synthesis. Glob.
Planet. Chang. 77:85–96139. Silvestro D, Cascales-Minana B, Bacon CD, Antonelli A. 2015. Revisiting the origin and diversification
of vascular plants through a comprehensive Bayesian analysis of the fossil record. New Phytol. 207:425–36140. Smith RY, Greenwood DR, Basinger JF. 2010. Estimating paleoatmospheric pCO2 during the early
Eocene climatic optimum from stomatal frequency of Ginkgo, Okanagan Highlands, British Columbia,Canada. Palaeogeogr. Palaeoclim. Palaeoecol. 293:120–31
141. Soh W, Wright I, Bacon K, Lenz T, Steinthorsdottir M, et al. 2017. Palaeo leaf economics reveal a shiftin ecosystem function associated with the End-Triassic mass extinction event. Nat. Plants 3:17104
142. Spicer RA, Herman AB. 2010. The Late Cretaceous environment of the Arctic: a quantitative reassess-ment based on plant fossils. Palaeogeogr. Palaeoclim. Palaeoecol. 295:423–42
143. Steinthorsdottir M, Jeram AJ, McElwain JC. 2011. Extremely elevated CO2 concentrations at the Tri-assic/Jurassic boundary. Palaeogeogr. Palaeoclim. Palaeoecol. 308:418–32
144. Steinthorsdottir M, Porter A, Holohan A, Kunzmann L, Collinson M, McElwain J. 2016. Fossil plantstomata indicate decreasing atmospheric CO2 prior to the Eocene-Oligocene boundary. Clim. Past12:439–54
145. Steinthorsdottir M, Vajda V. 2015. Early Jurassic (late Pliensbachian) CO2 concentrations based onstomatal analysis of fossil conifer leaves from eastern Australia. Gondwana Res. 27:932–39
146. Steinthorsdottir M, Woodward FI, Surlyk F, McElwain JC. 2012. Deep-time evidence of a link betweenelevated CO2 concentrations and perturbations in the hydrological cycle via drop in plant transpiration.Geology 40:815–18
147. Stewart WN, Rothwell GW. 1993. Paleobotany and the Evolution of Plants. Cambridge, UK: CambridgeUniv. Press
www.annualreviews.org • Paleobotany and Global Change 785
Ann
u. R
ev. P
lant
Bio
l. 20
18.6
9:76
1-78
7. D
ownl
oade
d fr
om w
ww
.ann
ualr
evie
ws.
org
Acc
ess
prov
ided
by
Uni
vers
idad
de
Cos
ta R
ica
(UC
R)
on 0
2/21
/19.
For
per
sona
l use
onl
y.
PP69CH28_McElwain ARI 7 April 2018 9:39
148. Stromberg CA. 2011. Evolution of grasses and grassland ecosystems. Annu. Rev. Earth Planet. Sci. 39:517–44
149. Stults DZ, Wagner-Cremer F, Axsmith BJ. 2011. Atmospheric paleo-CO2 estimates based on Taxodiumdistichum (Cupressaceae) fossils from the Miocene and Pliocene of Eastern North America. Palaeogeogr.Palaeoclim. Palaeoecol. 309:327–32
150. Sun B-N, Wang Q-J, Konrad W, Ma F-J, Dong J-L, Wang Z-X. 2017. Reconstruction of atmosphericCO2 during the Oligocene based on leaf fossils from the Ningming Formation in Guangxi, China.Palaeogeogr. Palaeoclim. Palaeoecol. 467:5–15
151. Sun Y, Li X, Zhao G, Liu H, Zhang Y. 2016. Aptian and Albian atmospheric CO2 changes duringoceanic anoxic events: evidence from fossil Ginkgo cuticles in Jilin Province, Northeast China. Cretac.Res. 62:130–41
152. Svensen H, Sverre P, Malthe-Sørenssen A, Jamtveit B, Myklebust R, et al. 2004. Release of methanefrom a volcanic basin as a mechanism for initial Eocene global warming. Nature 429:542–45
153. Taylor EL, Taylor TN, Isbell JL, Cuneo R. 1989. Fossil floras of southern Victoria Land. 2. KennarValley. Antarct. J. U.S. 24:26–28
154. Taylor EL, Taylor TN, Krings M. 2009. Paleobotany: The Biology and Evolution of Fossil Plants. New York:Academic Press. 2nd ed.
155. Traverse A. 1988. Plant evolution dances to a different beat: plant and evolutionary mechanisms com-pared. Hist. Biol. 1:277–356
156. Truswell E, Macphail M. 2009. Polar forests on the edge of extinction: What does the fossil spore andpollen evidence from East Antarctica say? Aust. Syst. Bot. 22:57–106
157. Utescher T, Mosbrugger V. 2007. Eocene vegetation patterns reconstructed from plant diversity—aglobal perspective. Palaeogeogr. Palaeoclim. Palaeoecol. 247:243–71
158. van de Schootbrugge B, Tremolada F, Rosenthal Y, Bailey TR, Feist-Burkhardt S, et al. 2007. End-Triassic calcification crisis and blooms of organic-walled ‘disaster species.’ Palaeogeogr. Palaeoclim.Palaeoecol. 244:126–41
159. van de Schootbrugge B, Wignall PB. 2016. A tale of two extinctions: converging end-Permian andend-Triassic scenarios. Geol. Mag. 153:332–54
160. Van Der Burgh J, Visscher H, Dilcher DL, Kurschner WM. 1993. Paleoatmospheric signatures inNeogene fossil leaves. Science 260:1788–90
161. Wan C, Wang D, Zhu Z, Quan C. 2011. Trend of Santonian (Late Cretaceous) atmospheric CO2 andglobal mean land surface temperature: evidence from plant fossils. Sci. China Earth Sci. 54:1338–45
162. Wang Y, Momohara A, Wang L, Lebreton-Anberree J, Zhou Z. 2015. Evolutionary history of atmo-spheric CO2 during the late Cenozoic from fossilized Metasequoia needles. PLOS ONE 10:e0130941
163. West CK, Greenwood DR, Basinger JF. 2015. Was the Arctic Eocene ‘rainforest’ monsoonal? Estimatesof seasonal precipitation from early Eocene megafloras from Ellesmere Island, Nunavut. Earth Planet.Sci. Lett. 427:18–30
164. Wiens JJ, Ackerly DD, Allen AP, Anacker BL, Buckley LB, et al. 2010. Niche conservatism as an emergingprinciple in ecology and conservation biology. Ecol. Lett. 13:1310–24
165. Williams CJ, Johnson AH, LePage BA, Vann DR, Sweda T. 2003. Reconstruction of Tertiary Metase-quoia forests. II. Structure, biomass, and productivity of Eocene floodplain forests in the Canadian Arctic.Paleobiology 29:271–92
166. Willis KJ, McElwain JC. 2014. The Evolution of Plants. Oxford, UK: Oxford Univ. Press167. Wilson JP, Knoll AH. 2010. A physiologically explicit morphospace for tracheid-based water transport
in modern and extinct seed plants. Paleobiology 36:335–55168. Wilson JP, Montanez IP, White JD, DiMichele WA, McElwain JC, et al. 2017. Dynamic Carboniferous
tropical forests: new views of plant function and potential for physiological forcing of climate. New Phytol.215:1333–53
169. Reviews methodsthat can be used onfossil plants toreconstruct theirecophysiology fromanatomical andmorphologicalobservations.
169. Wilson JP, White JD, DiMichele WA, Hren MT, Poulsen CJ, et al. 2015. Reconstructing extinctplant water use for understanding vegetation-climate feedbacks: methods, synthesis and a casestudy using the Paleozoic era medullosan seed ferns. Paleontol. Soc. Pap. 21:167–95
170. Wing SL. 2004. Mass extinctions in plant evolution. In Extinctions in the History of Life, ed. PD Taylor,pp. 61–97. Cambridge, UK: Cambridge Univ. Press
786 McElwain
Ann
u. R
ev. P
lant
Bio
l. 20
18.6
9:76
1-78
7. D
ownl
oade
d fr
om w
ww
.ann
ualr
evie
ws.
org
Acc
ess
prov
ided
by
Uni
vers
idad
de
Cos
ta R
ica
(UC
R)
on 0
2/21
/19.
For
per
sona
l use
onl
y.
PP69CH28_McElwain ARI 7 April 2018 9:39
171. Wing SL, Currano ED. 2013. Plant response to a global greenhouse event 56 million years ago. Am. J.Bot. 100:1234–54
172. Wing SL, Harrington GJ. 2001. Floral responses to rapid warming in the earliest Eocene and implicationsfor concurrent faunal change. Paleobiology 27:539–64
173. Demonstrates massmigration oflow-latitude tropicalplant taxa intohigher-latitudecommunities inresponse to globalwarming across thePETM.
173. Wing SL, Harrington GJ, Smith FA, Bloch JI, Boyer DM, Freeman KH. 2005. Transient floralchange and rapid global warming at the Paleocene-Eocene boundary. Science 310:993–96
174. Wing SL, Herrera F, Jaramillo CA, Gomez-Navarro C, Wilf P, Labandeira CC. 2009. Late Paleocenefossils from the Cerrejon Formation, Colombia, are the earliest record of Neotropical rainforest. PNAS106:18627–32
175. Wotzlaw J-F, Guex J, Bartolini A, Gallet Y, Krystyn L, et al. 2014. Towards accurate numerical calibrationof the Late Triassic: high-precision U-Pb geochronology constraints on the duration of the Rhaetian.Geology 42:571–74
176. Wright IJ, Reich PB, Westoby M, Ackerly DD, Baruch Z, et al. 2004. The worldwide leaf economicsspectrum. Nature 428:821–27
177. Wu J-Y, Ding S-T, Li Q-J, Sun B-N, Wang Y-D. 2016. Reconstructing paleoatmospheric CO2 levelsbased on fossil Ginkgoites from the Upper Triassic and Middle Jurassic in Northwest China. PalZ 90:377–87
178. Yan D, Sun B, Xie S, Li X, Wen W. 2009. Response to paleoatmospheric CO2 concentration of Solenitesvimineus (Phillips) Harris (Ginkgophyta) from the Middle Jurassic of the Yaojie Basin, Gansu Province,China. Sci. China Ser. D 52:2029–39
179. Yiotis C, Evans-Fitz Gerald C, McElwain JC. 2017. Differences in the photosynthetic plasticity offerns and Ginkgo grown in experimentally controlled low [O2]:[CO2] atmospheres may explain theircontrasting ecological fate across the Triassic-Jurassic mass extinction boundary. Ann. Bot. 119:1385–95
180. Zachos J, Pagani M, Sloan L, Thomas E, Billups K. 2001. Trends, rhythms, and aberrations in globalclimate 65 Ma to present. Science 292:686–93
www.annualreviews.org • Paleobotany and Global Change 787
Ann
u. R
ev. P
lant
Bio
l. 20
18.6
9:76
1-78
7. D
ownl
oade
d fr
om w
ww
.ann
ualr
evie
ws.
org
Acc
ess
prov
ided
by
Uni
vers
idad
de
Cos
ta R
ica
(UC
R)
on 0
2/21
/19.
For
per
sona
l use
onl
y.
PP69_FrontMatter ARI 5 April 2018 9:11
Annual Review ofPlant Biology
Volume 69, 2018
Contents
My Secret LifeMary-Dell Chilton � � � � � � � � � � � � � � � � � � � � � � � � � � � � � � � � � � � � � � � � � � � � � � � � � � � � � � � � � � � � � � � � � � � � � � � � � � � � � 1
Diversity of Chlorophototrophic Bacteria Revealed in the Omics EraVera Thiel, Marcus Tank, and Donald A. Bryant � � � � � � � � � � � � � � � � � � � � � � � � � � � � � � � � � � � � � � � � � �21
Genomics-Informed Insights into Endosymbiotic Organelle Evolutionin Photosynthetic EukaryotesEva C.M. Nowack and Andreas P.M. Weber � � � � � � � � � � � � � � � � � � � � � � � � � � � � � � � � � � � � � � � � � � � � � � �51
Nitrate Transport, Signaling, and Use EfficiencyYa-Yun Wang, Yu-Hsuan Cheng, Kuo-En Chen, and Yi-Fang Tsay � � � � � � � � � � � � � � � � � � � � �85
Plant VacuolesTomoo Shimada, Junpei Takagi, Takuji Ichino, Makoto Shirakawa,
and Ikuko Hara-Nishimura � � � � � � � � � � � � � � � � � � � � � � � � � � � � � � � � � � � � � � � � � � � � � � � � � � � � � � � � � � � � � 123
Protein Quality Control in the Endoplasmic Reticulum of PlantsRichard Strasser � � � � � � � � � � � � � � � � � � � � � � � � � � � � � � � � � � � � � � � � � � � � � � � � � � � � � � � � � � � � � � � � � � � � � � � � � � � � � 147
Autophagy: The Master of Bulk and Selective RecyclingRichard S. Marshall and Richard D. Vierstra � � � � � � � � � � � � � � � � � � � � � � � � � � � � � � � � � � � � � � � � � � � � � 173
Reactive Oxygen Species in Plant SignalingCezary Waszczak, Melanie Carmody, and Jaakko Kangasjarvi � � � � � � � � � � � � � � � � � � � � � � � � � � 209
Cell and Developmental Biology of Plant Mitogen-Activated ProteinKinasesGeorge Komis, Olga Samajova, Miroslav Ovecka, and Jozef Samaj � � � � � � � � � � � � � � � � � � � � � 237
Receptor-Like Cytoplasmic Kinases: Central Players in Plant ReceptorKinase–Mediated SignalingXiangxiu Liang and Jian-Min Zhou � � � � � � � � � � � � � � � � � � � � � � � � � � � � � � � � � � � � � � � � � � � � � � � � � � � � � � 267
Plant Malectin-Like Receptor Kinases: From Cell Wall Integrity toImmunity and BeyondChristina Maria Franck, Jens Westermann, and Aurelien Boisson-Dernier � � � � � � � � � � � � 301
Kinesins and Myosins: Molecular Motors that Coordinate CellularFunctions in PlantsAndreas Nebenfuhr and Ram Dixit � � � � � � � � � � � � � � � � � � � � � � � � � � � � � � � � � � � � � � � � � � � � � � � � � � � � � � � � 329
v
Ann
u. R
ev. P
lant
Bio
l. 20
18.6
9:76
1-78
7. D
ownl
oade
d fr
om w
ww
.ann
ualr
evie
ws.
org
Acc
ess
prov
ided
by
Uni
vers
idad
de
Cos
ta R
ica
(UC
R)
on 0
2/21
/19.
For
per
sona
l use
onl
y.
PP69_FrontMatter ARI 5 April 2018 9:11
The Oxylipin Pathways: Biochemistry and FunctionClaus Wasternack and Ivo Feussner � � � � � � � � � � � � � � � � � � � � � � � � � � � � � � � � � � � � � � � � � � � � � � � � � � � � � � � � 363
Modularity in Jasmonate Signaling for Multistress ResilienceGregg A. Howe, Ian T. Major, and Abraham J. Koo � � � � � � � � � � � � � � � � � � � � � � � � � � � � � � � � � � � � � 387
Essential Roles of Local Auxin Biosynthesis in Plant Developmentand in Adaptation to Environmental ChangesYunde Zhao � � � � � � � � � � � � � � � � � � � � � � � � � � � � � � � � � � � � � � � � � � � � � � � � � � � � � � � � � � � � � � � � � � � � � � � � � � � � � � � � � � 417
Genetic Regulation of Shoot ArchitectureBing Wang, Steven M. Smith, and Jiayang Li � � � � � � � � � � � � � � � � � � � � � � � � � � � � � � � � � � � � � � � � � � � 437
Heterogeneity and Robustness in Plant Morphogenesis: From Cellsto OrgansLilan Hong, Mathilde Dumond, Mingyuan Zhu, Satoru Tsugawa,
Chun-Biu Li, Arezki Boudaoud, Olivier Hamant, and Adrienne H.K. Roeder � � � � � � 469
Genetically Encoded Biosensors in Plants: Pathways to DiscoveryAnkit Walia, Rainer Waadt, and Alexander M. Jones � � � � � � � � � � � � � � � � � � � � � � � � � � � � � � � � � � � 497
Exploring the Spatiotemporal Organization of Membrane Proteins inLiving Plant CellsLi Wang, Yiqun Xue, Jingjing Xing, Kai Song, and Jinxing Lin � � � � � � � � � � � � � � � � � � � � � � � 525
One Hundred Ways to Invent the Sexes: Theoretical and ObservedPaths to Dioecy in PlantsIsabelle M. Henry, Takashi Akagi, Ryutaro Tao, and Luca Comai � � � � � � � � � � � � � � � � � � � � � � 553
Meiotic Recombination: Mixing It Up in PlantsYingxiang Wang and Gregory P. Copenhaver � � � � � � � � � � � � � � � � � � � � � � � � � � � � � � � � � � � � � � � � � � � � 577
Population Genomics of Herbicide Resistance: Adaptation viaEvolutionary RescueJulia M. Kreiner, John R. Stinchcombe, and Stephen I. Wright � � � � � � � � � � � � � � � � � � � � � � � � � 611
Strategies for Enhanced Crop Resistance to Insect PestsAngela E. Douglas � � � � � � � � � � � � � � � � � � � � � � � � � � � � � � � � � � � � � � � � � � � � � � � � � � � � � � � � � � � � � � � � � � � � � � � � � � � 637
Preadaptation and Naturalization of Nonnative Species: Darwin’s TwoFundamental Insights into Species InvasionMarc W. Cadotte, Sara E. Campbell, Shao-peng Li, Darwin S. Sodhi,
and Nicholas E. Mandrak � � � � � � � � � � � � � � � � � � � � � � � � � � � � � � � � � � � � � � � � � � � � � � � � � � � � � � � � � � � � � � � � 661
Macroevolutionary Patterns of Flowering Plant Speciationand ExtinctionJana C. Vamosi, Susana Magallon, Itay Mayrose, Sarah P. Otto,
and Herve Sauquet � � � � � � � � � � � � � � � � � � � � � � � � � � � � � � � � � � � � � � � � � � � � � � � � � � � � � � � � � � � � � � � � � � � � � � � 685
vi Contents
Ann
u. R
ev. P
lant
Bio
l. 20
18.6
9:76
1-78
7. D
ownl
oade
d fr
om w
ww
.ann
ualr
evie
ws.
org
Acc
ess
prov
ided
by
Uni
vers
idad
de
Cos
ta R
ica
(UC
R)
on 0
2/21
/19.
For
per
sona
l use
onl
y.
PP69_FrontMatter ARI 5 April 2018 9:11
When Two Rights Make a Wrong: The Evolutionary Genetics ofPlant Hybrid IncompatibilitiesLila Fishman and Andrea L. Sweigart � � � � � � � � � � � � � � � � � � � � � � � � � � � � � � � � � � � � � � � � � � � � � � � � � � � � � 707
The Physiological Basis of Drought Tolerance in Crop Plants:A Scenario-Dependent Probabilistic ApproachFrancois Tardieu, Thierry Simonneau, and Bertrand Muller � � � � � � � � � � � � � � � � � � � � � � � � � � � � 733
Paleobotany and Global Change: Important Lessons for Species toBiomes from Vegetation Responses to Past Global ChangeJennifer C. McElwain � � � � � � � � � � � � � � � � � � � � � � � � � � � � � � � � � � � � � � � � � � � � � � � � � � � � � � � � � � � � � � � � � � � � � � � 761
Trends in Global Agricultural Land Use: Implications forEnvironmental Health and Food SecurityNavin Ramankutty, Zia Mehrabi, Katharina Waha, Larissa Jarvis,
Claire Kremen, Mario Herrero, and Loren H. Rieseberg � � � � � � � � � � � � � � � � � � � � � � � � � � � � � � 789
Errata
An online log of corrections to Annual Review of Plant Biology articles may be found athttp://www.annualreviews.org/errata/arplant
Contents vii
Ann
u. R
ev. P
lant
Bio
l. 20
18.6
9:76
1-78
7. D
ownl
oade
d fr
om w
ww
.ann
ualr
evie
ws.
org
Acc
ess
prov
ided
by
Uni
vers
idad
de
Cos
ta R
ica
(UC
R)
on 0
2/21
/19.
For
per
sona
l use
onl
y.