Embed Size (px)
Citation preview

Paleolithic nutrition:what did our ancestors eat?Janette Brand Miller Neil MannLoren Cordain

Paleolithic nutrition is the study of diets consumed by our early ‘stone age’ ancestors, members of our spe-cies who lived from around 750,000
years ago up until 10,000 years ago (Figure 1). During this period, hominids relied on stone technology to sustain their scavenging, hunting and gathering lifestyle (Figure 2). Paleolithic diets are a subject of interest for various reasons. Apart from the intrinsic value of knowing more about our past, many health experts have sug-gested that the ‘native diet’ during human evolu-tion is the healthiest diet, the one that meets all our nutritional needs and to which we are genetically adapted. Just as veterinarians try to give zoo animals a diet closest to that which they consumed in the wild, many nutritionists believe that the diet eaten for the greater part of one mil-lion years of human evolution is the ideal diet. Conversely, they believe that modern illnesses such as type 2 diabetes and coronary heart dis-ease are a consequence of eating a diet to which we are not genetically adapted (Figure 3). The last 10,000 years ago (a mere ‘tick’ on the evolu-tionary clock) have brought near inconceivable changes to diet and physical activity.
30 | Genes to Galaxies
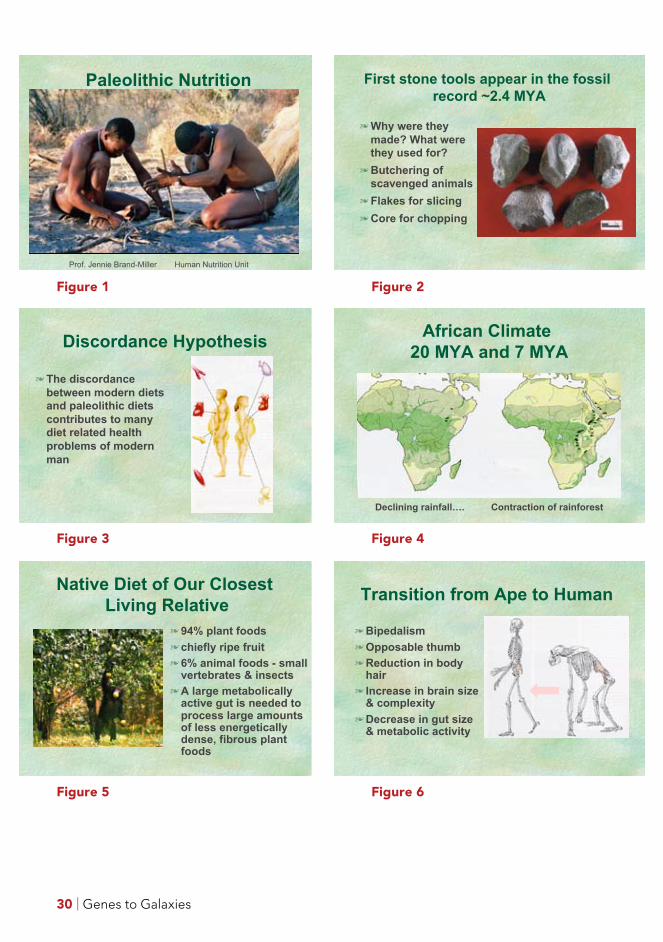
First stone tools appear in the fossil
record ~2.4 MYA
Why were they
made? What were
they used for?
Butchering of
scavenged animals
Flakes for slicing
Core for chopping
Paleolithic Nutrition
Prof. Jennie Brand-Miller Human Nutrition Unit
Native Diet of Our Closest
Living Relative
94% plant foods
chiefly ripe fruit
6% animal foods - small vertebrates & insects
A large metabolically active gut is needed to process large amounts of less energetically dense, fibrous plant foods
Transition from Ape to Human
Bipedalism
Opposable thumb
Reduction in body hair
Increase in brain size & complexity
Decrease in gut size & metabolic activity
Discordance Hypothesis
The discordance
between modern diets
and paleolithic diets
contributes to many
diet related health
problems of modern
man
African Climate
20 MYA and 7 MYA
Declining rainfall…. Contraction of rainforest
Figure 1
Figure 3
Figure 5
Figure 2
Figure 4
Figure 6
Paleolithic nutrition: what did our ancestors eat? | 31
Climate dictates food sourcesFor most of geological time, the world’s climate was warmer and more homogeneous than it is today (Figure 4). Our pre-human ancestors who lived in Africa >7 million years ago en-joyed a warm, moist environment and gathered ripe fruits, leaves and berries from the tropical forests (Figure 4 and 5). But gradually the plan-et cooled. About 2.5 million years ago, a severe Ice Age sent global temperatures plummeting and prompted the conversion of moist African woodland into much drier open savanna. As the grasslands expanded, the tree cover shrank and one or more species of forest dwelling chimpanzee evolved into bipedal hominids (Figure 6). Homo habilis who lived 2 million years BP supplemented a largely vegetarian diet with meat left over from predators’ kills (i.e. they scavenged). But Homo erectus who lived 1.5 million years BP is known to have actively hunted. Many scientists believe that hunting was the pressure that selected for the larger and larger brain of our species, Homo sapiens sapiens (the phrase “man the hunter” originated with this idea)(Figure 7 and 8).
As one Ice Age followed another, hunting and fishing became a dominant way of life in both warm and cold environments. During Ice Ages, large amounts of water become locked into the polar ice caps, making the whole planet drier because less water falls as rain and snow. Plant growth slows, rainforests shrink and grasslands dominate the landscape. Herbivores came into their own and grazing animals multiplied in their millions. From 50,000 years ago, we know that Neanderthals were cold-climate hunters of large game. Indeed, over winter they subsisted primarily on game. One large mammoth kill would have nourished a family group of 50 individuals for at least 3 months. Similarly, Cro-Magnon man who replaced the Neanderthals about 35,000 years ago, lived through the coldest of the Ice Ages on a high meat diet. The Hall of Bulls in the famous Lascaux Caves in southern France is a testament to the importance of animals to the people who lived 17,000 years ago (Figure 9). Similarly, we know that the ancestors of the Aborigines who inhabited Australia 40-50,000 years ago led a hunting and shellfish gathering
existence. Even during the warm inter-glacials, parts of the world remained cold (e.g. Arctic and sub-arctic regions) and continued to have little vegetation. The human inhabitants of those regions maintained a hunting/fishing existence right up to recent times. Indeed, the Inuit and other native Canadians are a modern day example of a group whose historic diet was high in animal food and low in plant matter.
During the early and mid 20th century, anthro-pologists studied the planet’s few remaining hunter-gatherer societies. To their surprise, they found them generally free of the signs and symptoms of the so-called diseases of civilization. Although their nutritional patterns probably would not have been identical to hominids living during the Paleolithic period, they represent the best ‘window’ we have into the range and quantity of wild and unculti-vated foods making up humanity’s ‘native’ diet. Consequently, the characterization and descrip-tion of hunter-gatherer diets has important implications in designing therapeutic diets that reduce the risk for chronic diseases in modern, western cultures.
These ethnographic and anthropological stud-ies tell us that there was no single, uniform diet which typified the nutritional patterns of all pre-agricultural humans. Humans were masters of flexibility, with the ability to live in a rain forest or near the polar ice caps. Yet, based upon limited information, many anthropolo-gists incorrectly concluded that the universal pattern of subsistence was one in which plant foods contributed the majority of food energy. However, more recent and comprehensive ethnographic compilations (Cordain et al, 2000a) as well as quantitative dietary analyses in foraging populations, have been unable to confirm the conclusions of these earlier studies. In fact, the later studies demonstrated that ani-mal foods, rather than plant foods, comprised the majority of energy in the typical hunter-gatherer diet.
Unfortunately, in the context of western diets, increasing meat consumption (particularly red and processed meat) is linked to a greater risk of cardiovascular disease. In countries like the USA, meats contribute much of the fat,

32 | Genes to Galaxies
Inclusion of more animal food in the
diet allowed brain to enlarge How?
Humans expend 20-25% of
RMR to fuel the brain whereas
chimps require 8%
Two possibilities:
(1) increases in total metabolic
rate
(2) reduction in size &
metabolic rate of another
organ Aiello LC Wheeler. The expensive tissue
hypothesisCurr Anthropol 1995 36:199-221.
Evidence of Complex Big Game
Hunting in Homo Sapiens
Anatomically modern
H. sapiens appear
(~100,000 yrs ago)
A spear point was
found lodged in the
vertebra of a giant
buffalo at Klasies River
Cave, South Africa
(60-120,000 yrs ago)
Dependence on gathered plant foods Frequency Distribution of Subsistence Dependence (n = 229)
11
35
4245
35
30
23
6
20
0
5
10
15
20
25
30
35
40
45
50
Fre
qu
en
cy
% Dependence
0-5 6-15 16-25 26-35 36-45 46-55 56-65 66-75 76-85 86-100
On average, plant
foods contributed
25-35% of energy
Only 13% obtained
more than half their
energy from plant
foods
Dependence on hunted animal foods Frequency Distribution of Subsistence Dependence (n = 229)
0
8
36
89
47
21
11
5
9
3
0
10
20
30
40
50
60
70
80
90
100
Fre
qu
en
cy
% Dependence
0-5 6-15 16-25 26-35 36-45 46-55 56-65 66-75 76-85 86-100
Mode = (26-35%)
Median = (26-35%)
On average,
hunted animal
foods contributed 26-35% of energy
Hall of Bulls -Lascaux Cave,
France (17,000 yrs ago) Plant Foods
How important
(quantitatively) were
gathered foods in the diets
of pre-agricultural humans?
Only quantitative evidence
comes from observations of
early ethnographers who
studied world’s ‘remnant’
hunter-gatherers
Figure 7
Figure 9
Figure 11
Figure 8
Figure 10
Figure 12
Paleolithic nutrition: what did our ancestors eat? | 33
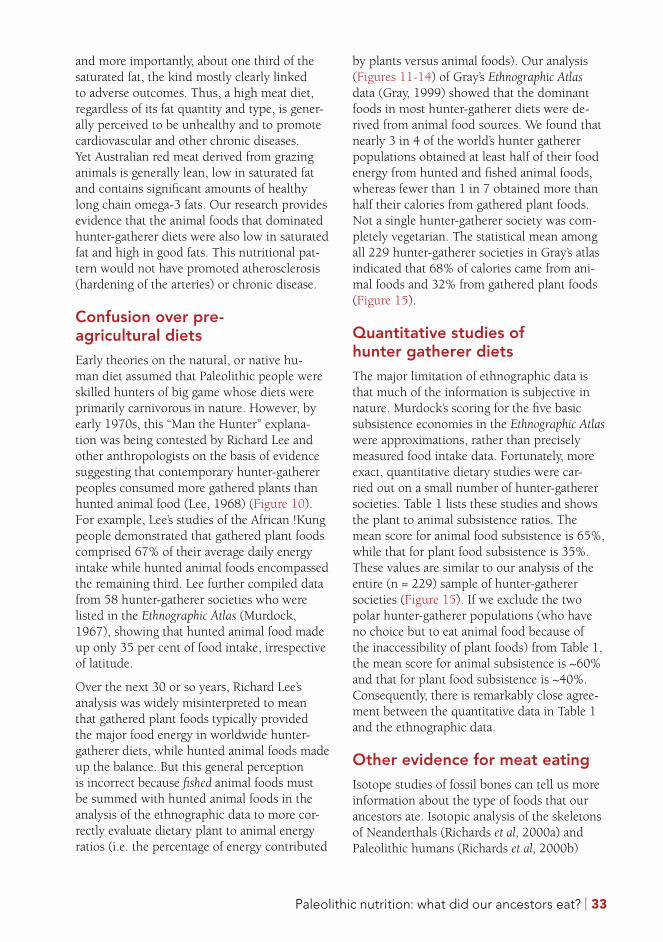
and more importantly, about one third of the saturated fat, the kind mostly clearly linked to adverse outcomes. Thus, a high meat diet, regardless of its fat quantity and type, is gener-ally perceived to be unhealthy and to promote cardiovascular and other chronic diseases. Yet Australian red meat derived from grazing animals is generally lean, low in saturated fat and contains significant amounts of healthy long chain omega-3 fats. Our research provides evidence that the animal foods that dominated hunter-gatherer diets were also low in saturated fat and high in good fats. This nutritional pat-tern would not have promoted atherosclerosis (hardening of the arteries) or chronic disease.
Confusion over pre-agricultural dietsEarly theories on the natural, or native hu-man diet assumed that Paleolithic people were skilled hunters of big game whose diets were primarily carnivorous in nature. However, by early 1970s, this “Man the Hunter” explana-tion was being contested by Richard Lee and other anthropologists on the basis of evidence suggesting that contemporary hunter-gatherer peoples consumed more gathered plants than hunted animal food (Lee, 1968) (Figure 10). For example, Lee’s studies of the African !Kung people demonstrated that gathered plant foods comprised 67% of their average daily energy intake while hunted animal foods encompassed the remaining third. Lee further compiled data from 58 hunter-gatherer societies who were listed in the Ethnographic Atlas (Murdock, 1967), showing that hunted animal food made up only 35 per cent of food intake, irrespective of latitude.
Over the next 30 or so years, Richard Lee’s analysis was widely misinterpreted to mean that gathered plant foods typically provided the major food energy in worldwide hunter-gatherer diets, while hunted animal foods made up the balance. But this general perception is incorrect because fished animal foods must be summed with hunted animal foods in the analysis of the ethnographic data to more cor-rectly evaluate dietary plant to animal energy ratios (i.e. the percentage of energy contributed
by plants versus animal foods). Our analysis (Figures 11-14) of Gray’s Ethnographic Atlas data (Gray, 1999) showed that the dominant foods in most hunter-gatherer diets were de-rived from animal food sources. We found that nearly 3 in 4 of the world’s hunter gatherer populations obtained at least half of their food energy from hunted and fished animal foods, whereas fewer than 1 in 7 obtained more than half their calories from gathered plant foods. Not a single hunter-gatherer society was com-pletely vegetarian. The statistical mean among all 229 hunter-gatherer societies in Gray’s atlas indicated that 68% of calories came from ani-mal foods and 32% from gathered plant foods (Figure 15).
Quantitative studies of hunter gatherer dietsThe major limitation of ethnographic data is that much of the information is subjective in nature. Murdock’s scoring for the five basic subsistence economies in the Ethnographic Atlas were approximations, rather than precisely measured food intake data. Fortunately, more exact, quantitative dietary studies were car-ried out on a small number of hunter-gatherer societies. Table 1 lists these studies and shows the plant to animal subsistence ratios. The mean score for animal food subsistence is 65%, while that for plant food subsistence is 35%. These values are similar to our analysis of the entire (n = 229) sample of hunter-gatherer societies (Figure 15). If we exclude the two polar hunter-gatherer populations (who have no choice but to eat animal food because of the inaccessibility of plant foods) from Table 1, the mean score for animal subsistence is ~60% and that for plant food subsistence is ~40%. Consequently, there is remarkably close agree-ment between the quantitative data in Table 1 and the ethnographic data.
Other evidence for meat eatingIsotope studies of fossil bones can tell us more information about the type of foods that our ancestors ate. Isotopic analysis of the skeletons of Neanderthals (Richards et al, 2000a) and Paleolithic humans (Richards et al, 2000b)

34 | Genes to Galaxies
Dependence on fished animal foods Frequency Distribution of Subsistence Dependence (n = 229)
36
23
37
34
30
38
21
5 5
0
0
5
10
15
20
25
30
35
40
Fre
qu
en
cy
% Dependence
0-5 6-15 16-25 26-35 36-45 46-55 56-65 66-75 76-85 86-100
Mode = (46-55%)
Median = (26-35%)
On average, fishing
contributed 26-35%
of energy
Total dependence on animal foods
(hunted + fished)
0 02
6
23
30
35
45
42
46
0
5
10
15
20
25
30
35
40
45
50
Fre
qu
en
cy
% Dependence
0-5 6-15 16-25 26-35 36-45 46-55 56-65 66-75 76-85 86-100
Mode = (66-75%)
Median = (86-100%)
On average, all
animal foods
(hunted and fished) contributed >66%
of energy
Dietary Macronutrients Hunter Gatherer vs Modern Values
CHO
22-40 %
Protein
19-35 %
Fat
28-47 %
Hunter Gatherer Societies
n=133 (58.1%)
Fat
34%
Protein
15%
CHO
49%
Present USA Values
NHANES III
ETOH-
3%
Recommended Dietary
Macronutrient Intake
CHO
55% or more
Fat
30% or less
Protein
15%
American Heart Association
Recommended Diet
Plant:Animal Ratios Hunter Gatherer Modern Diets
62 %
Plant
Food
38 %
Animal
Food
National Food Consumption
Survey 1987-88
Mean values,
229 Hunter Gatherer
Societies
68 %
Animal
Food
32 %
Plant
Food
Foods not present in pre-
agricultural diets Breads, Cereals, Rice and Pasta Dairy Products Added Salt
Refined Vegetable Oils Refined Sugars
(except honey) Alcohol
Figure 13
Figure 15
Figure 17
Figure 14
Figure 16
Figure 18

Paleolithic nutrition: what did our ancestors eat? | 35
suggests that the dominance of animal foods in the human diet was not simply a recent phenomenon limited to contemporary hunter-gatherers, but rather one with a long history. These studies provide objective evidence that the diets of hominids living in Europe during the Paleolithic were indistinguishable from that of carnivores such as arctic foxes and wolves. Indeed, hominids may have experienced genet-ic adaptations to animal-based diets early on in their evolution, analogous to those of obligate carnivores such as cats (felines).
Carnivorous diets reduce the evolutionary selective pressures that act to maintain ana-tomical and physiological features needed to process and metabolize large amounts of plant matter. Like cats, humans have experienced a reduction in gut size and metabolic activity, along with a concurrent expansion of brain size (Figure 7). This occurred at the very same time that more and more energetically dense animal food was incorporated. The brain is a very energy-demanding organ, responsible for about one quarter of our basal metabolic rate. Further, similar to obligate carnivores, humans have a limited ability to manufacture the long chain, highly polyunsaturated fatty acids that characterize our complex brain and nervous system. Long chain polyunsaturated fatty acids
are essential cellular lipids that are found only in animal foods. The implication is that by eat-ing abundant pre-formed sources of these fatty acids, our bodies gradually lost the ability to synthesise them ‘in house’.
Finally, our species (again like cats) has a limited capacity to synthesize the amino acid taurine from its precursor amino acids. Vegetarian diets are known to result in lower blood concentrations of taurine. This implies that the need to synthesize taurine may have been unnecessary because dietary sources of pre-formed taurine had relaxed the selective pressure to maintain the metabolic machinery.
There are additional signs that we were grow-ing dependent on animal food sources. One of our essential micronutrients is Vitamin B12 and found only in animal foods. Similarly, the rich-est sources of iron, iodine, folic acid and vita-min A are animal foods. The most common nu-trient deficiencies today are associated with low meat consumption. Iron deficiency anaemia is prevalent in both rich and poor countries, while iodine deficiency affects up to 2 billion people world wide, resulting in goitre, cretin-ism and enough mental retardation to reduce a population’s average IQ. (Incidentally, iodine deficiency is rising sharply in Australia because dairy manufacturers no longer use iodophors as
Table 1: Quantitatively determined proportions of plant and animal food in hunter-gatherer diets.
Population Location Latitude % animal food % plant food
Aborigines Australia 12S 77 23Ache Paraguay 25S 78 22
Anbarra Australia 12S 75 25Efe Africa 2N 44 56
Eskimo Greenland 69N 96 4Gwi Africa 23S 26 74
Hadza Africa 3S 48 52Hiwi Venezuela 6N 75 25
!Kung Africa 20S 33 67!Kung Africa 20S 68 32Nukak Columbia 2N 41 59
Nunamiut Alaska 68N 99 1Onge Andaman 12N 79 21
36 | Genes to Galaxies
cleansing agents in dairy factories). Folic acid deficiency causes a birth defect in which the brain and spinal cord do not develop normally, a condition known as ‘neural tube defect’. Although dark green leafy vegetables are a good source of folic acid, the very richest source is animal liver, a commodity regularly consumed by our hunter-gatherer ancestors. Finally, hu-mans have a finite capacity to convert the yel-low/orange coloured carotenoids in plant foods into vitamin A. Today, vitamin A deficiency blindness is the most common cause of vision loss in the world and again, the richest sources of vitamin A are liver and animal flesh. So gradually, but surely, we evolved a metabolism that depended on at least moderate intake of animal foods.
Hunter-gatherer foraging strategiesOur analyses of both the ethnographic data and the quantitative dietary data (Table 1) show that animal foods were our preferred energy source, even when plant food sources were available year round such as in the tropics. Only when it was difficult to procure animal food sources, or when energy-dense, easily procured plant foods were available (eg the mongongo nut for the South African !Kung people), did plant foods prevail as a major en-ergy component in hunter-gatherer diets.
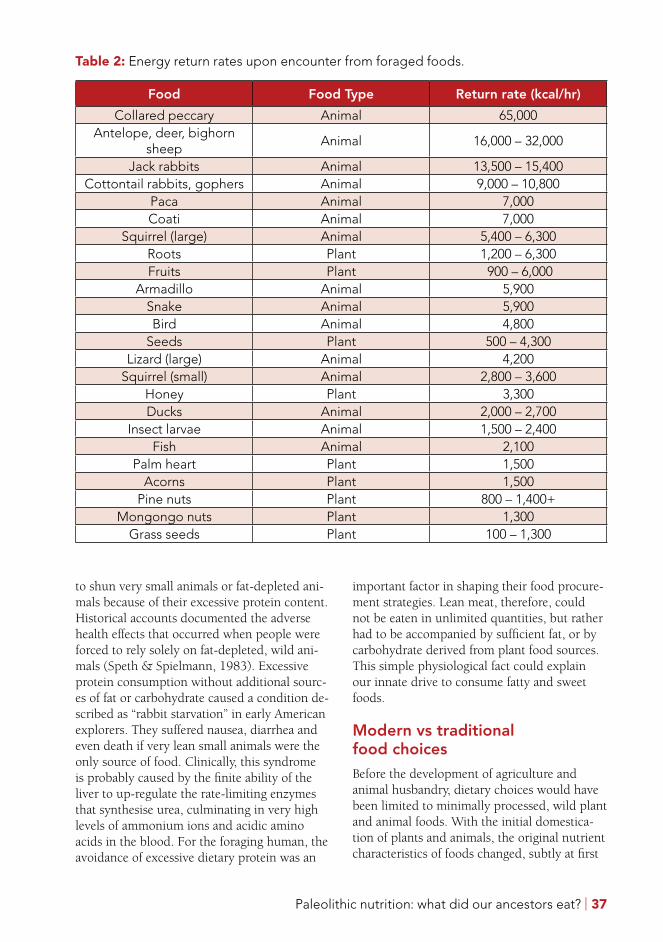
Foraging humans are similar to other animals in natural settings in that they attempt to maximize the energy ‘capture’ rate, i.e. the ratio between the energy obtained from a food source compared to the energy expenditure needed to acquire it while hunting, fishing or gathering (this is known as the Optimal Foraging Theory). Table 2 shows the energy return rates for a variety of plant and animal foods that were known components of hunter-gatherer diets. Clearly, animal foods yield the highest energy return rates, and larger animals generally produce greater energy returns than smaller animals. Although the potential food mass would be similar between a single deer weighing 45 kg and 1,600 mice weighing 30 g each, foraging humans would have to expend significantly more energy capturing the 1,600 mice than a single deer. Hence, the killing of larger animals increases the energy capture/energy expenditure ratio not only because it reduces energy expenditure, but because it in-creases the total energy captured.
Due to the relative constancy of the protein content of an animal’s muscle mass, the energy density of an edible carcass is almost entirely dependent upon its body fat content. Varying amounts of body fat determine the protein to fat energy ratio in an edible carcass. Because smaller animal species have proportionately less body fat than larger species, their carcasses contain more protein as a percentage of their available food energy. Hunter-gatherers tended
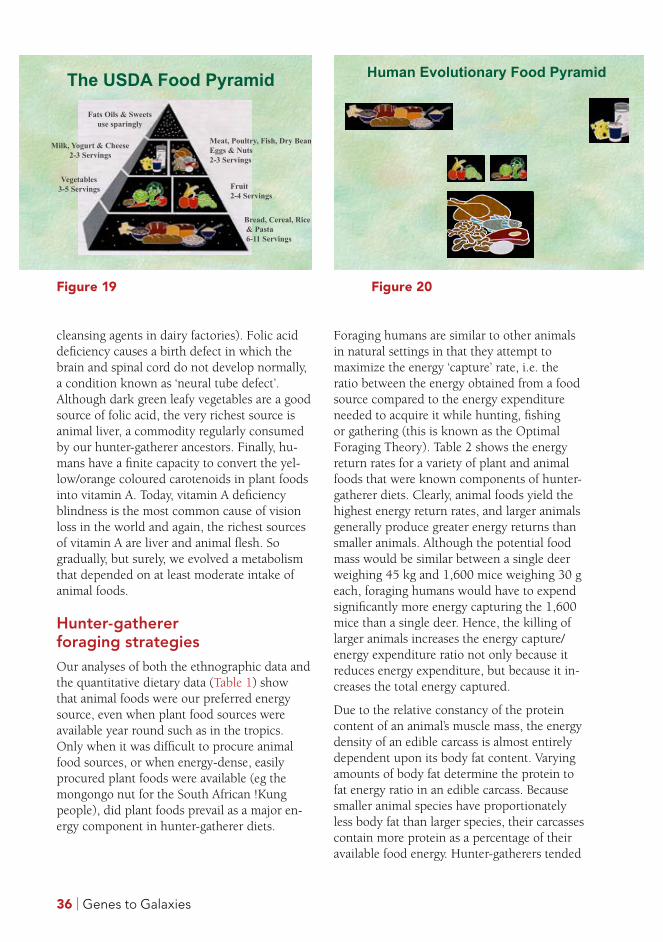
The USDA Food Pyramid
Fats Oils & Sweets
use sparingly
Milk, Yogurt & Cheese
2-3 Servings
Vegetables
3-5 Servings
Bread, Cereal, Rice
& Pasta
6-11 Servings
Fruit
2-4 Servings
Meat, Poultry, Fish, Dry Beans,
Eggs & Nuts
2-3 Servings
Human Evolutionary Food Pyramid
Figure 19 Figure 20
Paleolithic nutrition: what did our ancestors eat? | 37
to shun very small animals or fat-depleted ani-mals because of their excessive protein content. Historical accounts documented the adverse health effects that occurred when people were forced to rely solely on fat-depleted, wild ani-mals (Speth & Spielmann, 1983). Excessive protein consumption without additional sourc-es of fat or carbohydrate caused a condition de-scribed as “rabbit starvation” in early American explorers. They suffered nausea, diarrhea and even death if very lean small animals were the only source of food. Clinically, this syndrome is probably caused by the finite ability of the liver to up-regulate the rate-limiting enzymes that synthesise urea, culminating in very high levels of ammonium ions and acidic amino acids in the blood. For the foraging human, the avoidance of excessive dietary protein was an
important factor in shaping their food procure-ment strategies. Lean meat, therefore, could not be eaten in unlimited quantities, but rather had to be accompanied by sufficient fat, or by carbohydrate derived from plant food sources. This simple physiological fact could explain our innate drive to consume fatty and sweet foods.
Modern vs traditional food choicesBefore the development of agriculture and animal husbandry, dietary choices would have been limited to minimally processed, wild plant and animal foods. With the initial domestica-tion of plants and animals, the original nutrient characteristics of foods changed, subtly at first
Table 2: Energy return rates upon encounter from foraged foods.
Food Food Type Return rate (kcal/hr)
Collared peccary Animal 65,000Antelope, deer, bighorn
sheepAnimal 16,000 – 32,000
Jack rabbits Animal 13,500 – 15,400Cottontail rabbits, gophers Animal 9,000 – 10,800
Paca Animal 7,000Coati Animal 7,000
Squirrel (large) Animal 5,400 – 6,300Roots Plant 1,200 – 6,300Fruits Plant 900 – 6,000
Armadillo Animal 5,900Snake Animal 5,900Bird Animal 4,800
Seeds Plant 500 – 4,300Lizard (large) Animal 4,200
Squirrel (small) Animal 2,800 – 3,600Honey Plant 3,300Ducks Animal 2,000 – 2,700
Insect larvae Animal 1,500 – 2,400Fish Animal 2,100
Palm heart Plant 1,500Acorns Plant 1,500
Pine nuts Plant 800 – 1,400+Mongongo nuts Plant 1,300
Grass seeds Plant 100 – 1,300
38 | Genes to Galaxies
but more rapidly with advancing technology after the Industrial Revolution. Food processing procedures were developed which had pro-found physiological implications.
Today we eat many types of food that were absent from the diet of Paleolithic people. Dairy products, cereals, refined sugars, refined vegetable oils, and alcohol make up over 70% of the total daily energy consumed by people in developed nations (Figure 16). But these types of foods would have contributed little or none of the energy in the typical pre-agricultural hu-man diet. Additionally, mixtures of foods that make up much of our present diet (eg, cookies, cake, breakfast cereals, bagels, rolls, muffins, crackers, chips, snack foods, pizza, soft drinks,
candy, ice cream, condiments, and salad dress-ings) were absent.
Dairy foods Humans, like all mammals, would have consumed the milk of their own species during infancy. However, after weaning, the consumption of milk and milk products of other mammals would have been minimal. Sheep, goats and cows were not domesticated until ~10,000 years ago and direct evidence of dairying dates to only ~6000 years ago. Most of the world’s population still does not consume milk beyond infancy. It should not be surpris-ing therefore to learn that more than 80% of humans do not have the capacity to hydrolyse lactose, the carbohydrate in milk, after early childhood. However, European Caucasians and their descendents in America and Australia, who have been exposed to dairying for several thousand years, can generally digest lactose well throughout life.
Cereals Wild cereal grains are usually small, difficult to harvest, and virtually indigestible without processing (grinding) and cooking. For this reason, Paleolithic people ate little of them. Grinding tools in the fossil record represents a reliable indication of when and where cultures
began to include cereal grains in their diet.
Ground stone mortars, bowls, and cup holes first appeared from 40,000 years ago to 12,000 years ago. Domestication of emmer and einkorn wheat heralded the beginnings of early agricul-ture in southeastern Turkey about 10,000 years ago. There was therefore little or no previous
evolutionary experience for cereal grain con-sumption throughout human evolution. Again, it should not be surprising to learn that many people are allergic to the gluten protein found in wheat, rye and barley. Known as celiac disease, it causes the body’s immune system to attack itself and affects more than one in every 133 people.
Today, most cereals consumed in the west-ern diet are highly processed refined grains. Preceding the Industrial Revolution, all cereals were ground with the use of stone milling tools, and unless the flour was sieved, it contained the entire contents of the cereal grain, includ-ing the germ, bran, and endosperm. With the invention of mechanized steel roller mills and automated sifting devices in the latter
part of the 19th century, the nutritional and physiological characteristics of milled grain changed, becoming virtually pure starch from just the seed endosperm. As a consequence, the foods made from fine flours, such as bread, are quickly digested and absorbed, and raise blood sugars rapidly when consumed. Many recent studies suggest that carbohydrates that are digested and absorbed quickly (known as high glycemic index foods), increase the risk of chronic diseases such as type 2 diabetes and cardiovascular disease (Barclay et al. 2008).
Alcohol In contrast to dairy products, cereal grains, refined sugars, and refined oils, alcohol consumption represents a relatively minor frac-tion (1 or 2%) of the total energy consumed in western diets. The earliest evidence for wine drinking from domesticated vines comes from a pottery jar dated ~7000 years BP from northern Iran. The fermentation process that produces wine takes place naturally and, without doubt, must have occurred countless times before hu-mans learned to control the process. As grapes reach their peak of ripeness in the fall, they may swell in size and burst, thereby allowing the sugars in the juice to be exposed to yeasts
growing on the skins and to produce carbon dioxide and ethanol. Because of seasonal fluc-tuations in fruit availability and the limited liquid storage capacity of hunter-gatherers, it is likely that fermented fruit drinks, such as wine, would have made an insignificant contribution to total energy in Paleolithic diets.
Paleolithic nutrition: what did our ancestors eat? | 39
Salt The total quantity of salt included in the typical diet of westernized nations amounts
to nearly 10 g/day. About 75% is derived from salt added to processed foods by manufactur-ers; 15% comes from discretionary sources (ie, cooking and table salt use), and the remainder occurs naturally in basic foodstuffs. The system-atic mining, manufacture, and transportation of salt have their origin in the last 10,000 years. The earliest salt use is thought to have taken place in China about 6000 BC. Paleolithic hunter-gatherers living in coastal areas probably dipped food in seawater or used dried salt in a manner similar to nearly all Polynesian socie-ties at the time of European contact. But most recently studied inland hunter-gatherers add no or little salt to their food.
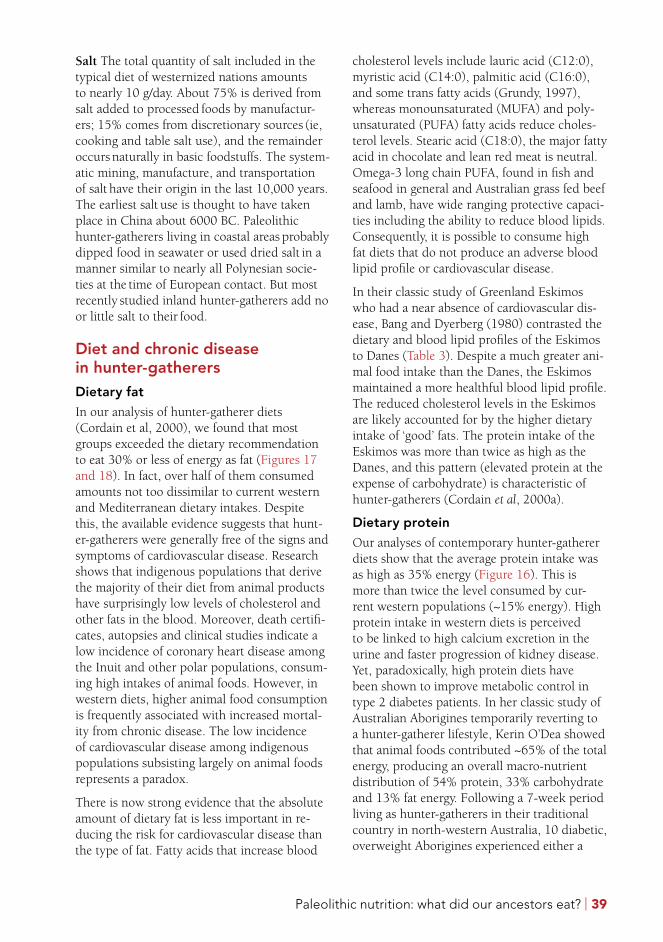
Diet and chronic disease in hunter-gatherersDietary fatIn our analysis of hunter-gatherer diets (Cordain et al, 2000), we found that most groups exceeded the dietary recommendation to eat 30% or less of energy as fat (Figures 17 and 18). In fact, over half of them consumed amounts not too dissimilar to current western and Mediterranean dietary intakes. Despite this, the available evidence suggests that hunt-er-gatherers were generally free of the signs and symptoms of cardiovascular disease. Research shows that indigenous populations that derive the majority of their diet from animal products have surprisingly low levels of cholesterol and other fats in the blood. Moreover, death certifi-cates, autopsies and clinical studies indicate a low incidence of coronary heart disease among the Inuit and other polar populations, consum-ing high intakes of animal foods. However, in western diets, higher animal food consumption is frequently associated with increased mortal-ity from chronic disease. The low incidence of cardiovascular disease among indigenous populations subsisting largely on animal foods represents a paradox.
There is now strong evidence that the absolute amount of dietary fat is less important in re-ducing the risk for cardiovascular disease than the type of fat. Fatty acids that increase blood
cholesterol levels include lauric acid (C12:0), myristic acid (C14:0), palmitic acid (C16:0), and some trans fatty acids (Grundy, 1997), whereas monounsaturated (MUFA) and poly-unsaturated (PUFA) fatty acids reduce choles-terol levels. Stearic acid (C18:0), the major fatty acid in chocolate and lean red meat is neutral. Omega-3 long chain PUFA, found in fish and seafood in general and Australian grass fed beef and lamb, have wide ranging protective capaci-ties including the ability to reduce blood lipids. Consequently, it is possible to consume high fat diets that do not produce an adverse blood lipid profile or cardiovascular disease.
In their classic study of Greenland Eskimos who had a near absence of cardiovascular dis-ease, Bang and Dyerberg (1980) contrasted the dietary and blood lipid profiles of the Eskimos to Danes (Table 3). Despite a much greater ani-mal food intake than the Danes, the Eskimos maintained a more healthful blood lipid profile. The reduced cholesterol levels in the Eskimos are likely accounted for by the higher dietary intake of ‘good’ fats. The protein intake of the Eskimos was more than twice as high as the Danes, and this pattern (elevated protein at the expense of carbohydrate) is characteristic of hunter-gatherers (Cordain et al, 2000a).
Dietary proteinOur analyses of contemporary hunter-gatherer diets show that the average protein intake was as high as 35% energy (Figure 16). This is more than twice the level consumed by cur-rent western populations (~15% energy). High protein intake in western diets is perceived to be linked to high calcium excretion in the urine and faster progression of kidney disease. Yet, paradoxically, high protein diets have been shown to improve metabolic control in type 2 diabetes patients. In her classic study of Australian Aborigines temporarily reverting to a hunter-gatherer lifestyle, Kerin O’Dea showed that animal foods contributed ~65% of the total energy, producing an overall macro-nutrient distribution of 54% protein, 33% carbohydrate and 13% fat energy. Following a 7-week period living as hunter-gatherers in their traditional country in north-western Australia, 10 diabetic, overweight Aborigines experienced either a

40 | Genes to Galaxies
great improvement or complete normalization of all of the major metabolic abnormalities characteristic of diabetes (O’Dea, 1984).
The fossil record indicates pre-agricultural hu-mans generally maintained greater bone mass than modern humans and hence greater bone strength and resistance to fractures (Bridges, 1995; Ruff et al, 1993). Greater bone strength has been attributed to the greater activity pat-terns of pre-agricultural humans, which in turn would have increased bone loading. It is also quite likely that the high fruit and vegetable consumption in hunter-gatherer diets would have buffered the high acid load and subse-quent high calcium excretion brought about by a high protein diet. In western diets, meats, cheeses and cereal grains yield high potential renal acid loads and hence may promote oste-oporosis (thinning of the bones) by producing a net metabolic acidosis. In contrast, fruits and vegetables yield a net alkaline renal load, and high fruit and vegetable diets have been shown to decrease urinary calcium excretion rates. Consequently, in hunter gatherer populations consuming high protein diets, a concomitant consumption of high levels of fruits and vegeta-bles may have countered the effects of a high protein diet.
Dietary carbohydrateOur studies also demonstrate that the carbo-hydrate content of hunter-gatherer diets would have ranged from 22 to 40% of total energy (Figure 16). The values within this range are considerably lower than average values in west-ern diets or recommended levels (50-60% or more of total energy). Although current advice to reduce risk of cardiovascular disease is to replace saturated fats with carbohydrate (Figure 17), there is mounting evidence to indicate that low fat, high carbohydrate diets may elicit undesirable changes in blood fats, including reductions in the good cholesterol (HDL) and triglycerides. Because of these untoward blood lipid changes, substitution of MUFA for satu-rated fats has been suggested as a more effec-tive strategy than substitution of carbohydrate for saturated fats in order to lower the risk of cardiovascular disease.
Hunter gatherer diets would not only have contained less carbohydrate than that typically found in western diets, but there are impor-tant qualitative differences in the types of carbohydrates. Western diets are characterized by carbohydrate foods with a high glycemic index (e.g. potatoes, bread, processed cereal products) whereas the wild plant foods which would have been consumed by hunter-gather-ers generally maintain a high fiber content, are
Table 3: Dietary and blood lipid characteristics of Greenland Eskimos and Danes.
Variable Eskimos Danes
Dietary intake:
Protein (% energy) 26.0 11.0Fat (% energy) 37.0 42.0Carbohydrate (% energy) 37.0 47.0Saturated fat (% total fat) 22.8 52.7Monounsaturated fat (% total fat) 57.3 34.6Polyunsaturated fat (% total fat) 19.2 12.7n-6 PUFA (g) 5.4 10.0n-3 PUFA (g) 13.7 2.8
Blood lipid values
Total cholesterol (mmol/liter) 5.33 + 0.78 6.24 + 1.00Triglycerides (mmol/liter) 0.61 + 0.44 1.32 + 0.53
Paleolithic nutrition: what did our ancestors eat? | 41
slowly digested and produce low glycemic and insulin responses. Observational studies sug-gest that foods with a high glycemic load and low fiber content increase the risk for type 2 diabetes (Barclay et al, 2008).
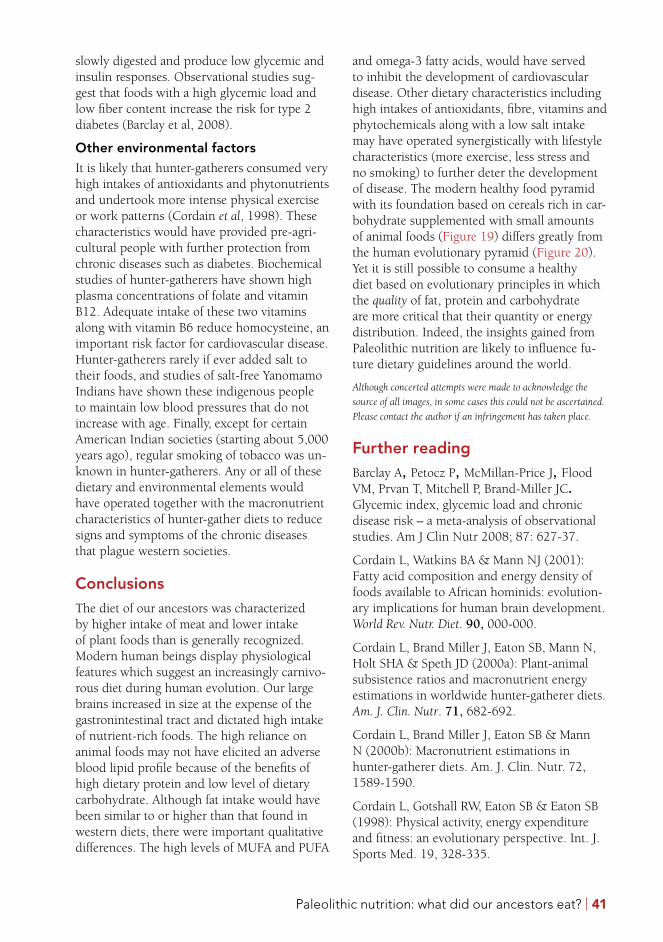
Other environmental factorsIt is likely that hunter-gatherers consumed very high intakes of antioxidants and phytonutrients and undertook more intense physical exercise or work patterns (Cordain et al, 1998). These characteristics would have provided pre-agri-cultural people with further protection from chronic diseases such as diabetes. Biochemical studies of hunter-gatherers have shown high plasma concentrations of folate and vitamin B12. Adequate intake of these two vitamins along with vitamin B6 reduce homocysteine, an important risk factor for cardiovascular disease. Hunter-gatherers rarely if ever added salt to their foods, and studies of salt-free Yanomamo Indians have shown these indigenous people to maintain low blood pressures that do not increase with age. Finally, except for certain American Indian societies (starting about 5,000 years ago), regular smoking of tobacco was un-known in hunter-gatherers. Any or all of these dietary and environmental elements would have operated together with the macronutrient characteristics of hunter-gather diets to reduce signs and symptoms of the chronic diseases that plague western societies.
ConclusionsThe diet of our ancestors was characterized by higher intake of meat and lower intake of plant foods than is generally recognized. Modern human beings display physiological features which suggest an increasingly carnivo-rous diet during human evolution. Our large brains increased in size at the expense of the gastronintestinal tract and dictated high intake of nutrient-rich foods. The high reliance on animal foods may not have elicited an adverse blood lipid profile because of the benefits of high dietary protein and low level of dietary carbohydrate. Although fat intake would have been similar to or higher than that found in western diets, there were important qualitative differences. The high levels of MUFA and PUFA
and omega-3 fatty acids, would have served to inhibit the development of cardiovascular disease. Other dietary characteristics including high intakes of antioxidants, fibre, vitamins and phytochemicals along with a low salt intake may have operated synergistically with lifestyle characteristics (more exercise, less stress and no smoking) to further deter the development of disease. The modern healthy food pyramid with its foundation based on cereals rich in car-bohydrate supplemented with small amounts of animal foods (Figure 19) differs greatly from the human evolutionary pyramid (Figure 20). Yet it is still possible to consume a healthy diet based on evolutionary principles in which the quality of fat, protein and carbohydrate are more critical that their quantity or energy distribution. Indeed, the insights gained from Paleolithic nutrition are likely to influence fu-ture dietary guidelines around the world.
Although concerted attempts were made to acknowledge the
source of all images, in some cases this could not be ascertained .
Please contact the author if an infringement has taken place .
Further readingBarclay A, Petocz P, McMillan-Price J, Flood VM, Prvan T, Mitchell P, Brand-Miller JC. Glycemic index, glycemic load and chronic disease risk – a meta-analysis of observational studies. Am J Clin Nutr 2008; 87: 627-37.
Cordain L, Watkins BA & Mann NJ (2001): Fatty acid composition and energy density of foods available to African hominids: evolution-ary implications for human brain development. World Rev . Nutr . Diet. 90, 000-000.
Cordain L, Brand Miller J, Eaton SB, Mann N, Holt SHA & Speth JD (2000a): Plant-animal subsistence ratios and macronutrient energy estimations in worldwide hunter-gatherer diets. Am . J . Clin . Nutr. 71, 682-692.
Cordain L, Brand Miller J, Eaton SB & Mann N (2000b): Macronutrient estimations in hunter-gatherer diets. Am. J. Clin. Nutr. 72, 1589-1590.
Cordain L, Gotshall RW, Eaton SB & Eaton SB (1998): Physical activity, energy expenditure and fitness: an evolutionary perspective. Int. J. Sports Med. 19, 328-335.
42 | Genes to Galaxies
Dahlberg F (1981): Introduction. In: Woman the Gatherer, ed. F Dahlberg, pp 1-33. New Haven: Yale University Press.
Eaton SB & Konner M (1985): Paleolithic nutrition. A consideration of its nature and cur-rent implications. N. Engl. J. Med. 312, 283-289.
Eaton SB, Konner M & Shostak M (1988a): Stone agers in the fast lane: chronic degenera-tive diseases in evolutionary perspective. Am. J. Med. 84,739-749.
Eaton SB, Shostak M & Konner M (1988b): The Paleolithic Prescription. New York: Harper Row.
Kaplan H & Hill K (1992): Human subsistence behavior. In: Evolution, Ecology and Human Behavior, eds, EA Smith & B Winterhalder, pp 167-202. Chicago: Aldine.
Kaplan H, Hill K, Lancaster J & Hurtado AM (2000): A theory of human life history evolu-tion: diet, intelligence, and longevity. Evol. Anthropol. 9, 156-185.
Lee RB (1968): What hunters do for a living, or how to make out on scarce resources. In: Man the Hunter, eds. RB Lee & I DeVore, pp 30-48. Chicago: Aldine.
Lee RB (1979): The !Kung San: Men, Women, and Work in a Foraging Society. Cambridge: Cambridge University Press.
Mann, N (2000). Dietary lean red meat and hu-man evolution. Eur J Nutr 39: 71-79.
McArthur M (1960): Food consumption and dietary levels of groups of aborigines living on naturally occurring foods. In: Records of the American-Australian Scientific Expedition to Arnhem Land, ed. CP Mountford, pp 90-135. Melbourne: Melbourne University Press.
Meehan B (1982): Shell Bed to Shell Midden. Canberra: Australian Institute of Aboriginal Studies.
Murdock GP (1967): Ethnographic atlas: a summary. Ethnology 6,109-236.
O’Dea K (1984): Marked improvement in carbohydrate and lipid metabolism in diabetic
Australian Aborigines after temporary reversion to traditional lifestyle. Diabetes 33, 596-603.
Richards MP & Hedges RM (2000b): Focus: Gough’s Cave and Sun Hole Cave human stable isotope values indicate a high animal protein diet in the British Upper Palaeolithic. J . Archaeol . Sci . 27, 1-3.
Sinclair HM (1953): The diet of Canadian Indians and Eskimos. Proc. Nutr. Soc. 12, 69-82.
Speth JD (1989): Early hominid hunting and scavenging: the role of meat as an energy source. J. Hum. Evol. 18, 329-343.
Speth JD & Spielmann KA (1983): Energy source, proein metabolism, and hunter-gatherer subsistence strategies. J . Anthropol Archaeol . 2, 1-31.