Embed Size (px)
Citation preview
1
1 State of Palestine 2
Palestinian Central Bureau of Statistics 3 4
5
6
7
8
9
Palestine in Figures 10
2013 11
12
13 14
15 March 2014 16
17
2
18 This document is prepared in accordance with the standard
procedures stated in the Code of Practice for Palestine Official
Statistics 2006.
19 20 21 22 23 24 25 26 27 © March 2014 28
All rights reserved 29 30 Citation: 31 32 Palestinian Central Bureau of Statistics, 2014. Palestine in Figures 33 2013. Ramallah – Palestine. 34 35 All correspondence should be directed to: 36 Palestinian Central Bureau of Statistics 37 P. O Box 1647. Ramallah - Palestine 38 39
Tel: (972/970) 2 2982700
Fax: (972/970) 2 2982710
Toll Free: 1800300300
E-Mail: [email protected]
Reference ID: 2040 Website: http://www.pcbs.gov.ps
40
3
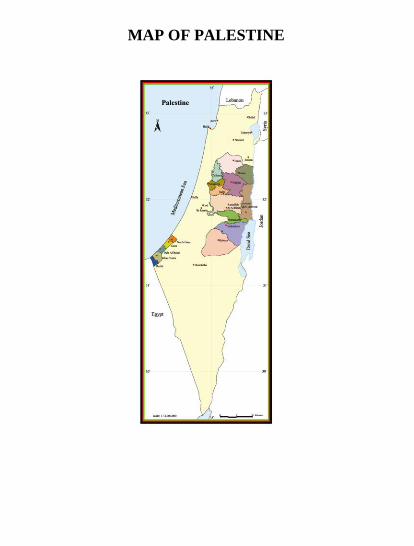
MAP OF PALESTINE 41
42

4
43
5
44 45 46
National Statististical System Mission 47 48
"To produce and disseminate coherent, objective, high quality and 49 timely official statistics to meet user needs nationally and 50 internationally". 51 52 53 54 55 56 57 58
6
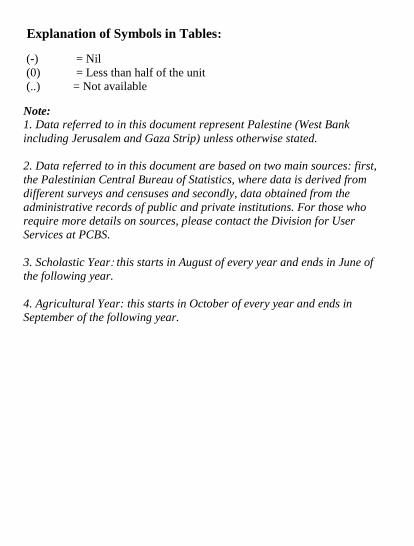
Explanation of Symbols in Tables: 59 60 (-) = Nil 61 (0) = Less than half of the unit 62 (..) = Not available 63 64 Note: 65 1. Data referred to in this document represent Palestine (West Bank 66 including Jerusalem and Gaza Strip) unless otherwise stated. 67 68 2. Data referred to in this document are based on two main sources: first, 69 the Palestinian Central Bureau of Statistics, where data is derived from 70 different surveys and censuses and secondly, data obtained from the 71 administrative records of public and private institutions. For those who 72 require more details on sources, please contact the Division for User 73 Services at PCBS. 74 75 3. Scholastic Year: this starts in August of every year and ends in June of 76 the following year. 77 78 4. Agricultural Year: this starts in October of every year and ends in 79 September of the following year. 80
81 82
7
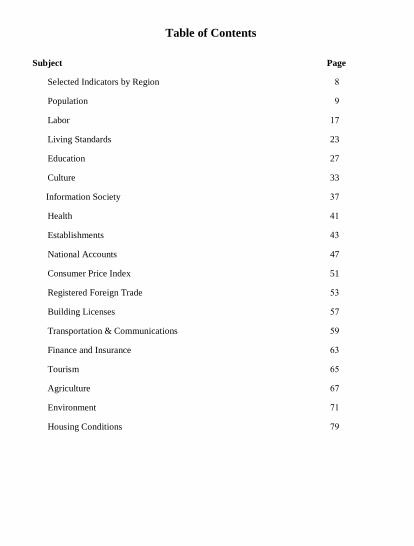
Table of Contents 83 84
Subject Page
Selected Indicators by Region 8
Population 9
Labor 71
Living Standards 23
Education 27
Culture 33
Information Society 71
Health 17
Establishments 17
National Accounts 47
Consumer Price Index 51
Registered Foreign Trade 37
Building Licenses 31
Transportation & Communications 39
Finance and Insurance 37
Tourism 33
Agriculture 31
Environment 17
Housing Conditions 19
85 86 87
8
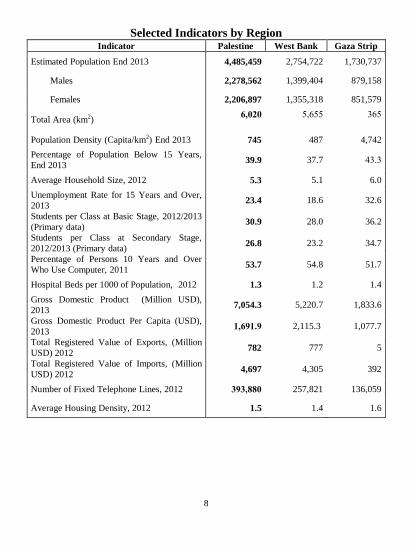
Selected Indicators by Region 88 Indicator Palestine West Bank Gaza Strip
Estimated Population End 2013 4,485,459 2,754,722 1,730,737
Males 2,278,562 1,399,404 879,158
Females 2,206,897 1,355,318 851,579
Total Area (km2) 026,6
35333
733
Population Density (Capita/km2) End 2013 745 487 4,742
Percentage of Population Below 15 Years,
End 2013 39.9 37.7 17.7
Average Household Size, 2012 5.3 5.1 6.0
Unemployment Rate for 15 Years and Over,
2013 23.4 18.6 32.6
Students per Class at Basic Stage, 2012/2013
(Primary data) 30.9 28.0 36.2
Students per Class at Secondary Stage,
2012/2013 (Primary data) 26.8 23.2 34.7
Percentage of Persons 10 Years and Over
Who Use Computer, 2011 53.7 54.8 51.7
Hospital Beds per 1000 of Population, 2012 1.3 1.2 1.4
Gross Domestic Product (Million USD),
2013 7,054.3 5,220.7 1,833.6
Gross Domestic Product Per Capita (USD),
2013 62016,1 2,115.3 1,077.7
Total Registered Value of Exports, (Million
USD) 2012 782 777 5
Total Registered Value of Imports, (Million
USD) 2012 4,697 4,305 392
Number of Fixed Telephone Lines, 2012 8182996 257,821 136,059
Average Housing Density, 2012 1.5 1.4 1.6
89
90

9
Population91
10
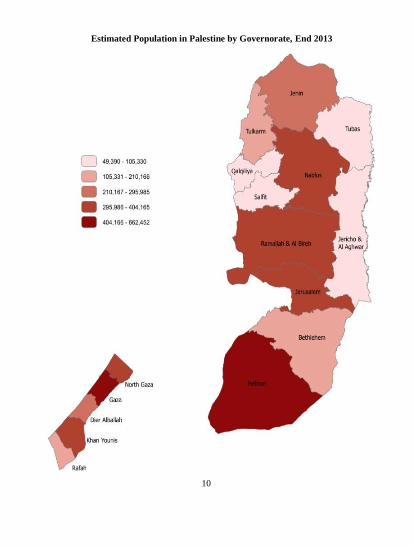
92 Estimated Population in Palestine by Governorate, End 2013
11
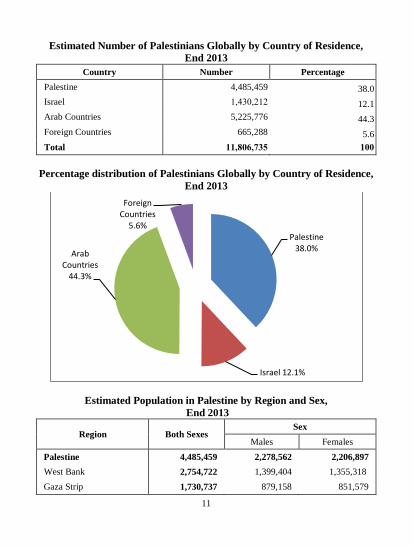
93 Estimated Number of Palestinians Globally by Country of Residence, 94
End 2013 95 Country Number Percentage
Palestine 4,485,459 38.0
Israel 751705171 12.1
Arab Countries 5,225,776 44.3
Foreign Countries 665,288 5.6
Total 6629602,81 666
96 Percentage distribution of Palestinians Globally by Country of Residence, 97
End 2013 98
99 100
Estimated Population in Palestine by Region and Sex, 101 End 2013 102
Region Both Sexes Sex
Males Females Palestine 4,485,459 2,278,562 2,206,897
West Bank 2,754,722 1,399,404 1,355,318
Gaza Strip 1,730,737 879,158 851,579
Palestine 38.0%
Israel 12.1%
Arab Countries
44.3%
Foreign Countries
5.6%
12
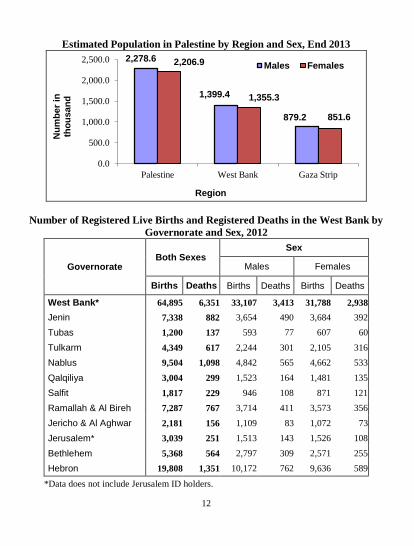
103 Estimated Population in Palestine by Region and Sex, End 2013 104
105 106
Number of Registered Live Births and Registered Deaths in the West Bank by 107 Governorate and Sex, 2012 108
Governorate Both Sexes
Sex
Males Females
Births Deaths Births Deaths Births Deaths
West Bank* 64,895 6,351 33,107 3,413 31,788 2,938
Jenin 7,338 882 3,654 490 3,684 392
Tubas 1,200 137 593 77 607 60
Tulkarm 4,349 617 2,244 301 2,105 316
Nablus 9,504 1,098 4,842 565 4,662 533
Qalqiliya 3,004 299 1,523 164 1,481 135
Salfit 1,817 229 946 108 871 121
Ramallah & Al Bireh 7,287 767 3,714 411 3,573 356
Jericho & Al Aghwar 2,181 156 1,109 83 1,072 73
Jerusalem* 3,039 251 1,513 143 1,526 108
Bethlehem 5,368 564 2,797 309 2,571 255
Hebron 19,808 1,351 10,172 762 9,636 589
*Data does not include Jerusalem ID holders.
2,278.6
1,399.4
879.2
2,206.9
1,355.3
851.6
0.0
500.0
1,000.0
1,500.0
2,000.0
2,500.0
Palestine West Bank Gaza Strip
Region
Nu
mb
er
in
tho
usan
d
Males Females
13
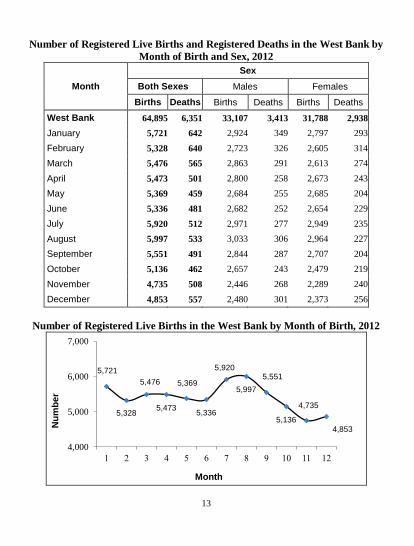
109 Number of Registered Live Births and Registered Deaths in the West Bank by 110
Month of Birth and Sex, 2012 111
Month
Sex
Both Sexes Males Females
Births Deaths Births Deaths Births Deaths
West Bank 64,895 6,351 33,107 3,413 31,788 2,938
January 5,721 642 2,924 349 2,797 293
February 5,328 640 2,723 326 2,605 314
March 5,476 565 2,863 291 2,613 274
April 5,473 501 2,800 258 2,673 243
May 5,369 459 2,684 255 2,685 204
June 5,336 481 2,682 252 2,654 229
July 5,920 512 2,971 277 2,949 235
August 5,997 533 3,033 306 2,964 227
September 5,551 491 2,844 287 2,707 204
October 5,136 462 2,657 243 2,479 219
November 4,735 508 2,446 268 2,289 240
December 4,853 557 2,480 301 2,373 256
112 Number of Registered Live Births in the West Bank by Month of Birth, 2012 113
114 115
5,721
5,328
5,476
5,473
5,369
5,336
5,920
5,997
5,551
5,136
4,735
4,853
4,000
5,000
6,000
7,000
7 1 7 1 3 3 1 8 9 70 77 71
Month
Nu
mb
er
14
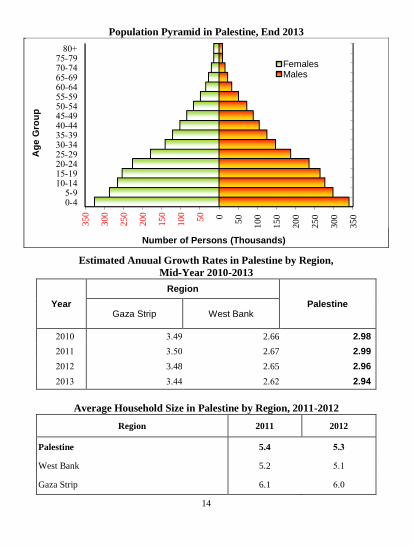
Population Pyramid in Palestine, End 2013 116
117 118
Estimated Anuual Growth Rates in Palestine by Region, 119 Mid-Year 2010-2013 120
Palestine
Region
Year West Bank Gaza Strip
2.98 2.66 7.19 1070
2.99 2.67 7.30 1077
2.96 2.65 3.48 1071
49.2 1.31 7.11 1077
121 Average Household Size in Palestine by Region, 2011-2012 122
Region 2011 2012
Palestine 5.4 1,8
West Bank 5.2 3.7 Gaza Strip 6.1 3.0
350
300
250
200
150
100
50
0
50
100
150
200
250
300
350
+80 19-13 11-10 39-33 31-30 39-33 31-30 19-13 11-10 79-73 71-70 19-13 11-10 79-73 71-70
9-3 1-0
Number of Persons (Thousands)
A
ge
Gro
up
Females
Males
15
123 124
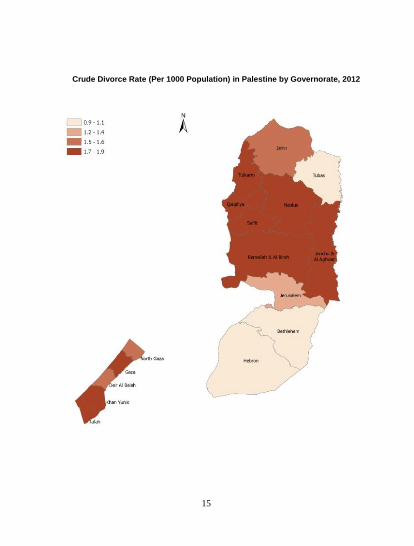
Crude Divorce Rate (Per 1000 Population) in Palestine by Governorate, 2012
16
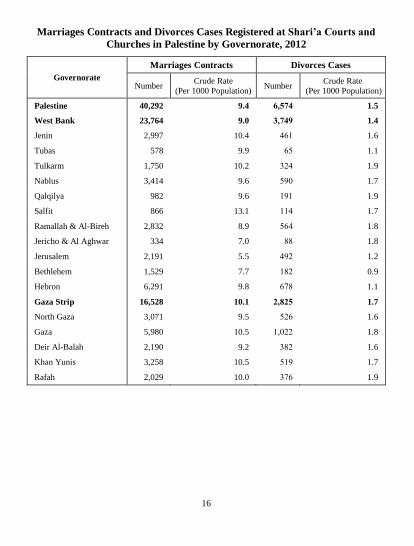
Marriages Contracts and Divorces Cases Registered at Shari’a Courts and 125 Churches in Palestine by Governorate, 2012 126
127
Governorate
Marriages Contracts Divorces Cases
Number Crude Rate
(Per 1000 Population) Number
Crude Rate
(Per 1000 Population)
Palestine 40,292 9.4 021,6 1.5
West Bank 23,764 9.0 82,61 1.4
Jenin 2,997 10.4 137 1.6
Tubas 578 9.9 33 1.1
Tulkarm 1,750 10.2 711 1.9
Nablus 3,414 9.6 390 1.7
Qalqilya 982 9.6 797 1.9
Salfit 866 13.1 771 1.7
Ramallah & Al-Bireh 2,832 8.9 331 1.8
Jericho & Al Aghwar 334 7.0 88 1.8
Jerusalem 2,191 5.5 191 1.2
Bethlehem 1,529 7.7 781 0.9
Hebron 6,291 9.8 318 1.1
Gaza Strip 16,528 10.1 ,29,1 1.7
North Gaza 3,071 9.5 313 1.6
Gaza 5,980 10.5 75011 1.8
Deir Al-Balah 2,190 9.2 781 1.6
Khan Yunis 3,258 10.5 379 1.7
Rafah 2,029 10.0 713 1.9
128 129

17
Labor 130
18
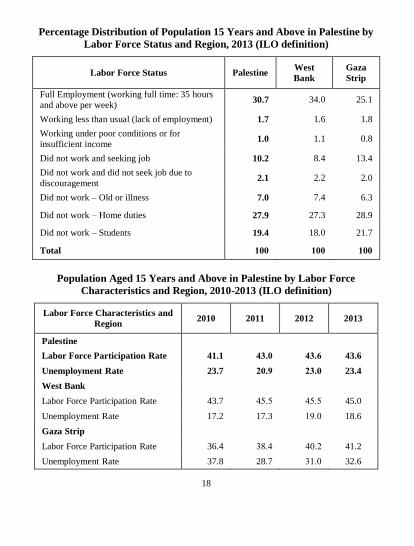
Percentage Distribution of Population 15 Years and Above in Palestine by 131 Labor Force Status and Region, 2013 (ILO definition) 132
133
Labor Force Status Palestine West
Bank
Gaza
Strip
Full Employment (working full time: 35 hours
and above per week) 30.7 34.0 25.1
Working less than usual (lack of employment) 1.7 1.6 1.8
Working under poor conditions or for
insufficient income 1.0 1.1 0.8
Did not work and seeking job 10.2 8.4 13.4
Did not work and did not seek job due to
discouragement 2.1 2.2 2.0
Did not work – Old or illness 7.0 7.4 6.3
Did not work – Home duties 27.9 27.3 28.9
Did not work – Students 19.4 18.0 21.7
Total 666 666 666
134 Population Aged 15 Years and Above in Palestine by Labor Force 135
Characteristics and Region, 2010-2013 (ILO definition) 136 137
Labor Force Characteristics and
Region 2010 2011 2012 2013
Palestine
Labor Force Participation Rate 41.1 68,6 68,0 43.6
Unemployment Rate 23.7 ,6,1 ,8,6 23.4
West Bank Labor Force Participation Rate 43.7 13.3 13.3 45.0
Unemployment Rate 17.2 17.3 79.0 18.6 Gaza Strip
Labor Force Participation Rate 36.4 78.1 10.1 41.2
Unemployment Rate 37.8 28.7 77.0 32.6
19
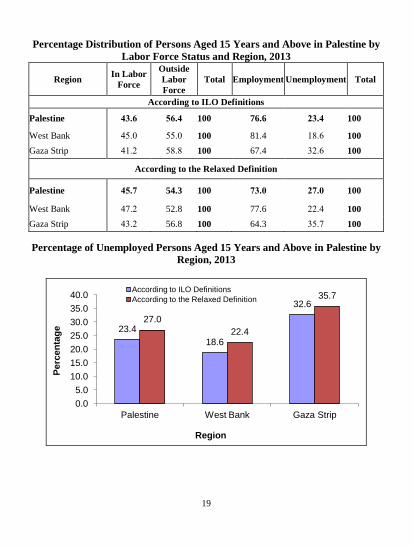
138 Percentage Distribution of Persons Aged 15 Years and Above in Palestine by 139
Labor Force Status and Region, 2013 140
Region In Labor
Force
Outside
Labor
Force
Total Employment Unemployment Total
According to ILO Definitions
Palestine 68,0 10,6 100 76.6 ,8,6 100
West Bank 13.0 33.0 100 81.4 78.3 100
Gaza Strip 17.1 38.8 100 67.4 71.3 100
According to the Relaxed Definition
Palestine 61,, 54.3 100 ,8,6 ,,,6 100
West Bank 11.1 52.8 100 77.6 11.1 100
Gaza Strip 17.1 56.8 100 64.3 73.1 100
141 Percentage of Unemployed Persons Aged 15 Years and Above in Palestine by 142
Region, 2013 143 144
145 146 147
23.4
18.6
32.6
27.0
22.4
35.7
0.0
5.0
10.0
15.0
20.0
25.0
30.0
35.0
40.0
Palestine West Bank Gaza Strip
Region
Perc
en
tag
e
According to ILO Definitions
According to the Relaxed Definition
20
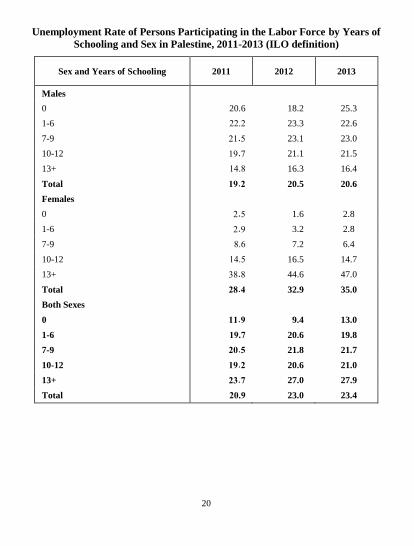
Unemployment Rate of Persons Participating in the Labor Force by Years of 148 Schooling and Sex in Palestine, 2011-2013 (ILO definition) 149
150 Sex and Years of Schooling 2011 2012 2013
Males
0 20.6 18.2 25.3
1-6 11.1 23.3 22.6
7-9 17.3 23.1 23.0
10-12 79.1 21.1 21.5
13+ 71.8 16.3 16.4
Total 61., 20.5 20.6
Females 0 1.3 1.6 2.8
1-6 1.9 3.2 2.8
7-9 8.3 7.2 6.4
10-12 71.3 16.5 14.7
13+ 78.8 44.6 47.0
Total ,9.6 32.9 35.0
Both Sexes 0 66.1 9.4 13.0
1-6 61,, 20.6 19.8
7-9 ,6.1 21.8 21.7
10-12 61., 20.6 21.0
13+ ,8., 27.0 27.9
Total ,6,1 23.0 23.4
151 152 153 154
155
21
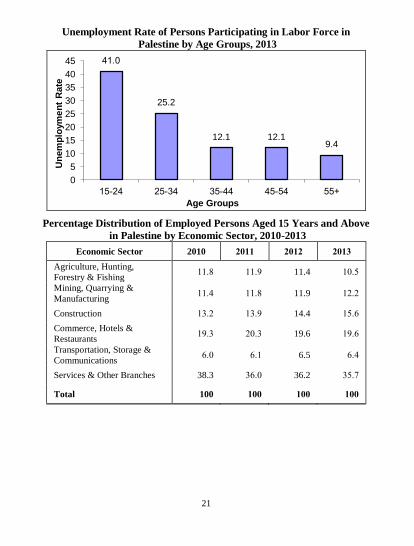
Unemployment Rate of Persons Participating in Labor Force in 156 Palestine by Age Groups, 2013 157
158 159
Percentage Distribution of Employed Persons Aged 15 Years and Above 160 in Palestine by Economic Sector, 2010-2013 161
Economic Sector 2010 ,666 ,66, ,668
Agriculture, Hunting,
Forestry & Fishing 77.8 77.9 11.4 70.3
Mining, Quarrying &
Manufacturing 77.1 77.8 11.9 71.1
Construction 77.1 77.9 14.4 73.3
Commerce, Hotels &
Restaurants 79.7 10.7 19.6 79.3
Transportation, Storage &
Communications 3.0 3.7 6.5 3.1
Services & Other Branches 38.3 73.0 36.2 73.1
Total 100 666 666 666
162 163
41.0
25.2
12.1 12.1 9.4
0
5
10
15
20
25
30
35
40
45
24-15 34-25 44-35 54-45 +55
Un
em
plo
ym
en
t R
ate
Age Groups
22
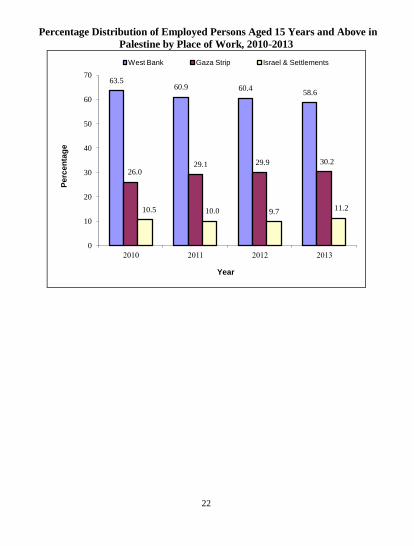
Percentage Distribution of Employed Persons Aged 15 Years and Above in 164 Palestine by Place of Work, 2010-2013 165
166 167
168
63.5 60.9 60.4
58.6
26.0 29.1 29.9 30.2
10.5 10.0 9.7 11.2
0
10
20
30
40
50
60
70
1070 1077 1071 1077
Pe
rce
nta
ge
Year
West Bank Gaza Strip Israel & Settlements
23
Living Standards 169
24
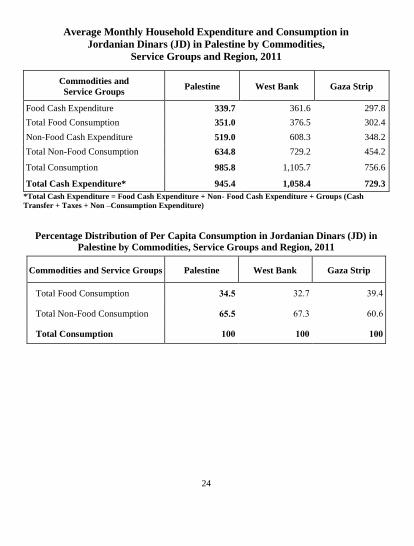
Average Monthly Household Expenditure and Consumption in 170 Jordanian Dinars (JD) in Palestine by Commodities, 171
Service Groups and Region, 2011 172 173
Gaza Strip West Bank Palestine Commodities and
Service Groups
297.8 361.6 339.7 Food Cash Expenditure
302.4 376.5 351.0 Total Food Consumption
348.2 608.3 519.0 Non-Food Cash Expenditure
454.2 729.2 634.8 Total Non-Food Consumption
756.6 1,105.7 985.8 Total Consumption
729.3 1,058.4 945.4 Total Cash Expenditure*
*Total Cash Expenditure = Food Cash Expenditure + Non- Food Cash Expenditure + Groups (Cash 174 Transfer + Taxes + Non –Consumption Expenditure) 175 176
Percentage Distribution of Per Capita Consumption in Jordanian Dinars (JD) in 177 Palestine by Commodities, Service Groups and Region, 2011 178
179 Gaza Strip West Bank Palestine Commodities and Service Groups
79.1 71.1 86,1 Total Food Consumption
30.3 31.7 01,1 Total Non-Food Consumption
666 666 666 Total Consumption
180 181
182
25
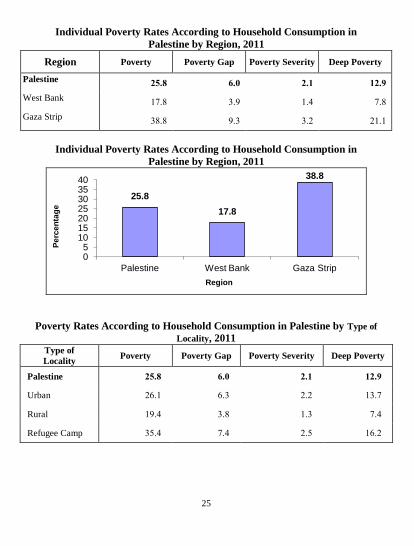
Individual Poverty Rates According to Household Consumption in 183 Palestine by Region, 2011 184
Deep Poverty Poverty Severity Poverty Gap Poverty Region
6,,1 ,,6 0,6 ,1,9 Palestine
1.8 7.1 7.9 71.8 West Bank
17.7 7.1 9.7 78.8 Gaza Strip
185 Individual Poverty Rates According to Household Consumption in 186
Palestine by Region, 2011 187
188 189
190 Poverty Rates According to Household Consumption in Palestine by Type of 191
Locality, 2011 192 Deep Poverty Poverty Severity Poverty Gap Poverty
Type of
Locality
6,,1 ,,6 0,6 ,1,9 Palestine
77.1 1.1 3.7 13.7 Urban
1.1 7.7 7.8 79.1 Rural
73.1 1.3 1.1 73.1 Refugee Camp
193 194 195 196
25.8
17.8
38.8
0 5
10 15 20 25 30 35 40
Palestine West Bank Gaza Strip
Region
Pe
rce
nta
ge
26
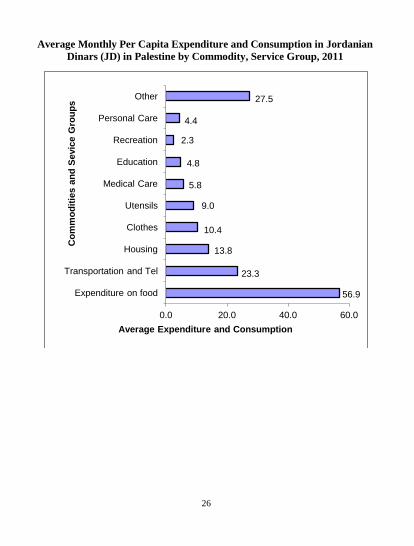
197 Average Monthly Per Capita Expenditure and Consumption in Jordanian 198
Dinars (JD) in Palestine by Commodity, Service Group, 2011 199 200
201
56.9
23.3
13.8
10.4
9.0
5.8
4.8
2.3
4.4
27.5
0.0 20.0 40.0 60.0
Expenditure on food
Transportation and Tel
Housing
Clothes
Utensils
Medical Care
Education
Recreation
Personal Care
Other
Average Expenditure and Consumption
Co
mm
od
itie
s a
nd
Sevic
e G
rou
ps

27
Education 202
28
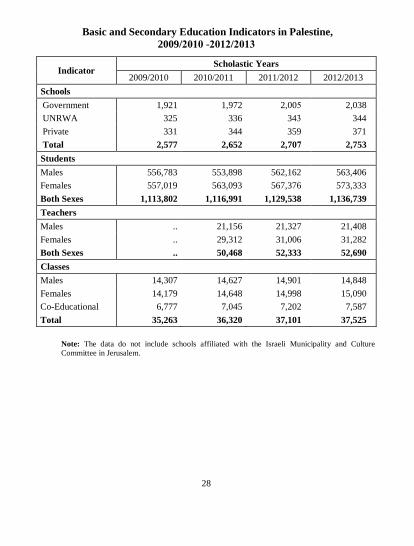
Basic and Secondary Education Indicators in Palestine, 203 2009/,666 -,66,/,668 204
205 Indicator
Scholastic Years
2009/2010 2010/2011 2011/2012 2012/2013
Schools
Government 1,921 1,972 2,003 2,038
UNRWA 325 336 347 344
Private 331 344 359 371
Total 2,577 2,652 2,70, 2,753
Students
Males 556,783 553,898 562,162 563,406
Females 557,019 563,093 567,376 573,333
Both Sexes 1,113,802 1,116,991 1,129,538 1,136,739
Teachers
Males .. 21,156 21,327 21,408
Females .. 29,312 31,006 31,282
Both Sexes .. 50,468 52,333 52,690
Classes
Males 14,307 14,627 14,901 14,848
Females 14,179 14,648 14,998 15,090
Co-Educational 6,777 7,045 7,202 7,587
Total 35,263 36,320 37,101 37,525
206 Note: The data do not include schools affiliated with the Israeli Municipality and Culture 207 Committee in Jerusalem. 208 209
210
29
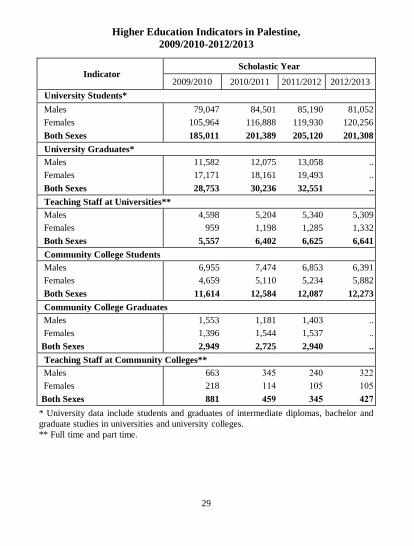
Higher Education Indicators in Palestine, 211 2009/2010-2012/2013 212
213
Indicator Scholastic Year
2009/2010 2010/2011 2011/2012 2012/2013
University Students*
Males 79,047 84,501 85,190 81,052
Females 105,964 116,888 119,930 120,256
Both Sexes 185,011 201,389 205,120 201,308
University Graduates*
Males 11,582 12,075 13,058 ..
Females 17,171 18,161 19,493 ..
Both Sexes 28,753 30,236 32,551 ..
Teaching Staff at Universities**
Males 4,598 5,204 5,340 5,309
Females 959 1,198 1,285 1,332
Both Sexes 5,557 6,402 6,625 6,641
Community College Students
Males 6,955 7,474 6,853 6,391
Females 4,659 5,110 5,234 5,882
Both Sexes 11,614 12,584 12,087 12,273
Community College Graduates
Males 1,553 1,181 1,403 ..
Females 1,396 1,544 1,537 ..
Both Sexes 2,949 2,725 2,940 ..
Teaching Staff at Community Colleges**
Males 663 713 110 711
Females 218 771 703 703
Both Sexes 881 611 861 6,,
* University data include students and graduates of intermediate diplomas, bachelor and
graduate studies in universities and university colleges.
** Full time and part time.
214 215
30
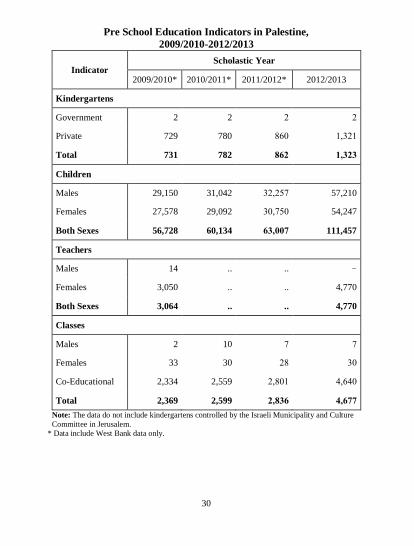
Pre School Education Indicators in Palestine, 216 2009/2010-2012/2013 217
Indicator Scholastic Year
2009/2010* 2010/2011* 2011/2012* 2012/2013
Kindergartens
Government 2 2 1 1 Private 729 780 830 75717 Total 731 782 90, 628,8
Children
Males 29,150 31,042 715131 57,210
Females 27,578 29,092 705130 54,247
Both Sexes 56,728 60,134 08266, 111,457
Teachers
Males 14 .. .. - Females 3,050 .. .. 4,770
Both Sexes 3,064 .. .. 4,770
Classes
Males 2 10 1 1 Females 33 30 18 70 Co-Educational 2,334 2,559 15807 15310 Total 2,369 2,599 ,2980 620,,
Note: The data do not include kindergartens controlled by the Israeli Municipality and Culture 218 Committee in Jerusalem. 219
* Data include West Bank data only. 220 221
222 223
31
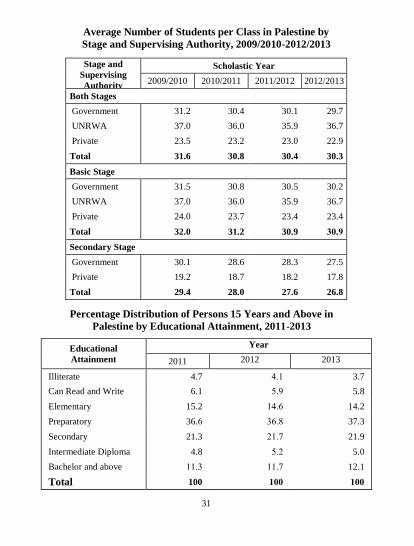
Average Number of Students per Class in Palestine by 224 Stage and Supervising Authority, 2009/2010-2012/2013 225
226 Stage and
Supervising
Authority
Scholastic Year 2009/2010 2010/2011 2011/2012 2012/2013
Both Stages Government 31.2 30.4 30.1 29.7
UNRWA 37.0 36.0 35.9 36.7
Private 23.5 23.2 23.0 22.9
Total 31.6 30.8 30.4 30.3
Basic Stage Government 31.5 30.8 30.5 30.2
UNRWA 37.0 36.0 35.9 36.7
Private 24.0 23.7 23.4 23.4
Total 32.0 31.2 30.9 86,1 Secondary Stage Government 30.1 28.6 28.3 27.5
Private 19.2 18.7 18.2 17.8
Total 29.4 28.0 27.6 26.8
227 Percentage Distribution of Persons 15 Years and Above in 228
Palestine by Educational Attainment, 2011-2013 229 230
Educational
Attainment Year
2011 2012 2013
Illiterate 4.7 1.7 3.7
Can Read and Write 6.1 3.9 5.8
Elementary 15.2 71.3 14.2
Preparatory 36.3 73.8 37.3
Secondary 21.3 17.1 21.9
Intermediate Diploma 4.8 3.1 5.0
Bachelor and above 77.7 77.1 12.1
Total 100 666 666
32
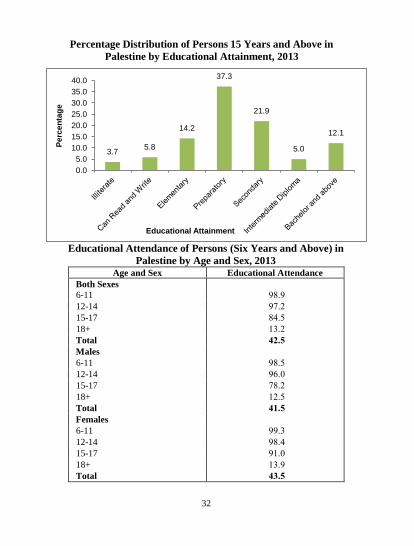
231 Percentage Distribution of Persons 15 Years and Above in 232
Palestine by Educational Attainment, 2013 233 234
235 Educational Attendance of Persons (Six Years and Above) in 236
Palestine by Age and Sex, 2013 237 Age and Sex Educational Attendance
Both Sexes
6-11 98.9
12-14 91.1
15-17 81.3
18+ 77.1
Total 6,,1
Males
6-11 98.3
12-14 93.0
15-17 18.1
18+ 71.3
Total 66,1
Females
6-11 99.7
12-14 98.1
15-17 97.0
18+ 77.9
Total 68,1
3.7 5.8
14.2
37.3
21.9
5.0
12.1
0.0
5.0
10.0
15.0
20.0
25.0
30.0
35.0
40.0
Pe
rce
nta
ge
Educational Attainment

33
Culture238
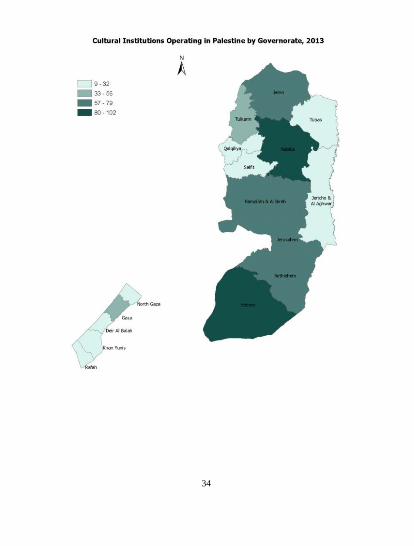
34
239 240 241
242
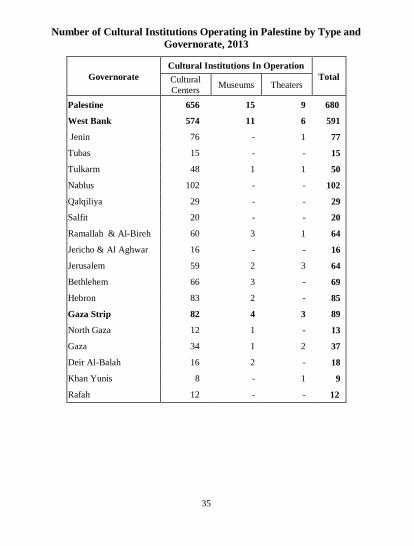
35
Number of Cultural Institutions Operating in Palestine by Type and 243 Governorate, ,663 244
245
Total
Cultural Institutions In Operation
Governorate Theaters Museums
Cultural
Centers
680 9 15 656 Palestine
591 6 11 574 West Bank
77 1 - 76 Jenin
15 - - 15 Tubas
50 1 1 48 Tulkarm
102 - - 102 Nablus
29 - - 29 Qalqiliya
20 - - 20 Salfit
64 1 3 60 Ramallah & Al-Bireh
16 - - 16 Jericho & Al Aghwar
64 3 2 59 Jerusalem
69 - 3 66 Bethlehem
85 - 2 83 Hebron
89 3 4 82 Gaza Strip
13 - 1 12 North Gaza
37 2 1 34 Gaza
18 - 2 16 Deir Al-Balah
9 1 - 8 Khan Yunis
12 - - 12 Rafah
246 247 248
249
36
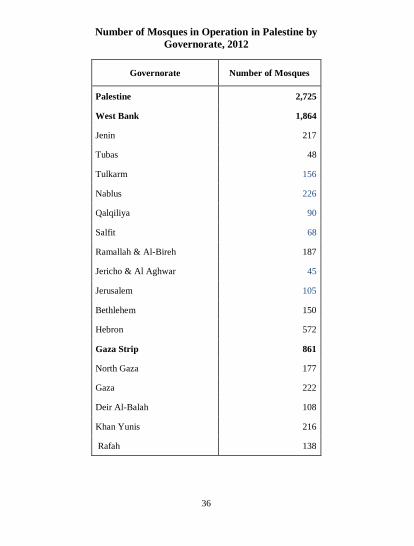
Number of Mosques in Operation in Palestine by 250 Governorate, 2012 251
252 Governorate Number of Mosques
Palestine 2,725
West Bank 1,864
Jenin 217
Tubas 48
Tulkarm 156
Nablus 226
Qalqiliya 90
Salfit 68
Ramallah & Al-Bireh 187
Jericho & Al Aghwar 45
Jerusalem 105
Bethlehem 150
Hebron 572
Gaza Strip 861
North Gaza 177
Gaza 222
Deir Al-Balah 108
Khan Yunis 216
Rafah 138

37
Information Society 253
38
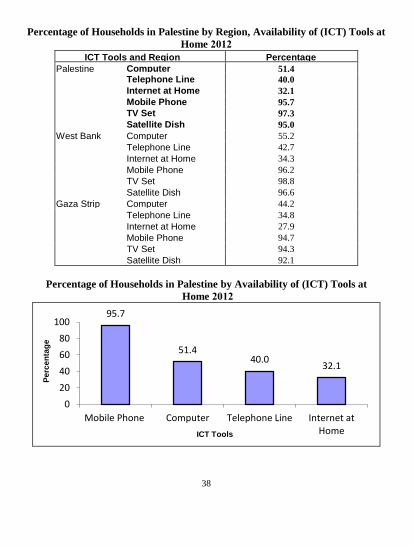
Percentage of Households in Palestine by Region, Availability of (ICT) Tools at 254 Home ,66, 255
ICT Tools and Region Percentage Palestine Computer 51.4
Telephone Line 40.0
Internet at Home 32.1
Mobile Phone 95.7
TV Set 97.3
Satellite Dish 95.0
West Bank Computer 55.2
Telephone Line 42.7
Internet at Home 34.3
Mobile Phone 96.2
TV Set 98.8
Satellite Dish 96.6
Gaza Strip Computer 44.2
Telephone Line 34.8
Internet at Home 27.9
Mobile Phone 94.7
TV Set 94.3
Satellite Dish 92.1
256 Percentage of Households in Palestine by Availability of (ICT) Tools at 257
Home ,66, 258
259 260
261
95.7
51.4 40.0
32.1
0
20
40
60
80
100
Mobile Phone Computer Telephone Line Internet at Home
Pe
rce
nta
ge
ICT Tools
39
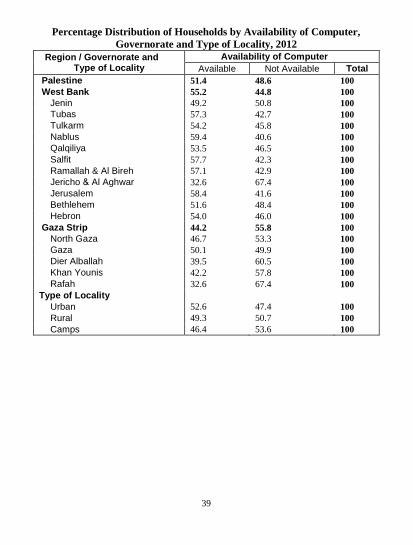
Percentage Distribution of Households by Availability of Computer, 262 Governorate and Type of Locality, 2012 263
Region / Governorate and Type of Locality
Availability of Computer
Available Not Available Total
Palestine 51.4 48.6 100
West Bank 55.2 44.8 100
Jenin 49.2 50.8 100
Tubas 57.3 42.7 100
Tulkarm 54.2 45.8 100
Nablus 59.4 40.6 100
Qalqiliya 53.5 46.5 100
Salfit 57.7 42.3 100
Ramallah & Al Bireh 57.1 42.9 100
Jericho & Al Aghwar 32.6 67.4 100
Jerusalem 58.4 41.6 100
Bethlehem 51.6 48.4 100
Hebron 54.0 46.0 100
Gaza Strip 44.2 55.8 100
North Gaza 46.7 53.3 100
Gaza 50.1 49.9 100
Dier Alballah 39.5 60.5 100
Khan Younis 42.2 57.8 100
Rafah 32.6 67.4 100
Type of Locality
Urban 52.6 47.4 100
Rural 49.3 50.7 100
Camps 46.4 53.6 100
264 265
40
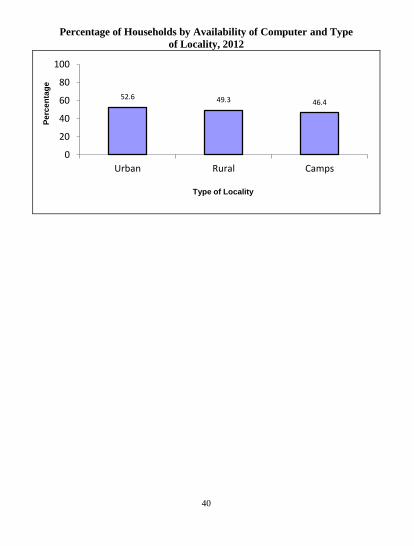
Percentage of Households by Availability of Computer and Type 266 of Locality, 2012 267
268 269
52.6 49.3 46.4
0
20
40
60
80
100
Urban Rural Camps
Pe
rce
nta
ge
Type of Locality

41
Health 270
42
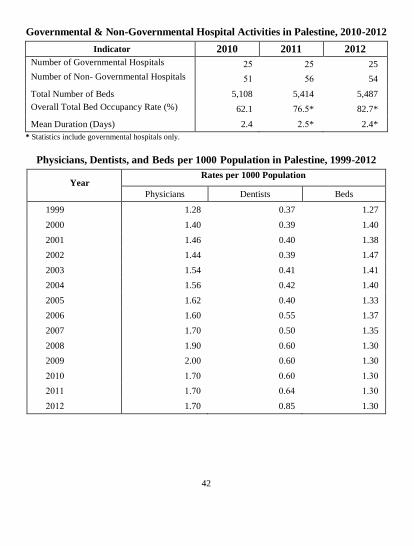
Governmental & Non-Governmental Hospital Activities in Palestine, 2010-2012 271 272
Indicator 2010 2011 2012 Number of Governmental Hospitals 13 13 25 Number of Non- Governmental Hospitals 37 33 54 Total Number of Beds 5,108 5,414 5,487
Overall Total Bed Occupancy Rate (%) 62.1 13.3* 82.7* Mean Duration (Days) 2.4 1.3* 2.4*
* Statistics include governmental hospitals only. 273 274
Physicians, Dentists, and Beds per 1000 Population in Palestine, 1999-2012 275 276
Year Rates per 1000 Population
Physicians Dentists Beds
1999 1.28 0.37 1.27
2000 1.40 0.39 1.40
2001 1.46 0.40 1.38
2002 1.44 0.39 1.47
2003 1.54 0.41 1.41
2004 1.56 0.42 1.40
2005 1.62 0.40 1.33
2006 1.60 0.55 1.37
2007 1.70 0.50 1.35
2008 1.90 0.60 1.30
2009 2.00 0.60 1.30
1070 7.10 0.30 7.70 1077 7.10 0.31 7.70 1071 1.70 0.85 1.30
277 278
279

43
Establishments 280
44
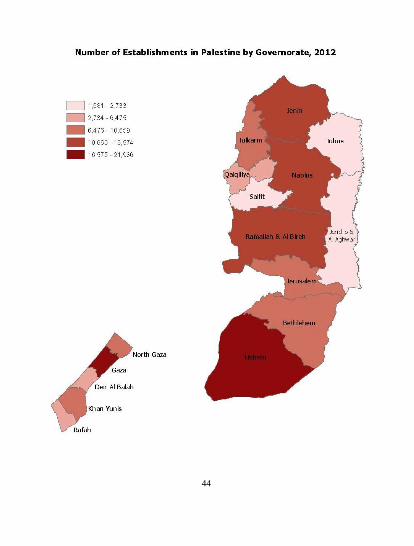
281 282
45
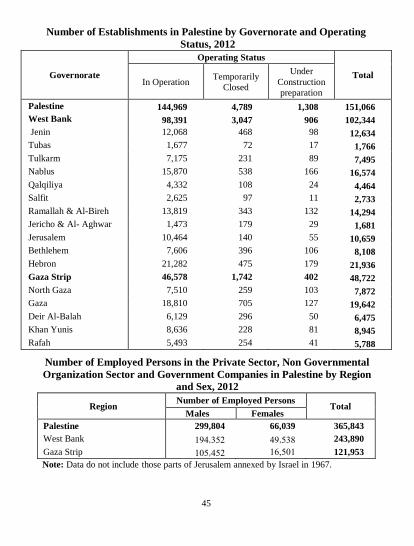
Number of Establishments in Palestine by Governorate and Operating 283 Status, 2012 284
Governorate
Operating Status
Total In Operation
Temporarily
Closed
Under
Construction
preparation
Palestine 144,969 4,789 1,308 151,066
West Bank 98,391 3,047 906 102,344
Jenin 12,068 468 98 12,634
Tubas 1,677 72 17 1,766
Tulkarm 7,175 231 89 7,495
Nablus 15,870 538 166 16,574
Qalqiliya 4,332 108 24 4,464
Salfit 2,625 97 11 2,733
Ramallah & Al-Bireh 13,819 343 132 14,294
Jericho & Al- Aghwar 1,473 179 29 1,681
Jerusalem 10,464 140 55 10,659
Bethlehem 7,606 396 106 8,108
Hebron 21,282 475 179 21,936
Gaza Strip 46,578 1,742 402 48,722
North Gaza 7,510 259 103 7,872
Gaza 18,810 705 127 19,642
Deir Al-Balah 6,129 296 50 6,475
Khan Yunis 8,636 228 81 8,945
Rafah 5,493 254 41 5,788 285
Number of Employed Persons in the Private Sector, Non Governmental 286 Organization Sector and Government Companies in Palestine by Region 287
and Sex, 2012 288 Region
Number of Employed Persons Total
Males Females Palestine 299,804 66,039 365,843
West Bank 791,731 19,378 243,890
Gaza Strip 703,131 735307 121,953
Note: Data do not include those parts of Jerusalem annexed by Israel in 1967. 289

46
290 291

47
National Accounts 292
48
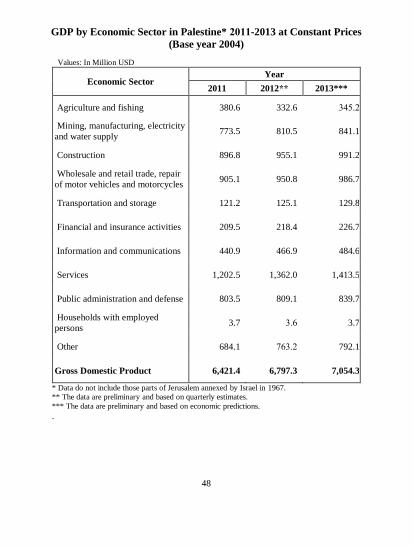
GDP by Economic Sector in Palestine* ,666-2013 at Constant Prices 293 (Base year 2004) 294
295 Values: In Million USD 296
Economic Sector Year
2011 2012** 2013***
Agriculture and fishing 380.6 332.6 713.1
Mining, manufacturing, electricity
and water supply 773.5 810.5 841.1
Construction 896.8 955.1 991.2
Wholesale and retail trade, repair
of motor vehicles and motorcycles 905.1 950.8 986.7
Transportation and storage 121.2 125.1 129.8
Financial and insurance activities 209.5 218.4 226.7
Information and communications 440.9 466.9 484.6
Services 1,202.5 1,362.0 1,413.5
Public administration and defense 803.5 809.1 839.7
Households with employed
persons 3.7 7.3 3.7
Other 684.1 137.1 792.1
Gross Domestic Product 6,421.4 6,797.3 7,054.3 * Data do not include those parts of Jerusalem annexed by Israel in 1967. 297 ** The data are preliminary and based on quarterly estimates. 298 *** The data are preliminary and based on economic predictions. 299 . 300
301
49
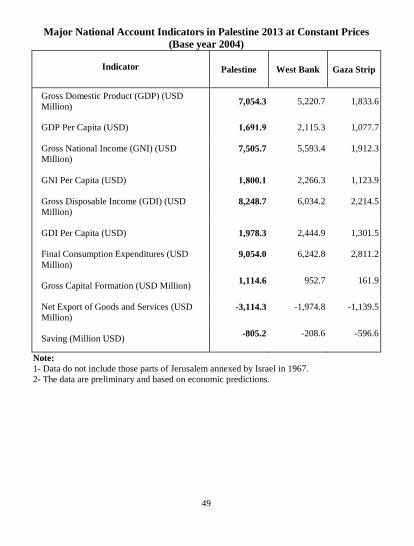
Major National Account Indicators in Palestine 2013 at Constant Prices 302 (Base year 2004) 303
Indicator Palestine West Bank Gaza Strip
Gross Domestic Product (GDP) (USD
Million) 7,054.3 5,220.7 1,833.6
GDP Per Capita (USD) 62016,1 2,115.3 1,077.7
Gross National Income (GNI) (USD
Million)
7,505.7
5,593.4
1,912.3
GNI Per Capita (USD) 62966,6 2,266.3 1,123.9
Gross Disposable Income (GDI) (USD
Million)
8,248.7
6,034.2
2,214.5
GDI Per Capita (USD) 1,978.3 2,444.9 1,301.5
Final Consumption Expenditures (USD
Million)
9,054.0
6,242.8
2,811.2
Gross Capital Formation (USD Million) 1,114.6
952.7
161.9
Net Export of Goods and Services (USD
Million)
-3,114.3
-1,974.8
-1,139.5
Saving (Million USD) -805.2
-208.6
-596.6
Note: 304 1- Data do not include those parts of Jerusalem annexed by Israel in 1967. 305 2- The data are preliminary and based on economic predictions. 306 307 308 309
310
50
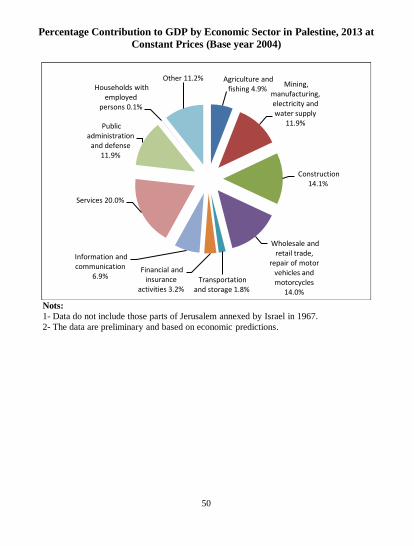
Percentage Contribution to GDP by Economic Sector in Palestine, 2013 at 311 Constant Prices (Base year 2004) 312
313
314 Nots: 315 1- Data do not include those parts of Jerusalem annexed by Israel in 1967. 316 2- The data are preliminary and based on economic predictions. 317 318
319 320
Agriculture and fishing 4.9%
Mining, manufacturing, electricity and water supply
11.9%
Construction 14.1%
Wholesale and retail trade,
repair of motor vehicles and motorcycles
14.0%
Transportation and storage 1.8%
Financial and insurance
activities 3.2%
Information and communication
6.9%
Services 20.0%
Public administration
and defense 11.9%
Households with employed
persons 0.1%
Other 11.2%
51
Consumer Price Index 321
52
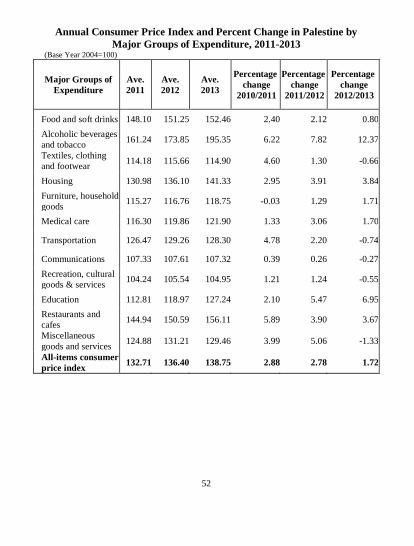
Annual Consumer Price Index and Percent Change in Palestine by 322 Major Groups of Expenditure, 2011-2013 323
(Base Year 2004=100) 324
Major Groups of
Expenditure
Ave.
2011
Ave.
2012
Ave.
2013
Percentage
change
2010/2011
Percentage
change
2011/2012
Percentage
change
2012/2013
Food and soft drinks 148.10 151.25 152.46 2.40 2.12 0.80
Alcoholic beverages
and tobacco 161.24 173.85 195.35 6.22 7.82 12.37
Textiles, clothing
and footwear 114.18 115.66 114.90 4.60 1.30 -0.66
Housing 130.98 136.10 141.33 2.95 3.91 3.84
Furniture, household
goods 115.27 116.76 118.75 -0.03 1.29 1.71
Medical care 116.30 119.86 121.90 1.33 3.06 1.70
Transportation 126.47 129.26 128.30 4.78 2.20 -0.74
Communications 107.33 107.61 107.32 0.39 0.26 -0.27
Recreation, cultural
goods & services 104.24 105.54 104.95 1.21 1.24 -0.55
Education 112.81 118.97 127.24 2.10 5.47 6.95
Restaurants and
cafes 144.94 150.59 156.11 5.89 3.90 3.67
Miscellaneous
goods and services 124.88 131.21 129.46 3.99 5.06 -1.33
All-items consumer
price index 132.71 136.40 138.75 2.88 2.78 1.72
325

53
Registered Foreign Trade 326
54
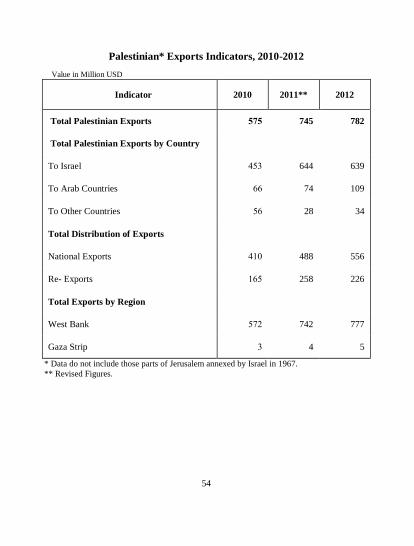
Palestinian* Exports Indicators, 2010-2012 327 328 Value in Million USD 329
Indicator 2010 2011** 2012
Total Palestinian Exports 1,1 745 782
Total Palestinian Exports by Country
To Israel 137 644 639
To Arab Countries 33 74 109
To Other Countries 33 28 34
Total Distribution of Exports
National Exports 170 488 556
Re- Exports 733 258 226
Total Exports by Region
West Bank 311 742 777
Gaza Strip 7 4 5 * Data do not include those parts of Jerusalem annexed by Israel in 1967.
** Revised Figures. 330 331 332 333
334 335
336
55
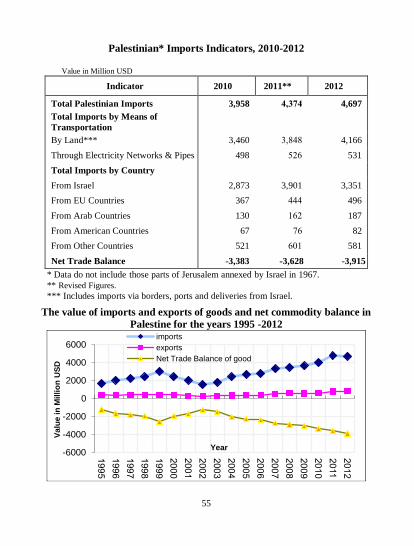
Palestinian* Imports Indicators, 2010-2012 337 338
Value in Million USD 339 Indicator 2010 2011** 2012
Total Palestinian Imports 3,958 628,6 4,697
Total Imports by Means of
Transportation
By Land*** 3,460 75818 4,166
Through Electricity Networks & Pipes 498 313 531
Total Imports by Country
From Israel 2,873 3,901 3,351
From EU Countries 367 111 496
From Arab Countries 130 731 187
From American Countries 67 13 82
From Other Countries 521 307 581
Net Trade Balance -3,383 3,628 - -3,915
* Data do not include those parts of Jerusalem annexed by Israel in 1967.
** Revised Figures.
*** Includes imports via borders, ports and deliveries from Israel. 340
The value of imports and exports of goods and net commodity balance in 341 Palestine for the years 1995 -2012342
343 344
-6000
-4000
-2000
0
2000
4000
6000
199
5 1
99
6 1
99
7 1
99
8 1
99
9 2
00
0 2
00
1 2
00
2 2
00
3 2
00
4 2
00
5 2
00
6 2
00
7 2
00
8 2
00
9 2
01
0 2
011
201
2
Va
lue
in
Mil
lio
n U
SD
Year
imports
exports
Net Trade Balance of good
56
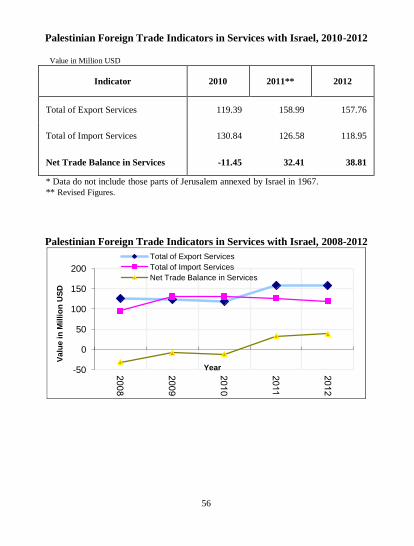
Palestinian Foreign Trade Indicators in Services with Israel, 2010-2012 345 346
Value in Million USD 347
Indicator 2010 2011** 2012
Total of Export Services 119.39 158.99 157.76
Total of Import Services 130.84 126.58 118.95
Net Trade Balance in Services -11.45 32.41 38.81
* Data do not include those parts of Jerusalem annexed by Israel in 1967.
** Revised Figures.
348 349 350
Palestinian Foreign Trade Indicators in Services with Israel, 2008-2012 351
352 353 354 355 356 357 358
359
-50
0
50
100
150
200
200
8 2
00
9 2
01
0 2
011
201
2
Va
lue
in
Mil
lio
n U
SD
Year
Total of Export Services
Total of Import Services
Net Trade Balance in Services
57
Building Licenses 360
58
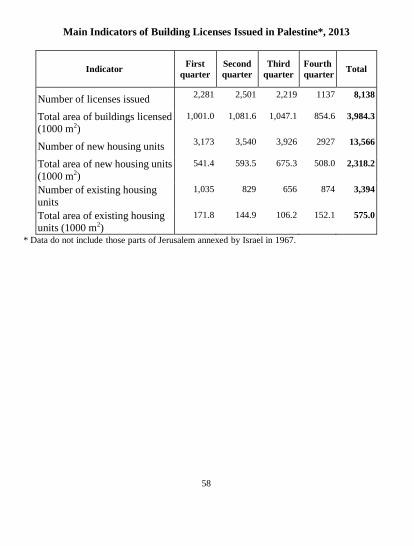
Main Indicators of Building Licenses Issued in Palestine*, 2013 361 362
Indicator First
quarter Second
quarter Third
quarter Fourth
quarter Total
Number of licenses issued 2,281 2,501 2,219 1137 8,138
Total area of buildings licensed (1000 m2)
1,001.0 1,081.6 1,047.1 854.6 3,984.3
Number of new housing units 3,173 3,540 3,926 2927 13,566
Total area of new housing units
(1000 m2)
541.4 593.5 675.3 508.0 2,318.2
Number of existing housing
units
1,035 829 656 874 3,394
Total area of existing housing units (1000 m2)
171.8 144.9 106.2 152.1 575.0
* Data do not include those parts of Jerusalem annexed by Israel in 1967. 363 364
365
59
Transportation 366
& 367
Communications 368
60
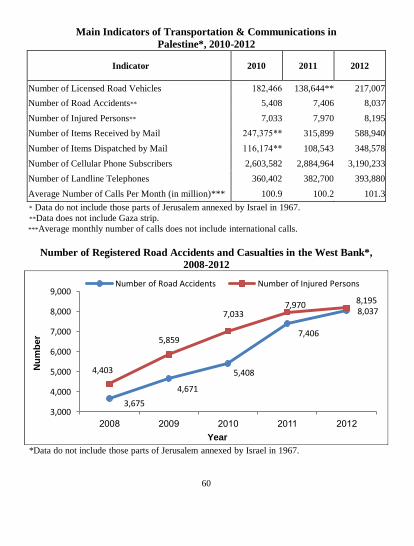
Main Indicators of Transportation & Communications in 369 Palestine*, 2010-2012 370
Indicator 2010 2011 2012
Number of Licensed Road Vehicles 7815133 138,644** 217,007
Number of Road Accidents** 5,408 7,406 8,037
Number of Injured Persons** 7,033 7,970 8,195
Number of Items Received by Mail **1115713 315,899 588,940
Number of Items Dispatched by Mail **7735711 108,543 348,578
Number of Cellular Phone Subscribers 2,603,582 2,884,964 3,190,233
Number of Landline Telephones 360,402 382,700 393,880
Average Number of Calls Per Month (in million)*** 100.9 100.2 101.3
* Data do not include those parts of Jerusalem annexed by Israel in 1967. 371 **Data does not include Gaza strip. 372 ***Average monthly number of calls does not include international calls. 373
374 Number of Registered Road Accidents and Casualties in the West Bank*, 375
2008-2012 376
377 *Data do not include those parts of Jerusalem annexed by Israel in 1967. 378
379
3,675
4,671
5,408
7,406
8,037
4,403
5,859
7,033 7,970 8,195
3,000
4,000
5,000
6,000
7,000
8,000
9,000
2008 2009 2010 2011 2012
Nu
mb
er
Year
Number of Road Accidents Number of Injured Persons
61
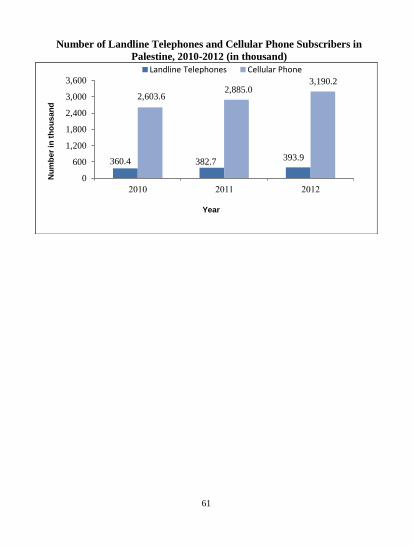
380 Number of Landline Telephones and Cellular Phone Subscribers in 381
Palestine, 2010-2012 (in thousand) 382
383 384 385 386 387 388 389
390
360.4 382.7 393.9
2,603.6 2,885.0
3,190.2
0
600
1,200
1,800
2,400
3,000
3,600
1070 1077 1071
Nu
mb
er
in t
ho
us
an
d
Year
Landline Telephones Cellular Phone

62
391

63
Finance & Insurance 392
64
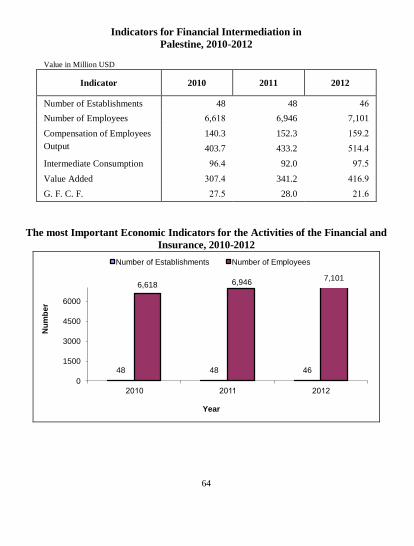
Indicators for Financial Intermediation in 393 Palestine, 2010-2012 394
395
Value in Million USD
2012 2011 2010 Indicator
13 48 48 Number of Establishments
7,101 3,946 3,378 Number of Employees
739.1 152.3 140.3 Compensation of Employees
371.1 433.2 403.7 Output
91.3 92.0 93.1 Intermediate Consumption
173.9 341.2 701.1 Value Added
17.3 28.0 11.3 G. F. C. F.
396 397
The most Important Economic Indicators for the Activities of the Financial and 398 Insurance, 2010-2012 399
400 401 402 403 404
48 48 46
6,618 6,946 7,101
0
1500
3000
4500
6000
2010 2011 2012
Nu
mb
er
Year
Number of Establishments Number of Employees

65
Tourism 405
66
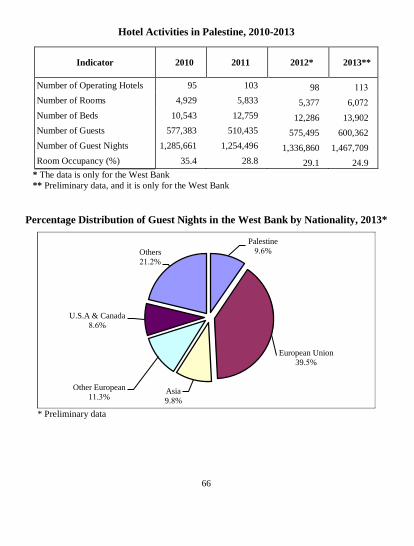
Hotel Activities in Palestine, 2010-2013 406 407
Indicator 2010 2011 2012* 2013**
Number of Operating Hotels 95 103 98 777
Number of Rooms 4,929 5,833 5,377 6,011
Number of Beds 10,543 12,759 12,286 13,902
Number of Guests 577,383 510,435 575,495 600,362
Number of Guest Nights 1,285,661 1,254,496 1,336,860 1,467,709
Room Occupancy (%) 35.4 28.8 29.1 21.9
* The data is only for the West Bank 408 ** Preliminary data, and it is only for the West Bank 409
410 411 412
Percentage Distribution of Guest Nights in the West Bank by Nationality, 2013* 413 414
415 * Preliminary data 416
Palestine
9.3%
European Union
39.3%
Asia
9.8%
Other European
17.7%
U.S.A & Canada
8.3%
Others
17.1%

67
Agriculture 417
68
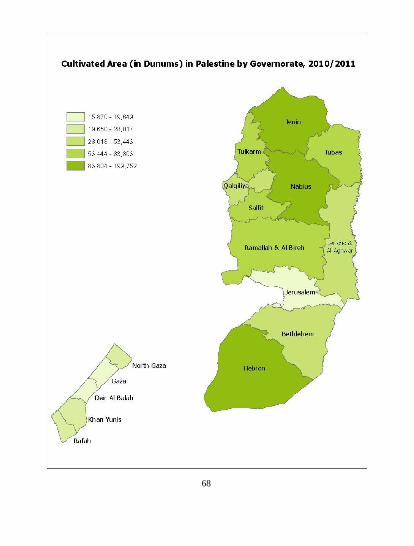
418
69
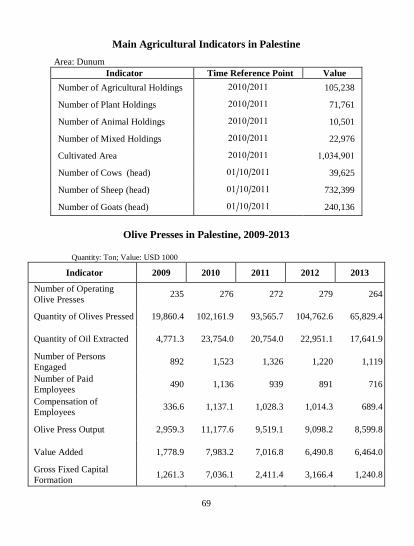
419 Main Agricultural Indicators in Palestine 420
421 Area: Dunum 422
Value Time Reference Point Indicator
105,238 1077/1070 Number of Agricultural Holdings
71,761 1077/1070 Number of Plant Holdings
10,501 1077/1070 Number of Animal Holdings
22,976 1077/1070 Number of Mixed Holdings
750715907 1077/1070 Cultivated Area
39,625 1077/70/07 Number of Cows (head)
732,399 1077/70/07 Number of Sheep (head)
240,136 1077/70/07 Number of Goats (head)
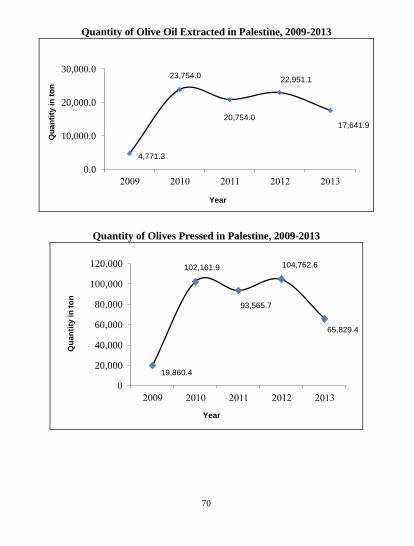
423 Olive Presses in Palestine, 2009-2013 424
425 Quantity: Ton; Value: USD 1000 426
Indicator 2009 2010 2011 2012 2013
Number of Operating
Olive Presses 235 276 272 279 264
Quantity of Olives Pressed 19,860.4 102,161.9 93,565.7 104,762.6 65,829.4
Quantity of Oil Extracted 4,771.3 23,754.0 20,754.0 22,951.1 17,641.9
Number of Persons
Engaged 892 1,523 1,326 1,220 1,119
Number of Paid
Employees 490 1,136 939 891 716
Compensation of
Employees 336.6 1,137.1 1,028.3 1,014.3 689.4
Olive Press Output 2,959.3 11,177.6 9,519.1 9,098.2 8,599.8
Value Added 1,778.9 7,983.2 7,016.8 6,490.8 6,464.0
Gross Fixed Capital
Formation 1,261.3 7,036.1 2,411.4 3,166.4 1,240.8
427
70
Quantity of Olive Oil Extracted in Palestine, 2009-2013 428
429 430
Quantity of Olives Pressed in Palestine, 2009-2013 431
432 433
434
4,771.3
23,754.0
20,754.0
22,951.1
17,641.9
0.0
10,000.0
20,000.0
30,000.0
1009 1070 1077 1071 1077
Year
Qu
an
tity
in
to
n
19,860.4
102,161.9
93,565.7
104,762.6
65,829.4
0
20,000
40,000
60,000
80,000
100,000
120,000
1009 1070 1077 1071 1077
Year
Qu
an
tity
in
to
n

71
Environment 435
72
436 437
438
73
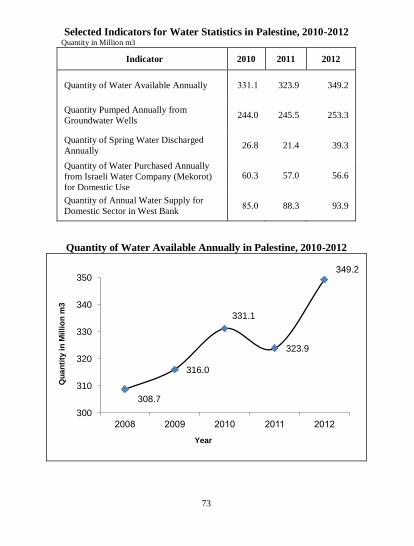
Selected Indicators for Water Statistics in Palestine, 2010-2012 439 Quantity in Million m3 440
Indicator 2010 2011 2012
Quantity of Water Available Annually 777.7 323.9 349.2
Quantity Pumped Annually from
Groundwater Wells 244.0 245.5 253.3
Quantity of Spring Water Discharged
Annually 26.8 21.4 39.3
Quantity of Water Purchased Annually
from Israeli Water Company (Mekorot)
for Domestic Use
60.3 57.0 56.6
Quantity of Annual Water Supply for
Domestic Sector in West Bank 83.0 88.3 93.9
441 Quantity of Water Available Annually in Palestine, 2010-2012 442
443 444 445
308.7
316.0
331.1
323.9
349.2
300
310
320
330
340
350
2008 2009 2010 2011 2012
Year
Qu
an
tity
in
Mil
lio
n m
3
74
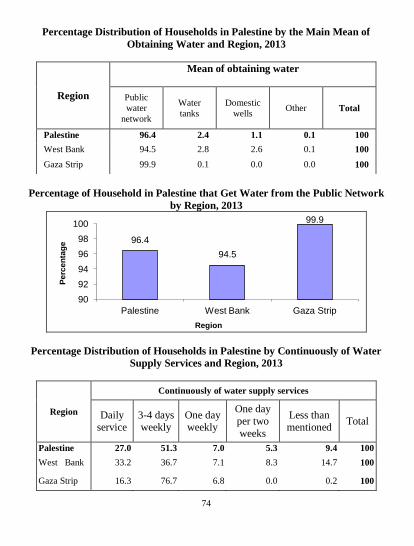
Percentage Distribution of Households in Palestine by the Main Mean of 446 Obtaining Water and Region, 2013 447
448 Percentage of Household in Palestine that Get Water from the Public Network 449
by Region, 2013 450
451 452
Percentage Distribution of Households in Palestine by Continuously of Water 453 Supply Services and Region, 2013 454
455
96.4
94.5
99.9
90
92
94
96
98
100
Palestine West Bank Gaza Strip
Region
Pe
rce
nta
ge
Region
Mean of obtaining water
Public
water
network
Water
tanks
Domestic
wells Other Total
Palestine 96.4 2.4 1.1 0.1 100
West Bank 94.5 2.8 2.6 0.1 100
Gaza Strip 99.9 0.1 0.0 0.0 100
Region
Continuously of water supply services
Daily
service
3-4 days
weekly
One day
weekly
One day
per two
weeks
Less than
mentioned Total
Palestine 27.0 51.3 7.0 5.3 9.4 100
West Bank 33.2 36.7 7.1 8.3 14.7 100
Gaza Strip 16.3 76.7 6.8 0.0 0.2 100
75
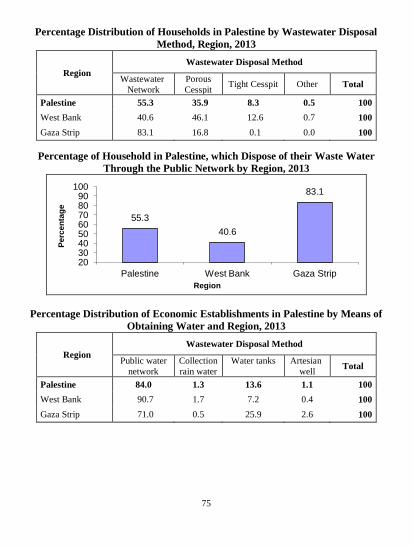
Percentage Distribution of Households in Palestine by Wastewater Disposal 456 Method, Region, 2013 457
Region
Wastewater Disposal Method
Wastewater Network
Porous
Cesspit Tight Cesspit Other Total
Palestine 55.3 35.9 8.3 0.5 100 West Bank 40.6 46.1 12.6 0.7 100 Gaza Strip 83.1 16.8 0.1 0.0 100
458 Percentage of Household in Palestine, which Dispose of their Waste Water 459
Through the Public Network by Region, 2013 460
461 462
Percentage Distribution of Economic Establishments in Palestine by Means of 463 Obtaining Water and Region, 2013 464
Region
Wastewater Disposal Method
Public water
network
Collection
rain water
well
Water tanks
Artesian
well
Total
Palestine 84.0 1.3 13.6 1.1 100 West Bank 90.7 1.7 7.2 0.4 100 Gaza Strip 71.0 0.5 25.9 2.6 100
465 466
55.3
40.6
83.1
20 30 40 50 60 70 80 90
100
Palestine West Bank Gaza Strip
Region
Pe
rce
nta
ge
76
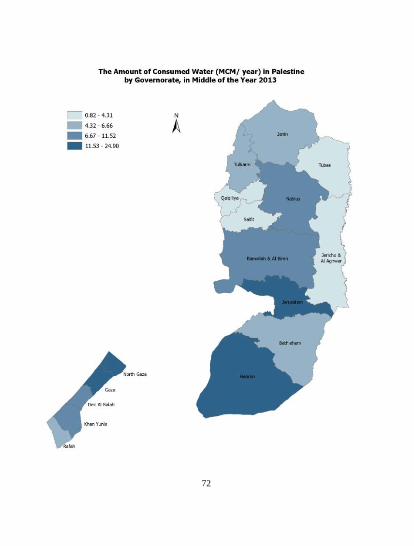
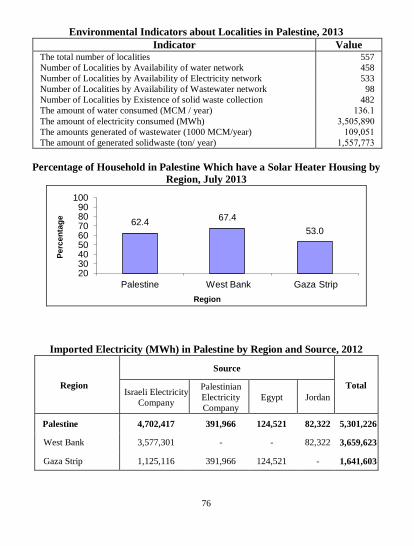
Environmental Indicators about Localities in Palestine, 2013 467 Indicator Value
The total number of localities 557
Number of Localities by Availability of water network 458
Number of Localities by Availability of Electricity network 533
Number of Localities by Availability of Wastewater network 98
Number of Localities by Existence of solid waste collection 482
The amount of water consumed (MCM / year) 773.7 The amount of electricity consumed (MWh) 7,303,890 The amounts generated of wastewater (1000 MCM/year) 709,037 The amount of generated solidwaste (ton/ year) 7,331,117
468 Percentage of Household in Palestine Which have a Solar Heater Housing by 469
Region, July 2013470
471 472 473 474
Imported Electricity (MWh) in Palestine by Region and Source, 2012 475
Total
Source
Region
Jordan Egypt
Palestinian
Electricity
Company
Israeli Electricity
Company
5,301,226 82,322 124,521 391,966 4,702,417 Palestine
3,659,623 82,322 - - 3,577,301 West Bank
1,641,603 - 124,521 391,966 1,125,116 Gaza Strip
62.4 67.4
53.0
20 30 40 50 60 70 80 90
100
Palestine West Bank Gaza Strip
Region
Pe
rce
nta
ge
77
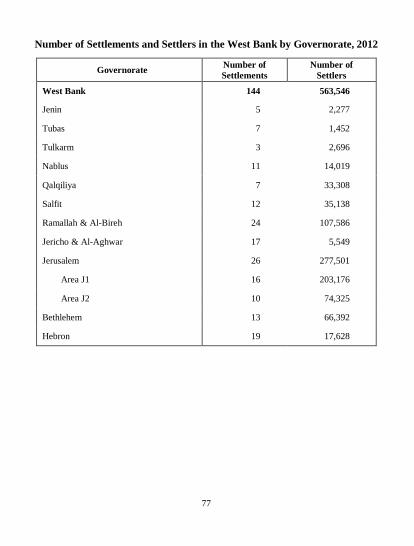
476 Number of Settlements and Settlers in the West Bank by Governorate, 2012 477
478 Number of
Settlers
Number of
Settlements Governorate
563,546 144 West Bank
2,277 5 Jenin
1,452 7 Tubas
2,696 3 Tulkarm
14,019 11 Nablus
33,308 7 Qalqiliya
35,138 12 Salfit
107,586 24 Ramallah & Al-Bireh
5,549 17 Jericho & Al-Aghwar
277,501 26 Jerusalem
203,176 16 Area J1
74,325 10 Area J2
66,392 13 Bethlehem
17,628 19 Hebron
479 480 481

78
482
79
Housing Conditions 483
80
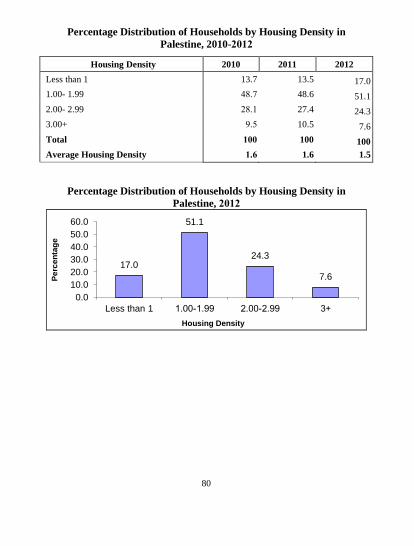
Percentage Distribution of Households by Housing Density in 484 Palestine, 2010-,66, 485
486 Housing Density 2010 2011 2012
Less than 1 13.7 13.5 17.0
1.00- 1.99 18.1 48.6 51.1
2.00- 2.99 18.7 27.4 24.3
3.00+ 9.3 10.5 7.6
Total 666 100 100
Average Housing Density 6,0 1.6 1.5
487 488
Percentage Distribution of Households by Housing Density in 489 Palestine, ,66, 490
491 492
17.0
51.1
24.3
7.6
0.0
10.0
20.0
30.0
40.0
50.0
60.0
Less than 1 1.99-1.00 2.99-2.00 +3
Housing Density
Pe
rce
nta
ge