Embed Size (px)
Citation preview
A User’s Introduction to
PAMGUARD Tutorial version 1.2.00 March 2009
PAMGUARD V 1.2.00 Tutorial
- 2 -
Contents
PAMGUARD Overview.................................................................................................................................. 3
Exercise 1. Installing PAMGUARD ......................................................................................................... 6
Exercise 2. PAMGUARD familiarisation.................................................................................................. 6
Ex 2.1 Launching PAMGUARD ........................................................................................................... 6
Ex 2.2 PAMGUARD GUI overview ...................................................................................................... 7
Ex 2.3 Using the map.......................................................................................................................... 8
Ex 2.4 Setting up a sound source........................................................................................................ 9
Exercise 3. Running the Click Detector................................................................................................. 10
Ex 3.1 Tracking clicks manually......................................................................................................... 11
Ex 3.2 Tracking clicks automatically .................................................................................................. 12
Exercise 4. Adding a Spectrogram Display ........................................................................................... 14
Ex 4.1 Add plug in displays to the spectrogram ................................................................................. 16
Exercise 5. Mysticete Detection............................................................................................................ 17
Ex 5.1 Energy Sum Detector............................................................................................................. 18
Ex 5.2 Spectrogram Correlation ........................................................................................................ 20
Ex 5.3 Matched filter Detector ........................................................................................................... 22
Exercise 6. Ishmael “hyperbolic localizer” ............................................................................................. 25
Exercise 7. Running the PAMGUARD 3-D module ............................................................................... 28
Exercise 8. The Whistle Detector.......................................................................................................... 32
Ex 8.1 Load the sound file ................................................................................................................. 32
Ex 8.2 Adding a Whistle Detector module.......................................................................................... 32
Ex 8.3 Viewing whistle detections...................................................................................................... 34
Ex 8.4 Data from Seismic Surveys .................................................................................................... 35
Exercise 9. Advanced display features ................................................................................................. 35
Ex 9.1 Adding further displays to Spectrogram Panels....................................................................... 35
Ex 9.2 Adding a Radar Display to the User Display panel.................................................................. 36
Exercise 10. Likelihood Detector ............................................................................................................ 37
Ex 10.1 Disable Multithreading Model ............................................................................................. 38
Ex 10.2 Add a Likelihood Detection Module .................................................................................... 38
Ex 10.3 Configure the Sound Acquisition ........................................................................................ 39
Ex 10.4 Add a Spectrogram Display................................................................................................ 40
Ex 10.5 Configure the Likelihood Detector’s Parameters ................................................................. 45
Ex 10.6 Play back data file and view detections .............................................................................. 47
Exercise 11. Detection during seismic source operation ......................................................................... 49
Ex 11.1 Loading the sound file ........................................................................................................ 49
Ex 11.2 Adjusting click detection parameters .................................................................................. 50
Exercise 12. Don’t stop now! .................................................................................................................. 51
www.pamguard.org
PAMGUARD V 1.2.00 Tutorial
- 3 -
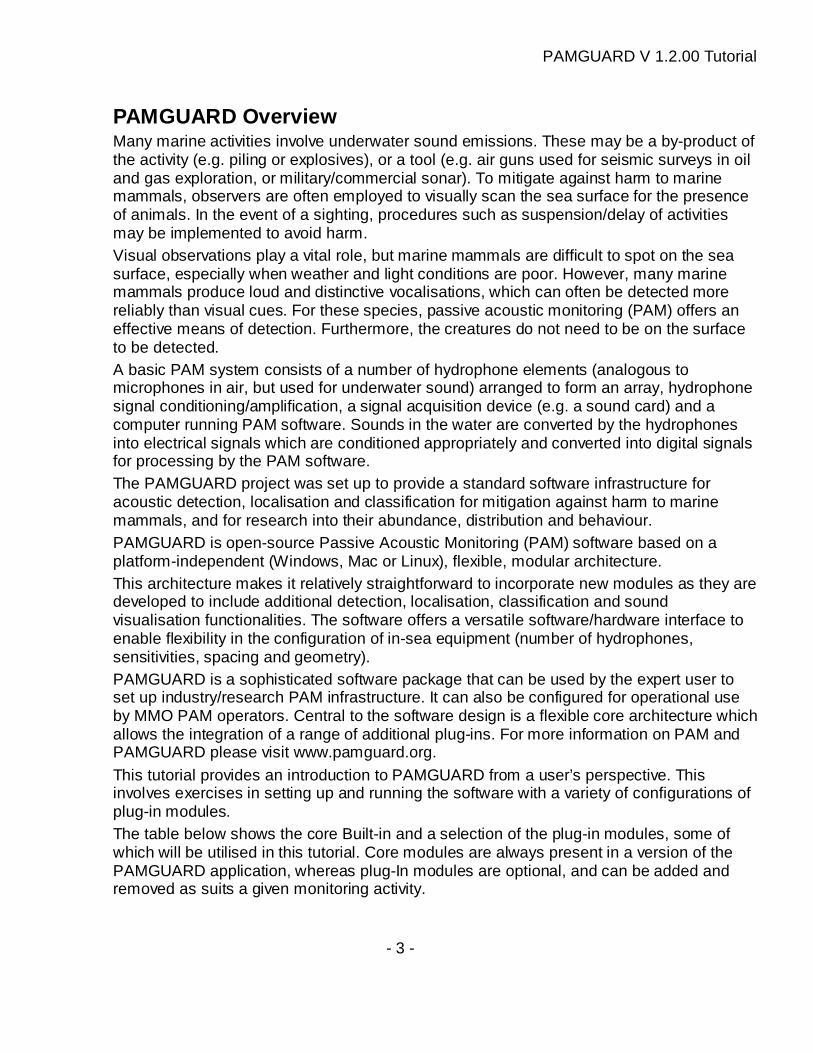
PAMGUARD Overview Many marine activities involve underwater sound emissions. These may be a by-product of the activity (e.g. piling or explosives), or a tool (e.g. air guns used for seismic surveys in oil and gas exploration, or military/commercial sonar). To mitigate against harm to marine mammals, observers are often employed to visually scan the sea surface for the presence of animals. In the event of a sighting, procedures such as suspension/delay of activities may be implemented to avoid harm. Visual observations play a vital role, but marine mammals are difficult to spot on the sea surface, especially when weather and light conditions are poor. However, many marine mammals produce loud and distinctive vocalisations, which can often be detected more reliably than visual cues. For these species, passive acoustic monitoring (PAM) offers an effective means of detection. Furthermore, the creatures do not need to be on the surface to be detected. A basic PAM system consists of a number of hydrophone elements (analogous to microphones in air, but used for underwater sound) arranged to form an array, hydrophone signal conditioning/amplification, a signal acquisition device (e.g. a sound card) and a computer running PAM software. Sounds in the water are converted by the hydrophones into electrical signals which are conditioned appropriately and converted into digital signals for processing by the PAM software. The PAMGUARD project was set up to provide a standard software infrastructure for acoustic detection, localisation and classification for mitigation against harm to marine mammals, and for research into their abundance, distribution and behaviour. PAMGUARD is open-source Passive Acoustic Monitoring (PAM) software based on a platform-independent (Windows, Mac or Linux), flexible, modular architecture. This architecture makes it relatively straightforward to incorporate new modules as they are developed to include additional detection, localisation, classification and sound visualisation functionalities. The software offers a versatile software/hardware interface to enable flexibility in the configuration of in-sea equipment (number of hydrophones, sensitivities, spacing and geometry). PAMGUARD is a sophisticated software package that can be used by the expert user to set up industry/research PAM infrastructure. It can also be configured for operational use by MMO PAM operators. Central to the software design is a flexible core architecture which allows the integration of a range of additional plug-ins. For more information on PAM and PAMGUARD please visit www.pamguard.org. This tutorial provides an introduction to PAMGUARD from a user’s perspective. This involves exercises in setting up and running the software with a variety of configurations of plug-in modules. The table below shows the core Built-in and a selection of the plug-in modules, some of which will be utilised in this tutorial. Core modules are always present in a version of the PAMGUARD application, whereas plug-In modules are optional, and can be added and removed as suits a given monitoring activity.
PAMGUARD V 1.2.00 Tutorial
- 4 -
Core Built-in Modules Plug-in Modules
Array configuration MAP Model Manager and Profiler NMEA/GPS Acquisition GUI Container for plugins Acquisition devices Help Manager FFT (Spectrum) factories Configuration and settings manager Decimator Standard graphics layout classes Sound recording Spectrogram smoothing Spectrogram displays Radar displays Click Detector Whistle Detector Energy Sum Detector
Spectrogram Correlation Detector Matched filter Detector
Database interface (requires MySQL or MS Access)
Source simulation An up to date list of PAMGUARD modules can be found at http://www.PAMGUARD.org/modules.shtml
Online Help PAMGUARD has extensive online help which is available from the Help Menu once you’ve started PAMGUARD. As you go through the exercises, you may also want to refer to these help pages. Please note that the help system was extensively updated in early 2009.

PAMGUARD V 1.2.00 Tutorial
- 5 -
Tutorial Learning Outcomes The purpose of this tutorial is to provide a basic overview of how to use PAMGUARD, including adding and configuring plug-in modules. The main learning outcomes are: Loading and running PAMGUARD configurations Navigating the Graphical User Interface (GUI) Basic Map familiarisation Running and configuring a Click Detector module Adding and configuring User Display panels Using “Ishmael” modules for Energy Sum, Spectrogram Correlation and Matched Filter detectors. Overlaying detector graphics on display panels Adding and configuring FFT Engines Adding, configuring and running a Whistle Detector Adding and configuring a Likelihood Detector These learning outcomes can be achieved through a series of exercises that now follow. The exercises can be seen as a guide, so you’re encouraged to experiment with PAMGUARD as you work through each one.
PAMGUARD V 1.2.00 Tutorial
- 6 -
Exercise 1. Installing PAMGUARD The PAMGUARD software can be downloaded from the PAMGUARD sourceforge site at https://sourceforge.net/projects/pamguard/. All tutorial exercises can be complete with the latest Core or Beta releases. If you are running under Windows, then take one of the .exe type installers (e.g. Setup-PamguardBeta_1_3_00.exe), run the executable and launch PAMGUARD from the Start menu. If running on a Mac or under Linux, download one of the platform independent jar files (e.g. PamguardBeta_1_3_02.jar). Refer to your operating system and Java documentation on how to launch the program. Other things you need You will also need to download the sample sound files from the sourceforge site and example configuration files from the ‘psf file download’ link available at http://www.pamguard.org/pamguardTutorial.shtml.
Exercise 2. PAMGUARD familiarisation
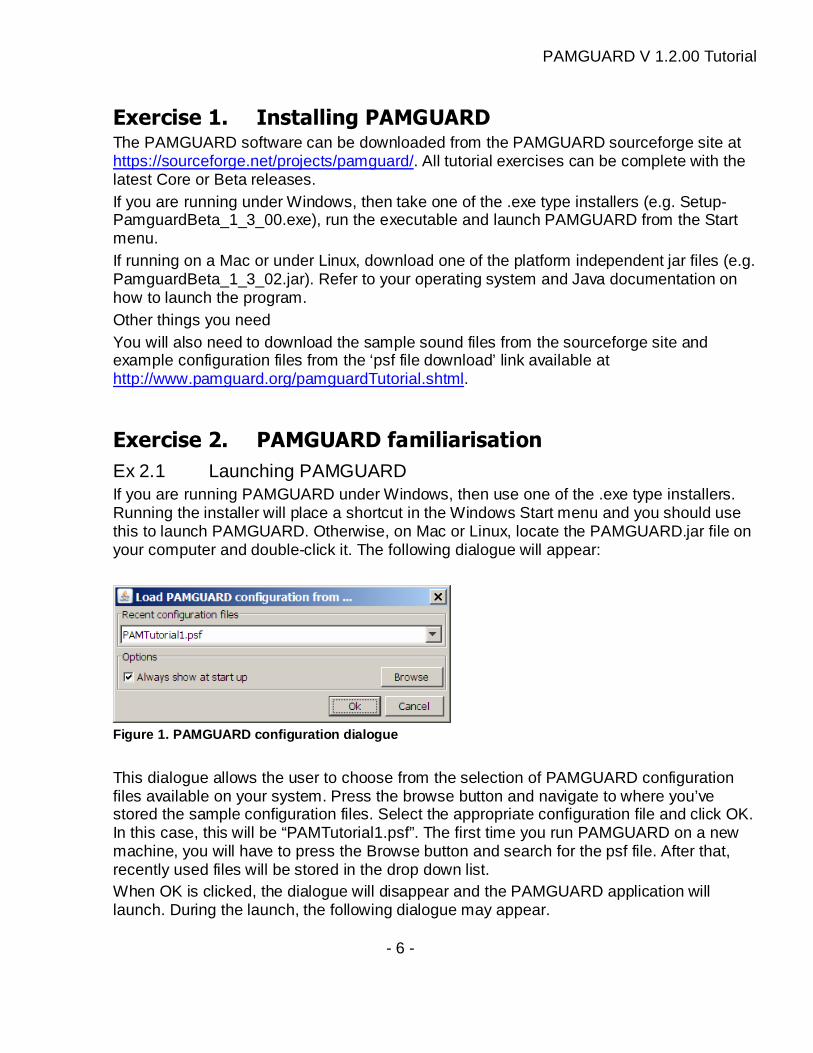
Ex 2.1 Launching PAMGUARD If you are running PAMGUARD under Windows, then use one of the .exe type installers. Running the installer will place a shortcut in the Windows Start menu and you should use this to launch PAMGUARD. Otherwise, on Mac or Linux, locate the PAMGUARD.jar file on your computer and double-click it. The following dialogue will appear:
Figure 1. PAMGUARD configuration dialogue
This dialogue allows the user to choose from the selection of PAMGUARD configuration files available on your system. Press the browse button and navigate to where you’ve stored the sample configuration files. Select the appropriate configuration file and click OK. In this case, this will be “PAMTutorial1.psf”. The first time you run PAMGUARD on a new machine, you will have to press the Browse button and search for the psf file. After that, recently used files will be stored in the drop down list. When OK is clicked, the dialogue will disappear and the PAMGUARD application will launch. During the launch, the following dialogue may appear.
PAMGUARD V 1.2.00 Tutorial
- 7 -
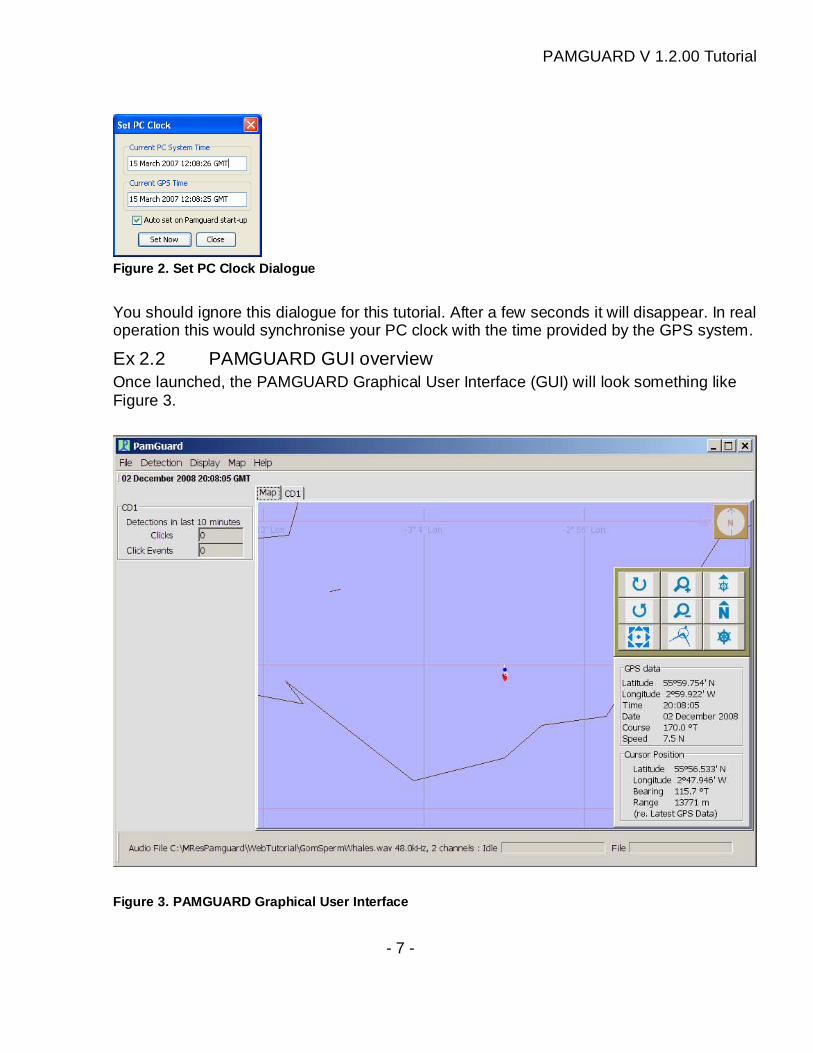
Figure 2. Set PC Clock Dialogue
You should ignore this dialogue for this tutorial. After a few seconds it will disappear. In real operation this would synchronise your PC clock with the time provided by the GPS system.
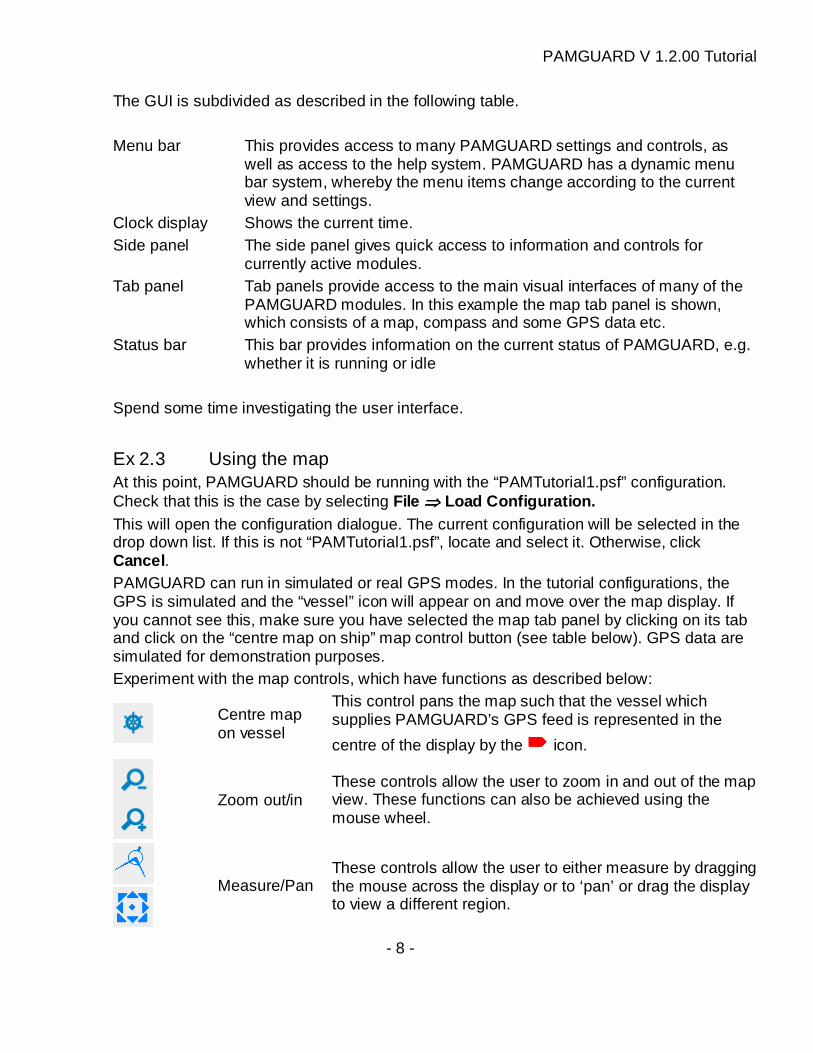
Ex 2.2 PAMGUARD GUI overview Once launched, the PAMGUARD Graphical User Interface (GUI) will look something like Figure 3.
Figure 3. PAMGUARD Graphical User Interface
PAMGUARD V 1.2.00 Tutorial
- 8 -
The GUI is subdivided as described in the following table. Menu bar This provides access to many PAMGUARD settings and controls, as
well as access to the help system. PAMGUARD has a dynamic menu bar system, whereby the menu items change according to the current view and settings.
Clock display Shows the current time. Side panel The side panel gives quick access to information and controls for
currently active modules. Tab panel Tab panels provide access to the main visual interfaces of many of the
PAMGUARD modules. In this example the map tab panel is shown, which consists of a map, compass and some GPS data etc.
Status bar This bar provides information on the current status of PAMGUARD, e.g. whether it is running or idle
Spend some time investigating the user interface.
Ex 2.3 Using the map At this point, PAMGUARD should be running with the “PAMTutorial1.psf” configuration. Check that this is the case by selecting File ⇒⇒⇒⇒ Load Configuration . This will open the configuration dialogue. The current configuration will be selected in the drop down list. If this is not “PAMTutorial1.psf”, locate and select it. Otherwise, click Cancel . PAMGUARD can run in simulated or real GPS modes. In the tutorial configurations, the GPS is simulated and the “vessel” icon will appear on and move over the map display. If you cannot see this, make sure you have selected the map tab panel by clicking on its tab and click on the “centre map on ship” map control button (see table below). GPS data are simulated for demonstration purposes. Experiment with the map controls, which have functions as described below:
Centre map on vessel
This control pans the map such that the vessel which supplies PAMGUARD’s GPS feed is represented in the
centre of the display by the ���� icon.
Zoom out/in These controls allow the user to zoom in and out of the map view. These functions can also be achieved using the mouse wheel.
Measure/Pan These controls allow the user to either measure by dragging the mouse across the display or to ‘pan’ or drag the display to view a different region.
PAMGUARD V 1.2.00 Tutorial
- 9 -
Ship/North orientation
These controls set the map’s orientation to ship’s heading and North, respectively.
Rotate map These controls allow the user to rotate the map to a desired arbitrary orientation.
Move the mouse cursor around the map and note that the Latitude and Longitude of the cursor position is provided and in addition, the range from the mouse cursor to the host vessel. This is useful for range estimation.
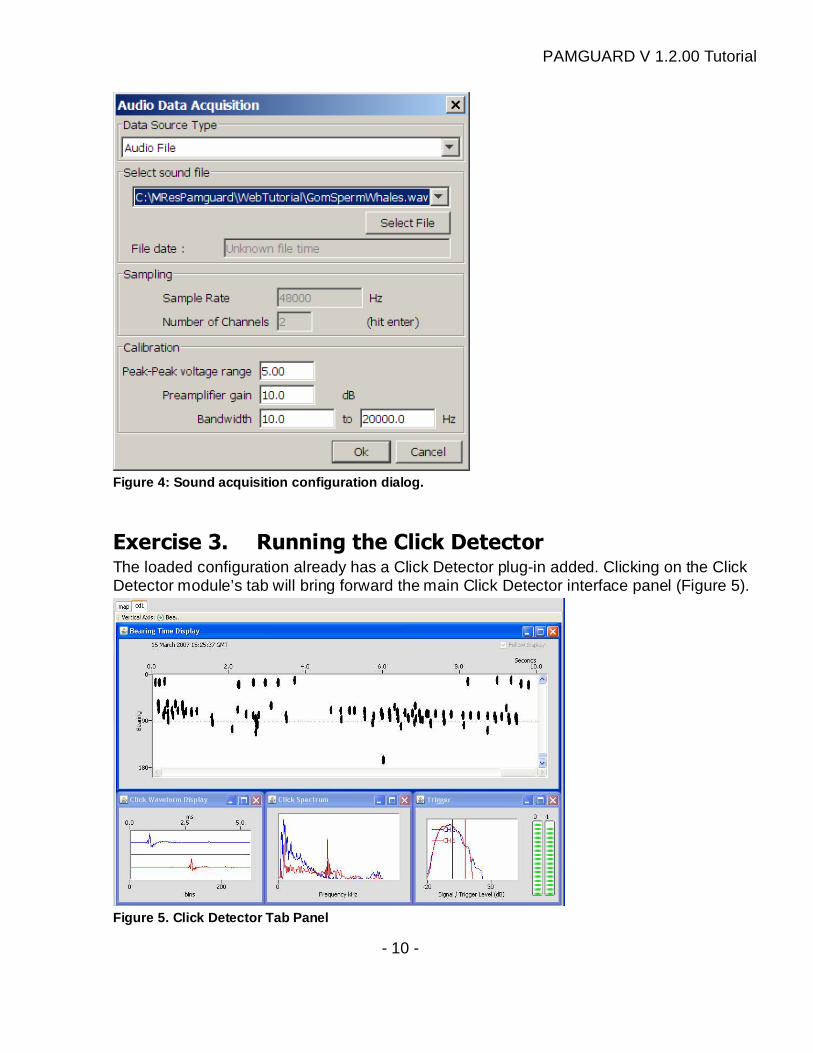
Ex 2.4 Setting up a sound source First of all you will need a source of sound. PAMGUARD modules can acquire sound data in a number of ways, e.g. sound can be acquired directly from the system sound card, from some other digital acquisition device or sound files can be loaded and “re-played”. In the exercises you will play back sound from a file rather than receive it in through a sound card. PAMGUARD will operate in exactly the same way as it would if the sound were coming in through the sound card. If a sound playback module is included in the PAMGUARD configuration, then analysis will be in real time. If a sound playback module is not included, then PAMGUARD will process data as fast as possible. To load a sound file, your configuration must contain a ‘Sound Acquisition’ module. Go to the settings dialog for the sound acquisition module (Figure 4), In ‘Data Source Type’ select ‘Audio File’. Select the file of choice (AIF or WAV format) either using the ‘Select File’ button or selecting a recent file from the drop down list. The sample rate and number of channels will be read automatically from the file. If you have calibration information you can also enter it here, but this is not required for any of the exercises in this tutorial.
Note the information panel at the lower right hand corner of the map. This shows useful information such as the position of the vessel which is supplied by the GPS feed to PAMGUARD.
PAMGUARD V 1.2.00 Tutorial
- 10 -
Figure 4: Sound acquisition configuration dialog.
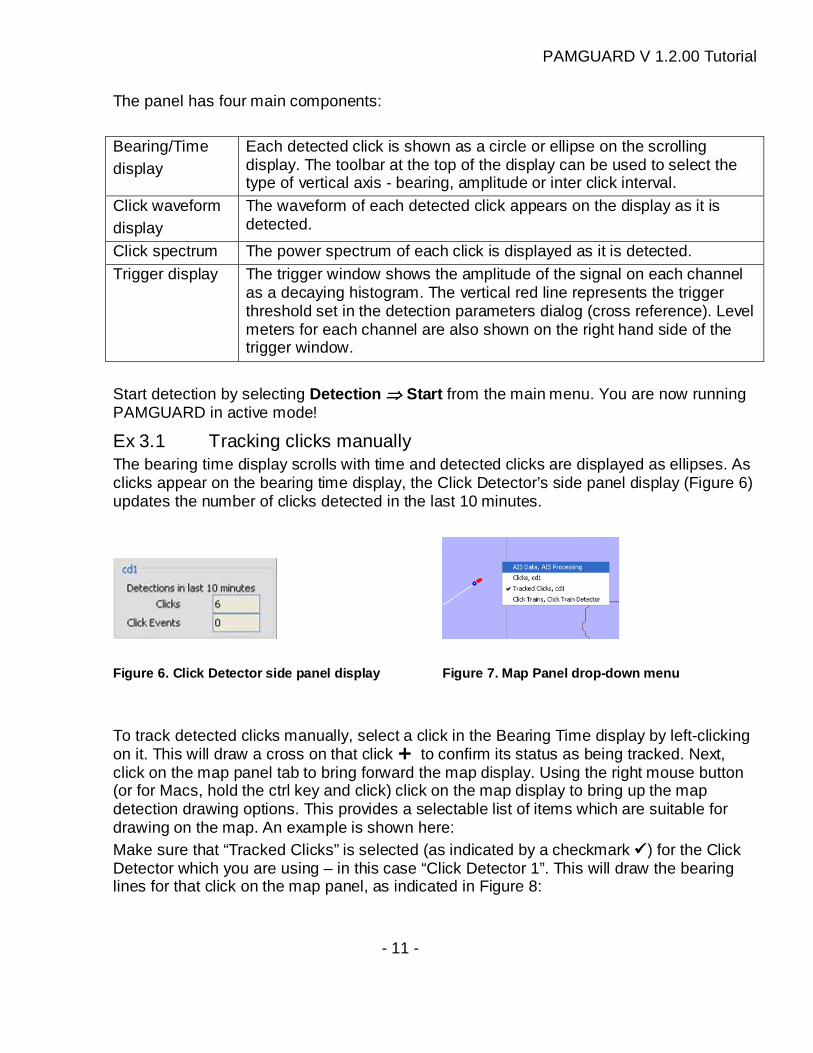
Exercise 3. Running the Click Detector The loaded configuration already has a Click Detector plug-in added. Clicking on the Click Detector module’s tab will bring forward the main Click Detector interface panel (Figure 5).
Figure 5. Click Detector Tab Panel
PAMGUARD V 1.2.00 Tutorial
- 11 -
The panel has four main components: Bearing/Time display
Each detected click is shown as a circle or ellipse on the scrolling display. The toolbar at the top of the display can be used to select the type of vertical axis - bearing, amplitude or inter click interval.
Click waveform display
The waveform of each detected click appears on the display as it is detected.
Click spectrum The power spectrum of each click is displayed as it is detected. Trigger display The trigger window shows the amplitude of the signal on each channel
as a decaying histogram. The vertical red line represents the trigger threshold set in the detection parameters dialog (cross reference). Level meters for each channel are also shown on the right hand side of the trigger window.
Start detection by selecting Detection ⇒⇒⇒⇒ Start from the main menu. You are now running PAMGUARD in active mode!
Ex 3.1 Tracking clicks manually The bearing time display scrolls with time and detected clicks are displayed as ellipses. As clicks appear on the bearing time display, the Click Detector’s side panel display (Figure 6) updates the number of clicks detected in the last 10 minutes.
Figure 6. Click Detector side panel display
Figure 7. Map Panel drop-down menu
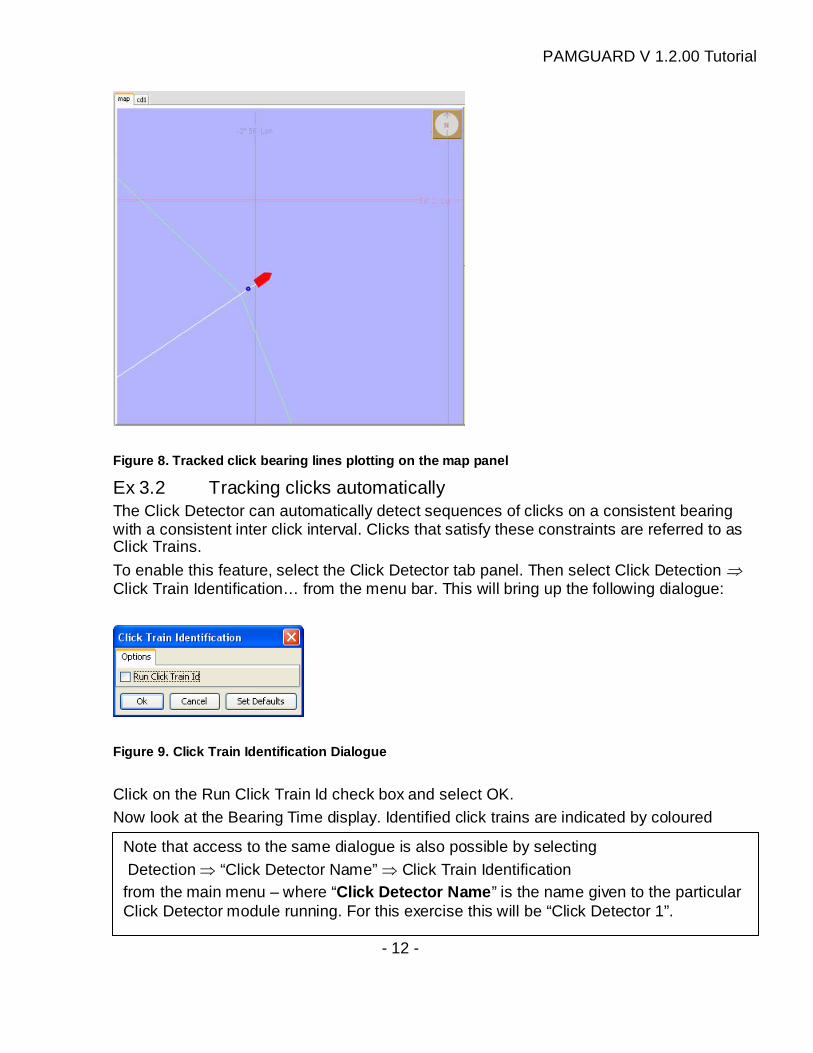
To track detected clicks manually, select a click in the Bearing Time display by left-clicking on it. This will draw a cross on that click � to confirm its status as being tracked. Next, click on the map panel tab to bring forward the map display. Using the right mouse button (or for Macs, hold the ctrl key and click) click on the map display to bring up the map detection drawing options. This provides a selectable list of items which are suitable for drawing on the map. An example is shown here: Make sure that “Tracked Clicks” is selected (as indicated by a checkmark ����) for the Click Detector which you are using – in this case “Click Detector 1”. This will draw the bearing lines for that click on the map panel, as indicated in Figure 8:
PAMGUARD V 1.2.00 Tutorial
- 12 -
Figure 8. Tracked click bearing lines plotting on t he map panel
Ex 3.2 Tracking clicks automatically The Click Detector can automatically detect sequences of clicks on a consistent bearing with a consistent inter click interval. Clicks that satisfy these constraints are referred to as Click Trains.
To enable this feature, select the Click Detector tab panel. Then select Click Detection ⇒ Click Train Identification… from the menu bar. This will bring up the following dialogue:
Figure 9. Click Train Identification Dialogue
Click on the Run Click Train Id check box and select OK. Now look at the Bearing Time display. Identified click trains are indicated by coloured
Note that access to the same dialogue is also possible by selecting Detection ⇒ “Click Detector Name” ⇒ Click Train Identification from the main menu – where “Click Detector Name ” is the name given to the particular Click Detector module running. For this exercise this will be “Click Detector 1”.
PAMGUARD V 1.2.00 Tutorial
- 13 -
ellipses, as in the Figure 10.
Figure 10. Click trains plotted on the bearing time display
Now switch to the map view. Position the mouse somewhere on the blue map area and press the right mouse button to display the drop-down detector selection box and make sure that “Click Trains” is selected. If a click train reaches sufficient length and the bearing change is adequate, target motion analysis automatically calculates a range and bearing to the sound source. The first and last bearing lines associated with this click train sequence are also automatically displayed on the map. An example is shown in Figure 11.
PAMGUARD V 1.2.00 Tutorial
- 14 -
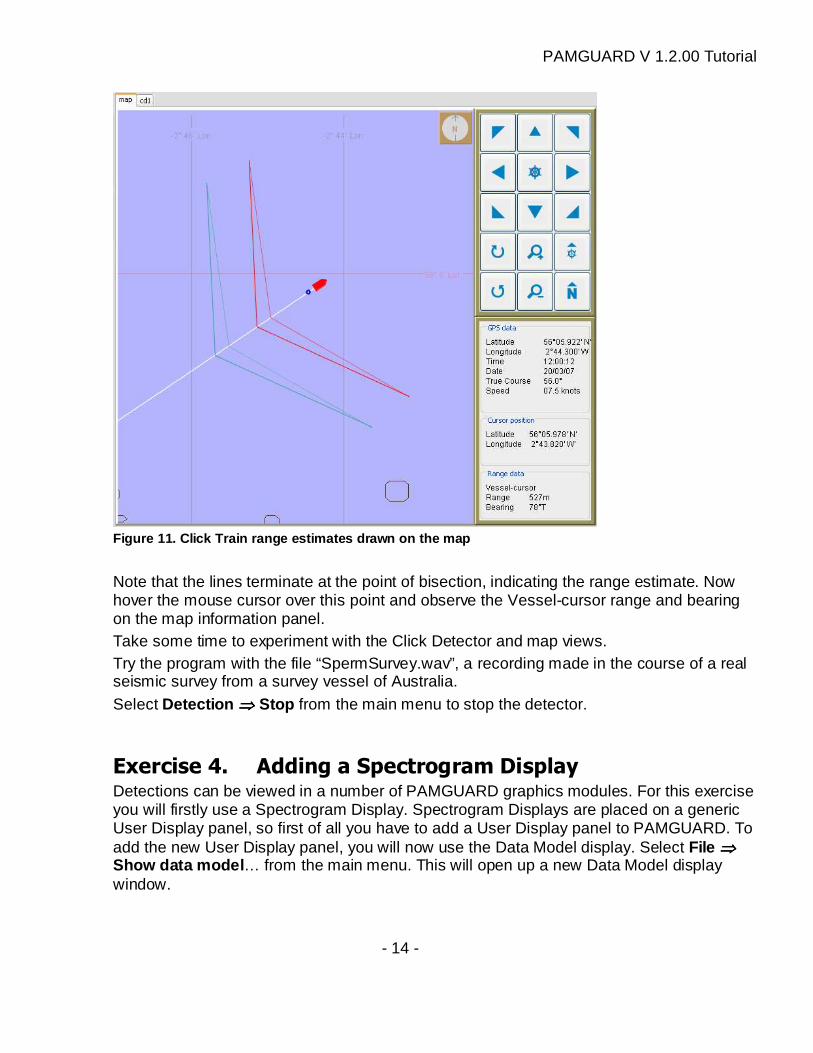
Figure 11. Click Train range estimates drawn on the map
Note that the lines terminate at the point of bisection, indicating the range estimate. Now hover the mouse cursor over this point and observe the Vessel-cursor range and bearing on the map information panel. Take some time to experiment with the Click Detector and map views. Try the program with the file “SpermSurvey.wav”, a recording made in the course of a real seismic survey from a survey vessel of Australia. Select Detection ⇒⇒⇒⇒ Stop from the main menu to stop the detector.
Exercise 4. Adding a Spectrogram Display Detections can be viewed in a number of PAMGUARD graphics modules. For this exercise you will firstly use a Spectrogram Display. Spectrogram Displays are placed on a generic User Display panel, so first of all you have to add a User Display panel to PAMGUARD. To add the new User Display panel, you will now use the Data Model display. Select File ⇒⇒⇒⇒ Show data model … from the main menu. This will open up a new Data Model display window.
PAMGUARD V 1.2.00 Tutorial
- 15 -
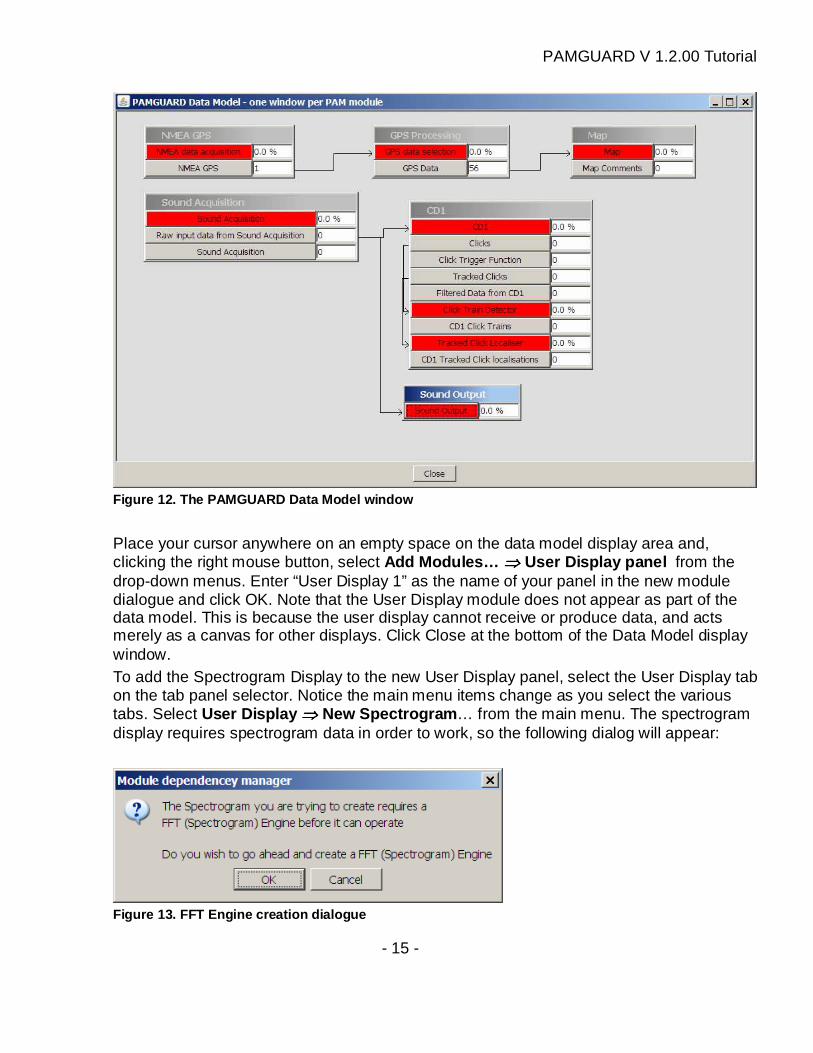
Figure 12. The PAMGUARD Data Model window
Place your cursor anywhere on an empty space on the data model display area and, clicking the right mouse button, select Add Modules… ⇒⇒⇒⇒ User Display panel from the drop-down menus. Enter “User Display 1” as the name of your panel in the new module dialogue and click OK. Note that the User Display module does not appear as part of the data model. This is because the user display cannot receive or produce data, and acts merely as a canvas for other displays. Click Close at the bottom of the Data Model display window. To add the Spectrogram Display to the new User Display panel, select the User Display tab on the tab panel selector. Notice the main menu items change as you select the various tabs. Select User Display ⇒⇒⇒⇒ New Spectrogram … from the main menu. The spectrogram display requires spectrogram data in order to work, so the following dialog will appear:
Figure 13. FFT Engine creation dialogue
PAMGUARD V 1.2.00 Tutorial
- 16 -
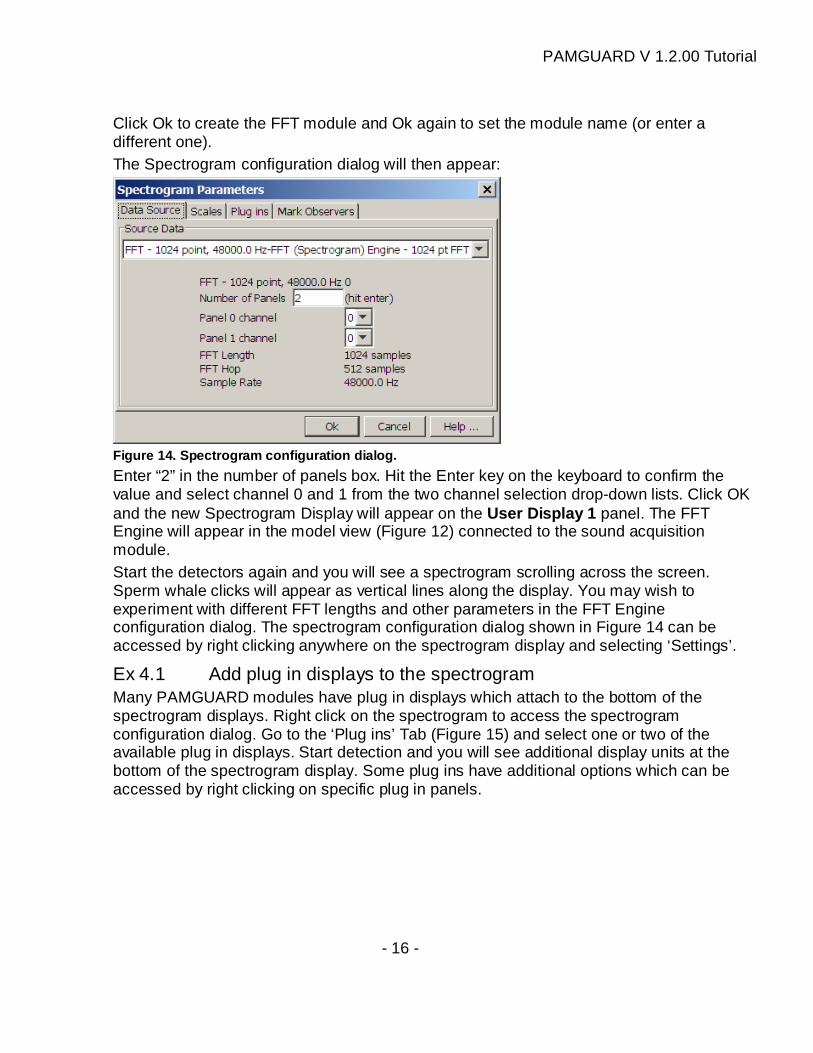
Click Ok to create the FFT module and Ok again to set the module name (or enter a different one). The Spectrogram configuration dialog will then appear:
Figure 14. Spectrogram configuration dialog.
Enter “2” in the number of panels box. Hit the Enter key on the keyboard to confirm the value and select channel 0 and 1 from the two channel selection drop-down lists. Click OK and the new Spectrogram Display will appear on the User Display 1 panel. The FFT Engine will appear in the model view (Figure 12) connected to the sound acquisition module. Start the detectors again and you will see a spectrogram scrolling across the screen. Sperm whale clicks will appear as vertical lines along the display. You may wish to experiment with different FFT lengths and other parameters in the FFT Engine configuration dialog. The spectrogram configuration dialog shown in Figure 14 can be accessed by right clicking anywhere on the spectrogram display and selecting ‘Settings’.
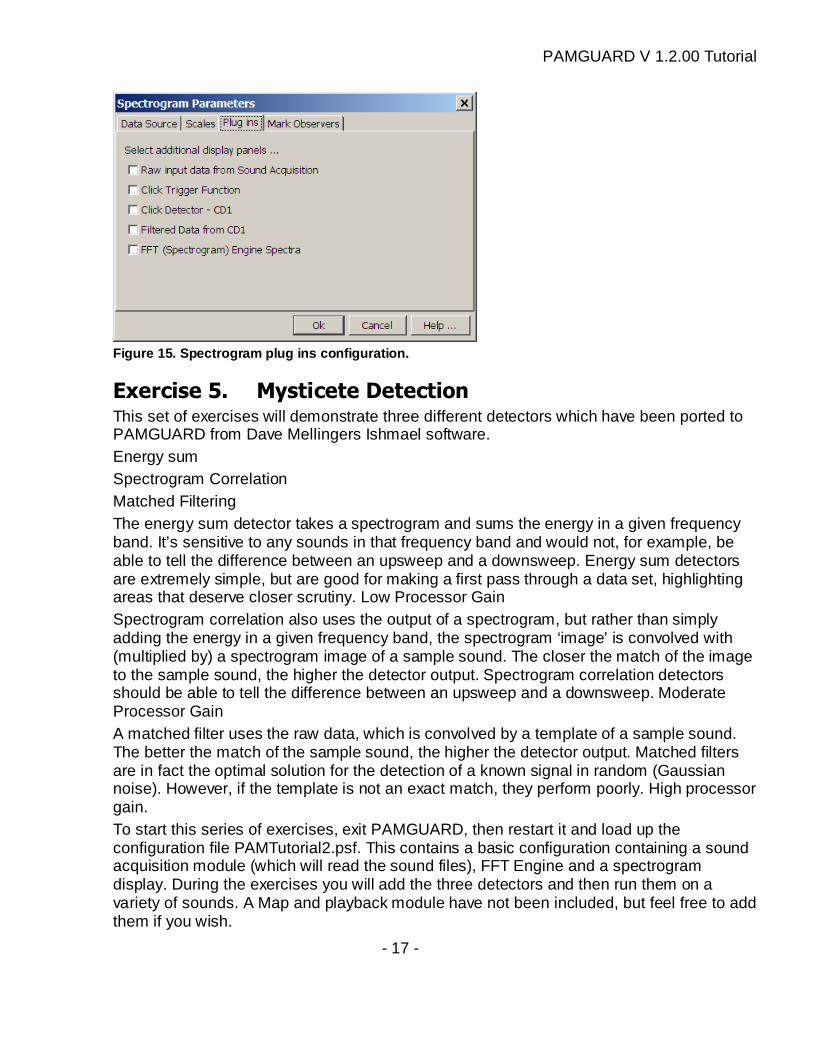
Ex 4.1 Add plug in displays to the spectrogram Many PAMGUARD modules have plug in displays which attach to the bottom of the spectrogram displays. Right click on the spectrogram to access the spectrogram configuration dialog. Go to the ‘Plug ins’ Tab (Figure 15) and select one or two of the available plug in displays. Start detection and you will see additional display units at the bottom of the spectrogram display. Some plug ins have additional options which can be accessed by right clicking on specific plug in panels.
PAMGUARD V 1.2.00 Tutorial
- 17 -
Figure 15. Spectrogram plug ins configuration.
Exercise 5. Mysticete Detection This set of exercises will demonstrate three different detectors which have been ported to PAMGUARD from Dave Mellingers Ishmael software. Energy sum Spectrogram Correlation Matched Filtering The energy sum detector takes a spectrogram and sums the energy in a given frequency band. It’s sensitive to any sounds in that frequency band and would not, for example, be able to tell the difference between an upsweep and a downsweep. Energy sum detectors are extremely simple, but are good for making a first pass through a data set, highlighting areas that deserve closer scrutiny. Low Processor Gain Spectrogram correlation also uses the output of a spectrogram, but rather than simply adding the energy in a given frequency band, the spectrogram ‘image’ is convolved with (multiplied by) a spectrogram image of a sample sound. The closer the match of the image to the sample sound, the higher the detector output. Spectrogram correlation detectors should be able to tell the difference between an upsweep and a downsweep. Moderate Processor Gain A matched filter uses the raw data, which is convolved by a template of a sample sound. The better the match of the sample sound, the higher the detector output. Matched filters are in fact the optimal solution for the detection of a known signal in random (Gaussian noise). However, if the template is not an exact match, they perform poorly. High processor gain. To start this series of exercises, exit PAMGUARD, then restart it and load up the configuration file PAMTutorial2.psf. This contains a basic configuration containing a sound acquisition module (which will read the sound files), FFT Engine and a spectrogram display. During the exercises you will add the three detectors and then run them on a variety of sounds. A Map and playback module have not been included, but feel free to add them if you wish.
PAMGUARD V 1.2.00 Tutorial
- 18 -
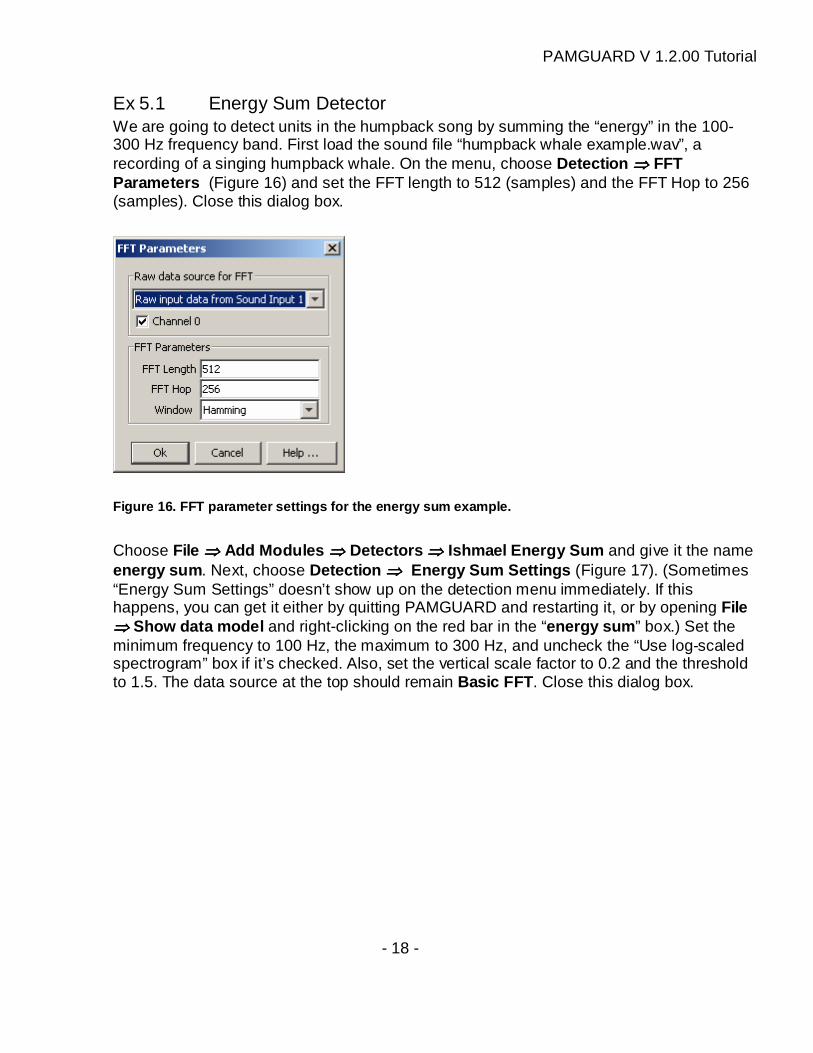
Ex 5.1 Energy Sum Detector We are going to detect units in the humpback song by summing the “energy” in the 100-300 Hz frequency band. First load the sound file “humpback whale example.wav”, a recording of a singing humpback whale. On the menu, choose Detection ⇒⇒⇒⇒ FFT Parameters (Figure 16) and set the FFT length to 512 (samples) and the FFT Hop to 256 (samples). Close this dialog box.
Figure 16. FFT parameter settings for the energy su m example.
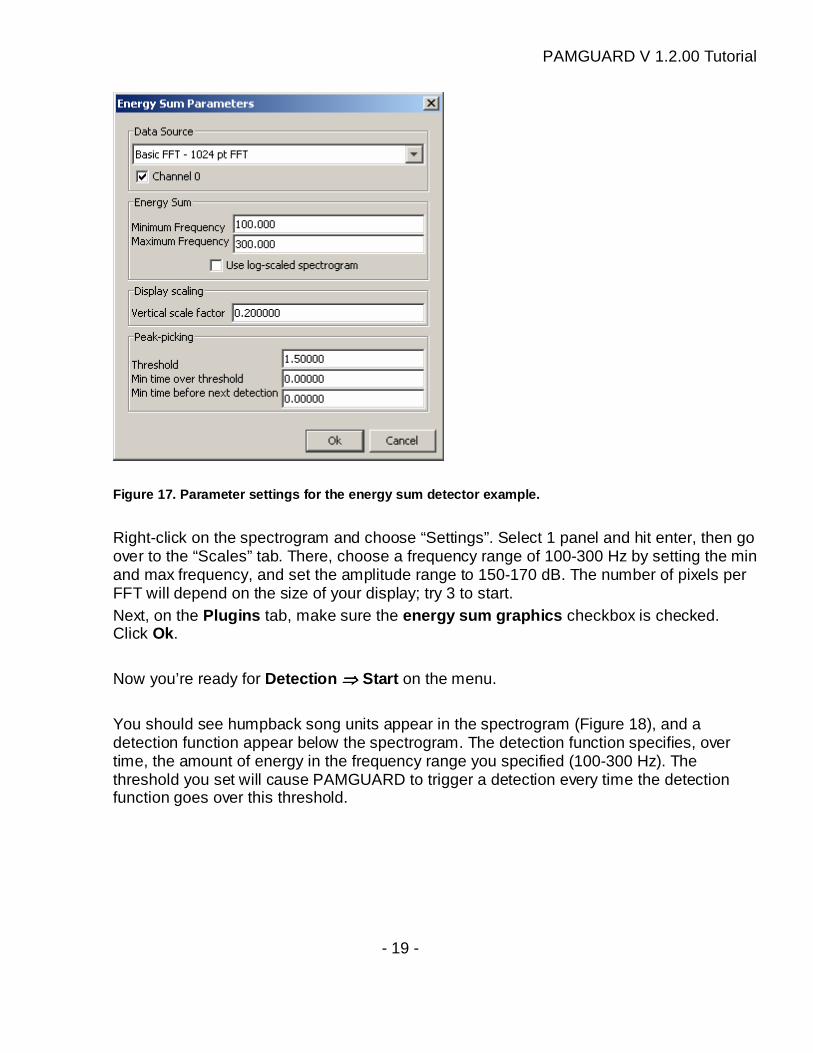
Choose File ⇒⇒⇒⇒ Add Modules ⇒⇒⇒⇒ Detectors ⇒⇒⇒⇒ Ishmael Energy Sum and give it the name energy sum . Next, choose Detection ⇒⇒⇒⇒ Energy Sum Settings (Figure 17). (Sometimes “Energy Sum Settings” doesn’t show up on the detection menu immediately. If this happens, you can get it either by quitting PAMGUARD and restarting it, or by opening File ⇒⇒⇒⇒ Show data model and right-clicking on the red bar in the “energy sum ” box.) Set the minimum frequency to 100 Hz, the maximum to 300 Hz, and uncheck the “Use log-scaled spectrogram” box if it’s checked. Also, set the vertical scale factor to 0.2 and the threshold to 1.5. The data source at the top should remain Basic FFT . Close this dialog box.
PAMGUARD V 1.2.00 Tutorial
- 19 -
Figure 17. Parameter settings for the energy sum de tector example.
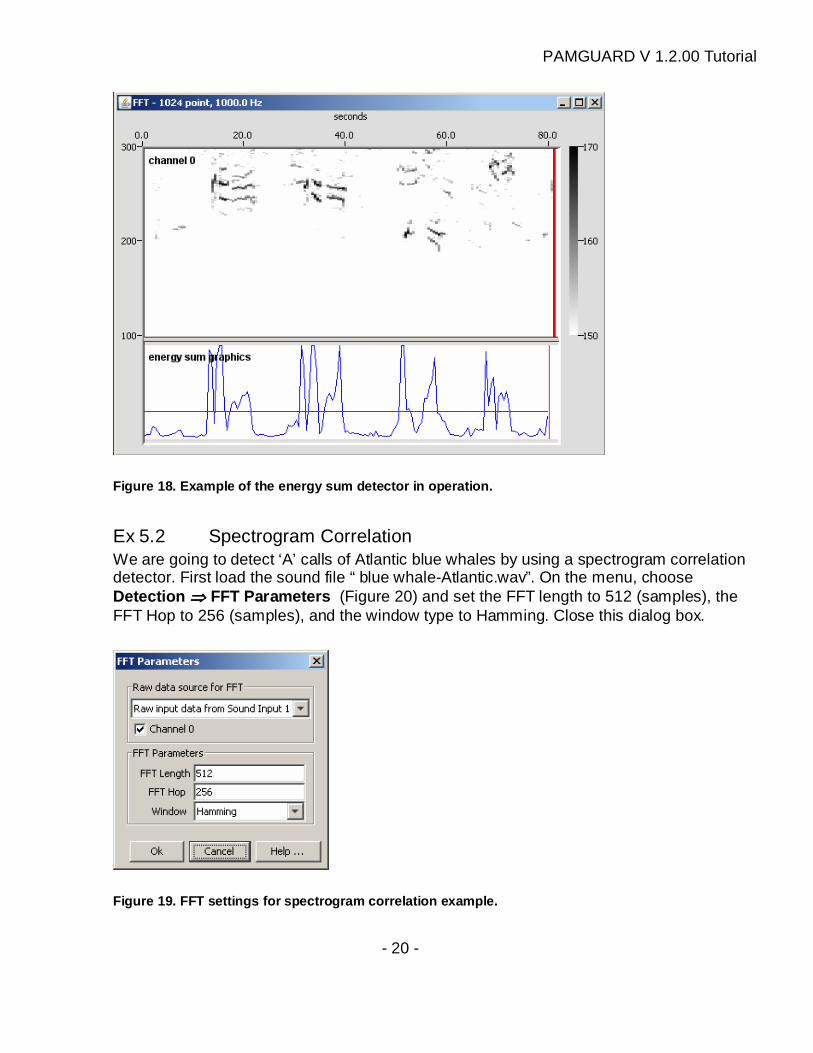
Right-click on the spectrogram and choose “Settings”. Select 1 panel and hit enter, then go over to the “Scales” tab. There, choose a frequency range of 100-300 Hz by setting the min and max frequency, and set the amplitude range to 150-170 dB. The number of pixels per FFT will depend on the size of your display; try 3 to start. Next, on the Plugins tab, make sure the energy sum graphics checkbox is checked. Click Ok. Now you’re ready for Detection ⇒⇒⇒⇒ Start on the menu. You should see humpback song units appear in the spectrogram (Figure 18), and a detection function appear below the spectrogram. The detection function specifies, over time, the amount of energy in the frequency range you specified (100-300 Hz). The threshold you set will cause PAMGUARD to trigger a detection every time the detection function goes over this threshold.
PAMGUARD V 1.2.00 Tutorial
- 20 -
Figure 18. Example of the energy sum detector in op eration.
Ex 5.2 Spectrogram Correlation We are going to detect ‘A’ calls of Atlantic blue whales by using a spectrogram correlation detector. First load the sound file “ blue whale-Atlantic.wav”. On the menu, choose Detection ⇒⇒⇒⇒ FFT Parameters (Figure 20) and set the FFT length to 512 (samples), the FFT Hop to 256 (samples), and the window type to Hamming. Close this dialog box.
Figure 19. FFT settings for spectrogram correlation example.
PAMGUARD V 1.2.00 Tutorial
- 21 -
Next, choose File ⇒ Add Modules ⇒ Detectors ⇒ Ishmael spectrogram correlation and give it the name spectrogram correlation. Then choose Detection ⇒ Spectrogram Correlation Settings (Figure 20). (Sometimes “Spectrogram correlation Settings” doesn’t show up on the detection menu immediately. If this happens, you can get it either by quitting PAMGUARD and restarting it, or by opening File ⇒⇒⇒⇒ Show data model and right-clicking on the red bar in the spectrogram correlation box.) For segment 1, enter 0 for t0, 18 for f0, 10 for t1, and 17 for f1. For segment 1, enter 10 for t0, 17 for f0, 15 for t1, and 15 for f1. Leave the other segments blank, and use 1 Hz for the kernel width. Make the vertical scale factor 0.2. Close this dialog box.
Figure 20. Parameter settings for the spectrogram c orrelation example.
Right-click on the spectrogram and choose Settings . Select 1 panel and hit enter, then go over to the Scales tab. There, choose a frequency range of 10-50 Hz by setting the min and max frequency, and set the amplitude range to 160-190 dB. The number of pixels per FFT will depend on the size of your display; try 3 to start. Next, on the Plugins tab, make sure the “spectrogram correlation graphics” checkbox is checked. Click Ok.
PAMGUARD V 1.2.00 Tutorial
- 22 -
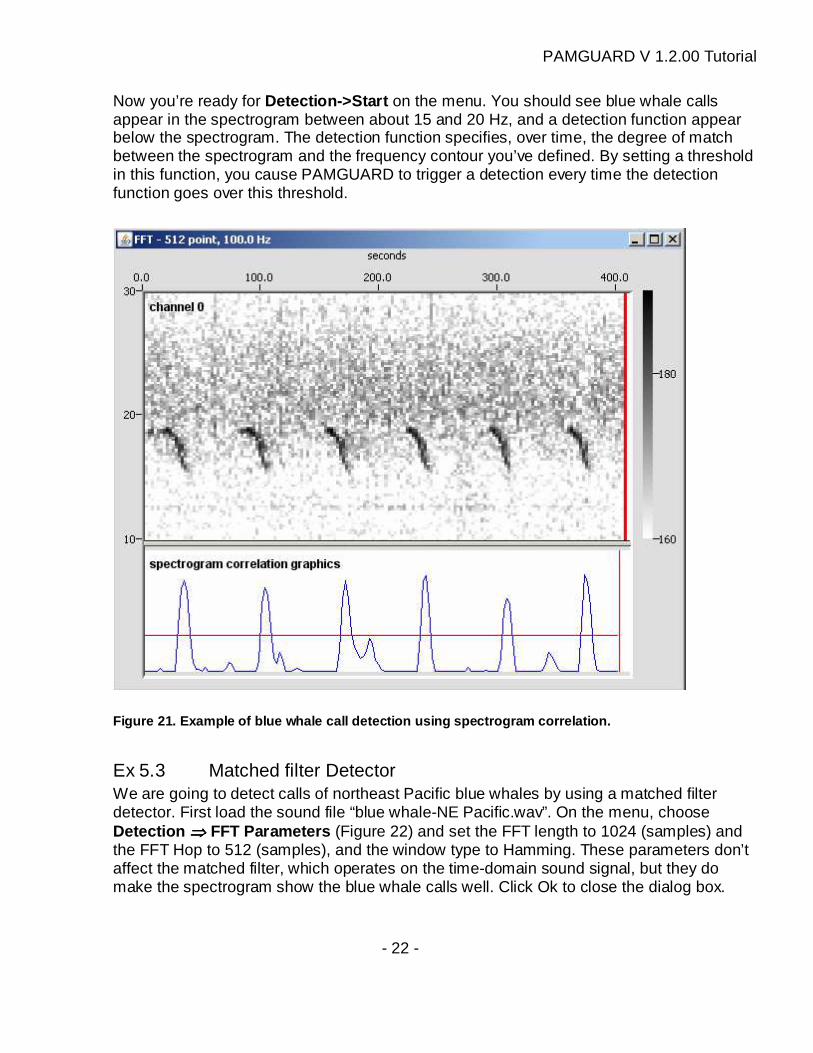
Now you’re ready for Detection->Start on the menu. You should see blue whale calls appear in the spectrogram between about 15 and 20 Hz, and a detection function appear below the spectrogram. The detection function specifies, over time, the degree of match between the spectrogram and the frequency contour you’ve defined. By setting a threshold in this function, you cause PAMGUARD to trigger a detection every time the detection function goes over this threshold.
Figure 21. Example of blue whale call detection usi ng spectrogram correlation.
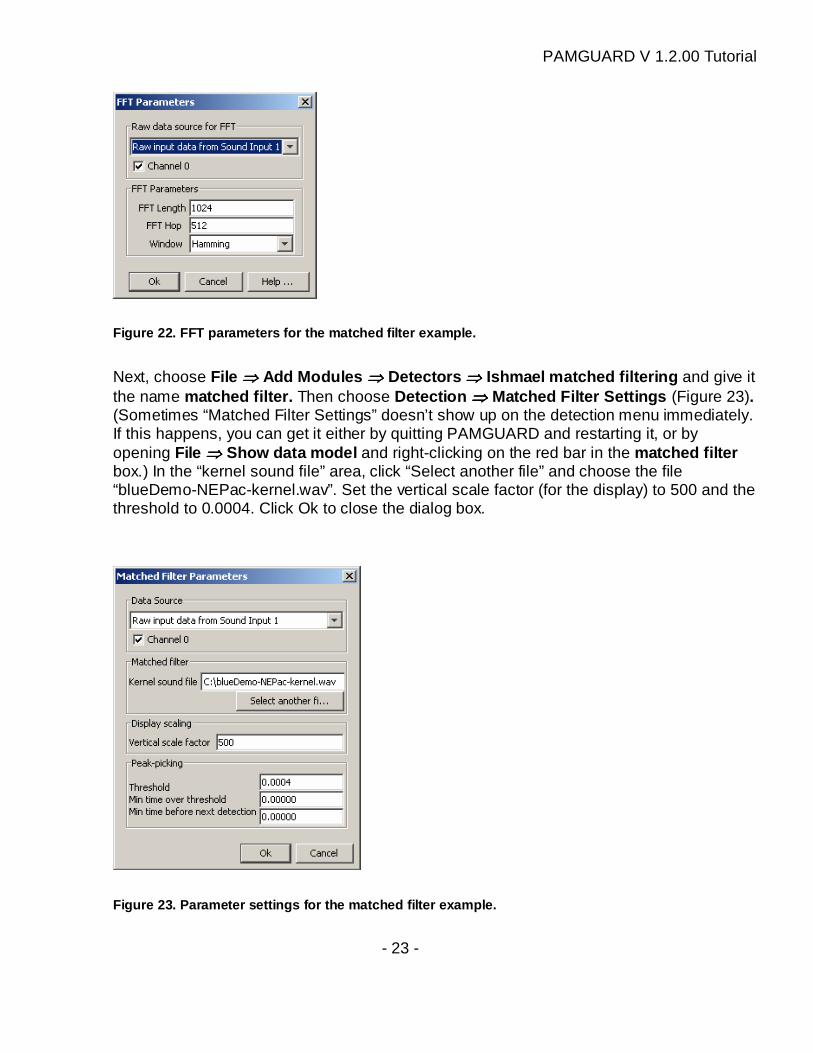
Ex 5.3 Matched filter Detector We are going to detect calls of northeast Pacific blue whales by using a matched filter detector. First load the sound file “blue whale-NE Pacific.wav”. On the menu, choose Detection ⇒⇒⇒⇒ FFT Parameters (Figure 22) and set the FFT length to 1024 (samples) and the FFT Hop to 512 (samples), and the window type to Hamming. These parameters don’t affect the matched filter, which operates on the time-domain sound signal, but they do make the spectrogram show the blue whale calls well. Click Ok to close the dialog box.
PAMGUARD V 1.2.00 Tutorial
- 23 -
Figure 22. FFT parameters for the matched filter ex ample.
Next, choose File ⇒⇒⇒⇒ Add Modules ⇒⇒⇒⇒ Detectors ⇒⇒⇒⇒ Ishmael matched filtering and give it the name matched filter. Then choose Detection ⇒⇒⇒⇒ Matched Filter Settings (Figure 23). (Sometimes “Matched Filter Settings” doesn’t show up on the detection menu immediately. If this happens, you can get it either by quitting PAMGUARD and restarting it, or by opening File ⇒⇒⇒⇒ Show data model and right-clicking on the red bar in the matched filter box.) In the “kernel sound file” area, click “Select another file” and choose the file “blueDemo-NEPac-kernel.wav”. Set the vertical scale factor (for the display) to 500 and the threshold to 0.0004. Click Ok to close the dialog box.
Figure 23. Parameter settings for the matched filte r example.
PAMGUARD V 1.2.00 Tutorial
- 24 -
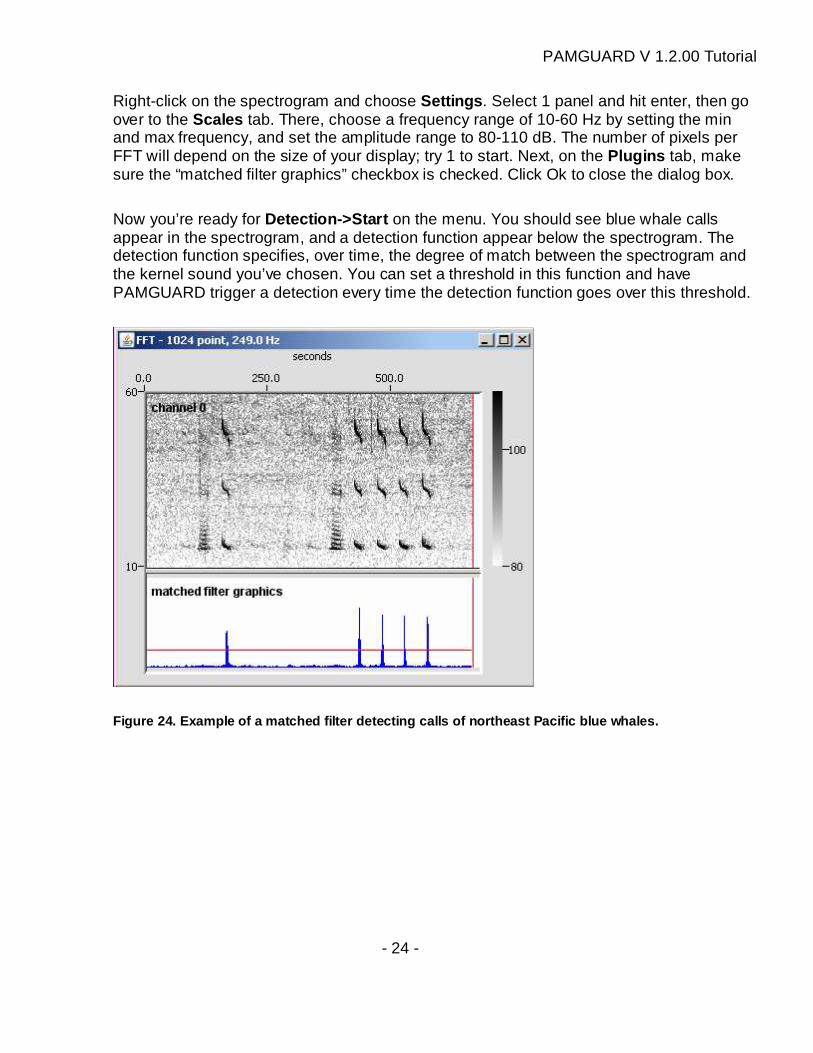
Right-click on the spectrogram and choose Settings . Select 1 panel and hit enter, then go over to the Scales tab. There, choose a frequency range of 10-60 Hz by setting the min and max frequency, and set the amplitude range to 80-110 dB. The number of pixels per FFT will depend on the size of your display; try 1 to start. Next, on the Plugins tab, make sure the “matched filter graphics” checkbox is checked. Click Ok to close the dialog box. Now you’re ready for Detection->Start on the menu. You should see blue whale calls appear in the spectrogram, and a detection function appear below the spectrogram. The detection function specifies, over time, the degree of match between the spectrogram and the kernel sound you’ve chosen. You can set a threshold in this function and have PAMGUARD trigger a detection every time the detection function goes over this threshold.
Figure 24. Example of a matched filter detecting ca lls of northeast Pacific blue whales.
PAMGUARD V 1.2.00 Tutorial
- 25 -
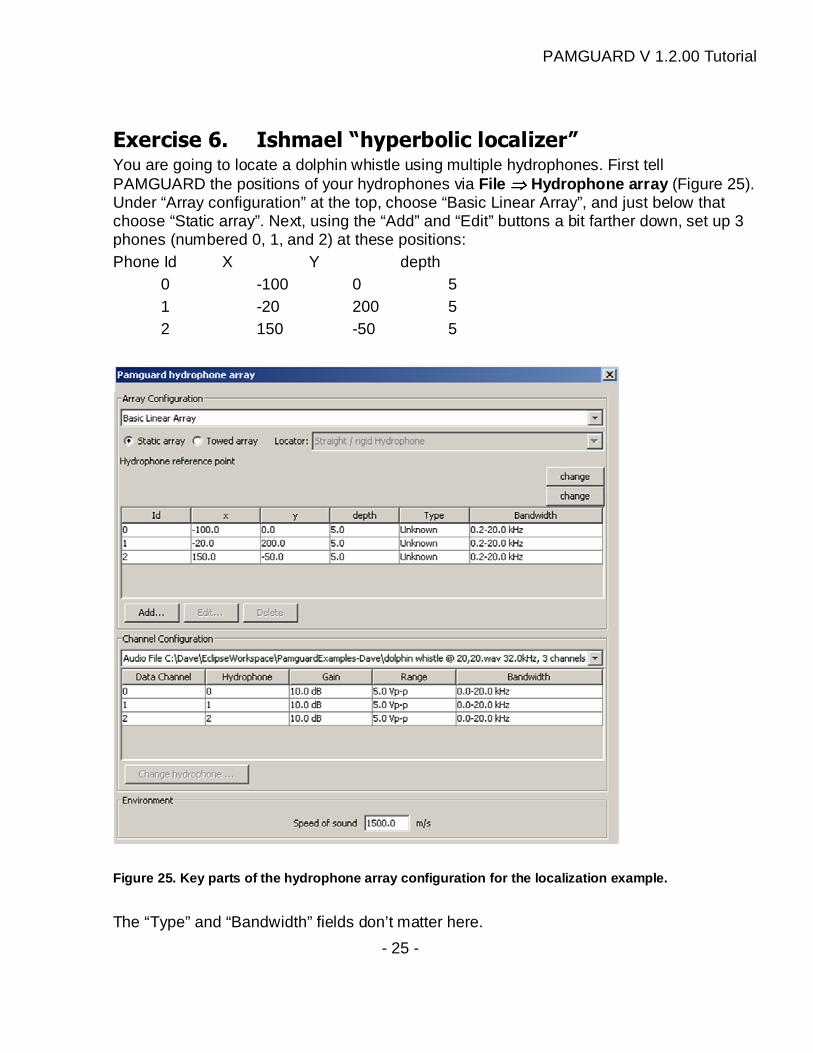
Exercise 6. Ishmael “hyperbolic localizer” You are going to locate a dolphin whistle using multiple hydrophones. First tell PAMGUARD the positions of your hydrophones via File ⇒⇒⇒⇒ Hydrophone array (Figure 25). Under “Array configuration” at the top, choose “Basic Linear Array”, and just below that choose “Static array”. Next, using the “Add” and “Edit” buttons a bit farther down, set up 3 phones (numbered 0, 1, and 2) at these positions: Phone Id X Y depth 0 -100 0 5 1 -20 200 5 2 150 -50 5
Figure 25. Key parts of the hydrophone array config uration for the localization example.
The “Type” and “Bandwidth” fields don’t matter here.
PAMGUARD V 1.2.00 Tutorial
- 26 -
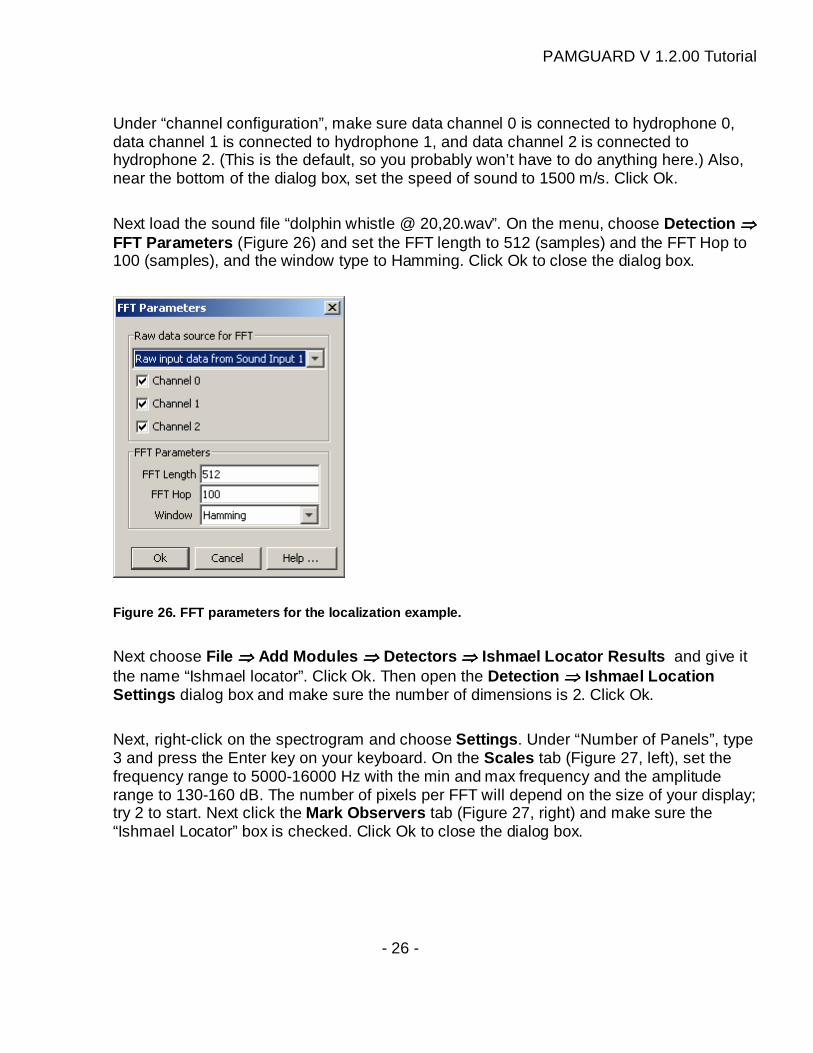
Under “channel configuration”, make sure data channel 0 is connected to hydrophone 0, data channel 1 is connected to hydrophone 1, and data channel 2 is connected to hydrophone 2. (This is the default, so you probably won’t have to do anything here.) Also, near the bottom of the dialog box, set the speed of sound to 1500 m/s. Click Ok. Next load the sound file “dolphin whistle @ 20,20.wav”. On the menu, choose Detection ⇒⇒⇒⇒ FFT Parameters (Figure 26) and set the FFT length to 512 (samples) and the FFT Hop to 100 (samples), and the window type to Hamming. Click Ok to close the dialog box.
Figure 26. FFT parameters for the localization exam ple.
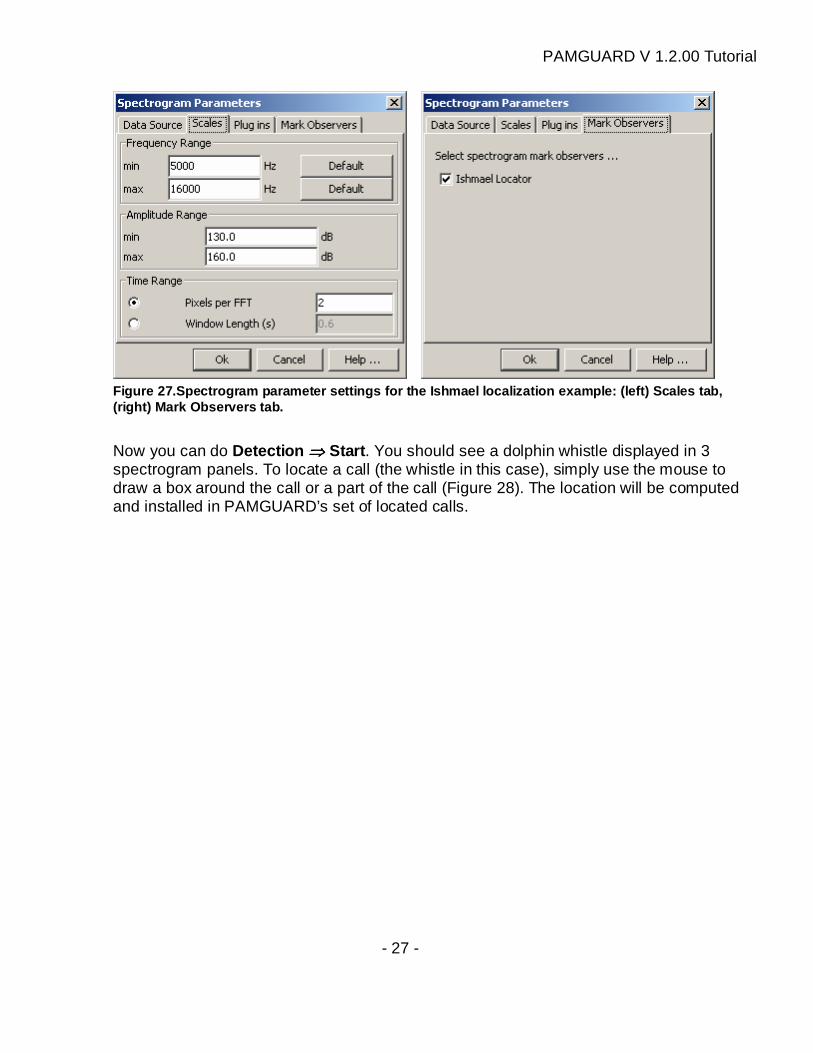
Next choose File ⇒⇒⇒⇒ Add Modules ⇒⇒⇒⇒ Detectors ⇒⇒⇒⇒ Ishmael Locator Results and give it the name “Ishmael locator”. Click Ok. Then open the Detection ⇒⇒⇒⇒ Ishmael Location Settings dialog box and make sure the number of dimensions is 2. Click Ok. Next, right-click on the spectrogram and choose Settings . Under “Number of Panels”, type 3 and press the Enter key on your keyboard. On the Scales tab (Figure 27, left), set the frequency range to 5000-16000 Hz with the min and max frequency and the amplitude range to 130-160 dB. The number of pixels per FFT will depend on the size of your display; try 2 to start. Next click the Mark Observers tab (Figure 27, right) and make sure the “Ishmael Locator” box is checked. Click Ok to close the dialog box.
PAMGUARD V 1.2.00 Tutorial
- 27 -
Figure 27.Spectrogram parameter settings for the Is hmael localization example: (left) Scales tab, (right) Mark Observers tab.
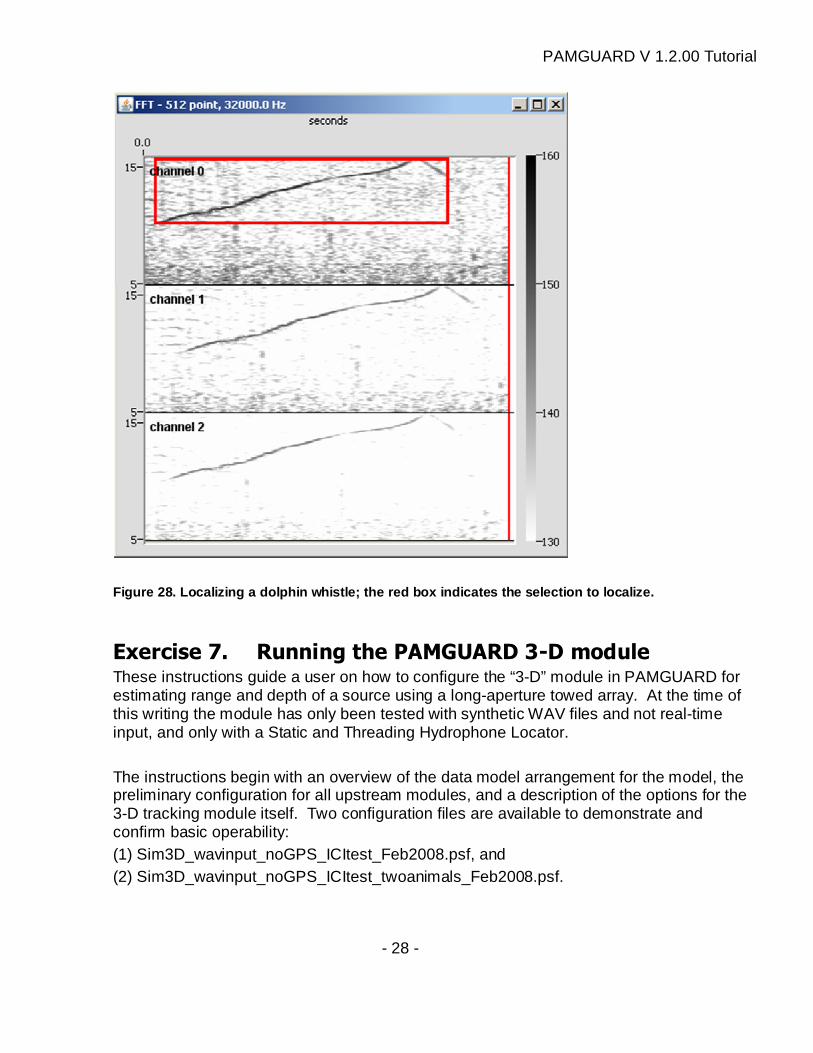
Now you can do Detection ⇒⇒⇒⇒ Start . You should see a dolphin whistle displayed in 3 spectrogram panels. To locate a call (the whistle in this case), simply use the mouse to draw a box around the call or a part of the call (Figure 28). The location will be computed and installed in PAMGUARD’s set of located calls.
PAMGUARD V 1.2.00 Tutorial
- 28 -
Figure 28. Localizing a dolphin whistle; the red bo x indicates the selection to localize.
Exercise 7. Running the PAMGUARD 3-D module These instructions guide a user on how to configure the “3-D” module in PAMGUARD for estimating range and depth of a source using a long-aperture towed array. At the time of this writing the module has only been tested with synthetic WAV files and not real-time input, and only with a Static and Threading Hydrophone Locator. The instructions begin with an overview of the data model arrangement for the model, the preliminary configuration for all upstream modules, and a description of the options for the 3-D tracking module itself. Two configuration files are available to demonstrate and confirm basic operability: (1) Sim3D_wavinput_noGPS_ICItest_Feb2008.psf, and (2) Sim3D_wavinput_noGPS_ICItest_twoanimals_Feb2008.psf.
PAMGUARD V 1.2.00 Tutorial
- 29 -
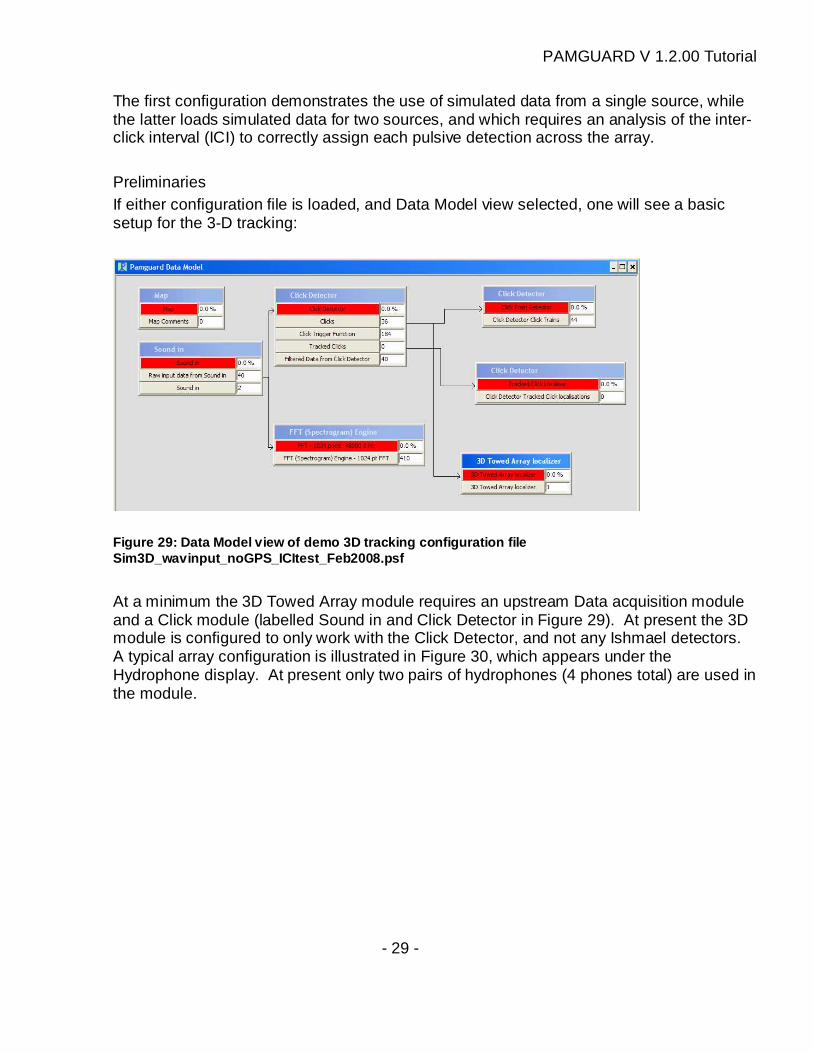
The first configuration demonstrates the use of simulated data from a single source, while the latter loads simulated data for two sources, and which requires an analysis of the inter-click interval (ICI) to correctly assign each pulsive detection across the array. Preliminaries If either configuration file is loaded, and Data Model view selected, one will see a basic setup for the 3-D tracking:
Figure 29: Data Model view of demo 3D tracking conf iguration file Sim3D_wavinput_noGPS_ICItest_Feb2008.psf
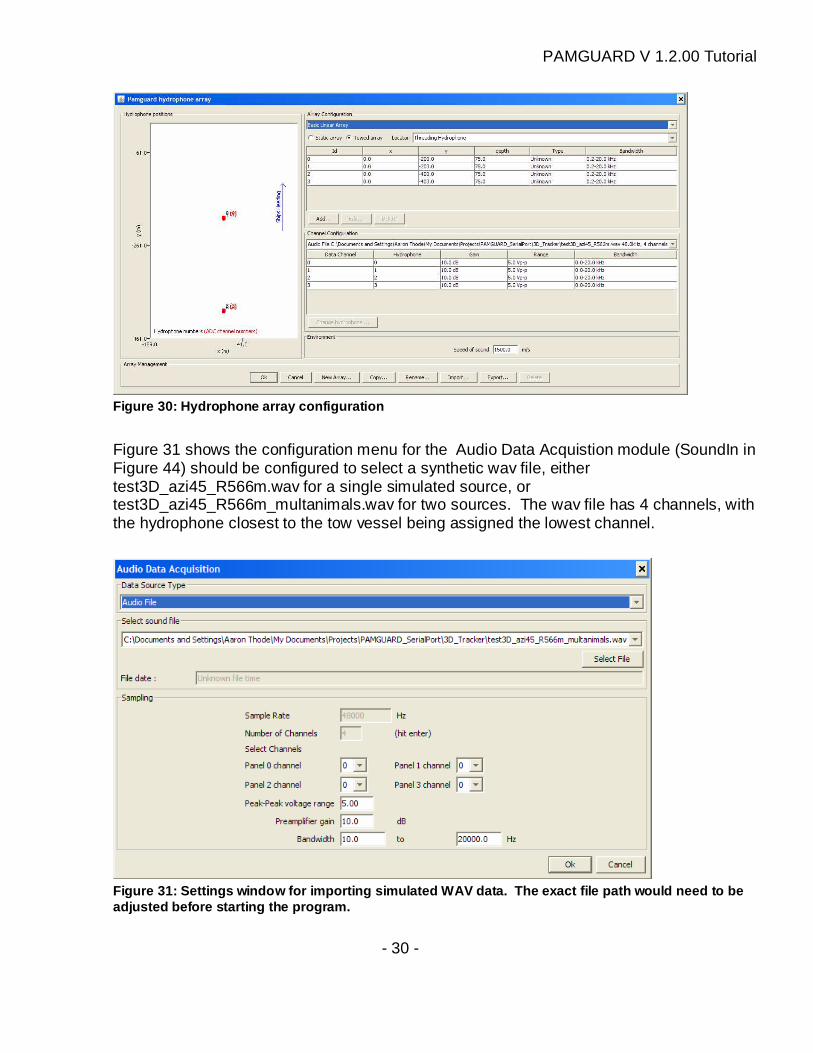
At a minimum the 3D Towed Array module requires an upstream Data acquisition module and a Click module (labelled Sound in and Click Detector in Figure 29). At present the 3D module is configured to only work with the Click Detector, and not any Ishmael detectors. A typical array configuration is illustrated in Figure 30, which appears under the Hydrophone display. At present only two pairs of hydrophones (4 phones total) are used in the module.
PAMGUARD V 1.2.00 Tutorial
- 30 -
Figure 30: Hydrophone array configuration
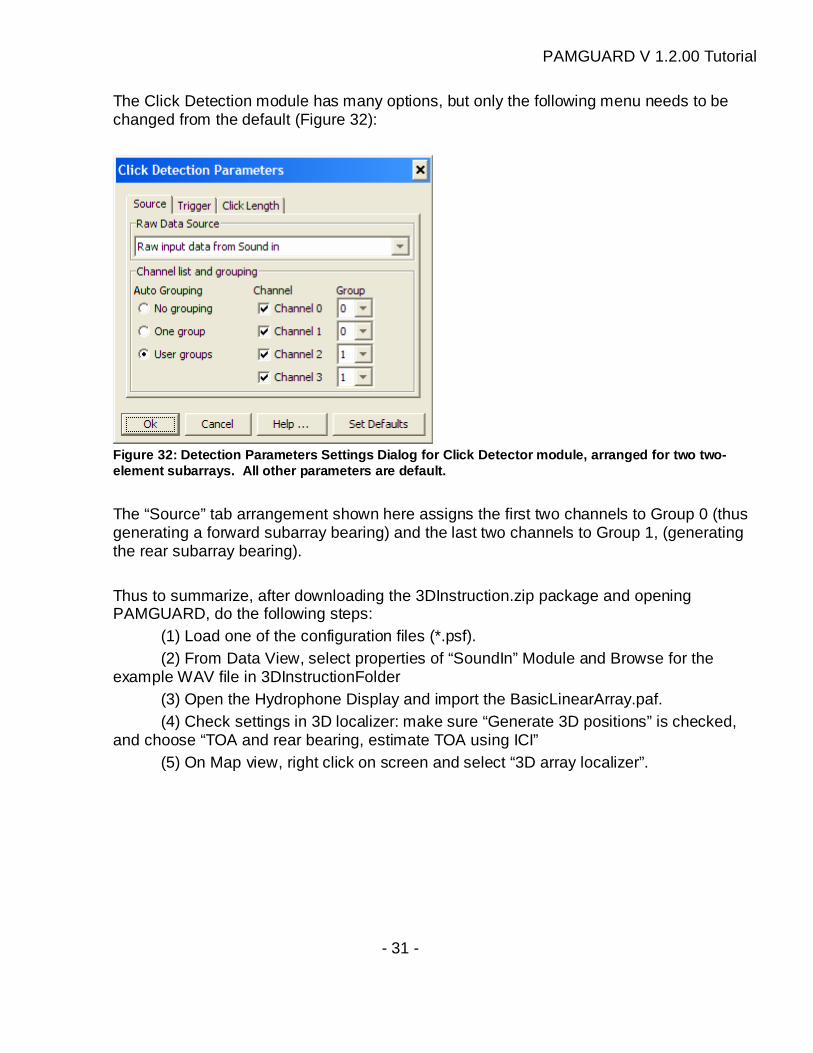
Figure 31 shows the configuration menu for the Audio Data Acquistion module (SoundIn in Figure 44) should be configured to select a synthetic wav file, either test3D_azi45_R566m.wav for a single simulated source, or test3D_azi45_R566m_multanimals.wav for two sources. The wav file has 4 channels, with the hydrophone closest to the tow vessel being assigned the lowest channel.
Figure 31: Settings window for importing simulated WAV data. The exact file path would need to be adjusted before starting the program.
PAMGUARD V 1.2.00 Tutorial
- 31 -
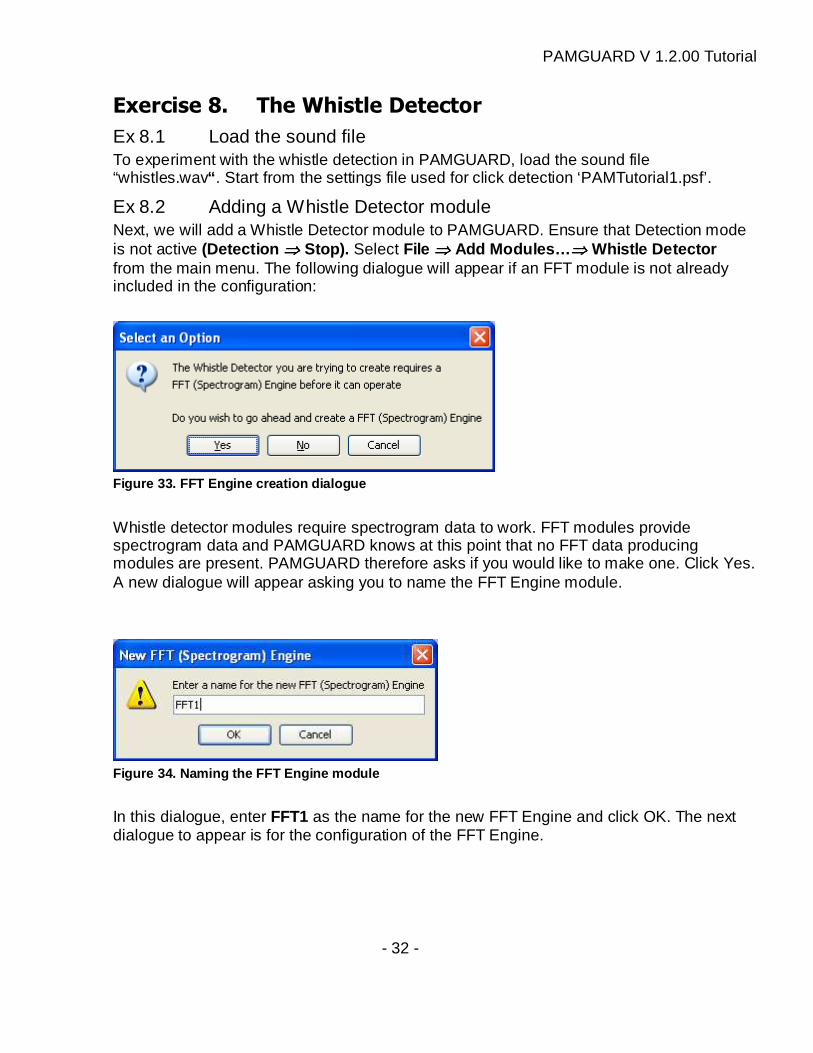
The Click Detection module has many options, but only the following menu needs to be changed from the default (Figure 32):
Figure 32: Detection Parameters Settings Dialog for Click Detector module, arranged for two two-element subarrays. All other parameters are defaul t.
The “Source” tab arrangement shown here assigns the first two channels to Group 0 (thus generating a forward subarray bearing) and the last two channels to Group 1, (generating the rear subarray bearing). Thus to summarize, after downloading the 3DInstruction.zip package and opening PAMGUARD, do the following steps: (1) Load one of the configuration files (*.psf). (2) From Data View, select properties of “SoundIn” Module and Browse for the example WAV file in 3DInstructionFolder (3) Open the Hydrophone Display and import the BasicLinearArray.paf. (4) Check settings in 3D localizer: make sure “Generate 3D positions” is checked, and choose “TOA and rear bearing, estimate TOA using ICI” (5) On Map view, right click on screen and select “3D array localizer”.
PAMGUARD V 1.2.00 Tutorial
- 32 -
Exercise 8. The Whistle Detector
Ex 8.1 Load the sound file To experiment with the whistle detection in PAMGUARD, load the sound file “whistles.wav“ . Start from the settings file used for click detection ‘PAMTutorial1.psf’.
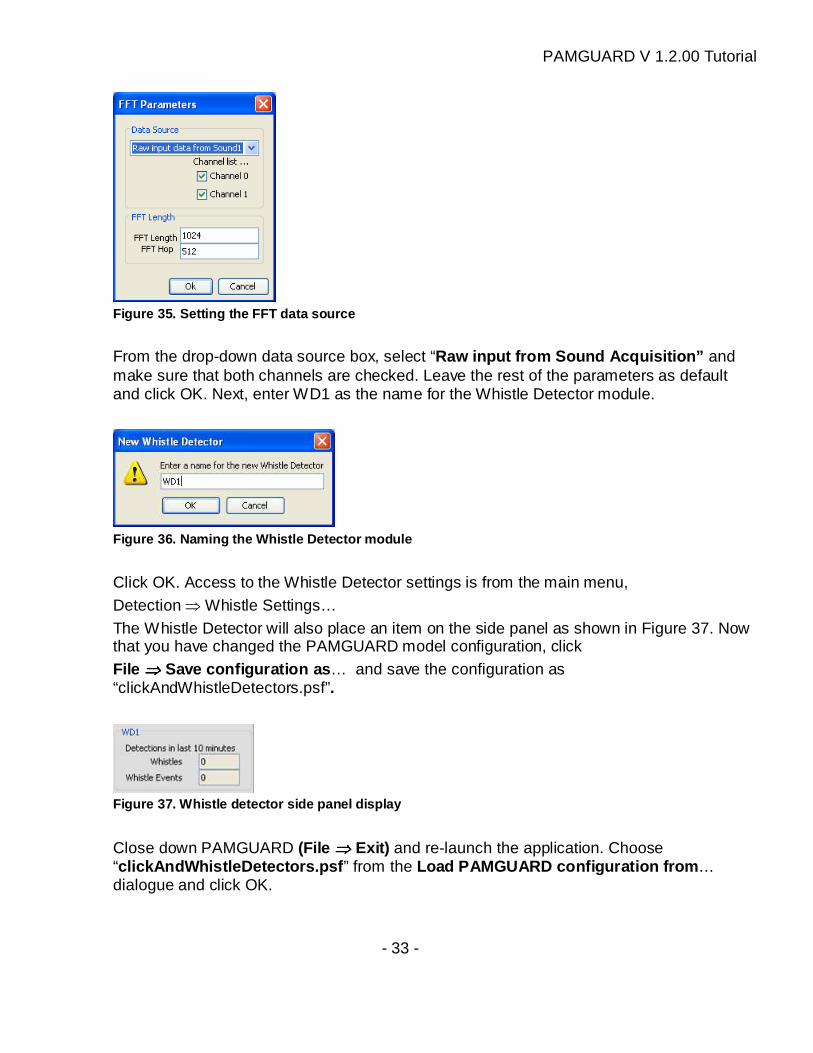
Ex 8.2 Adding a Whistle Detector module Next, we will add a Whistle Detector module to PAMGUARD. Ensure that Detection mode is not active (Detection ⇒⇒⇒⇒ Stop ). Select File ⇒⇒⇒⇒ Add Modules… ⇒⇒⇒⇒ Whistle Detector from the main menu. The following dialogue will appear if an FFT module is not already included in the configuration:
Figure 33. FFT Engine creation dialogue
Whistle detector modules require spectrogram data to work. FFT modules provide spectrogram data and PAMGUARD knows at this point that no FFT data producing modules are present. PAMGUARD therefore asks if you would like to make one. Click Yes. A new dialogue will appear asking you to name the FFT Engine module.
Figure 34. Naming the FFT Engine module
In this dialogue, enter FFT1 as the name for the new FFT Engine and click OK. The next dialogue to appear is for the configuration of the FFT Engine.
PAMGUARD V 1.2.00 Tutorial
- 33 -
Figure 35. Setting the FFT data source
From the drop-down data source box, select “Raw input from Sound Acquisition” and make sure that both channels are checked. Leave the rest of the parameters as default and click OK. Next, enter WD1 as the name for the Whistle Detector module.
Figure 36. Naming the Whistle Detector module
Click OK. Access to the Whistle Detector settings is from the main menu, Detection ⇒ Whistle Settings… The Whistle Detector will also place an item on the side panel as shown in Figure 37. Now that you have changed the PAMGUARD model configuration, click File ⇒⇒⇒⇒ Save configuration as … and save the configuration as “clickAndWhistleDetectors.psf”.
Figure 37. Whistle detector side panel display
Close down PAMGUARD (File ⇒⇒⇒⇒ Exit ) and re-launch the application. Choose “clickAndWhistleDetectors.psf ” from the Load PAMGUARD configuration from … dialogue and click OK.
PAMGUARD V 1.2.00 Tutorial
- 34 -
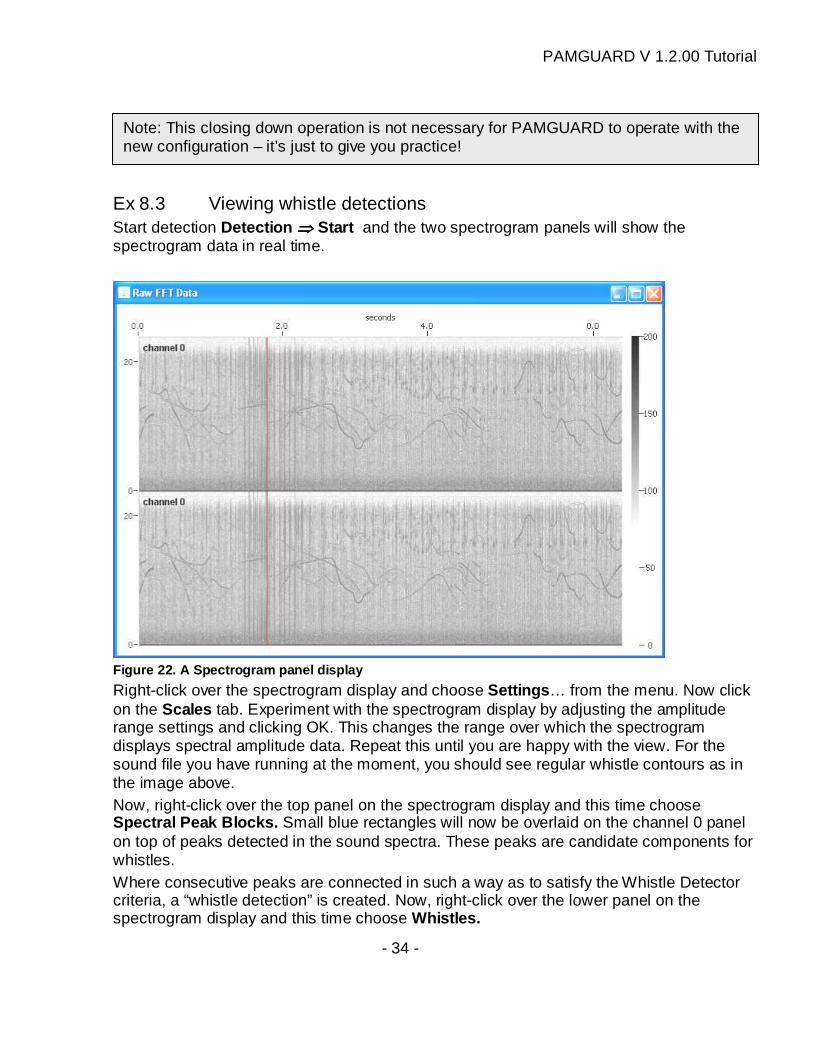
Ex 8.3 Viewing whistle detections Start detection Detection ⇒⇒⇒⇒ Start and the two spectrogram panels will show the spectrogram data in real time.
Figure 22. A Spectrogram panel display
Right-click over the spectrogram display and choose Settings … from the menu. Now click on the Scales tab. Experiment with the spectrogram display by adjusting the amplitude range settings and clicking OK. This changes the range over which the spectrogram displays spectral amplitude data. Repeat this until you are happy with the view. For the sound file you have running at the moment, you should see regular whistle contours as in the image above. Now, right-click over the top panel on the spectrogram display and this time choose Spectral Peak Blocks . Small blue rectangles will now be overlaid on the channel 0 panel on top of peaks detected in the sound spectra. These peaks are candidate components for whistles. Where consecutive peaks are connected in such a way as to satisfy the Whistle Detector criteria, a “whistle detection” is created. Now, right-click over the lower panel on the spectrogram display and this time choose Whistles .
Note: This closing down operation is not necessary for PAMGUARD to operate with the new configuration – it’s just to give you practice!
PAMGUARD V 1.2.00 Tutorial
- 35 -
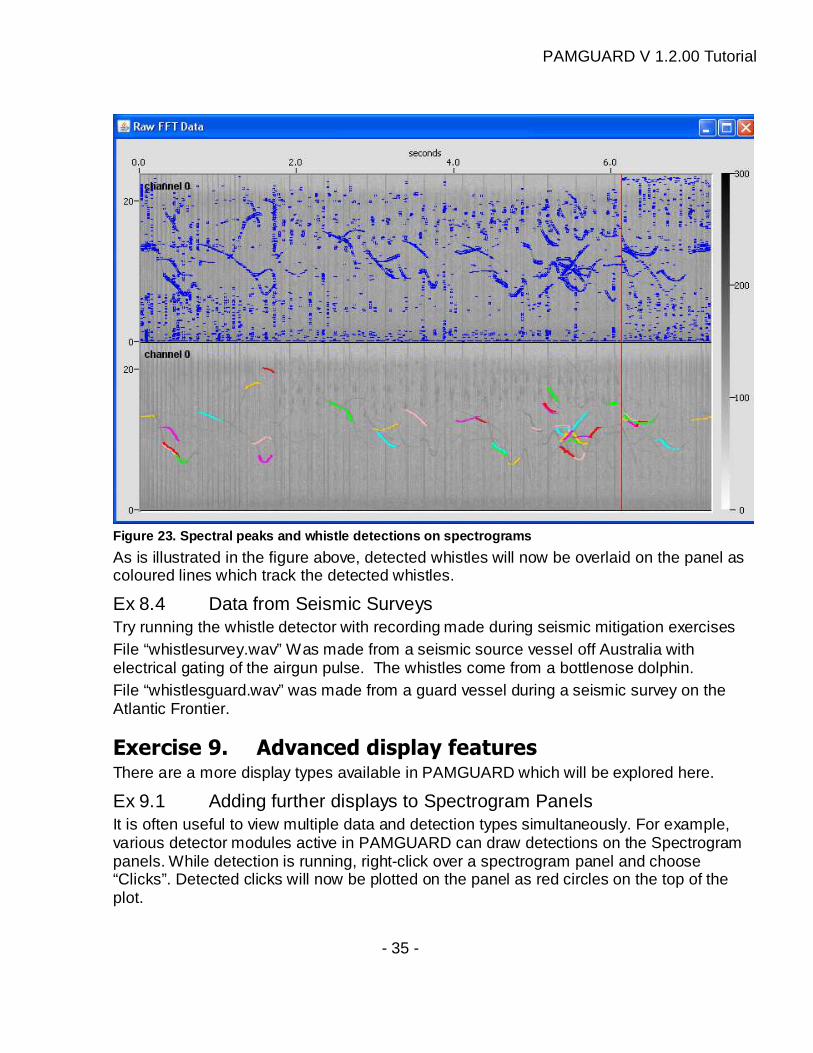
Figure 23. Spectral peaks and whistle detections on spectrograms
As is illustrated in the figure above, detected whistles will now be overlaid on the panel as coloured lines which track the detected whistles.
Ex 8.4 Data from Seismic Surveys Try running the whistle detector with recording made during seismic mitigation exercises File “whistlesurvey.wav” Was made from a seismic source vessel off Australia with electrical gating of the airgun pulse. The whistles come from a bottlenose dolphin. File “whistlesguard.wav” was made from a guard vessel during a seismic survey on the Atlantic Frontier.
Exercise 9. Advanced display features There are a more display types available in PAMGUARD which will be explored here.
Ex 9.1 Adding further displays to Spectrogram Panels It is often useful to view multiple data and detection types simultaneously. For example, various detector modules active in PAMGUARD can draw detections on the Spectrogram panels. While detection is running, right-click over a spectrogram panel and choose “Clicks”. Detected clicks will now be plotted on the panel as red circles on the top of the plot.
PAMGUARD V 1.2.00 Tutorial
- 36 -
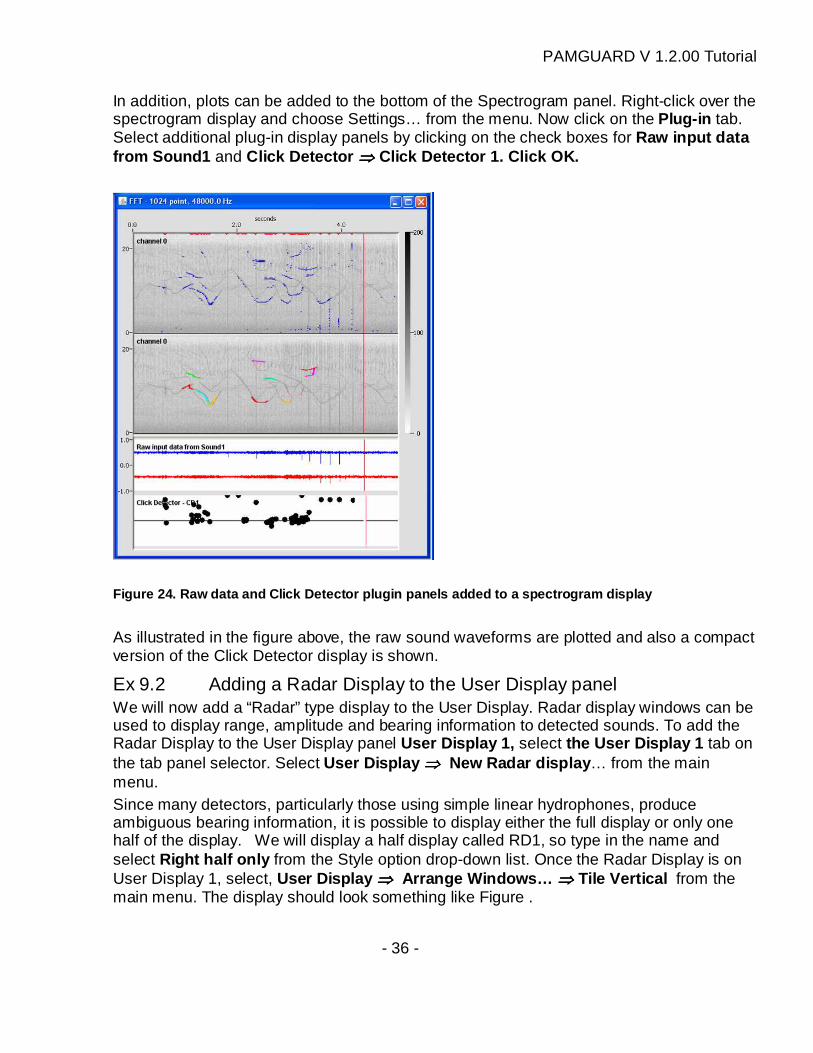
In addition, plots can be added to the bottom of the Spectrogram panel. Right-click over the spectrogram display and choose Settings… from the menu. Now click on the Plug-in tab. Select additional plug-in display panels by clicking on the check boxes for Raw input data from Sound1 and Click Detector ⇒⇒⇒⇒ Click Detector 1 . Click OK.
Figure 24. Raw data and Click Detector plugin panel s added to a spectrogram display
As illustrated in the figure above, the raw sound waveforms are plotted and also a compact version of the Click Detector display is shown.
Ex 9.2 Adding a Radar Display to the User Display panel We will now add a “Radar” type display to the User Display. Radar display windows can be used to display range, amplitude and bearing information to detected sounds. To add the Radar Display to the User Display panel User Display 1 , select the User Display 1 tab on the tab panel selector. Select User Display ⇒⇒⇒⇒ New Radar display … from the main menu. Since many detectors, particularly those using simple linear hydrophones, produce ambiguous bearing information, it is possible to display either the full display or only one half of the display. We will display a half display called RD1, so type in the name and select Right half only from the Style option drop-down list. Once the Radar Display is on User Display 1, select, User Display ⇒⇒⇒⇒ Arrange Windows… ⇒⇒⇒⇒ Tile Vertical from the main menu. The display should look something like Figure .
PAMGUARD V 1.2.00 Tutorial
- 37 -
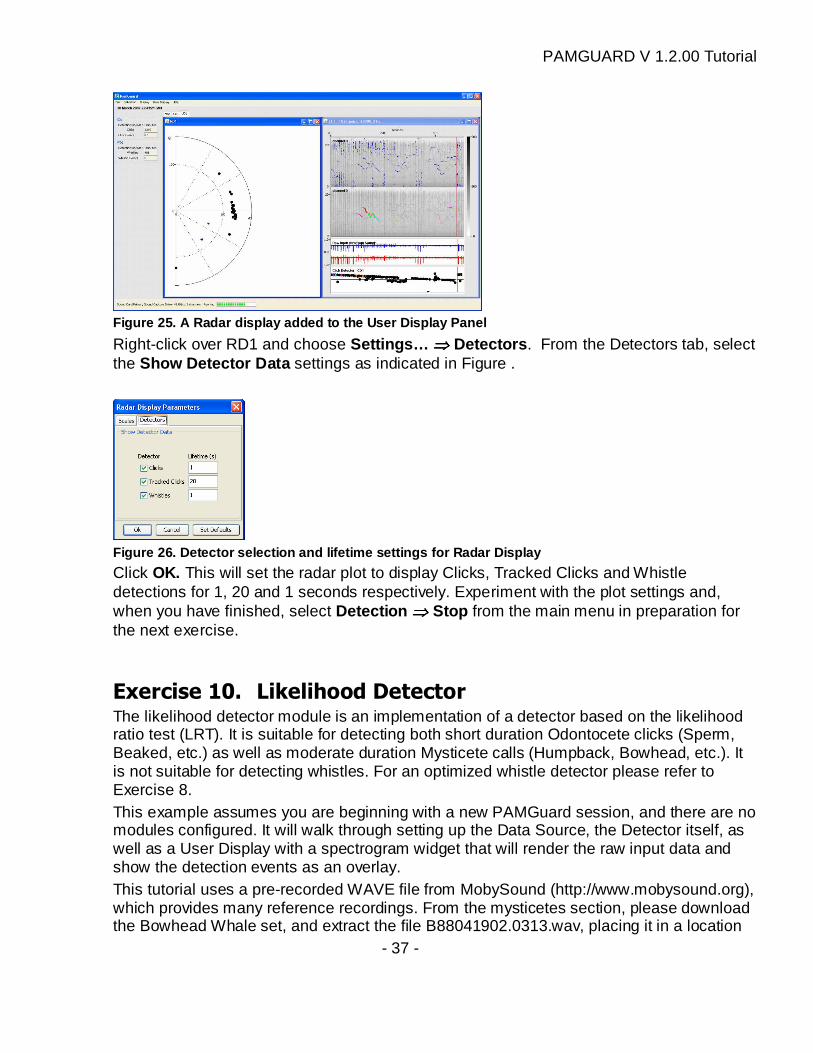
Figure 25. A Radar display added to the User Displa y Panel
Right-click over RD1 and choose Settings… ⇒⇒⇒⇒ Detectors . From the Detectors tab, select the Show Detector Data settings as indicated in Figure .
Figure 26. Detector selection and lifetime settings for Radar Display
Click OK. This will set the radar plot to display Clicks, Tracked Clicks and Whistle detections for 1, 20 and 1 seconds respectively. Experiment with the plot settings and, when you have finished, select Detection ⇒⇒⇒⇒ Stop from the main menu in preparation for the next exercise.
Exercise 10. Likelihood Detector The likelihood detector module is an implementation of a detector based on the likelihood ratio test (LRT). It is suitable for detecting both short duration Odontocete clicks (Sperm, Beaked, etc.) as well as moderate duration Mysticete calls (Humpback, Bowhead, etc.). It is not suitable for detecting whistles. For an optimized whistle detector please refer to Exercise 8. This example assumes you are beginning with a new PAMGuard session, and there are no modules configured. It will walk through setting up the Data Source, the Detector itself, as well as a User Display with a spectrogram widget that will render the raw input data and show the detection events as an overlay. This tutorial uses a pre-recorded WAVE file from MobySound (http://www.mobysound.org), which provides many reference recordings. From the mysticetes section, please download the Bowhead Whale set, and extract the file B88041902.0313.wav, placing it in a location
PAMGUARD V 1.2.00 Tutorial
- 38 -
you can easily find later, such as the Desktop. Once you have the file saved you are ready to proceed with the following steps.
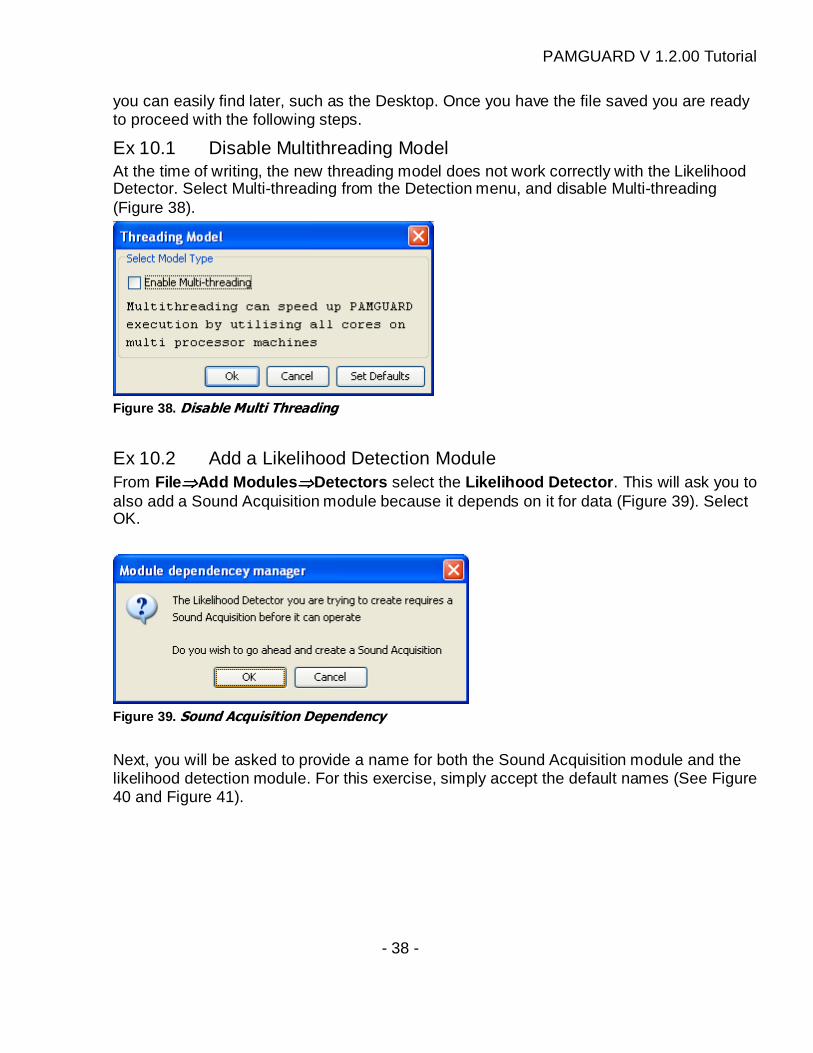
Ex 10.1 Disable Multithreading Model At the time of writing, the new threading model does not work correctly with the Likelihood Detector. Select Multi-threading from the Detection menu, and disable Multi-threading (Figure 38).
Figure 38. Disable Multi Threading
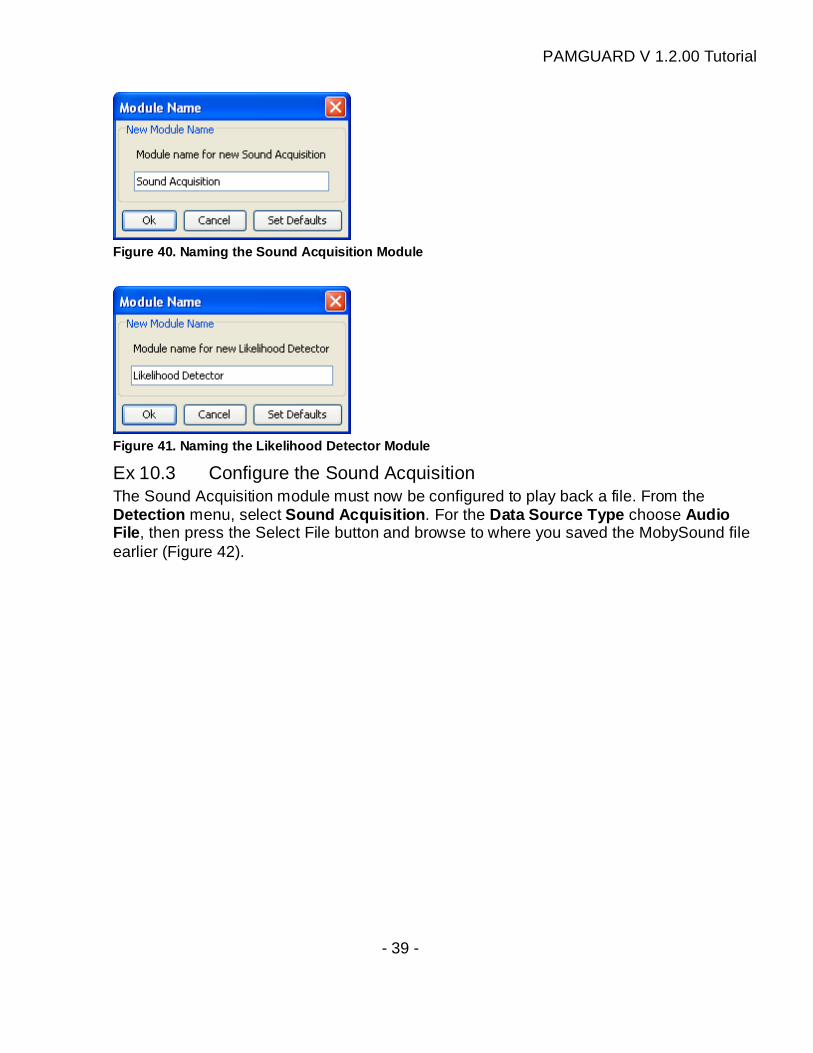
Ex 10.2 Add a Likelihood Detection Module From File⇒⇒⇒⇒Add Modules ⇒⇒⇒⇒Detectors select the Likelihood Detector . This will ask you to also add a Sound Acquisition module because it depends on it for data (Figure 39). Select OK.
Figure 39. Sound Acquisition Dependency
Next, you will be asked to provide a name for both the Sound Acquisition module and the likelihood detection module. For this exercise, simply accept the default names (See Figure 40 and Figure 41).
PAMGUARD V 1.2.00 Tutorial
- 39 -
Figure 40. Naming the Sound Acquisition Module
Figure 41. Naming the Likelihood Detector Module
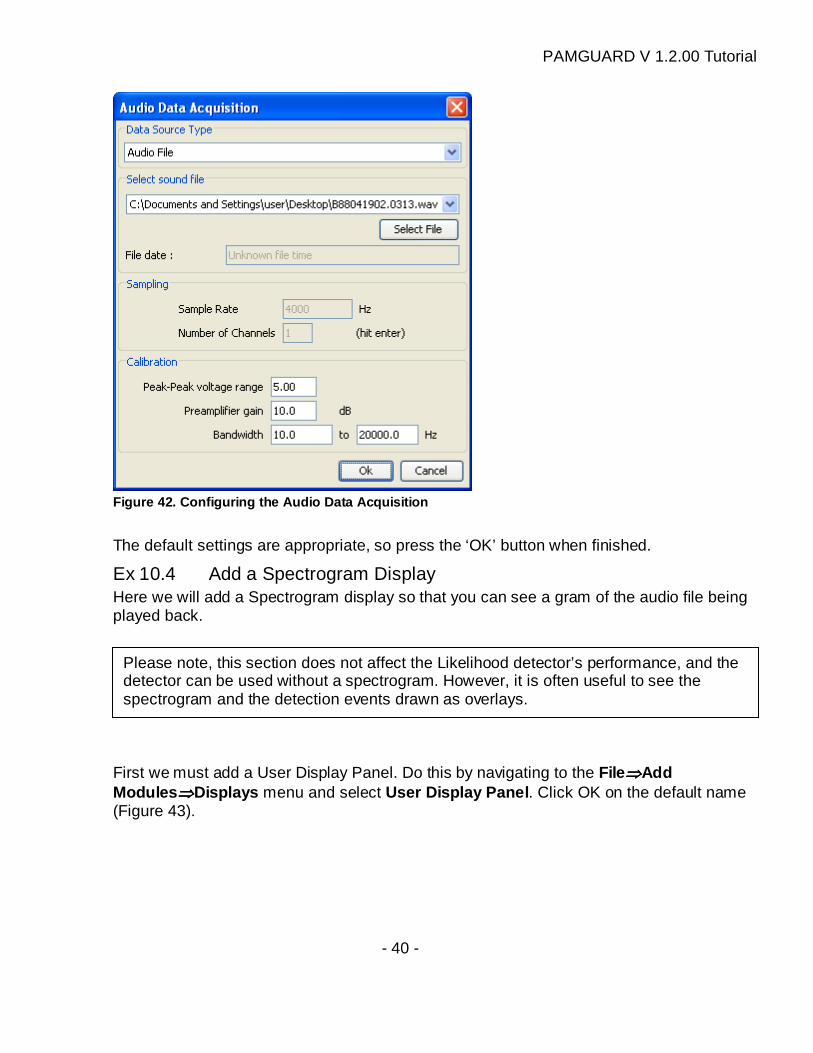
Ex 10.3 Configure the Sound Acquisition The Sound Acquisition module must now be configured to play back a file. From the Detection menu, select Sound Acquisition . For the Data Source Type choose Audio File , then press the Select File button and browse to where you saved the MobySound file earlier (Figure 42).
PAMGUARD V 1.2.00 Tutorial
- 40 -
Figure 42. Configuring the Audio Data Acquisition
The default settings are appropriate, so press the ‘OK’ button when finished.
Ex 10.4 Add a Spectrogram Display Here we will add a Spectrogram display so that you can see a gram of the audio file being played back.
First we must add a User Display Panel. Do this by navigating to the File⇒⇒⇒⇒Add Modules ⇒⇒⇒⇒Displays menu and select User Display Panel . Click OK on the default name (Figure 43).
Please note, this section does not affect the Likelihood detector’s performance, and the detector can be used without a spectrogram. However, it is often useful to see the spectrogram and the detection events drawn as overlays.
PAMGUARD V 1.2.00 Tutorial
- 41 -
Figure 43. Naming the User Display panel
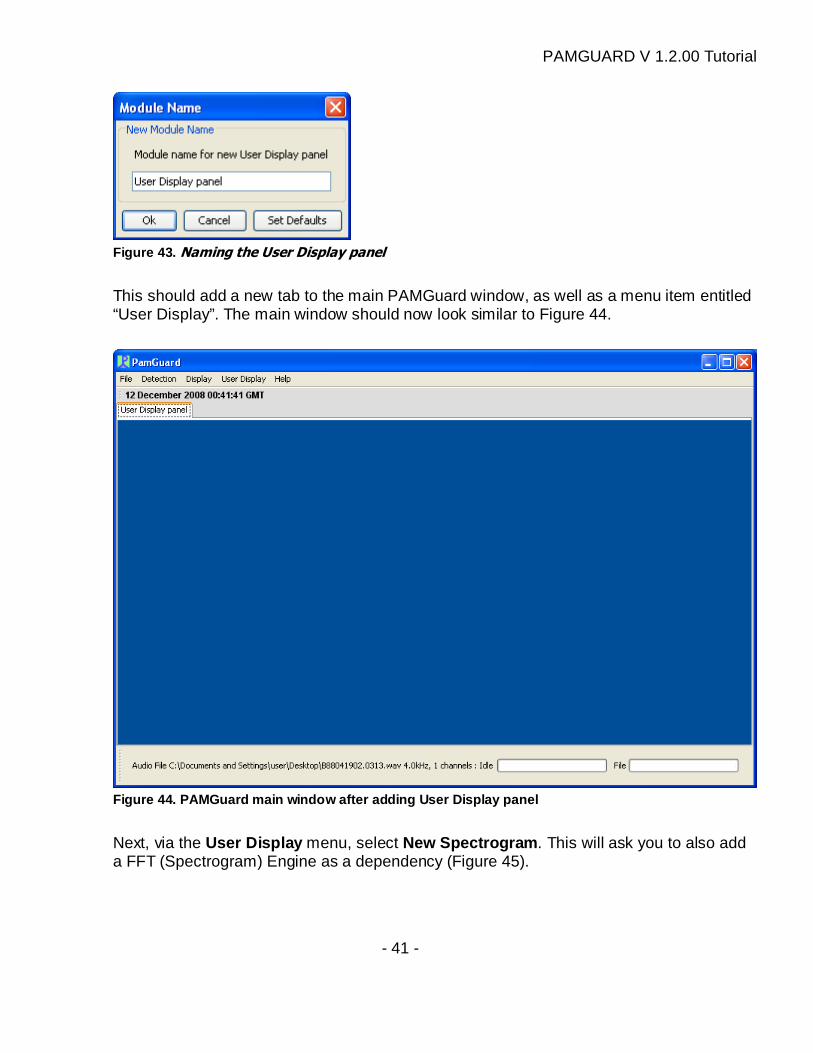
This should add a new tab to the main PAMGuard window, as well as a menu item entitled “User Display”. The main window should now look similar to Figure 44.
Figure 44. PAMGuard main window after adding User D isplay panel
Next, via the User Display menu, select New Spectrogram . This will ask you to also add a FFT (Spectrogram) Engine as a dependency (Figure 45).
PAMGUARD V 1.2.00 Tutorial
- 42 -
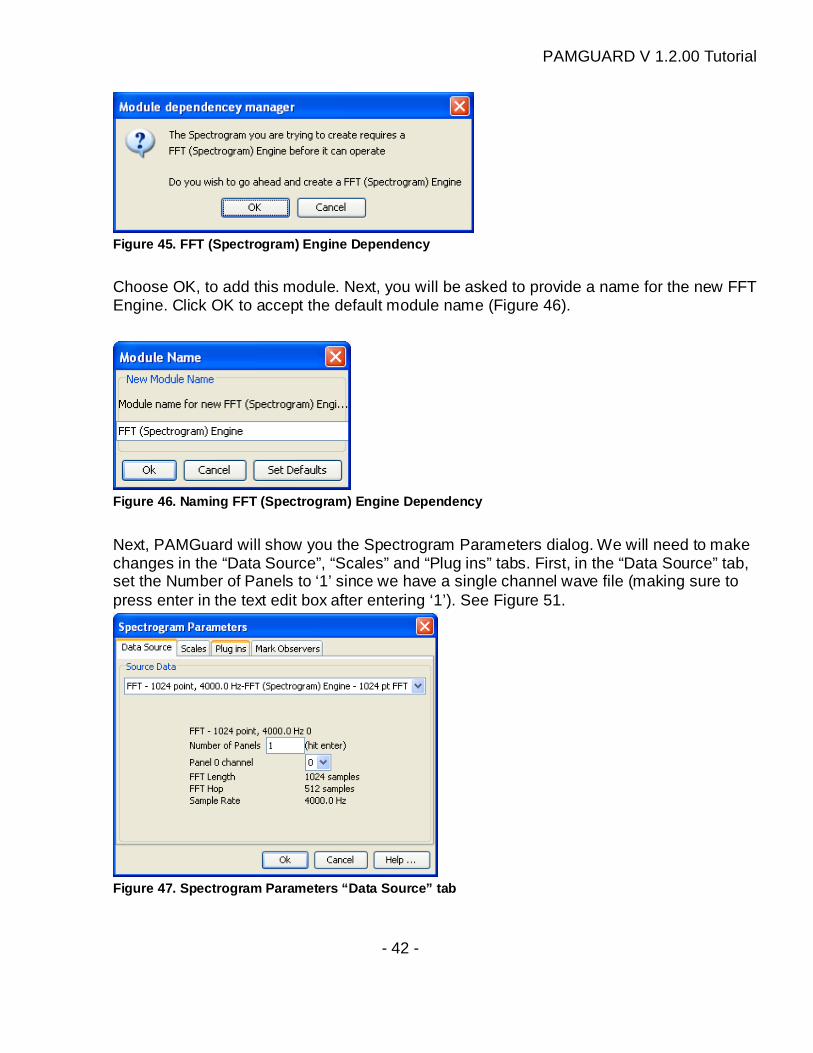
Figure 45. FFT (Spectrogram) Engine Dependency
Choose OK, to add this module. Next, you will be asked to provide a name for the new FFT Engine. Click OK to accept the default module name (Figure 46).
Figure 46. Naming FFT (Spectrogram) Engine Dependen cy
Next, PAMGuard will show you the Spectrogram Parameters dialog. We will need to make changes in the “Data Source”, “Scales” and “Plug ins” tabs. First, in the “Data Source” tab, set the Number of Panels to ‘1’ since we have a single channel wave file (making sure to press enter in the text edit box after entering ‘1’). See Figure 51.
Figure 47. Spectrogram Parameters “Data Source” tab
PAMGUARD V 1.2.00 Tutorial
- 43 -
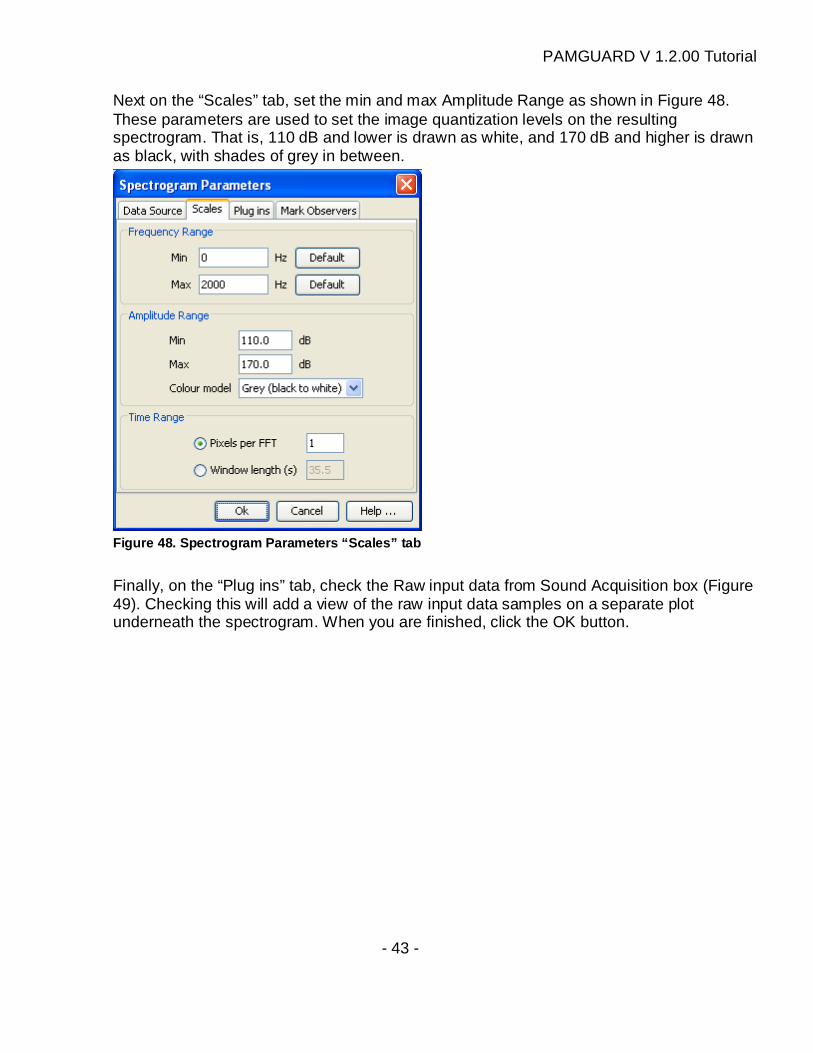
Next on the “Scales” tab, set the min and max Amplitude Range as shown in Figure 48. These parameters are used to set the image quantization levels on the resulting spectrogram. That is, 110 dB and lower is drawn as white, and 170 dB and higher is drawn as black, with shades of grey in between.
Figure 48. Spectrogram Parameters “Scales” tab
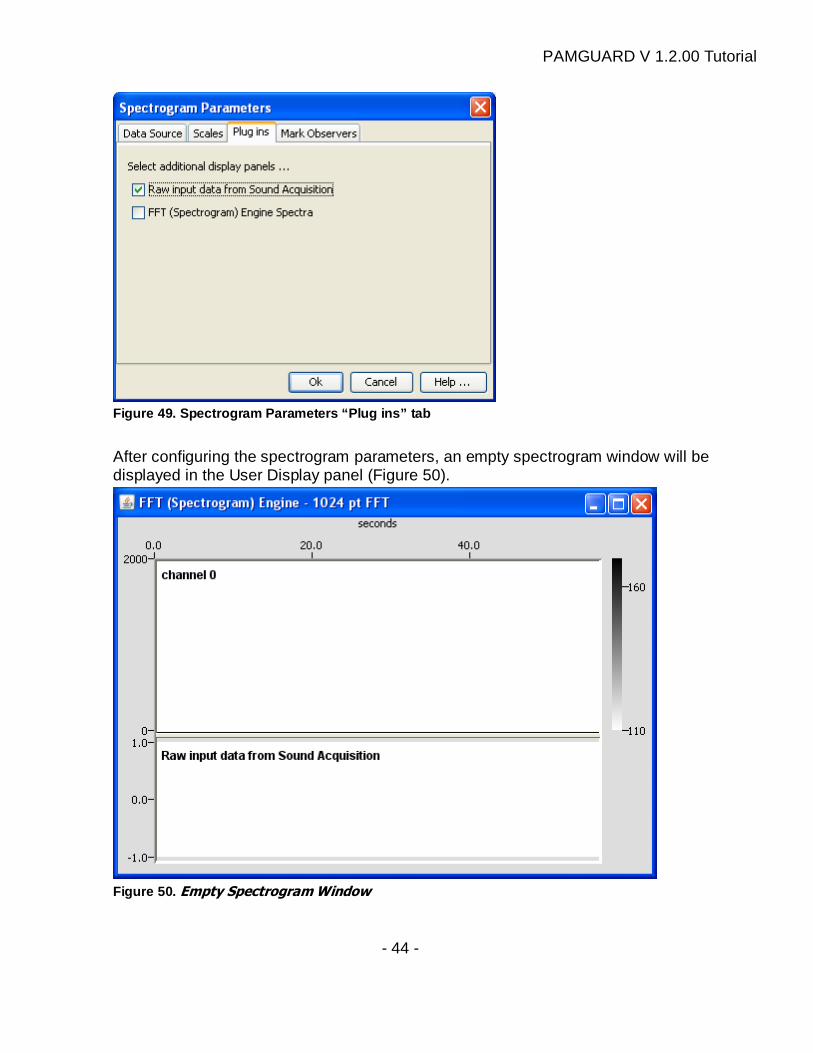
Finally, on the “Plug ins” tab, check the Raw input data from Sound Acquisition box (Figure 49). Checking this will add a view of the raw input data samples on a separate plot underneath the spectrogram. When you are finished, click the OK button.
PAMGUARD V 1.2.00 Tutorial
- 44 -
Figure 49. Spectrogram Parameters “Plug ins” tab
After configuring the spectrogram parameters, an empty spectrogram window will be displayed in the User Display panel (Figure 50).
Figure 50. Empty Spectrogram Window
PAMGUARD V 1.2.00 Tutorial
- 45 -
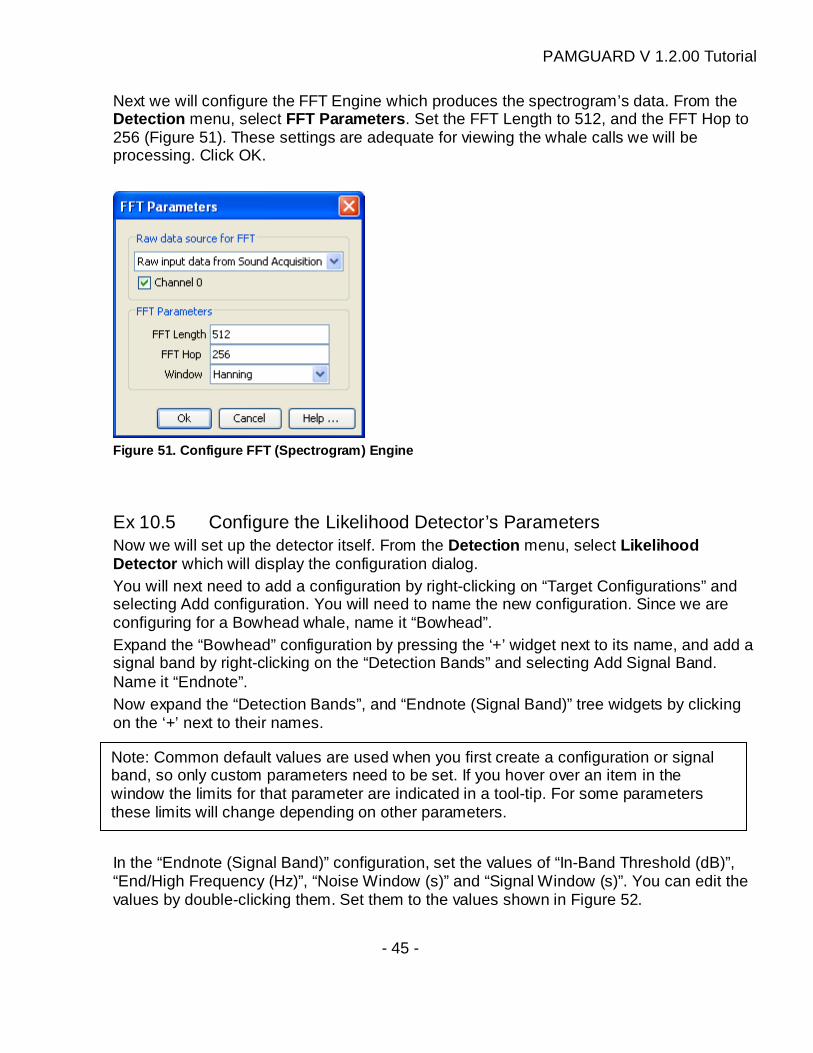
Next we will configure the FFT Engine which produces the spectrogram’s data. From the Detection menu, select FFT Parameters . Set the FFT Length to 512, and the FFT Hop to 256 (Figure 51). These settings are adequate for viewing the whale calls we will be processing. Click OK.
Figure 51. Configure FFT (Spectrogram) Engine
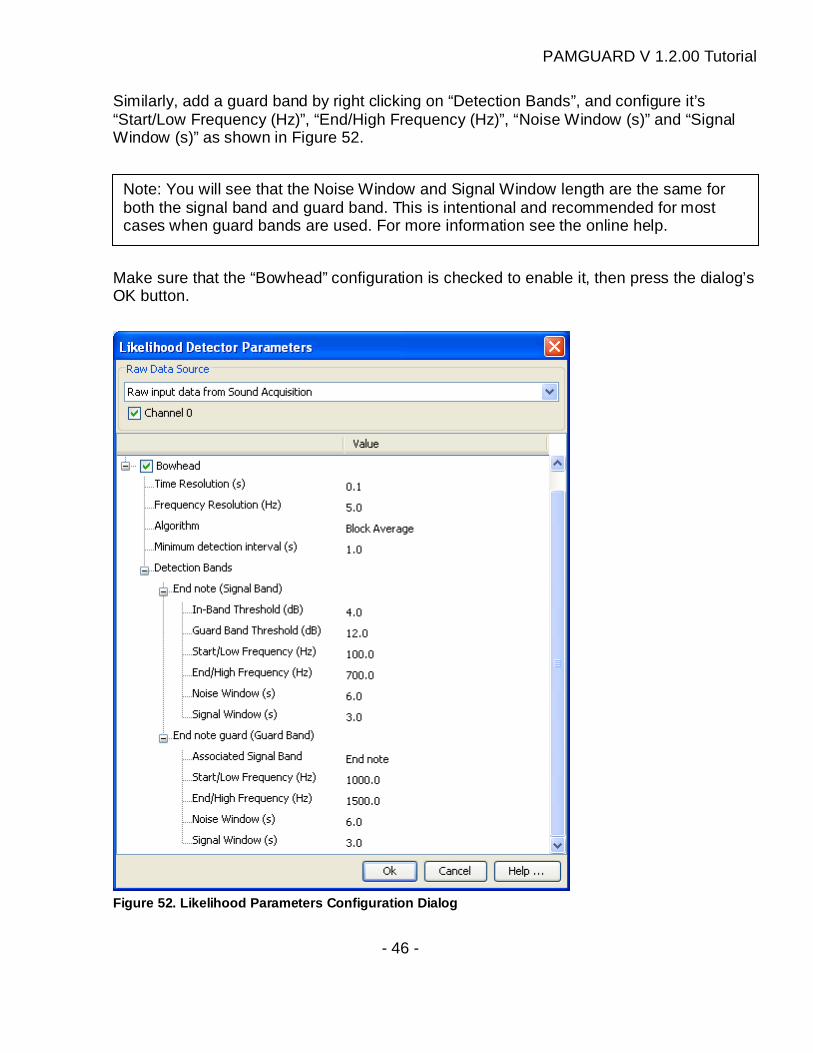
Ex 10.5 Configure the Likelihood Detector’s Parameters Now we will set up the detector itself. From the Detection menu, select Likelihood Detector which will display the configuration dialog. You will next need to add a configuration by right-clicking on “Target Configurations” and selecting Add configuration. You will need to name the new configuration. Since we are configuring for a Bowhead whale, name it “Bowhead”. Expand the “Bowhead” configuration by pressing the ‘+’ widget next to its name, and add a signal band by right-clicking on the “Detection Bands” and selecting Add Signal Band. Name it “Endnote”. Now expand the “Detection Bands”, and “Endnote (Signal Band)” tree widgets by clicking on the ‘+’ next to their names.
In the “Endnote (Signal Band)” configuration, set the values of “In-Band Threshold (dB)”, “End/High Frequency (Hz)”, “Noise Window (s)” and “Signal Window (s)”. You can edit the values by double-clicking them. Set them to the values shown in Figure 52.
Note: Common default values are used when you first create a configuration or signal band, so only custom parameters need to be set. If you hover over an item in the window the limits for that parameter are indicated in a tool-tip. For some parameters these limits will change depending on other parameters.
PAMGUARD V 1.2.00 Tutorial
- 46 -
Similarly, add a guard band by right clicking on “Detection Bands”, and configure it’s “Start/Low Frequency (Hz)”, “End/High Frequency (Hz)”, “Noise Window (s)” and “Signal Window (s)” as shown in Figure 52.
Make sure that the “Bowhead” configuration is checked to enable it, then press the dialog’s OK button.
Figure 52. Likelihood Parameters Configuration Dial og
Note: You will see that the Noise Window and Signal Window length are the same for both the signal band and guard band. This is intentional and recommended for most cases when guard bands are used. For more information see the online help.
PAMGUARD V 1.2.00 Tutorial
- 47 -
Here we are using the “Block Average” algorithm, which is suitable for most situations. The signal window is set to 3.0 seconds which approximates the duration of an endnote call, with the Start/Low frequency set to 100 Hz and End/High frequency set to 700 Hz to cover the bandwidth of the call. The Noise window is set to 6.0 seconds due to the closely spaced calls. The rule of thumb (~3 times the Signal Window) is not used in this case as the calls only have about a 1.5 second gap between them (3.0 + 2 x 1.5 = 6.0). You can define an arbitrary number of configurations, each one with multiple signal bands. Each signal band can also have multiple guard bands though one on an appropriate side or two skirting the signal band is most appropriate. Please read the on-line help for more detail and information on how to use a more complex configuration. Finally, right click on the spectrogram window in the User Display panel, and check the “Likelihood Detector – Bowhead” item in the context menu. This instructs the spectrogram to draw detection boxes which are generated by the likelihood detector. If we had multiple configurations defined in the Likelihood Detector module, there would be an item for each one in the context menu.
Ex 10.6 Play back data file and view detections Now that we have configured the modules, select Start from the Detection menu. After a short while the file will have been processed to completion, and you should see something similar to Figure 53.
PAMGUARD V 1.2.00 Tutorial
- 48 -
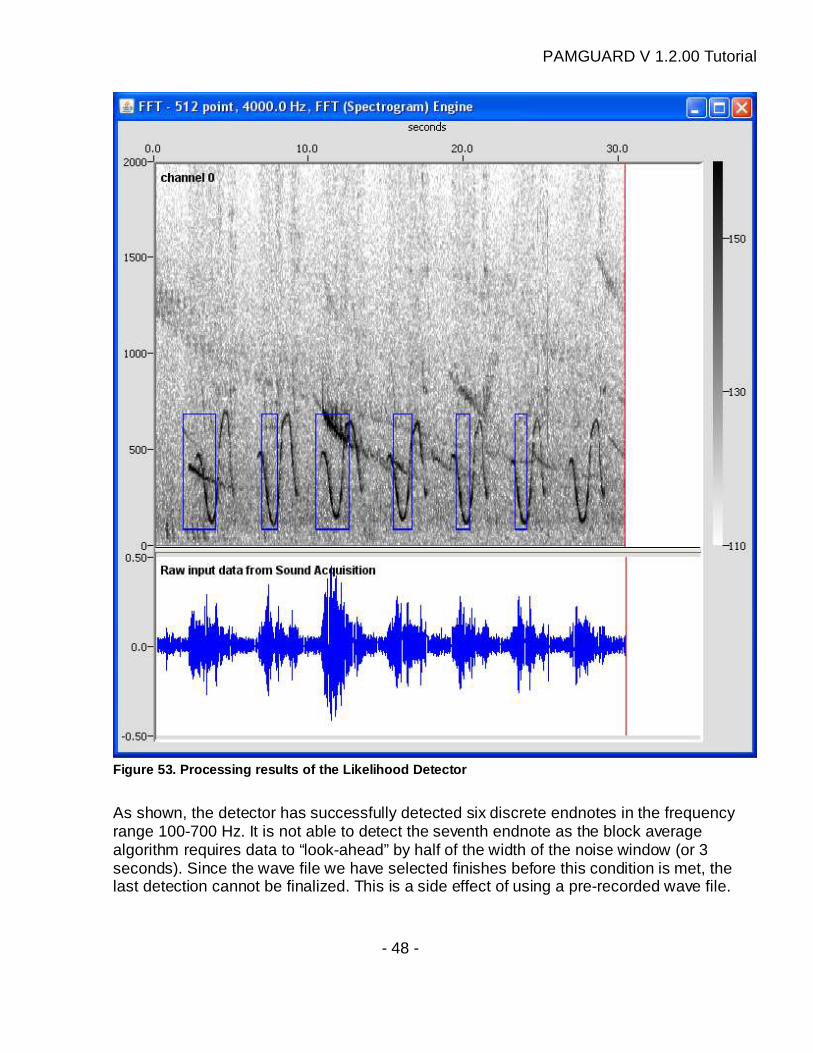
Figure 53. Processing results of the Likelihood Det ector
As shown, the detector has successfully detected six discrete endnotes in the frequency range 100-700 Hz. It is not able to detect the seventh endnote as the block average algorithm requires data to “look-ahead” by half of the width of the noise window (or 3 seconds). Since the wave file we have selected finishes before this condition is met, the last detection cannot be finalized. This is a side effect of using a pre-recorded wave file.
PAMGUARD V 1.2.00 Tutorial
- 49 -
It is also worth noting that this detector does not identify and isolate entire events. The overlay boxes (in blue) show the time period when the detector is above the detection threshold and will not necessarily surround the entire event as shown on the spectrogram.
Exercise 11. Detection during seismic source operation
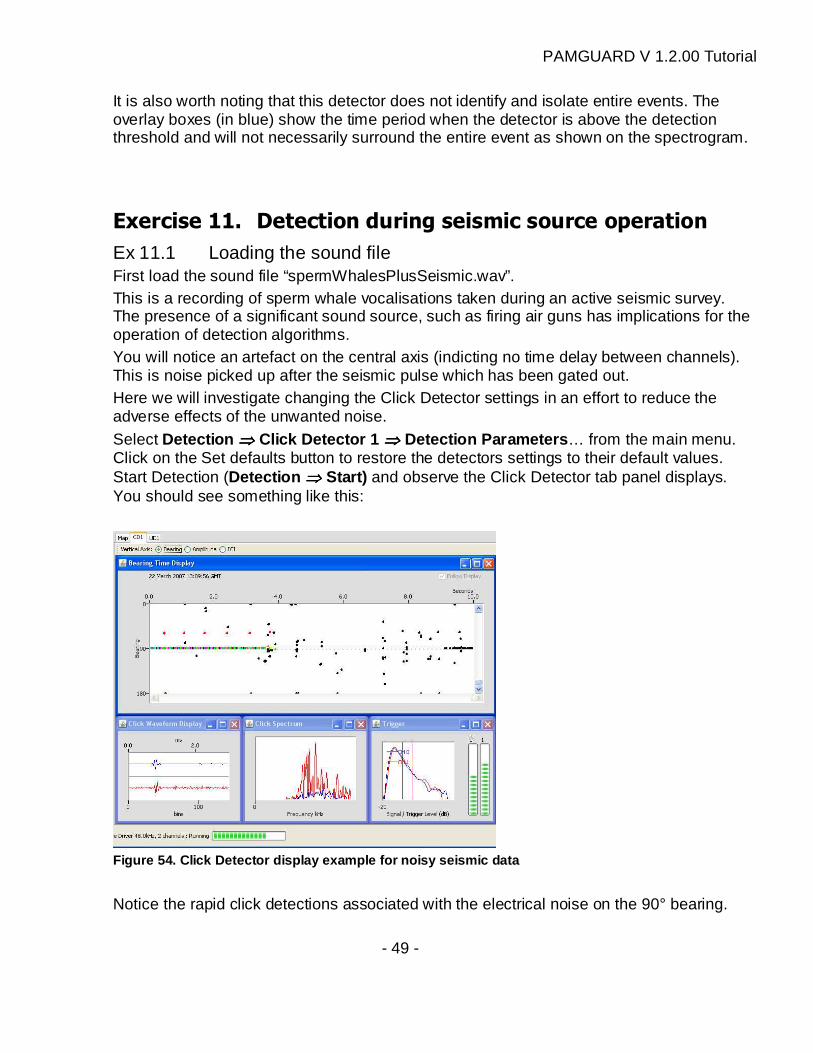
Ex 11.1 Loading the sound file First load the sound file “spermWhalesPlusSeismic.wav”. This is a recording of sperm whale vocalisations taken during an active seismic survey. The presence of a significant sound source, such as firing air guns has implications for the operation of detection algorithms. You will notice an artefact on the central axis (indicting no time delay between channels). This is noise picked up after the seismic pulse which has been gated out. Here we will investigate changing the Click Detector settings in an effort to reduce the adverse effects of the unwanted noise. Select Detection ⇒⇒⇒⇒ Click Detector 1 ⇒⇒⇒⇒ Detection Parameters … from the main menu. Click on the Set defaults button to restore the detectors settings to their default values. Start Detection (Detection ⇒⇒⇒⇒ Start ) and observe the Click Detector tab panel displays. You should see something like this:
Figure 54. Click Detector display example for noisy seismic data
Notice the rapid click detections associated with the electrical noise on the 90° bearing.
PAMGUARD V 1.2.00 Tutorial
- 50 -
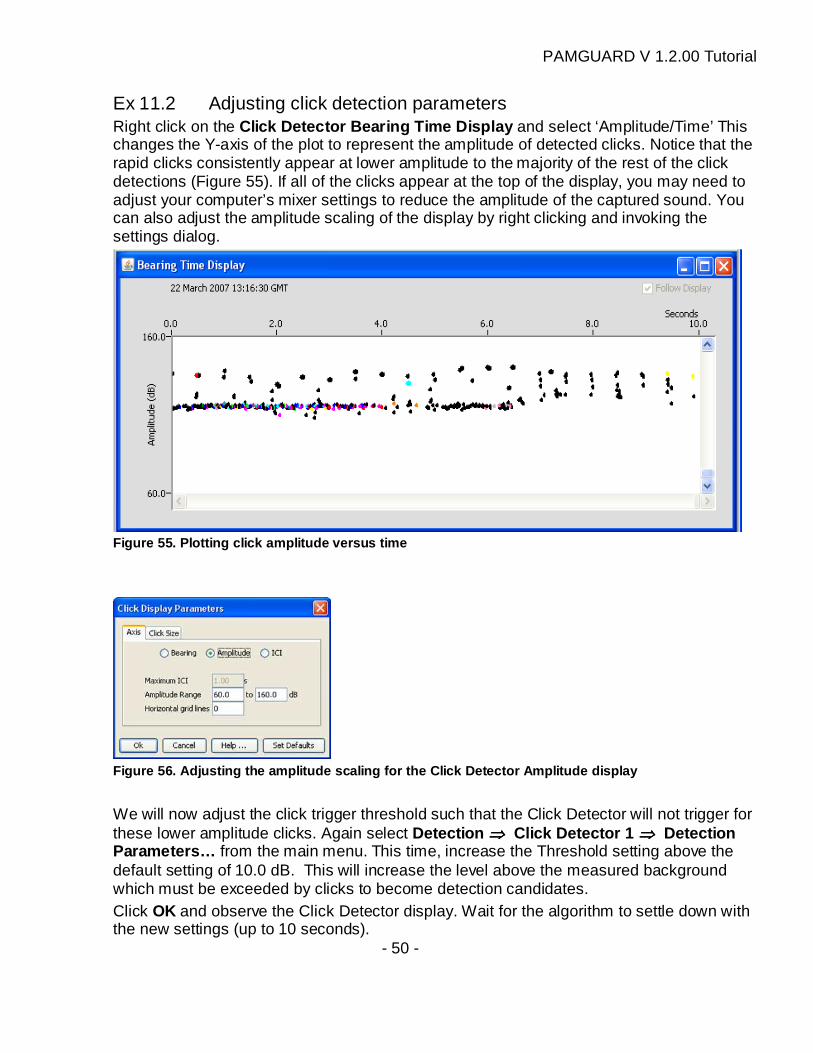
Ex 11.2 Adjusting click detection parameters Right click on the Click Detector Bearing Time Display and select ‘Amplitude/Time’ This changes the Y-axis of the plot to represent the amplitude of detected clicks. Notice that the rapid clicks consistently appear at lower amplitude to the majority of the rest of the click detections (Figure 55). If all of the clicks appear at the top of the display, you may need to adjust your computer’s mixer settings to reduce the amplitude of the captured sound. You can also adjust the amplitude scaling of the display by right clicking and invoking the settings dialog.
Figure 55. Plotting click amplitude versus time
Figure 56. Adjusting the amplitude scaling for the Click Detector Amplitude display
We will now adjust the click trigger threshold such that the Click Detector will not trigger for these lower amplitude clicks. Again select Detection ⇒⇒⇒⇒ Click Detector 1 ⇒⇒⇒⇒ Detection Parameters… from the main menu. This time, increase the Threshold setting above the default setting of 10.0 dB. This will increase the level above the measured background which must be exceeded by clicks to become detection candidates. Click OK and observe the Click Detector display. Wait for the algorithm to settle down with the new settings (up to 10 seconds).
PAMGUARD V 1.2.00 Tutorial
- 51 -
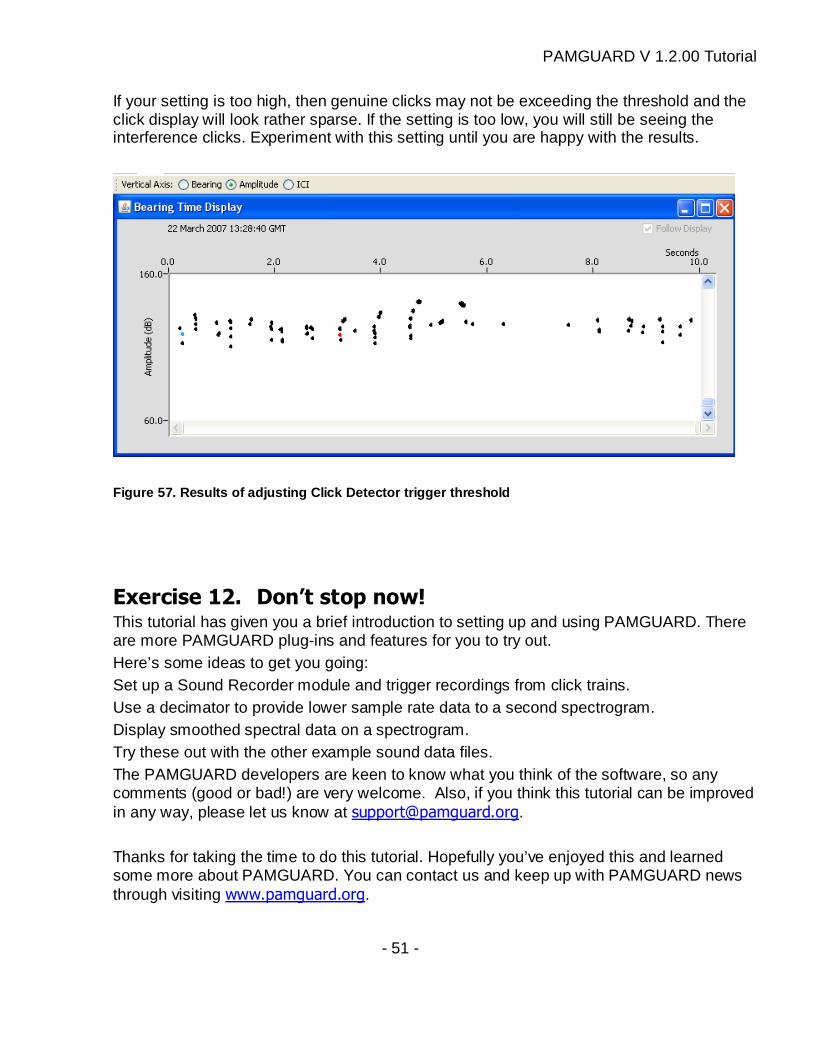
If your setting is too high, then genuine clicks may not be exceeding the threshold and the click display will look rather sparse. If the setting is too low, you will still be seeing the interference clicks. Experiment with this setting until you are happy with the results.
Figure 57. Results of adjusting Click Detector trig ger threshold
Exercise 12. Don’t stop now! This tutorial has given you a brief introduction to setting up and using PAMGUARD. There are more PAMGUARD plug-ins and features for you to try out. Here’s some ideas to get you going: Set up a Sound Recorder module and trigger recordings from click trains. Use a decimator to provide lower sample rate data to a second spectrogram. Display smoothed spectral data on a spectrogram. Try these out with the other example sound data files. The PAMGUARD developers are keen to know what you think of the software, so any comments (good or bad!) are very welcome. Also, if you think this tutorial can be improved in any way, please let us know at [email protected]. Thanks for taking the time to do this tutorial. Hopefully you’ve enjoyed this and learned some more about PAMGUARD. You can contact us and keep up with PAMGUARD news through visiting www.pamguard.org.


![1 195.337 mb 195.338 mb 2kb 195.339 mb 195.34 mb o z o U ... · 195.337 mb 195.338 mb 2kb 195.339 mb 195.34 mb o z o U.] U.] Thiel Hey 1 80.836 80.838 mb 80.84 80.842 mb Figure S7](https://img.pdfslide.net/doc/110x75/5e71a866b2da8320f30922bc/1-195337-mb-195338-mb-2kb-195339-mb-19534-mb-o-z-o-u-195337-mb-195338.jpg)