Embed Size (px)
Citation preview


P&D ENVIRONMENTAL, INC. 55 Santa Clara Avenue, Suite 240
Oakland, CA 94610
(510) 658-6916
February 16, 2010
Report 0154.R7
Mr. Ted Simas
Mr. Keith Simas
Xtra Oil Company
2307 Pacific Ave.
Alameda, CA 94501
SUBJECT: GROUNDWATER MONITORING AND SAMPLING REPORT
RWQCB UST File No. 21-0307
Xtra Oil Company
340 Miller Ave.
Mill Valley, California
Gentlemen:
P&D Environmental, Inc. (P&D) is pleased to present this report documenting the most recent
monitoring and sampling of groundwater monitoring wells MW1, MW2, and MW3 for the subject
site. This work was performed in accordance with a letter from the San Francisco Bay Regional
Water Quality Control Board (RWQCB) dated May 1, 2008 requesting the monitoring and
sampling of the wells. The wells were monitored and sampled on May 8, 2008. A Site Location
Map (Figure 1) and Site Vicinity Map (Figure 2) are attached with this report.
All work was performed under the direct supervision of a professional geologist and in accordance
with guidelines set forth in the document "Tri-Regional Board Staff Recommendations for
Preliminary Evaluation and Investigation of Underground Tank Sites" dated August 10, 1990 and
"Appendix A - Workplan for Initial Subsurface Investigation" dated August 20, 1991.
BACKGROUND
It is P&D's understanding that Apex Envirotech, Inc. (Apex), performed a soil and groundwater
investigation on September 19, 1995. This investigation was reported to have been performed in
response to analytical results for a groundwater sample collected from the observation well in the
backfill of the underground storage tank (UST) pit. The investigation consisted of the drilling of
ten soil borings and the collection of soil and groundwater samples.
On October 9 and 10, 1995 two steel, single-walled USTs were removed from the subject site. The
results of the soil and groundwater investigation conducted in September 1995, and the UST pit and
product line trench soil sampling were documented by Apex in a report titled "Results of Limited
Subsurface Investigation & Underground Storage Tank Removal" dated January 3, 1996.
On November 19, 1996, Apex installed two groundwater monitoring wells designated as MW1 and
MW2 at the subject site. The installation of groundwater monitoring wells MW1 and MW2 was

February 16, 2010
Report 0154.R7
Page 2 of 6
P&D ENVIRONMENTAL, INC.
documented by Apex in a report titled "Limited Subsurface Investigation Results Report" dated
December 16, 1996.
On March 11, 1997, Apex installed a third groundwater monitoring well designated as MW3 at a
location down gradient from the UST pit, in the Miller Avenue right-of-way. The installation of
groundwater monitoring well MW3 was documented by Apex in a report titled "Results of
Additional Limited Subsurface Investigation" dated March 28, 1997.
In a letter dated August 6, 1997 Mr. Steve Morse of the San Francisco Bay Regional Quality
Control Board (RWQCB) requested quarterly groundwater monitoring and sampling for three
quarters for the three monitoring wells. In addition, a sensitive receptor study for all domestic wells
located within 1,000 feet of the site was also requested. The results of the sensitive receptor study
were submitted in P&D's document titled, “Domestic Water Wells Survey” (Letter 0154.L1) dated
September 10, 1997. The three requested quarterly groundwater monitoring and sampling events
were performed on September 1 and December 19, 1997 and March 22, 1998. Each monitoring
and sampling event was documented in a report, with the third event documented in P&D’s
Quarterly Groundwater Monitoring and Sampling Report (document 0154.R3) dated June 30, 1998.
In a letter dated January 26, 1999 the RWQCB requested that the groundwater flow direction be
further evaluated by four groundwater monitoring episodes and that a door-to-door water well
survey be performed within a 2,000-foot radius of the site. During a telephone conversation on
April 30, 1999 between P&D and Mr. John Jang of the RWQCB, it was agreed that the door-to-
door survey would be performed by mailing a survey form to addresses located within 2,000 feet of
the site. The results of the groundwater flow direction monitoring were provided to the RWQCB in
P&D's Groundwater Flow Direction letter (document 0154.L10) dated November 2, 1999.
Documentation of the door-to-door well survey was provided to the RWQCB in P&D's Well
Survey Results letter (document 0154.L13) dated June 13, 2000.
In a letter dated September 21, 2000, Mr. Stephen Hill of the RWQCB requested a work plan to
determine the extent of MTBE in groundwater, and to identify the presence of any domestic water
wells within the MTBE plume. P&D submitted a Subsurface Investigation Work Plan (Work Plan
0154.W1) dated October 24, 2000. The work plan was subsequently approved in a letter from the
RWQCB dated January 12, 2001. Based on comments in the RWQCB letter, one additional
borehole was added to the scope of work in the work plan, and the wells were sampled as part of
the subsurface investigation. In a letter dated May 11, 2001 (Letter 0154.L17) from P&D to the
RWQCB, a 60 day extension for submittal of the subsurface investigation report was requested.
On June 21, 2001 a total of 6 soil borings designated as B1 through B6 were drilled in the vicinity
of the subject site to evaluate the presence or extent of petroleum hydrocarbons in groundwater.
One groundwater grab sample was collected from each borehole. In addition, the three
groundwater monitoring wells were sampled on June 24, 2001. Groundwater was encountered in
the majority of the boreholes at a depth of approximately 12.0 feet below the ground surface, and
within five minutes had risen in the boreholes to a measured depth of between 4.3 and 8.5 feet
below the ground surface. The subsurface materials encountered in the boreholes consisted of silty

February 16, 2010
Report 0154.R7
Page 3 of 6
P&D ENVIRONMENTAL, INC.
clay. Documentation of the subsurface investigation and well sampling event is provided in P&D’s
Subsurface Investigation report dated July 10, 2001 (document 0154.R4).
In a letter dated November 30, 2001 the RWQCB requested a work plan to further define the extent
of MTBE detected in groundwater. P&D subsequently submitted a Subsurface Investigation Work
Plan dated February 25, 2002 (document 0154.W2). The work plan was approved in a letter from
the RWQCB dated September 13, 2002, with a letter from the RWQCB dated December 16, 2002
granting a time extension for technical report submittal. Boreholes B7 through B14 were drilled on
March 21, 2003 and the three groundwater monitoring wells for the site were sampled on March 27,
2003. Documentation of the subsurface investigation and well sampling event is provided in
P&D’s Subsurface Investigation report dated September 11, 2003. Based on the sample results
P&D concluded that the horizontal extent of MTBE in groundwater had been delineated and
recommended that no further investigation be performed.
The RWQCB subsequently requested in a letter dated May 1, 2008 that the wells be sampled and
that a site conceptual model be prepared.
FIELD ACTIVITIES
On May 8, 2008, P&D personnel monitored and sampled monitoring wells MW1, MW2, and
MW3. Following removal of the well caps, the water level in the wells was allowed to equilibrate
for approximately one hour. Periodic water level measurements were made during the one hour
equilibration period prior to final monitoring measurement. The wells were monitored for depth
to water and the presence of free product or sheen. The depth to water was measured to the
nearest 0.01 foot using an electric water level indicator, and the presence of free product and
sheen was also evaluated using a transparent bailer. Depth to water level measurements and
calculated groundwater surface elevations are presented in Table 1.
Prior to well sampling, wells MW1, MW2, and MW3 were purged of a minimum of three casing
volumes of water. Petroleum hydrocarbon odors and petroleum hydrocarbon sheen were not
detected from the purge water from any of the three wells. During purging operations, the field
parameters of electrical conductivity, temperature, and pH were monitored. Once the field
parameters were observed to stabilize and a minimum of three casing volumes had been purged,
water samples were collected using a clean Teflon bailer. Records of the field parameters measured
during well purging are included with this report.
The water samples were transferred to 40-milliliter glass VOA vials that were sealed with Teflon-
lined screw caps. The VOA vials were overturned and tapped to ensure that no air bubbles were
present. The VOA vials were then transferred to a cooler with ice, until they were transported to
McCampbell Analytical, Inc. in Pittsburg, California. McCampbell Analytical, Inc. is a State-
certified hazardous waste testing laboratory. Chain of custody documentation accompanied the
samples to the laboratory.

February 16, 2010
Report 0154.R7
Page 4 of 6
P&D ENVIRONMENTAL, INC.
HYDROGEOLOGY
Based on review of regional geologic maps from U.S. Geological Survey Professional Paper 943,
"Flatland Deposits - Their Geology and Engineering Properties and Their Importance to
Comprehensive Planning," by E.J. Helley and K.R. Lajoie, 1979 the subject site is underlain by
bedrock but borders on Holocene coarse-grained alluvium (Qhac). The alluvium is described as
typically consisting of unconsolidated moderately sorted permeable sand and silt with coarse sand
and gravel; more abundant toward fan heads, and is considered to overlie bedrock on the alluvial
plain marginal to San Francisco Bay. San Francisco Bay is located approximately 3500 feet to the
east-southeast of the site.
The west side of the site is bordered by a hill, with retaining walls and near-vertical slopes on the
hillside immediately adjacent to the site. Madera del Presidio (a creek) is located approximately
250 feet to the east-northeast of the site and flows parallel to Miller Avenue. Miller Avenue slopes
towards the south-southeast, between the hill on the west and the creek on the east.
The subsurface materials encountered in continuously cored boreholes drilled in Miller Avenue
near the site to total depths of approximately 10 to 15 feet below the ground surface consisted
predominantly of silty clay, with gravel and sand fill encountered to a depth of approximately 3 feet
in several of the boreholes, and coarse-grained layers consisting of silty gravel, silty sand, and sand
with a typical maximum thickness of approximately 2.5 feet also encountered in several of the
boreholes. Groundwater was initially encountered in the boreholes during drilling at depths
typically ranging from approximately 10 to 15 feet, with groundwater typically encountered in the
boreholes at depths of approximately 3 to 8 feet below the ground surface.
On May 8, 2008 the measured depth to water in wells MW1, MW2 and MW3 was 5.01, 3.10, and
3.21 feet, respectively. Based on the measured depth to groundwater in the three wells, the apparent
groundwater flow direction at the site on May 8, 2008 was calculated to be to the south-southwest
with a gradient of 0.022. Groundwater monitoring data collected on May 8, 2008 are presented in
Table 1. The groundwater flow direction at the site on May 8, 2008 is shown on Figure 2.
Historic calculated groundwater flow directions have been predominantly easterly. However,
several historic calculated groundwater flow directions have been southwesterly, including on May
8, 2008. The calculated southwesterly groundwater flow directions are attributed to the long
equilibration times for water levels in the wells, and the wells being sampled prior to the water
levels having equilibrated in some of the wells. Review of the water level equilibration data for
May 8, 2008 suggests that the water levels in wells MW1 and MW2 had not yet equilibrated.
LABORATORY ANALYTICAL RESULTS
All of the groundwater samples from groundwater monitoring wells MW1 through MW3 were
analyzed for Total Petroleum Hydrocarbons as Gasoline (TPH-G) using EPA Method 5030 in
conjunction with modified EPA Method 8015; and for for benzene, toluene, ethylbenzene and
xylenes (BTEX) and MTBE using EPA Method 8020.

February 16, 2010
Report 0154.R7
Page 5 of 6
P&D ENVIRONMENTAL, INC.
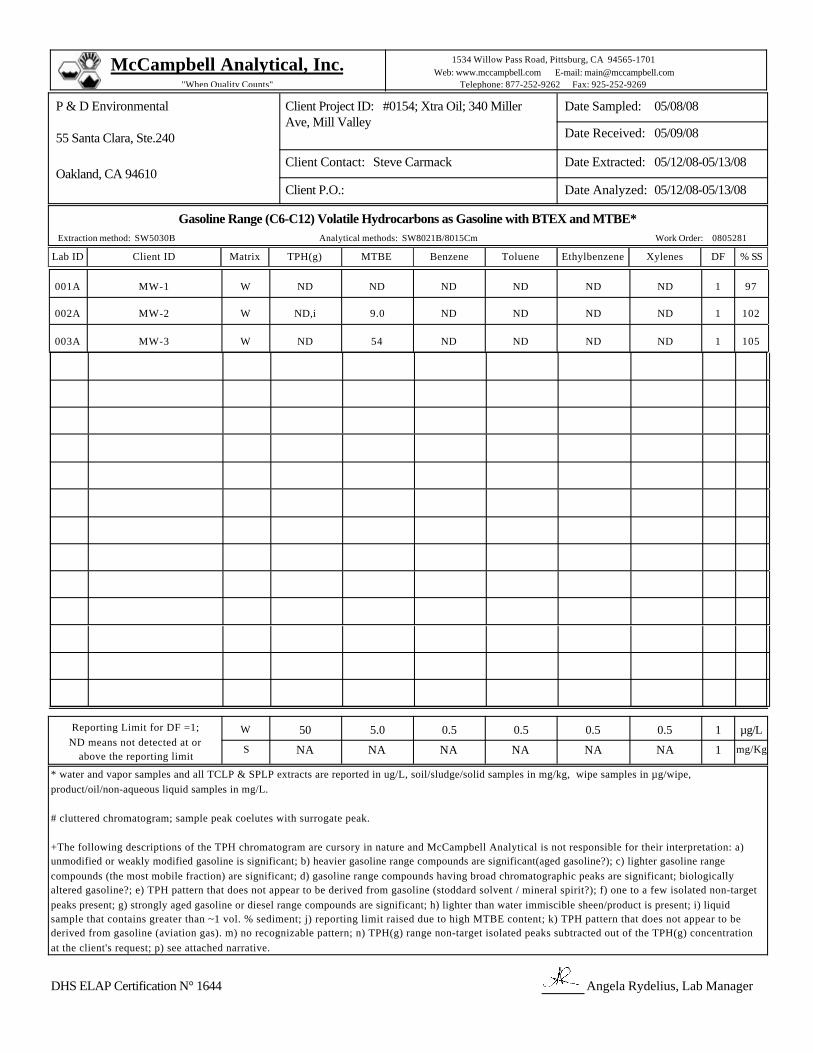
All of the sample results for the groundwater samples collected from the groundwater monitoring
wells showed that TPH-G, BTEX and MTBE were not detected except for MTBE in wells MW2
and MW3 at concentrations of 9.0 and 54 ug/L, respectively. The sample results are summarized in
Table 2. Copies of the laboratory analytical reports and chain of custody documentation are
attached with this report.
DISCUSSION AND RECOMMENDATIONS
Based on the measured depth to groundwater in the groundwater monitoring wells, the calculated
groundwater flow direction at the site on May 8, 2008 was to the south-southwest. However, the
majority of historic calculated groundwater flow directions for the site are to the east, which is
consistent with regional topography. The calculated south-southwesterly groundwater flow
direction on May 8, 2008 is attributed to slow water level equilibration times for wells at the site
and the water levels in two of the wells not having equilibrated prior to sampling.
All of the well groundwater samples were analyzed for TPH-G, BTEX and MTBE. The results of
the groundwater monitoring well samples showed that only MTBE was detected in wells MW2 and
MW3 at concentrations of 9.0 and 054 ug/L, respectively. Based on the sample results, P&D
recommends that no further work be performed pending RWQCB review of a site conceptual
model.
DISTRIBUTION
Copies of this report should be sent to Mr. John Jang at the RWQCB, and to Mr. Tim Underwood
at the Marin County Environmental Waste Management Department. Copies of the report should
be accompanied by a transmittal letter signed by the principal executive officer of Xtra Oil
Company. In addition, a copy of this report will be uploaded to the GeoTracker database.
LIMITATIONS
This report was prepared solely for the use of Xtra Oil Company. The content and conclusions
provided by P&D in this assessment are based on information collected during our investigation,
which may include, but not be limited to, visual site inspections; interviews with the site owner,
regulatory agencies and other pertinent individuals; review of available public documents;
subsurface exploration and our professional judgement based on said information at the time of
preparation of this document. Any subsurface sample results and observations presented herein are
considered to be representative of the area of investigation; however, geological conditions may
vary between borings and may not necessarily apply to the general site as a whole. If future
subsurface or other conditions are revealed which vary from these findings, the newly-revealed
conditions must be evaluated and may invalidate the findings of this report.
This report is issued with the understanding that it is the responsibility of the owner, or his
representative, to ensure that the information contained herein is brought to the attention of the

February 16, 2010
Report 0154.R7
Page 6 of 6
P&D ENVIRONMENTAL, INC.
appropriate regulatory agencies, where required by law. Additionally, it is the sole responsibility of
the owner to properly dispose of any hazardous materials or hazardous wastes left onsite, in
accordance with existing laws and regulations.
This report has been prepared in accordance with generally accepted practices using standards of
care and diligence normally practiced by recognized consulting firms performing services of a
similar nature. P&D is not responsible for the accuracy or completeness of information provided by
other individuals or entities which is used in this report. This report presents our professional
judgement based upon data and findings identified in this report and interpretation of such data
based upon our experience and background, and no warranty, either express or implied, is made.
The conclusions presented are based upon the current regulatory climate and may require revision if
future regulatory changes occur.
Should you have any questions or comments, please do not hesitate to contact us at (510) 658-6916.
Sincerely,
P&D Environmental, Inc.
Paul H. King
Professional Geologist # 5901
Expires: 12/31/11
Attachments:
Table 1 – Summary of Well Monitoring Data
Table 2 - Summary of Laboratory Analytical Results
Figure 1 - Site Location Map
Figure 2 - Site Vicinity Map Showing Groundwater Surface Elevations
Well Monitoring and Purge Data Sheets
Laboratory Analytical Reports and Chain of Custody Documentation
PHK/sjc
0154.R7

TABLES

Report 0154.R7TABLE 1
SUMMARY OF WELL MONITORING DATA
Well Date Top of Casing Depth to Water TableNo. Monitored Elevation (Ft.) Water (Ft.) Elevation (Ft.)
MW1 5/8/2008 20.00 5.01 14.993/27/2003 2.13 17.876/24/2001 3.61 16.397/17/1999 3.06 -3.066/7/1999 2.64 -2.645/4/1999 2.25 -2.254/2/1999 2.75 -2.75
3/22/1998 5.51 14.4912/19/1997 7.28 12.729/1/1997 3.60 16.40
3/11/1997 2.80 17.2011/20/1996 3.31 16.69
MW2 5/8/2008 19.23 3.10 16.133/27/2003 2.68 16.556/24/2001 3.95 15.287/17/1999 3.63 -3.636/7/1999 3.34 -3.345/4/1999 2.83 -2.834/2/1999 2.56 -2.56
3/22/1998 2.55 16.6812/19/1997 2.80 16.439/1/1997 3.24 15.99
3/11/1997 2.88 16.3511/20/1996 3.11 16.12
MW3 5/8/2008 17.88 3.21 14.673/27/2003 3.14 14.746/24/2001 3.81 14.077/17/1999 3.62 -3.626/7/1999 3.44 -3.445/4/1999 3.21 -3.214/2/1999 3.04 -3.04
3/22/1998 3.30 14.5812/19/1997 3.32 14.569/1/1997 3.65 14.23
3/11/1997 3.90 13.98
NOTES:Elevations are in feet above Mean Sea Level.ft. = Feet
Page 1 of 1

Report 0154.R7TABLE 2
SUMMARY OF LABORATORY ANALYTICAL RESULTSWell Sample Ethyl-No. Date benzene
MW1 5/8/2008 ND ND ND ND ND ND3/27/2003 ND ND ND ND ND ND6/24/2001 ND ND ND ND ND ND3/22/1998 ND ND ND ND ND ND12/19/1997 ND ND ND ND ND ND9/1/1997 ND ND ND ND ND ND3/11/1997 ND ND ND ND ND ND11/20/1996 ND ND ND ND ND ND
MW2 5/8/2008 ND 9.0 ND ND ND ND3/27/2003 ND 220* ND ND ND ND6/24/2001 ND 190** ND ND ND ND3/22/1998 ND 730 ND ND ND ND12/19/1997 ND 520 ND ND ND ND9/1/1997 ND 600 ND ND ND 0.693/11/1997 ND 820 ND ND ND ND11/20/1996 ND 1,000 ND ND ND ND
MW3 5/8/2008 ND 54 ND ND ND ND3/27/2003 ND 180* ND ND ND ND6/24/2001 ND 16** ND ND ND ND3/22/1998 ND ND ND ND ND ND12/19/1997 ND ND ND ND ND ND9/1/1997 ND ND ND ND ND ND3/11/1997 ND ND ND ND ND ND
NOTESTPH-G = Total Petroleum Hydrocarbons as Gasoline.MTBE = Methyl tert-Butyl Ether.ND = Not Detected.* = MTBE confirmation analysis by EPA Method 8260 showed concentrations of 260 micrograms per liter (μg/L) for MW2 and 19 μg/L for MW3.** = MTBE confirmation analysis by EPA Method 8260 showed concentrations of 220 μg/L for MW2 and 19 μg/L for MW3.Results are in μg/L unless otherwise noted.
XylenesTPH-G MTBE Benzene Toluene
Page 1 of 1

FIGURES


WELL MONITORING AND PURGE DATA SHEETS


LABORATORY ANALYTICAL REPORTS AND CHAIN OF CUSTODY
DOCUMENTATION

McCampbell Analytical, Inc. 1534 Willow Pass Road, Pittsburg, CA 94565-1701Web: www.mccampbell.com E-mail: [email protected]
Telephone: 877-252-9262 Fax: 925-252-9269"When Quality Counts"
May 15, 2008
Dear Steve:
WorkOrder: 0805281
Client Project ID: #0154; Xtra Oil; 340 Miller Ave, Mill Valley
P & D Environmental
55 Santa Clara, Ste.240
Oakland, CA 94610Client Contact: Steve Carmack
Client P.O.:
Date Sampled: 05/08/08
Date Received: 05/09/08
Date Reported: 05/15/08
Date Completed: 05/13/08
All analyses were completed satisfactorily and all QC samples were found to be within our control limits.
If you have any questions or concerns, please feel free to give me a call. Thank you for choosing
McCampbell Analytical Laboratories for your analytical needs. Best regards,
Enclosed within are:
2) A QC report for the above samples,
4) An invoice for analytical services.
3) A copy of the chain of custody, and
#0154; Xtra Oil; 340 Miller Ave, Mil1) The results of the analyzed samples from your project:3
Angela RydeliusLaboratory ManagerMcCampbell Analytical, Inc.


McCampbell Analytical, Inc.1534 Willow Pass Rd
Pittsburg, CA 94565-1701(925) 252-9262
CHAIN-OF-CUSTODY RECORD Page
Lab ID Matrix Collection Date HoldRequested Tests (See legend below)
Report to:
Steve Carmack
55 Santa Clara, Ste.240Oakland, CA 94610
(510) 658-6916 FAX 510-834-0152
PO:
05/12/2008
Client ID
ProjectNo: #0154; Xtra Oil; 340 Miller Ave, Mill Valley
WorkOrder: 0805281
1 of 1
Date Printed:
Date Received: 05/09/2008
1 2 3 4 5 6 7 8 9 10 11 12
P & D Environmental
Bill to:
Accounts PayableXtra Oil Company2307 Oil CompanyAlameda, CA 94610
Requested TAT: 5 days
ClientCode: PDEO
Email: [email protected]
EDF Fax Email HardCopy ThirdParty
Excel J-flagWriteOn
cc:
A0805281-001 Water 5/8/2008 13:05MW-1A0805281-002 Water 5/8/2008 13:30MW-2A0805281-003 Water 5/8/2008 12:15MW-3
Prepared by: Samantha Arbuckle
NOTE: Soil samples are discarded 60 days after results are reported unless other arrangements are made (Water samples are 30 days). Hazardous samples will be returned to client or disposed of at client expense.
Comments:
G-MBTEX_W1 2 3 4 5
6 7 8 9 10
Test Legend:
11 12

Sample Receipt Checklist
McCampbell Analytical, Inc. 1534 Willow Pass Road, Pittsburg, CA 94565-1701Web: www.mccampbell.com E-mail: [email protected]
Telephone: 877-252-9262 Fax: 925-252-9269"When Quality Counts"
Client Name: P & D Environmental
WorkOrder N°: 0805281
Date and Time Received: 05/09/08 7:59:01 PM
Checklist completed and reviewed by: Samantha Arbuckle
Matrix Water Carrier: Rob Pringle (MAI Courier)
Shipping container/cooler in good condition? Yes No
Custody seals intact on shipping container/cooler? Yes No NA
Chain of custody present? Yes No
Chain of custody signed when relinquished and received? Yes No
Chain of custody agrees with sample labels? Yes No
Samples in proper containers/bottles? Yes No
Sample containers intact? Yes No
Sufficient sample volume for indicated test? Yes No
All samples received within holding time? Yes No
NAContainer/Temp Blank temperature
Yes No No VOA vials submittedWater - VOA vials have zero headspace / no bubbles?
TTLC Metal - pH acceptable upon receipt (pH<2)? Yes No NA
Cooler Temp: 3.2°C
Chain of Custody (COC) Information
Yes NoSample IDs noted by Client on COC?
Yes NoDate and Time of collection noted by Client on COC?
Yes NoSampler's name noted on COC?
Sample Receipt Information
Sample Preservation and Hold Time (HT) Information
Sample labels checked for correct preservation? Yes No
Project Name: #0154; Xtra Oil; 340 Miller Ave, Mill Valley
Client contacted: Date contacted: Contacted by:
Comments:
Lab ID TPH(g) MTBE Benzene TolueneClient ID EthylbenzeneMatrix DF % SS
Gasoline Range (C6-C12) Volatile Hydrocarbons as Gasoline with BTEX and MTBE*
Client Project ID: #0154; Xtra Oil; 340 Miller Ave, Mill Valley
P & D Environmental
55 Santa Clara, Ste.240
Oakland, CA 94610Client Contact: Steve Carmack
Client P.O.:
Date Sampled: 05/08/08
Date Received: 05/09/08
Date Extracted: 05/12/08-05/13/08
Date Analyzed: 05/12/08-05/13/08
Work Order: 0805281Extraction method: SW5030B Analytical methods: SW8021B/8015Cm
Xylenes
McCampbell Analytical, Inc. 1534 Willow Pass Road, Pittsburg, CA 94565-1701Web: www.mccampbell.com E-mail: [email protected]
Telephone: 877-252-9262 Fax: 925-252-9269"When Quality Counts"
NDMW-1 ND ND ND001A W ND 1 97ND
NDMW-2 ND,i 9.0 ND002A W ND 1 102ND
NDMW-3 ND 54 ND003A W ND 1 105ND
DHS ELAP Certification N° 1644 Angela Rydelius, Lab Manager
Reporting Limit for DF =1;ND means not detected at or
above the reporting limit
W
S
50 5.0 0.5 0.5 0.5 1
NA NA NA NA NA 1
µg/L
mg/Kg
* water and vapor samples and all TCLP & SPLP extracts are reported in ug/L, soil/sludge/solid samples in mg/kg, wipe samples in µg/wipe, product/oil/non-aqueous liquid samples in mg/L.
# cluttered chromatogram; sample peak coelutes with surrogate peak.
+The following descriptions of the TPH chromatogram are cursory in nature and McCampbell Analytical is not responsible for their interpretation: a) unmodified or weakly modified gasoline is significant; b) heavier gasoline range compounds are significant(aged gasoline?); c) lighter gasoline range compounds (the most mobile fraction) are significant; d) gasoline range compounds having broad chromatographic peaks are significant; biologically altered gasoline?; e) TPH pattern that does not appear to be derived from gasoline (stoddard solvent / mineral spirit?); f) one to a few isolated non-target peaks present; g) strongly aged gasoline or diesel range compounds are significant; h) lighter than water immiscible sheen/product is present; i) liquid sample that contains greater than ~1 vol. % sediment; j) reporting limit raised due to high MTBE content; k) TPH pattern that does not appear to be derived from gasoline (aviation gas). m) no recognizable pattern; n) TPH(g) range non-target isolated peaks subtracted out of the TPH(g) concentration at the client's request; p) see attached narrative.
0.5
NA

QC SUMMARY REPORT FOR SW8021B/8015Cm
McCampbell Analytical, Inc. 1534 Willow Pass Road, Pittsburg, CA 94565-1701Web: www.mccampbell.com E-mail: [email protected]
Telephone: 877-252-9262 Fax: 925-252-9269"When Quality Counts"
EPA Method SW8021B/8015Cm Extraction SW5030B Spiked Sample ID: 0805281-001A
Sample Spiked MS
% Rec. % Rec. % Rec. % Rec.
MSD LCS LCSDMS-MSD
% RPD
LCS-LCSD
% RPD
WorkOrder: 0805281W.O. Sample Matrix: Water
BatchID: 35545
MS / MSD
Acceptance Criteria (%)
LCS/LCSDAnalyte
QC Matrix: Water
RPD RPDµg/L µg/L
TPH(btex) ND 60 95.3 97.8 2.61 92.6 93 0.375 70 - 130 70 - 130£ 20 20
MTBE ND 10 100 99.1 0.979 103 98.8 4.09 70 - 130 70 - 13020 20
Benzene ND 10 84 92.1 9.18 88.6 88.1 0.586 70 - 130 70 - 13020 20
Toluene ND 10 76 83.7 9.62 79.9 82 2.59 70 - 130 70 - 13020 20
Ethylbenzene ND 10 84.4 91.9 8.56 88 87.4 0.656 70 - 130 70 - 13020 20
Xylenes ND 30 81.1 89.6 9.89 85 86.2 1.41 70 - 130 70 - 13020 20
%SS: 97 10 95 96 0.322 97 95 1.43 70 - 130 70 - 13020 20
All target compounds in the Method Blank of this extraction batch were ND less than the method RL with the following exceptions:
NONE
Lab ID Date Sampled Date Extracted Lab ID Date Sampled Date ExtractedDate Analyzed Date Analyzed
BATCH 35545 SUMMARY
0805281-001A 05/12/08 05/12/08 8:37 PM05/08/08 1:05 PM 0805281-002A 05/13/08 05/13/08 8:18 PM05/08/08 1:30 PM0805281-003A 05/13/08 05/13/08 2:10 AM05/08/08 12:15 PM
MS = Matrix Spike; MSD = Matrix Spike Duplicate; LCS = Laboratory Control Sample; LCSD = Laboratory Control Sample Duplicate; RPD = Relative Percent Deviation.
% Recovery = 100 * (MS-Sample) / (Amount Spiked); RPD = 100 * (MS - MSD) / ((MS + MSD) / 2).
MS / MSD spike recoveries and / or %RPD may fall outside of laboratory acceptance criteria due to one or more of the following reasons: a) the sample is inhomogenous AND contains significant concentrations of analyte relative to the amount spiked, or b) the spiked sample's matrix interferes with the spike recovery.
£ TPH(btex) = sum of BTEX areas from the FID.
# cluttered chromatogram; sample peak coelutes with surrogate peak.
N/A = not enough sample to perform matrix spike and matrix spike duplicate.
NR = matrix interference and/or analyte concentration in sample exceeds spike amount for soil matrix or exceeds 2x spike amount for water matrix or sample diluted due to high matrix or analyte content, or inconsistency in sample containers.
DHS ELAP Certification N° 1644 QA/QC Officer