Embed Size (px)
Citation preview

i
PAN AFRICAN INSTITUTE FOR DEVELOPMENT –
WEST AFRICA
(PAID-WA)
PO BOX 133, BUEA, CAMEROON
DEPARTMENT OF DEVELOPMENT STUDIES
A Thesis Submitted to The Department of Development Studies in Partial Fulfillment of
the Requirement for the Award of a Masters in Science Degree in Sustainable
Development with Specialization in Agriculture and Development
PRESENTED BY:
NKWELLE JEROME ALOBWEDE (PAID-WA 00563)
B.Sc (Hons) Economics, University of Buea
SUPERVISOR
ASONGWE GODSWILL. A. (Ph.D)
JUNUARY 2018
ASSESSING THE CONTRIBUTION OF AGRO PROCESSING SECTOR
ON THE ECONOMIC GROWTH OF CAMEROON: THE CASE OF
COFFEE, COCOA AND PALM EVIDENCE FROM 1980-2013

ii

iii

iv
DEDICATION
This dissertation is dedicated to my parents Chief Nkwelle Simon Nsioge and Dione
Anna Nkwelle. Who have spent relentless effort to see that I get the best education.

v
ACKNOWLEDGMENTS
The past two years in the institution have been very challenging especially the realization
of this dissertation, but this would have been more difficult without the help of the
following. In first place I want thank the almighty God for keeping me steadfast right up
to this moment. I am so grateful to my supervisor Dr. Asongwe Godswill Azanwie who
from the very start of this program has been a source of encouragement to me and most
especially for his relentless effort throughout the realization of this work, despite his
tight schedule was able to sacrifice time for me.
A word of gratitude goes to all the lecturers and through whom the entire training rested
upon. Beginning with the head of the institution Dr. Umeh E, Prof Mbomi E, Dr. Foncha
J, Dr. Asong Valentine, Mr. Delvis, Mr. Ottu G, not living out the administration for
their tact fullness in administering the school
My stay in the institution was even made more conducive with a brother Amet Sallah I
met in school who was my lone course mate and with his constant support we were able
to overcome. I am also grateful to the other mates with whom we share cross program
courses.
Continuous thanks goes to mom who gave a final approval to let me engage in the
program and to my father whom even after the dead of my mother was still willing to
support this program financially and morally. Special thanks goes to Afuge Akame
whose effort towards the realization of this work was enomous. I am also grateful to
MrNkewlle Clement and wife Judith Mesinze, Nkwelle George, Nkwelle Clear,
Mkwelle Elvis, Nnage Emmanuel and wife, Edwin Ntungwe, Peter Atabe, Cyril Muabe,
Ntube Rachel, Esong Melanie, Dione Noela, Elvis Awasume, and Melvis Epole Ajang
for their financial and moral support

vi
ABSTRACT
Worldwide, the utilization of agro processing sector offers potentials for economic and
social benefits including employment creation, income generation and reduction in
postharvest losses and overall economic growth. Their impacts vary from country to
country and from one product to another. This dissertation is aimed at assessing the
contribution of agro processing sector on the economic growth of Cameroon, the case of
coffee cocoa and palm nuts”. Specifically, it examined the trend of coffee, cocoa and
palm nut processing sector in relation to economic trend of Cameroon, To assess the
individual impact of the cocoa, palm and coffee agro processing sectors on the economic
growth of Cameroon and To assess the combined impact of the coffee, cocoa and palm
agro processing sector on the economic growth of Cameroon. The research made used
of time series data obtained from the World Bank Development Indicators and FAO data
base from 1980-2013 and made used of the ordinary least square technique to estimate.
The result revealed that coffee processing sector had decreasing trend since the 1980,
while the palm nut industry has an upward sloping curve. Further empirical result shows
there is an overall positive and significant effect (1% confident interval) (pro>F=0.000)
of the agro processing sector on economic growth of Cameroon with Adj R value of
0.5970. Considering individual industries, coffee processing had a negative and
significant (10%) effect on GDP with the other two having positive effect on GDP. It is
concluded, agro processing which is still at its growth stage in Cameroon though it has
significantly contributing to economic growth, for the sector to acquire maximum gain,
the government should set up farm settlement schemes with necessary infrastructure,
favorable business environment that encourages investment in the agro processing sector
especially the coffee industry that needs to be revamped.
Key word: Agro processing, Economic growth, GDP
TABLE OF CONTENTS
DECLARATION ........................................................... Error! Bookmark not defined.

vii
CERTIFICATION .......................................................... Error! Bookmark not defined.
DEDICATION ................................................................................................................ ii
ACKNOWLEDGMENTS ................................................................................................ v
ABSTRACT ................................................................................................................... vi
TABLE OF CONTENTS ............................................................................................... vi
LIST OF TABLES ......................................................................................................... ix
LIST OF FIGURES.......................................................................................................... x
LIST OF APPENDICES ................................................................................................ xi
LIST OF ABBREVIATIONS ..................................................................................... xii
CHAPTER ONE
INTRODUCTION
1.1 Background to the Studies ......................................................................................... 1
1.2 Problem Statement ..................................................................................................... 7
1.3 Research Objective ................................................................................................... 10
1.4 Research hypothesis ................................................................................................. 11
1.5 Justification of the studies ........................................................................................ 11
1.6 Scope of Study ......................................................................................................... 11
1.7 Area of Study ........................................................................................................... 12
1.8 Organisation of the Study ......................................................................................... 15
1.9 Definition of key term .............................................................................................. 16
CHAPTER TWO
LITERATURE AND THEORETICAL REVIEW
2.1 Conceptual Literature ............................................................................................... 20
2.1.1 An overview of agro-processing firms .................................................................. 20
2.1.2 Coffee Processing Sector in Cameroon ................................................................. 22
2.1.3 Cocoa Processing Sector in Cameroon ................................................................. 23
2.1.4 Palm Processing Sector in Cameroon ................................................................... 24

viii
2.1.5 Importance of Agro-Processing sector .................................................................. 27
2.1.6 Factors Constraining Agro-Processing Industries in Africa ................................. 29
2.2 EmpiricalLiterature .................................................................................................. 30
2.3 Theoretical Framework ............................................................................................ 37
2.3.1The theory of Rosenstein-Rodan on industrialization ............................................ 37
2.3.2 The theories of balanced / unbalanced growth ...................................................... 38
2.3.4 The cross country model ....................................................................................... 38
2.3.6 Managing productive transformation: ................................................................... 39
2.3.7 Industrialization through global value chains ....................................................... 40
2.5 Gap identified ........................................................................................................... 41
CHAPTER THREE
METHODOLOGY OF THE STUDY
3.1 Research Design ....................................................................................................... 42
3.1 Model Specification ................................................................................................. 43
3.2 Justification of models and a priori expectation ...................................................... 44
3.3 Techniques of Estimation ......................................................................................... 44
3.4 Validation of Estimated Parameters ......................................................................... 45
3.4.1 Economic or a priori Test ...................................................................................... 45
3.4.2 Statistical Criteria or First Order Test ................................................................... 45
3.4.3 Econometric Criteria or Second Order Test .......................................................... 45
CHAPTER FOUR
PRESENTATION AND DISCUSSION OF FINDINGS
4.1 Presentation of Results ............................................................................................. 47
4.1.1Trend of GDP, coffee, cocoa and palm processing in relation to economic trend 47
4.1.2 Impact of Agricultural processing industry on economic growth ......................... 52
4.1.2.1 Summary Statistics ............................................................................................. 52
4.1.2.2 Diagnostic Test Results ...................................................................................... 53

ix
4.1.2.3 Pair-wise Correlation Results ............................................................................. 53
4.1.2.4 Regression Results for growth equation ............................................................ 54
4.1.2.5 To assess the impact of the cocoa agro processed sector on the economic growth
of Cameroon ................................................................................................................... 55
4.1.2.6 To assess the impact of the coffee agro processed sector on the economic growth
of Cameroon ................................................................................................................... 55
4.1.2.7 To assess the impact of the palm agro processed sector on the economic growth
of Cameroon ................................................................................................................... 56
4.1.2.8 To assess the combined impact of the coffee, cocoa and palm agro processed
sector on the economic growth of Cameroon ................................................................ 56
4.2 Discussion of Result ................................................................................................. 57
4.3 Implication of the Study ........................................................................................... 59
4.4 Limitation of the Studies .......................................................................................... 60
CHAPTER FIVE
SUMMARY OF FINDINGS, CONCLUSION AND RECOMMENDATION
5.1 Summary of findings ................................................................................................ 61
5.2 Conclusion ................................................................................................................ 62
5.3 Recommendations .................................................................................................... 62
5.4 Area for Further Research ........................................................................................ 65
REFERENCES ............................................................................................................... 67
APPENDISES ................................................................................................................ 80
LIST OF TABLES
Table 1: Table 1.1, World total merchandise and agro-industrial imports from Africa by
commodity category, 1990-2008 ...................................................................... 6

x
Table 2: Table 1.2 Major crops cultivated and animal species reared in each agro-
ecological zone ................................................................................................ 13
Table 3: Table 4.1 summary of the trend of variables ................................................... 52
Table 4: Table 4.3 descriptive statistics of variables ..................................................... 52
Table 5: Table 4.4 Philips perron unit root test for stationarity ..................................... 53
Table 6: Table 4.5 Pair-wise Correlation Results .......................................................... 54
Table 7: Table 4.6 regression result for economic growth ............................................. 54
LIST OF FIGURES
Figure 1: Fig 4.1 GDP Trend of Cameroon ................................................................... 48

xi
Figure 2: Fig 4.2 trend of income from cocoa and its product in Cameroon ................. 48
Figure 3: Fig 4.3 trend of income from coffee and its product ...................................... 50
Figure 4: Fig 4.4 trend of income of palm and its product. ........................................... 51
LIST OF APPENDICES
Appendix 1: Data set used in work ................................................................................ 80
Appendix 2Trend of Variables ....................................................................................... 81
xii
Appendix 3: Regression result for Export earnings model ............................................ 87
Appendix 4: Muticollinearity test for export earnings model ........................................ 87
Appendix 5: OLS-Without test for stationarity .............................................................. 88
Appendix 6: OLS-after test for stationarity ................................................................... 89
Appendix 7: Summary statistics ..................................................................................... 89
Appendix 8: Test for Heteroskedasticity ........................................................................ 90
Appendix 9: Test for Multicollinearity .......................................................................... 90
APPENDIX 10: PAIRWISE CORRELATION RESULTS .......................................... 90
Appendix 11: Test for unit root (stationarity) ................................................................ 91
Appendix 12: map of Cameroon .................................................................................... 94
LIST OF ABBREVIATIONS
(FDI) Foreign Direct Investment
(NEPAD) New Economic Partnership for African Development

xiii
(UNIDO) The United Nation Industrial Development Orginisation
(FAO) Food and Agricultural Organization
(CAADP) Comprehensive Africa Agriculture Development Program
(AU) African Union
(ICT) Information Communication Technology
(SADE) Southern African Development Community
(GDP) Gross Domestic Product
(EIA) ENERGY INFORMATION ADMINISTRATION
(DSCE) Growth and Employment Creation Strategy
(SSA) SUB SAHARAN AFRICA
(BHNA) Basic Human Needs Approach
(MDGs) Millennium Development Goals
(USD) United State Dollas
(OECD) Organization for Economic Cooperation and Development
(UNCTAD) The United Nation Conference on Trade and Development
(FAOSTAT) Food and Agricultural Organization Statistic
(CEMAC)
Commission of the Economic and Monetary Community of
Central Africa)
(CHOCOCAM) Chocolaterie Confiserie Cameroonaise
(SODECAO) La Societe De Developpement Du Cacao
(IFAD) International Fund for Agricultural Development
(CPO) CRUDE PALM OIL
ADBG African Development Bank Group
PAIDWA Pan African Institute for Development West Africa
1
CHAPTER ONE
INTRODUCTION
1.1 Background to the Studies
Industrial growth is a vital pathway to economic development with multiplier potentials
of significantly reducing poverty in the African continent. Unfortunately, African
economies are dominantly narrowly focused on agricultural production and mineral
extraction, generating limited incomes for a largely rural population. The promotion of
micro, small and medium-sized enterprises to further process the primary products
generated from these sectors would provide alternative livelihoods for rural
communities, empower citizens and generate employment opportunities as well as
stimulate growth in the agriculture and services sectors(UNIDO, 2004). As such,
industrial growth is an indispensable pre-requisite of sustainable development. Most
development forums focusing on development in Africa have endorsed this. For
example, the New Economic Partnership for African Development (NEPAD) endorsed
by African Heads of States and Governments. It emphasize that African countries must
diversify their economies away from their dependence on primary production and a
narrow export base. It furthermore emphasizes that the logical starting point for doing so
is to “harness Africa’s natural resource base and increase value added in inter alia agro-
processing and that diversification should be based on strong inter-sectorial linkages”
(UNIDO, 2004).
Several studies have shown that conditions for dynamic agro-industrial development and
the promotion of agribusiness in Africa are yet to be achieved, but that there have been
some progress made towards this end (FAO,2008; OECD/DC, 2013; Larsen et
al.,2009,UNIDO, 2011). Thanks to greater effort to the work of the Comprehensive

2
Africa Agriculture Development Program (CAADP) which was launched in 2003 and
steered by the New Partnership for Africa’s Development (NEPAD) of the African
Union (AU). CAADP, supported by some of Africa’s development partners (like the Bill
& Melinda Gates Foundation and the Kofi Annan Foundation as well as the traditional
multilateral and bilateral partners), Policy interest in developing African agriculture has
risen in recent years. Through these policies, most African countries have succeeded in
raising awareness of and support for agricultural transformation. During the AU’s
Summit of AU Heads of State and Government (in Malabo, Equatorial Guinea in June
2014) under the theme “Agriculture and Food Security”, callswere made for agricultural
transformation on the continent, the importance of making agriculture attractive to the
continent’s youth, of which agro processing was highlighted. The time is therefore right
for coming up with practical solution to the challenges of African agricultural
transformation to help translate this clear policy intent into action (African
Transformation Report 2015)
A good summation of the (Agro Processing Summit of 2015) indicated Africa is
dominatedby agricultural sector, thusmaking the continent a prime location for the
establishment of agro processing industries. Processing of food adds value to agriculture
and edible animal products by grading standardization, packing and preserving of
produce so that products could be formed in such a way that they can be sold in market
of the country and abroad. It sees agro processing as being very vital since it creates
employment and helps in import substitution, foreign currency earnings from exports of
processed products. The agro processing value chain has high multiplier effects on the
economy. Agro processing is known for its potential to spur growth and create jobs
because of its strong backward linkage with the primary agricultural sector. Agro
processing is in essence manufacturing as it processes raw materials and intermediate

3
products derived from the agricultural sector. African governments and the private
sectors need to develop concerted efforts and strategies to support agro processing
ventures since they convert raw materials into manufactured products and reduce the
number of farmers practicing at subsistence level. Agro processing in Africa is in the
hands of the few conglomerates and this effectively closes doors for aspiring small holder
farmers and small business to benefit from the earnings that agro processing has to offer.
Agro processing can succeed if farmers and agro processors were able to access the
requisite funding to embark on sustainable ventures. Investment, ICT, access to markets
as well establishing and enabling environment also play a crucial role in making agro
processing a success story. (Agro Processing Summit, 2015)
Despite the efforts of most SSA countries to achieve greater economic diversification,
agriculture continues to dominate the economies of the majority of member countries.
The majority of the economies in the region are agriculture and natural resource based,
with up to 80 percent of the population in the SADC region, 48 percent in East Africa,
and 50 percent in West Africa being dependent on agriculture for subsistence,
employment and income (EIA, 2007).
Agro-processing sub-sector in SSA has experienced diverse significant growth since the
1990s. The expansion of processing sector witnessed by SSA is as a result of foreign
direct investment (FDI) from relatively rich countries, such as South Africa, into the
smaller and/or poorer countries (Reardon & Berdegué, 2002; Reardon et al., 2003). In
addition to FDI, urbanisation and concomitant food diversification have increased
opportunities for the processing sector in SSA. The development of the industrial agro-
processing sector in Western and Central Africa was predominantly promoted by the
need of processing export-oriented cash crops (such as cotton, coffee, cocoa, fish
4
canneries, etc.) or with the local processing of imported agricultural commodities
(milling industry, breweries, milk reconstitution, etc.).In most countries, industrial
processing of local products for local markets is often limited to a few products, for which
both western technology and a mass standardised market are available (e.g. sugar, tomato
concentrate) (Kanyili, 2003). In other words, industrial-scale food processing has been
present in ‘local-to-global’, as well as in ‘global-to-local’ value chains. But it often fails
regarding domestic, ‘local-to-local’ markets. This is due to the difficulty of inserting an
industrial segment into local food supply chains, which are characterised by the
atomisation of production on one hand and by a diverse and fragmented demand on the
other hand (Sautier, 2000). Urbanisation and subsequent food diversification is an area
of opportunity for processed African foods. The growing importance of the urban
environment reinforces the trend toward food diversification and increased demand for
processed food.
Agriculture in Africa is currently characterized by: (a) a large traditional smallholder
sector (over 80 %) with farmers generally uneducated and operating without use of
modern inputs or commercial orientation, and with low productivity; (b) a very small
large-scale and modern commercial farm sector (often owned by ethnic minorities,
settlers or foreign firms); (c) a tiny and struggling small and mediumsize modern
commercial sector owned and operated by nationals and (d) little domestic processing of
agricultural products and weak linkages between agriculture and other sectors of the
economy.( African Transformation Report, 2015)
According to the African Development Indicators, the average agricultural value added
per capita in Sub Saharan Africa was lower in 2008 than in the early 1970s. Haggblade

5
and Gabre Madhin (2010) also reported instance that SSA remains the only developing
region where per capita agricultural production has fallen between 1960 and 2005
Table 1 shows that Africa’s agro-industrial exports increased from about $14 billion in
1990 to $51 billion by 2008—an average annual compound growth rate of 7.2 %.Despite
this, the region’s world market share of agro-industrial merchandise imports fell by half
from 18 % to 9 %, partly reflecting the increasing importance of non-agricultural
products, especially oil and other mineral commodities. Trade in horticulture and
processed commodities exported for final use grew faster than total agro-industrial
exports, albeit from a low base. These commodities grew annually at 10.7 % and 10.8
%, respectively, compared with only 7.2% for total agro-industrial exports and 5.0% for
unprocessed commodities exported for processing. In part this faster export growth for
horticulture and processed commodities reflects the global shift in the commodity
composition of agro-industrial trade.

6
Table 1: Table 1.1, World total merchandise and agro-industrial imports from Africa by commodity category, 1990-
2008
Year ($
billion)
Total
merchan
dise
exports
Total
agroindu
strial
exports
Processed
comm -
odities
exported
for final
use
Semi-
processed
commodit
ies
exported
for
processing
Unprocessed
commodities
exported
for
processing
Unproces
sed
commodi
ties
exported
for final
use
Horticultur
e
1990 81.9 14.4 1.6 2.7 6.5 2.2 1.6
1991 76.7 13.9 1.7 2.4 6.0 2.2 1.8
1992 76.4 13.9 1.6 2.5 5.9 2.2 1.8
1993 68.4 13.5 1.5 2.3 5.8 2.1 1.8
1994 71.7 16.5 1.9 3.2 7.5 2.1 1.9
1995 83.6 20.3 2.5 3.6 9.3 2.9 2.2
1996 96.9 21.0 2.7 3.4 9.6 2.9 2.4
1997 97.7 20.9 2.7 3.5 9.8 2.8 2.2
1998 83.4 21.2 2.8 3.6 9.6 2.8 2.3
1999 87.6 19.9 2.8 3.0 8.7 2.8 2.6
2000 149.7 24.7 4.3 4.4 8.3 3.9 3.8
2001 146.9 25.7 4.6 4.9 8.0 4.1 4.1
2002 148.0 27.3 5.0 5.2 8.4 4.2 4.5
2003 182.3 32.3 6.1 5.9 10.4 4.3 5.6
2004 237.6 35.9 7.5 6.5 11.2 4.5 6.4
2005 301.9 37.4 7.6 6.5 11.6 4.8 6.9
2006 371.8 39.1 8.4 6.6 12.2 4.9 7.1
2007 430.8 46.4 10.0 7.7 14.3 5.4 9.1
2008 563.5 50.7 10.1 9.1 15.7 5.8 10.0 Average
annual
growth
rate (%)
11.3
7.2
10.8
7.0
5.0
5.5
10.7
Source: UNCTAD (2010)
Compared to its neighboring countries and more generally to countries of the CEMAC
(Commission of the Economic and Monetary Community of Central Africa), Cameroon
has a relatively diversified industrial base both in terms of variety of activity and in
company size, with a large number of SMEs and informal businesses.
According to the last general census of enterprises (RGE, 2009), Cameroon counts 12
154 companies in the secondary or manufacturing sector, which represent approximately
13 % of the total number of enterprises. The breakdown of manufacturing firms by sector
is the following: mining (0.2 %), food industry (6.1 %), beverages and tobacco (0.3 %),

7
electricity, water and gas (1.6 %), and others (11.3 %), including the textile, wood,
metallurgical and chemical industries. Manufacturing accounts for 22.8 % of total
employment and turnover represents 34.3 % of the national total. On average, each
company in this sector employs 8 people and generates an average turnover of XAF 300
million (CFA Francs).
1.2 Problem Statement
Cameroon is endowed with high Agriculture resources which for ages has been the back
bone of most African economies and African agriculture as a whole and Cameroon in
particular is currently based primarily on traditional smallholders producing food items
for home consumption or local consumption through traditional markets or for exports
in unprocessed forms which are always in bulk and of low value thus leading to low
earnings. (Dada, 2007).
Higher agro processing holds the capacity to improve development moving the core
agricultural activity from the farm gates to the agro industry sector and it services
represent higher level of incomes, productivity, nonfarm employment, especially in rural
areas. This scenario could be more feasible if a dynamic link exited between the farm
sector and the industry in the country. This situation is worsen by the fact that data is not
always made available and its unreliability. In fact both the farm and the industries lack
or do not provide data that could be used for their own measurement of productivity and
thus give them room for expansion. The government too has been trying to provide data
with its institution concern like the national institute for statistic but this data are
inadequate. The disconnection between the smallholder farmers and the Agro-Industries
has prohibited the traditional supply driven agro-production system from evolving into a
commercial demand driven agro-production system. Thus, there are little or no incentive
for the smallholder farmers to produce the desired quality and consistent quantity of raw

8
materials demanded by agro processors, which in turn has severely affected the
competitiveness of Cameroonian agro-industry in an increasingly globalized market.
Cameroon is for example importing large quantities of cereals to feed its people and meet
the demand of the brewing industry (UNIDO 2016)
Agricultural value added per worker in the least developed countries is $336 compared
to $1,060 in middle-income and $18,497 in high-income countries. This is due to the fact
that in the developing countries on average only about 38 per cent of products are
processed, this leaves the sector with huge untapped resources (UNIDO ANNUAL
REPORT 2014)Even though the country signed the Comprehensive Africa Agriculture
Development Program (CAADP) on July 17th 2013, it has not yet met the CAADP 10%
expenditure target as its agricultural spending in 2013 only stood at the CAADP annual
increase of agricultural productivity of 6%. All of this could be blame on government
slow pace in the implementation of its policies and administrative bottle neck
Cameroonian enterprises still support heavy regulatory and administrative constraints
than other regions, and property rights and investors’ rights are not well protected in the
country. Cameroonian authorities have put an accent on the facilitation of enterprise
creation, trade opening, fight against corruption and reduction of importation and
exportation cost (World Bank, 2009). According to the World Economic Forum report’s
on the global competitiveness in 2009, Cameroon was classified 18th in Africa and 111th
in the world on a total of 133 countries. The most considerable efforts were observed at
the level of macroeconomic stability (34th), recruitment and firing (40th), flexibility of
salaries (61th) and transparency of the government in driving economic policy (76th).
However, more efforts should be mobilised with respect to the improvement of
Institutions (112th); bureaucratic efficiency of the Government (102nd); "access to

9
financing" (125th) and the quality of infrastructures (121th) which are important for
investment (MINFI, 2010).
In the Growth and Employment Strategy paper (GESP, 2003) of the government of
Cameroon agricultural development features prominently as a way to reduce poverty.
Specifically, as the key income generating activity and the main source for economic
growth and poverty reduction in rural areas, this document highlight the importance of
economic diversification with a strong focus on agricultural development. However, the
developments since have shown how difficult changes in the sector are and how severe
the poverty situation still is. The development of agriculture faces structural constraints
and weaknesses that should have been adequately addressed since then
Full utilization of small agro-processing firms offers the potential for economic and
social benefits, including employment creation, income generation and reduction of post-
harvest losses. As the world’s poorest region, with half of its population living in extreme
poverty on less than $1.25 a day (World Bank & IMF, 2010), sub-Saharan Africa (SSA)
to which Cameroon belong is behind the curve in terms of industrialization with
manufacturing accounting for 15 per cent of GDP.
The estimated youth unemployment rate in Sub-Saharan Africa is one of the highest in
the world at 40 percent to which Cameroon belongs. Moreover, by 2040, Africa will be
home to one in five of the world’s young, and will have the world’s largest working age
population. According to the International Labour Organization (ILO), between 2000
and 2008, Africa created 73 million jobs, but only 16 million were for young people
(African Development Bank, 2012)), thus the is great need to open avenues for more
decent and sustainable jobs. With regards to two of our product under consideration, the
trade of Cocoa and coffee involves so many intermediaries who most often exploit the

10
farmers due to bad roads (no means to transport) or using false scales. Some of these
intermediaries (licensed buyers) sell to local bigger exporting organizations such as
TELCAR COCOA, sell to local cocoa processing companies in Douala or they export
themselves to Europe. A small amount of cocoa butter, paste and powder are produced
in Cameroon and sold/consumed locally or sold to neighboring countries.
Cameroon has the capacity to be an important palm oil exporter, but currently, domestic
production does not meet total demand, hence, the imports from other countries such as
Indonesia and Malaysia. Cameroon exports limited quantity of palm oil to its regional
partners in CEMAC(PAPI 2015) thus with those series of lop holes plaguing agriculture
as a whole and agro processing in particular the studies seek to the address the following
objectives.
1.3 Research Objective
The main objective of this study is to assess the contribution of the agro processing
sectors on economic growth of Cameroon case of coffee, cocoa and palm.
Specific objective
To assess the production trend of coffee, cocoa, and palm processed products
in Cameroon
To assess the impact of the cocoa agro processed sector on the economic
growth of Cameroon
To assess the effect of the coffee agro processed sector on the economic
growth of Cameroon
To assess the impact of the palm agro processed sectors on the economic
growth of Cameroon
To assess the combined impact of the coffee, cocoa and palm agro processed
products on the economic growth of Cameroon

11
1.4 Research hypothesis
Ho= the coffee, cocoa and palm agro processing sector have no significant
impact on the economic growth of Cameroon
1.5 Justification of the studies
Agriculture plays a pivotal role in the economy of Cameroon with a range of contribution
such as creating employment, income to farmers, foreign direct earnings and a host of
others, which are mostly of the rural farming population with little involvement of the
non-farming population, thus creating a gap between the two leaving the outcome to be
far from satisfactory compared to their counterpart who are involve in the value addition
of raw agricultural product especially through agro processing and thus gaining better
from such activities. Thus this study aims at awakening the consciousness of government
to set up better policies to improve on the sector. This will foster farmers readiness to
jump pass their usual tradition cycle of production and engage themselves in most of the
activity of the agro value chain especially agro processing so as to rip better and business
men to identify agro processing as a priority area for investing in the country. This study
also seeks to breach the gap of academic research as very few academic research has
been carried out in the field of agro processing in Cameroon.
1.6 Scope of Study
This study will be base in the Cameroon economy. Emphases will be laid on the coffee,
cocoa and palm processed products which covers revenue of output originating from
activities after postharvest and their relationship to the economic growth thus data on
various product, with respect to their processed output, total income per year and foreign
earnings and the GDP within the period 1980-2013 of the country will be used. This will
be gotten from the FAO statistics and world development indicators of the World Bank
12
report for the record period from 1980-2013. This period is considered because of the
limitation to get up to date data right up to 2017.
1.7 Area of Study
Cameroon being a sub Saharan country is located in Central Africa with a total land area
of 475,440 km2 and a population of about 22 million inhabitants. It is bordered by
Nigeria to the West, Chad to the Northeast, the Central African Republic to the East and
Equatorial Guinea, Gabon, and the Republic of Congo to the South. Cameroon's coastline
lies on the Bight of Bonny, part of the Gulf of Guinea and the Atlantic Ocean. Cameroon
is sometimes described as "Africa in miniature" because it exhibits all the major climates
and vegetation of the continent: mountains, desert, rain forest, savannah grassland, and
ocean coastland. Cameroon can be divided into five agro-ecological zones (Table 1)
distinguishable by dominant physical, climatic, and vegetative features. The climate
varies with terrain, from tropical along the coast to semi-arid and hot in the north.
Exceedingly hot and humid, the coastal belt includes some of the wettest places on earth,
as is the case with Debundscha, at the base of Mt. Cameroon, with an average annual
rainfall of about 10,287 mm.
Agriculture is the backbone of Cameroon's economy; employing 70% of its workforce,
while providing 44% of its gross domestic product and 30% of its export revenue.
Cameroon produces several agricultural commodities, for export and domestic
consumption. The most important of these, which vary from one agro-ecological zone to
another (see Table 1.2) are cocoa, coffee, cotton, banana, rubber, palm oil, sugarcane,
tobacco, tea, pineapple and peanuts for cash crops, and plantains, cassava, corn, millet,
sorghum, yams, potatoes, sweet potatoes, dry beans, and rice for food crops. Animal
husbandry is practiced throughout the country and is particularly important in the
Northern region

13
Cameroon, a triangular nation in central Africa precisely around the Gulf of Guinea.
Cameroon is a bilingual country that occupies a greater part of the equatorial rainforest
of West Africa with a wide range of forest resources. Presently, estimates of the
population of Cameroon by the Cameroon Officials and the World Bank (2010) as at
2010 stand at about 19,600,100 inhabitants distributed across the national territory in
over 250 ethnic groups, speaking English and French as well as other local languages.
Table 2: Table 1.2 Major crops cultivated and animal species reared in each agro-ecological
zone
Agro-ecological zones Main crop and animal production
Sudano-Sahelian
Maize, millet-sorghum, rice, cowpea,
soybean, onion, sesame, fruits,
cotton, cattle and small ruminants
High Guinea Savanna Maize, yam, cassava, sweet potatoes,
rice, cotton, cattle, pig, small
ruminants, poultry birds
Western Highlands Maize, beans, potatoes, rice, sweet
potatoes, vegetables, coffee, pig,
poultry, cattle, small ruminants, fisheries
Mono-modal Humid Forest Banana, plantain, cassava, cocoyam,
sweet potatoes, maize,
vegetables, cocoa, coffee, oil palm,
rubber, fruits, poultry, pig,
poultry birds, small ruminants, fisheries
Bimodal Humid Forest Plantain, cassava, banana, maize,
cocoyam, sweet potatoes, cocoa,
oil palm, rubber, coffee, maize, cocoa, oil
palm, fruits, poultry, pig,
fisheries, small ruminants
A brief review of the economic facts on Cameroon reveals that the main characteristics
of Cameroon’s economic situation are balance of payments deficits, current account
deficits, high external debt and high debt service ratio. An analysis of the country’s recent
macroeconomic achievement can be done by reviewing its economic performance during
three main periods. The period economic boom period (1963-1986); the recession period
(1987-93); and the period 1994-96 (post devaluation period) (Amin, 1998).

14
From 1963 to 1977, Cameroon experienced a period of steady economic growth with its
real GDP growing on average by 4.6% per year mainly as a result of global stability of
the terms of trade and rapid expansion in its agricultural exports (World Bank Group,
2008). Government revenue represented 17% of GDP, and total government expenditure
averaged about 18% of GDP, with the average overall budget deficit being maintained
at 1% of GDP during this period (Khan, 2011). In fact, this period usually constitutes
what is known in Cameroon as the economic boom period.
From 1978 when oil production started, the agricultural sector declined immensely
giving way to the oil and service sectors. Oil became the main source of foreign exchange
earnings improving Cameroon’s foreign exchange earnings resulting to high growth of
the economy. This growth accelerated in 1982 fuelled by the oil boom. In real terms, the
economy grew at a rate of about 8, 8 percent propelled by the oil sector accounting for
two thirds of export earnings. Resource inflow peaked at 22.14% in 1978 (Khan, 2011).
The government carried out large investment expenditures from domestic resources with
very little foreign borrowing, such that in this period, external financing represented only
6% of total expenditure. External debt was less than 27% of GDP in 1988/89 (World
Bank, 1989 and Khan, 2011).
From the Post-devaluation period (1994-to Present), the government of Cameroon
implemented some structural reforms related to the reorganization and cutting down of
the civil service, privatization of public enterprises, bank restructuring, and the
liberalization of domestic prices and interest rates based on IMF SAP prescriptions.
These reforms have contributed a great deal in stabilizing Cameroon’s economy. As
such, Output recovered steadily leading the restoration of Cameroon’s international
competitiveness. With this, Real GDP reversed from an average decline of 4% during

15
1987-93 to an average growth of about 2% during 1994-96 and to an average 5% in 1996-
2000. This growth in the GDP has been accompanied by a rise in private investment from
11% of GDP to 13% (World Bank, 1989 and Khan, 2011).
In recent times, the economy clamours about the vision 2035, which aims at making
Cameroon an emerging nation by the year 2035. The government of Cameroon has
elaborated a long term development strategy aimed at transforming the country into a
prosperous and democratic nation. The development scheme is expected to propel
Cameroon to an emerging economy. In the Growth and Employment Strategy Paper
(GESP) in which the fundamental principles to attain this economic vision of Cameroon
is imbedded, it shows that public expenditure will mainly focus in areas such as those
that aim at accelerating growth, improving access to infrastructure (energy, transport,
information technology etc), human capital development, innovative trade and
initiatives, vocational training, funding investment especially on agro processing etc.
1.8 Organisation of the Study
This study is organised into five chapters. Chapter one is the introduction. It contains the
background of the study, the problem statement, the objectives, hypotheses, the scope
and limitations, the significance and justification of the study. The theoretical, conceptual
and empirical literatures are dealt with in chapter two. This shows what some scholars
have established in relation to agro processing industries and in relation to economic
growth. Chapter three covers the methodology. It explains the various ways used in
gathering data and information for the study as well as the variables used in the research.
Chapter four covers the data analysis and discussion. These data are analysed using some
statistical tools, while chapter five focuses on the summary, conclusion and
recommendations of the study. The summary gives a synopsis of the study; the
conclusion is recapitulating the researcher’s finding, while recommendations offer

16
proposals on policies to better the agricultural activity, agro processing industries and
sustainable development.
1.9 Definition of key term
Agro-processing
Agro-processing is the “subset of manufacturing that processes raw materials and
intermediate products derived from the agricultural sector. “This includes products
originating from agriculture, forestry and fisheries.FAO1997
Agro-processing industries refer to those activities that transform agricultural
commodities into different forms that add value to the product. "Agro-based industries
are those industries which have either direct or indirect links with agriculture
(Bhattacharya 1980). Agro-processing industries, especially food manufacturing,
tobacco and textile processing dominate the commercial industrial sector. In this sense
the agro- processing could be defined as set of techno economic activities carried out for
conservation and handling of agricultural produce and to make it usable as food, feed,
fiber, fuel or industrial raw material. Hence, the scope of the agro-processing industry
encompasses all operations from the stage of harvest till the material reaches the end
users in the desired form, packaging, quantity, quality and price. Ancient Indian
scriptures contain vivid account of the post-harvest and processing practices for
preservation and processing of agricultural produce for food and medicinal uses. But,
inadequate attention to the agro-processing sector in the past put both the producer and
the consumer at a disadvantage and it also hurt the economy of the Country. (Kachru
2008)
Agro-industry

17
The agro-industry constitutes all the post-harvest activities involved in the
transformation, preservation and preparation of agricultural products for the
consumption of food and non-food products.(Wilkinson and Rocha, 2009) The agro-
industry consists of six main groups: food and beverages, tobacco products, paper and
wood products, textiles, footwear and apparel, leather products and rubber products.
Captured within agro-industry are a diverse range of primary and secondary post-harvest
activities, and involves varying levels of scale, complexity, labour, capital and
technology intensity
Agribusiness
According to Davis (1956), agribusiness is the sum total of all the operations involved in
the manufacture and distribution of farm supplies, production operations on the farm and
the strong processing distribution of commodities and items. Davis and Goldberg (1957),
view agribusiness as dividing the structural components of the production process into
substructures which are capable of being administered interactively. Three substructures
of this sector are the input; farm productions and the marketing section for processed
products. This concept implies the process by which corporate firms supply agricultural
inputs or purchase farm outputs and process them for onward distribution in an integrated
pattern. Agribusiness is grouped into three primary tri-aggregates: (i) farm supply (ii)
farm production (iii) processing distribution.
Operationalize definition of agro processing sector.
This is the part of the agro industry that commences from the post-harvest activity
involving activities like preservation, preparation, of both Simi-finish and finish product
to the hands of final consumer or for further production.

18
Economic Growth
Todaro and Stephen (2012) Economic growth refers to an increase in the capacity of an
economy to produce goods and services, compared from one period of time to another.
In other words, it is the change in national income over time, usually measured over one
year or better still; it is a positive change in the output, or production, of a country or an
economy. Economic growth can be measured in nominal terms, which include inflation,
or in real terms, which are adjusted for inflation. It is conventionally measured as the
percent rate of increase in real gross domestic product, or real GDP. Positive economic
growth signals a wealthier economy, and increased prosperity. There is increased
production, which means increased profits for the production companies. Increased
production also translates to increased tax collection for the government and, reduced
unemployment levels, and better prospects for the economy.
Increase in the capital stock, advances in technology, and improvement in the quality and
level of literacy, levels of infrastructure – such as transport and communication, levels
of corruption, educational standards and labour productivity, labour mobility, flow of
foreign aid and investment, level of savings and investment etc., are considered to be the
principal causes of economic growth. At the same time, the notion of economic growth
is often used interchangeably with economic development. In other words, some authors
view economic growth to be synonymous to economic development while others
distinguish it clearly from economic development. In this light the ideas or views of some
authors are here presented. The structuralist school of thought that emerged in Latin
America in the 1940s regards economic development as the structural transformation of
the underdeveloped economies so as to permit a process of self-sustained economic
growth. To them, economic development could only be achieved through the expansion
19
of those sectors of the economy which are neglected and with appropriate state
intervention. (Todaro and Stephen, 2012).
In the context of this study therefore, economic growth is simply regarded as the increase
in the output of the economy over time, measure by the value of the annual gross
domestic product (GDP) and the annual growth rate.

20
CHAPTER TWO
LITERATURE AND THEORETICAL REVIEW
2.1 Conceptual Literature
2.1.1 An overview of agro-processing firms
The industrial sector in developing countries is typically dominated by small
manufacturing firms. Such firms are generally characterized by poor physical
infrastructure, limited human capital endowment and unskilled labour with low levels of
education (UNIDO, 2000; Shifer et al., 2012 and Daniel et al., 2012). A large number of
these manufacturing firms are agro-related, using agricultural products as their main raw
material or those producing agricultural inputs (UNIDO, 2000). The manufacturing
sector contributes over 70% of total formal employment in Africa and 60% of
manufacturing value-added is from agro-related firms (UNIDO, 2000 and FAO, 2008).
These firms are often labour-intensive, especially those for food processing, textiles,
clothing, leather and footwear (FAO, 2008). A study on the patterns and trends of agro-
industrial products trade during the period 1990-2008, showed that the world agro-
industrial exports increased more than three-fold from $520 billion to $1.66 trillion an
average annual compound growth rate of 6.7%UNCTAD (2010),. Over the same period,
total world merchandise exports expanded almost five-fold from $3.1 trillion to $14.7
trillion, an average annual growth rate of 9 per cent. As a result, the share of agro-
industrial exports in total merchandise exports fell from almost 17% in 1990 to 11 % in
2008. The fastest growth rates were achieved by exports of processed commodities
destined for final use (7.7% a year) and horticulture (7 % a year), while unprocessed
commodities exported for processing grew by 5.8 % annually.

21
Processed and semi-processed commodities constitute the vast bulk of world agro-
industrial exports. Processed commodities destined for final use accounted for almost
40% of total agro-industrial exports in 2008. Processed commodities had the highest
share of agro-industrial exports, and also had the fastest growth rate (UNCTAD, 2010).
The share of semi-processed commodities exported for further processing declined
slightly from 30 % in 1990 to about 27 in 2008. Taken together, trade in processed and
semi processed commodities accounted for two thirds of global agro-industrial exports
in 2008.
The value and rate of growth of exports of different agro-industrial commodities by
major regional groups and countries in the same studies by UNCTAD (2010) indicated
that the EU and Asia dominate processed and semi-processed commodities exports with
a total of $165 billion and $157.2 billion in 2008, respectively. The world’s top exporter
of unprocessed commodities destined for processing is the US, with total exports worth
$58.6 billion in 2008, followed by Latin America and the Caribbean with exports worth
approximately $37 billion in the same year. During the period2005-2008, exports of
unprocessed commodities destined for processing grew faster than exports of other
commodity groups in all the three regions and the US, partly reflecting the hike in food
prices that occurred during this period.
Within East African countries, agro-processing firms account for more than 80% of
manufacturing firms, but these firms are capable of processing only 28% of the
agricultural produce (EAC, UNIDO and FAO, 2011). The remaining agricultural
products are sold in raw form or lost. Such a low level of processing is due to an
unreliable supply of good quality and inadequate quantity of raw materials which are too
scattered to reach processing firms (EAC, UNIDO and FAO, 2011). Long distances

22
between producing areas and the location of agro-processing firms, coupled with the poor
state of transportation infrastructure also contribute to the small percentage of
agricultural produce being processed.
In Tanzania there are only a few large agro-processing firms focusing on regional and
international markets meanwhile the sub-sector being dominated by small and medium
sized firms. Over 90% of these firms are characterised by low technology, undertaking
semi-processing of products that are sold in the local market (Tiisekwa et al., 2005a and
Hawassi, 2006). This is in contrast to Kenya’s agro-industry which accounts for more
than 30% of export values, and also constitutes 70% of the value of processed products
coming from medium sized and large agro-processing firms (URT, 2012a; FAO, 2008;
MOTI, 2007 and Wangwe, 2002).
In Cameroon, agriculture contributes more than half of the country’s non-oil export
revenues and employs almost 60 % of the economically active population (World Bank,
2009). Moreover, agriculture accounts for nearly 20.2% of gross domestic product
(GDP) (Kessous & Ekoka, 2008). About 80 % of the population live in rural areas most
of who rely on agriculture-related activity for their livelihood (Fambon et al. 2000). The
agro-industry is therefore an engine of economic growth, welfare enhancement, and
poverty reduction. The so far largely untapped potential can be utilized much better by
the full implementation of the growth and employment strategy (DSCE 2009)
2.1.2 Coffee Processing Sector in Cameroon
Cameroon was once reportedly the second leading coffee producer and exporter in Africa
with annual production of as high as 132,000 tons in 1986. Since then, the production
has been steadily declining with swinging annual production that went down as low as
36, 000 tons in 2010. According to ICO statistics, the production over the last 12 years
(2000 – 2011) ranged between 66,780 in 2000 and 36,480 in 2010 with an annual average

23
of 49,505 tons indicating a trend of stagnation. The productivity is also very low, about
204 kg/ha for Arabica and 340 kg/ha for Robusta according to early reports. However,
data collected from the farmers and divisional ministry of Agriculture Office shows
lower figures, 100 kg/ha for Arabica and 300 kg/ha for Robusta. (Amadou, 2007)
2.1.3 Cocoa Processing Sector in Cameroon
According to FAOSTAT (2012), Cameroon is ranked 14th in terms of world cocoa
production with about 256,000 metric tons. Cocoa also ranked 3rd in terms of the
country’s export commodities. Cocoa is one of the best crops to increase income in
households within forest communities in Cameroon. Except the three northern regions,
cocoa is produced in all the other regions but with highest production (about 80%) in
three of the regions; Southwest (35%), Centre (28%), and South (16%). Unlike other
cash crops like oil palm and rubber, only smallholders are involved in cocoa activities.
A cocoa development society (SODECAO) exists, that supports extension services to
farmers. Production trend in the country has been on a steady rise from the period 1960
(600,000tons) to 2005 (2,400,000 tons) and the country contributes 4% to world cocoa
production.
After harvesting and extraction of the beans (mostly done manually by family labour or
hired labour), the beans are dried using ovens and then put into bags. These are sold to
intermediaries who most often exploit the farmers due bad roads (no means to transport)
or using false scales. Some of these intermediaries (licensed buyers) sell to local bigger
exporting organizations such as TELCAR COCOA, sell to local cocoa processing
companies in Douala or they export themselves to Europe. A small amount of cocoa
butter, paste and powder are produced in Cameroon and sold/consumed locally or sold
to neighboring countries as pointed out by. (Program of Accompanying Research for
Agricultural Innovation (PARI, 2015)

24
It is worth noting that local processors purchase a negligible quantity of cocoa and coffee.
A very small fraction of cocoa output goes to some local industries (CHOCOCAM,
SICCACAO) for transformation into cocoa butter and chocolate, part of which is also
exported. But we are concerned with the export of cocoa beans, which is a homogeneous
product. Over the study period about 76% of all cocoa produced was exported. According
to (Khan, 2002) cocoa is a good indicator of the performance of the agriculture sector.
Restrategising the cocoa sector will secure high quality raw product for agro-processing.
A national cocoa policy will contribute to this effort (Dada, 2007). As agricultural
producers in Cameroon are the only socio-economic group for which poverty has
recently increased, agro-processing development and agribusiness promotion give hopes
for these producers and for the regions in which they live (World Bank, 2009).
Import dependency on food and export dependency on few products are realities in
developing countries. In Cameroon new strategies and policies have been adopted
purposefully for her Vision 2035. Some of the objectives are directed towards agro
industrial development for overall economic growth, poverty reduction, and global
market integration. However, the huge agro-based potentials of the country are not used
despite favourable endowment factors and comparative advantages as highlighted by
(Agribusiness for Africa’s Prosperity, 2012)
2.1.4 Palm Processing Sector in Cameroon
The oil palm a perennial tree is an important agro crop (Rieger, 2012).It is native to the
countries bordering the Gulf of Guinea (Hoyle and Levang, 2012), with the main belts
running through the southern latitudes of Cameroon, Ivory Coast, Ghana, Liberia,
Nigeria, Sierra Leone and into the equatorial region of Angola and Congo (Bakoume and
Mahbob, 2006; Carrere, 2006). In the wild, the oil palm fruit occurs in two forms, termed
dura (with a large kernel) and pisifera (having no shell and yet sterile). Tenerais a hybrid

25
from dura and pisifera, and the most cultivated variety because it produces fruits with
higher oil content (Rieger, 2012). It is the preferred commercial variety cultivated by
agro-industries in Cameroon and smallholders close to the agro-industrial areas (Hoyle
and Levang, 2012).
Processing oil-palm fruits for edible oil has been practiced in Africa for thousands of
years, and the highly colored and flavored oil produced is an essential ingredient in much
of traditional West African cuisine. This crop is versatile and its products [such as palm
oil, sauces, soap, wine, fertilizer (ashes), roofing (leaves), building material (trunk),
medicines (roots)] are of great economic value in West and Central Africa (Carrere,
2010; Ibitoye et al., 2011). For centuries, oil palm has provided local communities with
a large number of benefits. Its primary purpose until now has been the extraction of palm
oil (from the flesh of the oil palm fruit) and palm kernel oil (from its kernel or seed) for
the production of edible and industrial oils (Carrere, 2006). Palm kernel waste (after the
oil has been extracted) is also used as animal feed and in co-firing in electricity
generation. The palm oil industry is worth at least USD 20 billion annually (Hoyle and
Levang, 2012).
The production of palm oil can be grouped into traditional (artisanal) and industrial
milling (Carrere, 2010). Modern processing of oil-palm fruit bunches into edible oil
(CPO) may be categorized into traditional methods, small-scale mechanical units,
medium-scale mills and large industrial mills depending on the degree of complexity. In
Cameroon, the production is stratified in three sectors: an agro-industrial sector,
smallholders (SH) in contract with agro-industries and a traditional independent artisanal
sector (Bakoume et al., 2002).

26
The traditional process is simple, but tedious and rather inefficient. Red or Crude palm
oil (CPO) is an important source of vitamin A (Atinmo and Bakre, 2003) obtained from
the transformation of loose palm nuts. The process entails activities that provide many
job opportunities to rural people at different levels (skilled and unskilled, formal and
informal). This helps in income generation and poverty reduction in the rural setting. The
women are involved in different stages of production and commercialization of CPO to
assist in the upkeep of their families (Ibeckwe, 2008).
Cameroon is ranked the world’s 13th largest producer of palm oil. In 2010, it was
estimated that Cameroon produced 230,000 tons annually (MINADER, pers.com). Oil
palm production in Cameroon increase following the drop in the prices of cocoa and
coffee in the early 1990s, which at that time were the major commercial farming crops
in the country. This caused many smallholders in the ecologically suitable areas to switch
to planting oil palm (Ngando et al., 2011).
Consequently, the purchase of germinated oil palm seeds (chitted nuts) by small and
medium-sized farmers at the Centre for Oil Palm Research at La Dibamba (Cameroon)
rose from 20% of the total production in 1996 to an average of 60% during the past 10
years. It is thus estimated that about 5,000 ha of oil palm were planted by small land
owners and medium-sized farmers each year during the last decade, making a total of
about 90,000 ha for the non-industrial palm grove in Cameroon (Bakoume and Mahbob,
2006). This increase in the number of oil palm smallholders and oil palm plantations has
equally resulted in an increase in the number of artisanal oil palm presses in the palm oil
production basins in Cameroon. The upsurge has been more in communities around the
oil palm agro-industrial corporations of SOCAPALM, CDC and PAMOL Plc, probably
initiated by the operations of the corporations.

27
2.1.5 Importance of Agro-Processing sector
Agro-processing has great important in developing countries for its role in generating
employment and income. Many people are directly employed in firms that process
agricultural products and in servicing processing machines (Nambbodii et al., 2003;
URT, 2008; Lazaro et al., 2008; Da silva et al., 2009). Moreover, the sub-sector generates
backward employment linkages by creating markets for raw materials from agriculture
(Hawassi, 2006; Khosla and Sharma, 2012; Eze et al., 2013). At the same time forward
employment linkages are generated as people are engaged in supplying processed
products to the market. In addition to generating employment and cash income, agro-
processing firms reduce postharvest losses. The shelf-life of processed products is higher,
which facilitates storage and transportation, therefore making agriculture more profitable
both at the processing and marketing levels (UNIDO, 2004a, IMF, 2006, Lazaro et al.,
2008, URT, 2008, ADBG, 2010, Vilane et al., 2012 and Karthick et al., 2013). The
ability of agro-processing firms to promote low-cost preservation, processing, marketing,
and transportation of food products compared to imported processed food helps to
provide the poor with cheaper food alternatives, thereby preserving their income. For
instance maize flour that is processed by local firms is cheaper than imported flour.
It has been demonstrated that, agro-processing firms have the highest contribution
towards processing agricultural inputs such as seeds grains and the firms have
employment multiplier effects in terms of labour productivity and total factor
productivity (Luthfi, 2007). Agro-processing could therefore be a powerful means for
generating employment and improving agricultural productivity in Tanzania as it
provides a strong link between primary production at the farm level, processors, final

28
consumers and other services linked to agro-processing firms (Hawassi, 2006 and URT,
2008).
Furthermore, several studies FAO (2004) and (2008) have shown that small agro-
processing firms serve as a catalyst which stimulates rural development from different
dimensions, such as health, education, development of infrastructure such as roads,
electricity and water thereby helping to reduce the rural–urban income disparity. Small
agro-processing firms also enhance the viability of small scale farms by providing market
outlet for their products, often within the vicinity of rural areas.
The overall potential of agro-processing is huge as it can:
Increase the value of crops of poor farmers and thus yield higher returns;
Expand marketing opportunities;
Improve livelihoods of people;
Extend shelf-life of commodities;
Improve palatability of commodities;
Enhance food security;
Overcome seasonality and perish ability constraints; and Empower women who
are often involved in agro-processing.
Similarly, agro processing provides great possibility for conversion of farm produce to
consumer goods and in the process limiting wastage, increase shelf- life resulting in value
addition and increase income transfer to the farmers from different categories of
consumers, as the processed commodities has broader market (Chengappa 2004 ). Agro-
industries is also viewed as a ‘safety valve” that needs to be built within rural areas to
absorb surplus labour and provide assistance to the problem of large scale disguised
unemployment. At the same time Srivastava (1989) brought out the fact that, agro-

29
industry provides the crucial farm industry connections which helps accelerate
agricultural development by creating backward linkages ( supply of credit, inputs and
other production enhancement services and forward linkages ( processing and marketing
), adding value to the farmers produce, generating employment opportunities, and
swelling the net income of farmers. This in turn motivates the farmers to improved
productivity and further opens up possibilities of industrial development. Also, the agro-
industry creates new demand on the farm sector for more and diverse agricultural outputs
which are more suitable for processing. At the same time it can open up new crop and
livestock opportunities to the farmers and thus increase the farm income and employment
(Austin, 1981).
2.1.6 Factors Constraining Agro-Processing Industries in Africa
(Otieno and Mwangola 2006) outline some factors that constrain agro-processing in
Africa, They attributed the depressed economic conditions that prevailed in the world in
the 1980s and parts of 1990s and the multiplicity of continuing crises in Africa to have
had and continue to have negative impact on the processing of African raw materials.
The hope that African countries would progressively increase exports of its raw materials
with increasing value added has not been widely realized. Thus, the constraints inhibiting
the growth of Africa’s food industry include:
Inadequate agricultural, industrial and economic policy
Weak integration between agriculture, manufacturing and trade
Conceptual mistakes in the establishment of enterprise
Technological inadequacies
Poor demand stimulation

30
Inability to adapt to the increasing sophistication of international markets
including the development of new packing materialslack of inter-sectorial
integration between large and small enterprises, low level of domestic sub-
contracting
Inadequate infrastructure
Debt service burden, inflation budget deficits and import dependence of industry
2.2 Empirical Literature
Agro processing has for ages attracted a lot of scholastic attention due to its contribution
of the economic growth of countries and most especially in aspects such as employment
creation, income generation, value addition to agricultural products and export earnings
amongst other which has not left the attention of major conferences, reports of
international organization such as FAO, UNIDO, IMF, AU a host of others as mention
by their works below.
According (IFAD, 2000) Agro-industrial development has a direct bearing on the lives
of the poor. Significantly it promotes increased employment in agro-industrial activities,
and leads to an augmented demand for primary agricultural products. Early stage agro-
industry is predominantly labour-intensive and provides various opportunities for self
and wage employment. It also recommends to Sub-Saharan Africa’s which have a
majority rural population made of youth people to invest in agribusiness as a priority
source employment opportunities and livelihoods,
In addition to encouraging economic growth, an agribusiness development path would
contribute substantially to poverty decline and improved social outcomes, forming part
of a socially-inclusive development strategy (Yumkella, 2011). In the same light the

31
World Bank confirms strong synergies exist between agribusiness, agricultural
performance and poverty reduction in Sub-Saharan Africa. Thus see efficient
agribusinesses to stimulate agricultural growth and strong linkages between
agribusinesses and smallholders can decrease rural poverty, giving that agro-industry is
fairly reachable and can be pursued at small-scale due to relative low start-up cost and
has low technical obstacles to entry. Thus Small and medium enterprises (SMEs) as most
of them are called remain important actors in the largely informal networks that dominate
urban Sub- Saharan Africa and have proved fairly adaptive amidst various challenges.
In terms of employment creation and income generation among agro-processing firms,
(Mutabaziet al.,2007) in their evaluation on employment creation in southern highland
zone of Tanzania through correlation analysis, use descriptive statistics such as
percentage to capture the relationship between the numbers of new jobs generated in
relation to the volume of products processed in small agro processing sub-sector. Their
findings indicated that the number of paid labour in a firm in southern highland zone had
a positive and significant effect on the volume of marketed milk.
(Rijkers, 2009) in the same light analyze employment growth rate of manufacturing
enterprises in Ethiopia using ordinary least square regression analysis. His model limited
the annual employment growth rate as a dependent variable which was regressed against
the age of a firm, activities performed by the firm, management effectiveness and the
geographical location of a firm (urban or rural). The results showed that rural firms grow
less quickly than urban firms and rural firms are less labour productive than urban firms.
(Benavente et al., 2008) in his case find out employment growth using ordinary least
square regression method to assess how the growth of products sold was influenced by
investments and products innovations. His findings indicated that product innovation had

32
a significant positive effect on employment, concluding that emphasis on innovation is
important for effective jobs creation.
(Myint, 1971) on his part highlighted that the logic of developing agro-based industries
by not-well to-do developing countries on the ground that the export potentiality of
processed agricultural product present better prospect than the raw products. The slow
growth of agriculture in most less developed countries is due to the poor terms of trade
for their agricultural products in the world trade. Processed labor cost involved in
processing the raw agricultural products in the developing countries. Agro industry can
play a considerable role in pro-poor growth policies, particularly in developing countries,
like Bangladesh where 75 percent of the poor live in rural area (UNIDO, IFAD and FAO,
2008). As possibilities for income creation are restricted in rural areas, rural non-farm
earnings from trading, agro-processing, manufacturing, commercial and service
activities comprise a significant part of household income. As a whole, non-farm earning
account for 30 to 45 percent of rural household income in developing countries (UNIDO,
IFAD and FAO, 2008). The expansion of agro-industry have an vital impact on the local
agricultural sector as well as the means of support to small holder farmers, provided they
can produce on a steady basis, supplying consistent quantity and quality
(Verma and Kesavan, 1986; Sivakumar et al.(1999) suggested that added employment
may be created by using policy options in the agro-industry which would mostly benefit
the rural areas and that would reduce the movement of labour to the urban areas.
(Dhiman and Rani, 2011) similarly reported Agro based industry which is regarded as
the emergent sector of the Indian economy due to its large prospective for growth and
probable socio economic impact (specifically on employment and income creation).
Some assessments suggest that in developed countries, about 14 % of the total work force

33
is involved in agro-processing sector directly or indirectly. However, in India, only
approximately 3% of the work force gain employment in this sector signifying its
underdeveloped state and vast unexploited potential for employment. Therefore, there is
need to make an overall development among all sections of the society with emphasis in
rural agro based industrial units. The agro-industry creates new demand on the farm
sector for more and varied agricultural outputs which are more appropriate for processing
and it is key for raising export earnings, generating employment and achieving food
security (Babu, 2000). An agro-processing plant can generate new crop and livestock
openings to the farmer and thus improving the farm income and employment.
Particularly the food and beverages processing sector remains significant at all levels of
economic development (Wilkinson and Rocha, 2008). As potentials for income
generation are limited in rural areas, rural non-farm earnings from agro-processing and
its trading embodies a significant part of household income. In terms of employment
structure, rural industries (manufacturing) accounts for roughly one fifth of rural non-
farm employment, comprising mostly of occupations in agro industries (UNIDO, MAD
and FAO, 2008). This sector provides the small farmers the prospects to expand their
incomes through the value added generated by processing their own agricultural products
(Schejtman, 1994). The significance of agro-industry for employment is further
underscored by high and increasing levels of female participation to more vulnerable
forms of work (casual, temporary and seasonal), that attract lower pay and more labour
hours for preparation and processing.
In agrarian countries, a higher agribusiness/ratio holds a capacity for diversification and
socioeconomic development as Da Silva et al (2009:49) have rightly observed that; to
increase productive diversification and gain higher levels of productivity and income
generation, the most be movement within the fundamental economic activities from the

34
farm gate to the agro-industrial sector and its services, as well as higher shares of non-
farm employment in rural areas.” This scenario is made possible with an active link
between the farm sector; rural industries and all associated activities.
Pawa(2014) examined the role of agribusiness in all its tri-aggregates to the socio-
economic development of the rural sector in Nigeria. His work acknowledges the
position of agriculture as it employs a majority of the rural population in a principally
agrarian society like Nigeria. He consult mostly from empirical literature on agribusiness
and agro-industrial linkage. He revealed that, the farm, off farm and processing
components of agribusiness have the ability of generating jobs, provision of income,
poverty reduction and infrastructural growth. His study however detects poor policy
articulations, lack of working capital, poor infrastructure, lack of ideology etc. as major
hindrances to effective agribusiness. Thus his paper recommends a robust political will,
a sound ideological frame, adequate funds among other measures to develop a strong
interface between agricultural policies and politics in achieving a sustainable
agribusiness as an authentic tool for rural development in Nigeria
(Ehui and Delgado1999) recounts that, Processing of meat and crops represents a large
share of manufacturing in Sub-Saharan Africa (SSA). They assessed empirically the
impact of hypothesized productivity change in agro-food processing on growth, trade,
employment, and input and output prices in SSA. They used 13 commodity, 7region
version of the Global Trade Analysis Project (GTAP) and applied the general equilibrium
model with a 1995 database. Results are compared to impacts off actor neutral and biased
technical change in primary agricultural production-grains, non-grain crops, and
livestock--overall and with respect to the agro food sector itself. Increasing the
percentage of total factor productivity in primary agricultural production, will show

35
different criteria’s having much greater favorable impacts than the same increase in any
form of technical change in processing, even when attention is given only to the welfare
of people in the agro-food processing sector itself. Technological improvement in the
non-grain high value agricultural sectors such as horticulture and livestock are second-
best, but still powerful promoters of increased welfare.
(Quddus, 2009) evaluated the contribution of agro-industry in the Bangladesh economy.
He used the input-output tables of the year 1993-94 and 2001-2002 in Bangladesh were
used to calculate inter-industry linkage indices and multiplier effects. His result indicated
Agro industry contributes a substantial portion of national income and the prospect of
employment generation was in an increase to a higher extent for the food processing
sector, tanning and leather finishing, leather industry, saw milling and wooden furniture.
He found out that Food processing, fish processing, tanning and leather finishing, leather
production, livestock, and poultry were the essential sectors of the Bangladesh economy.
The dependence on input by some of the agricultural production sectors increased from
early nineties to early two thousand. Tanning and leather finishing, leather processing,
edible oil, food processing and paper industry draw heavily on other primary industries
across a broad range of supplying industries and these sectors have powerful motivation
to the economy than the other sectors. Most of the agricultural processing sectors
including some agricultural production sectors have better prospective to increase
income. All the agro-processing industries except edible oil generated high income of
which tanning and leather finishing, jute bailing, rice milling and sweeteners generate
high level of income. The sector livestock followed by poultry where found to generate
the highest employment. The agro industries that have the largest multiplier values were
the edible oil, leather finishing, rice milling, ata and flour milling and fish processing.

36
In their findings (African transformation report 2014) declared agriculture to make up
the bulk of most African economies, and with most of the poor relying on subsistence
farming for their livelihoods, emphasize Africa’s economic transformation has to include
modernizing agriculture to increase the productivity of smallholders. Using agriculture
as a base for manufacturing and services, mainly by increasing agro processing and other
agribusiness, will create jobs, particularly for women and youth and will also improve
the demand (and prices) for what smallholders produce.(African transformation report
2014) also adds that Agro processing typically offers a big step up in generating
employment, income, and foreign exchange, which can often be unlocked by well-
designed strategies to overcome obstacles that thwart domestic players from emerging,
reaching scale, and becoming globally competitive.
(Kaldor, 1975, 1995) argued that industrial growth was constrained by the demand
growth of the agricultural sector in poor developing countries and hence agriculture
revolution (increasing productivity) was necessary for industrial development, not only
because it created the extra wage goods for the growing urban population, but also
because it created the circumstances for autonomous demand of the goods produced by
the manufacturing sector
As mention in the AGENDA 21 Industrial growth is an unquestionable pre-requisite of
sustainable development. Most development forums in Africa putt at the top of their
agenda, economic transformation, environmental sustainability and poverty reduction.
They adopt this general consensus for the need for rapid industrialization. It is, however,
to be noted that general growth in industry has been slow. Positive performance in a few
countries and an increase interest in foreign direct investment in African industry
indicates a potential for industrial take-off. (UNIDO, 2006)

37
Cameroon vision 2035 has as one of its priority Agro-industrial development, which
depends on a combination of the available potential and on policy choices. Agriculture
and agro-industry are important value-adding business sectors, with a highly positive
development impact, and with a great contribution to a country’s economic growth. In
its Vision 2035 Cameroon has emphasizes this role. Given that one of the development
objectives of the Vision 2035 is to reduce poverty to an acceptable level in the society
(DSCE 2009), the agro-industry sector can play a paramount role in pro-poor growth
strategies.
The development of agro-industry will have an important effect on the livelihoods of
rural farmers, for example, creating opportunities for income generation and thus
representing an important mechanism for rural poverty reduction. On the other hand,
agro-industrial development can also contribute to broad based industrialization and to a
diversification of the export base.
2.3Theoretical Framework
2.3.1The theory of Rosenstein-Rodan on industrialization
This theory seeks to explain the importance of industrialization in relation to employment
creation and income generation. The theory assumes returns that spill-overs from
industrial activities lead to increased returns from other linked sub-sectors (Hoff, 2001;
Fan, 2002; Hossain and Papadopoulou, 2010). This phenomenon is also referred to as
the multiplier effect. Based on this theory, at various development investment stages, one
sector may increase the profitability of other sectors due to multiplier effects of services
and goods from those industries, hence increasing the number of people involved in
corresponding activities and thus creating new jobs (Hoff, 2001 and Fan, 2002).

38
The theory elaborates that, demand effects depend on two factors: economies of scale
with respect to labour and some non-tradable input (raw-materials). For example, if
intermediate goods for processing firms are non-tradable (they are not imported) they
will be obtained and used within the country hence reducing importation cost. Use of
such inputs increases returns from production processes (Hoff, 2001). If the industry is
expanded, it would increase the demand for non-tradable inputs thus stimulating more
production of these in-puts, hence increasing production of final goods which creates
more income and employment through spill-over effects.
2.3.2 The theories of balanced / unbalanced growth
In their book “Agro industries & economic development” Kar and Mishra (2004)
stressed that certain industries which make use the produce of agriculture directly or
indirectly are considered more desirable in the context of the economic development of
the country. Such a development has a two way effect i.e. the Agricultural sector helps
agro-processing industries by supplying them raw materials directly and it facilitates the
growth of those types of industries which produce several inputs like fertilizer, pesticides
and agricultural implements that help to promote the productivity and expansion of
agriculture
2.3.4 The cross country model
(Puga and Venables1998, 1999), Using a cross country model, describes the process of
development to be influences by fast industrialization. Whereby the industry spreads
successively from one country to other. At the beginning, the development of industry in
a country has the ability to increase wages with respect to other underdeveloped
countries. Beyond a certain level, the wage gap stimulates the transfer of a portion of the
industry towards a marginal country in which upstream-downstream relations ensure the

39
extension of the process of industrialization. As wage gap increases from the first
industrialised countries, other countries follow the trend, this way; the process of fast
industrialization then extents from one country to the other. Within the confine of our
studies if this theory is applied if industrialization is giving a priority through agro
processing by setting up of farm settlement schemes with necessary infrastructural
facilities, such as accommodation, access roads, water, energy, communication, health
care and integrated network of satellite, storage facilities to reduce post-harvest losses,
ease transportation, reduce rural-urban migration and motivate more people to take to
farming and related activities, it led to higher income, export earnings and overall
economic growth.
2.3.6 Managing productive transformation:
A structuralist macroeconomic policy framework
The Structuralist economics views change in economic activity composition as among
the major movers of growth and employment and income, thus their ideology is focused
on exploring the relationship, by taking a holistic approach that considers the role of
macroeconomic, trade, technology and sectorial policies. The structuralist system put
growth, employment and poverty reduction as a key role in the strategy to facilitate
dynamic restructuring of production and trade, and argue that “growth can only address
poverty concerns if it generates new jobs to keep pace with a rising labour force”
(Ocampo, Rada and Taylor, 2009, p. 1). From this perspective, diversification within and
across sectors, rather than specialization, is a key driver of income growth in low-income
countries (Imbs and Wacziarg, 2003; UNCTAD, 1964). If government take agro

40
processing as a priority as advised by the structuralist that changing economic activity
component is a major boaster to growth then the economie of Cameroon must move its
agricultural sector from the farms gate to nonfarm activities to acquire the much needed
economic growth, reducing unemployment and poverty.
2.3.7 Industrialization through global value chains
Global value chains (GVCs) is fast becoming a global economic agenda, which account
for an increasing share of international trade, output and employment. The advent of
these chains has been facilitated by the “fragment ability” of production as a result of
advances in technology, and by the liberalization of trade and investment in current
decades (Lall, Weiss and Oikawa, 2005). It has also been fostered by competitive
strategies adopted by multinational enterprises, which have sought to locate labour-
intensive and low value added tasks in low-wage countries while retaining high value
added activities in high-wage countries. GVCs provide a stepping stone for firms and
workers in developing countries, offering openings to integrate into the global economy
and initiate the path of catching up.
In the light of productive transformation and industrial policy, value chains have the
ability to become important learning networks and promoter for the generation of
capabilities, productive capacities and productive employment. Performance and
productivity are improve by learning within the value chain, which stimulates productive
transformation, the creation of jobs and a dynamic catching-up process in the economy
through spillover effects. UNCTAD also took a critical look to the issue, cautioning
countries of the dangers of “trading more but earning less” in the context of GVCs
(UNCTAD, 2002). Park, Nayyar and Low (2013); Elms and Low (2013). Also argued
that since the early 1990s the expansion of GVCs has played a vital role in moving the

41
patterns of international trade and has significantly affected the processes of
industrialization and deindustrialization. Trade in intermediates rather than in final goods
and services has grown rapidly and, as a consequence, the import content of exports has
risen. They claim that economic development within the framework of GVCs takes the
form of “vertically specialized industrialization”, that is, a process of advancing into
higher value added tasks and functions, either within a given chain or in new chains that
generate more value added as a whole. However, they recognize that this is not an
automatic process and that, even when it is deliberately and successfully pursued, the
economic gains may not be matched by wider social gains.
2.5 Gap identified
Due the complex nature of science and academics and bearing in mind that the most
constant element in life is change, this has left science and work of academics to be in
exhaustive thus giving room for new findings to complement existing findings. Though
may scope of search might have been limited with regards to exploration very little was
found concerning Cameroon. Thus this study though with its short comings seeks to
bridge the gap of literature reviewed in our studies. The first gap identified is that very
little has been said about agro processing industries and its impact on economic growth
of Cameroon which in one way this study answer. Secondly, most of the studies carry
out an overall impact of agro processing in the economy like Quddus (2009) who
evaluated the contribution of the agro-industry in Bangladesh using the input-output
table, (Ehui and Delgado1999) recounts the Processing of meat and crops accounts for a
large share of manufacturing in Sub-Saharan Africa (SSA). They assessed empirically
the impact of hypothesized productivity change in agro-food processing on growth, trade,
employment, and input and output prices in SSA, using a 13 commodity, 7region version

42
of the Global Trade Analysis Project (GTAP) applied general equilibrium model. But
our study looks at three major sub industries in the agro processing industries which is
so important in the assessment of sectorial performance in an economy since looking at
the overall economy will give room for policies that effect the entire economy .
CHAPTER THREE
METHODOLOGY OF THE STUDY
3.1 Research Design
Given the time series causal nature of the study, we adopt longitudinal research design
which employs continuous measures to follow particular variables over prolong period
of time. This research design is observatory in nature with the collection of data from
variable under consideration having no influence from the researcher. It has the ability
to follow changes that occur over time in variables within models.
Nature and Sources of Data
Data used in this study are secondary data collected from the World Bank’s World
Development Indicators (WDI, 2017) and FAO. Data on various agro processed product
is collected from FAO data base and economic growth are collected from the WDI.
Within the context of the food and agricultural organisation (FAO stats 2016),
The variables under consideration are total agricultural export earnings in the various
agro processed product, export earnings from the various agro processing sector, output

43
of the various agro processing sector. These sectors, their measures and sources of data
for them are as summarised on table3.1 below;
Table 3.1 shows the different indicators that were used and their sources. Note should be
taken that the various sectorial performance are represented by the proxy in table 3.1
Table 3.1 Definition, Measurement and Denotation of Variables
Variable Proxy Description /
Measurement
Denotation Source
Tonnes PER YEAR Out FAOSTAT
Agro
processing
Sectors (Cof
S, Coc S, palm
S)
income Thousand US
dollar
Inc FAOSTAT
Economic
Growth
GDP GDP Current
Local Currency
Growth WDI
Source: Author’s Conceptualisation, 2017
3.1 Model Specification
To measure the effect of the agro processing industry on development, the Cobb Douglas
production or a model of production functions that incorporated agro processing industry
in the context of growth theory was used. Considering the aspect of agro processing
under investigation and on the basis of available data, each of estimated variables was
measured using the following;
Income (inc) =f (Cof ,Coc , Rub)……………………………….……………………...1
These various elements of agro processing sector was modelled with economic growth
to estimate the individual elasticities in the following equation or model.
Agro processing sector-Economic Growth Model
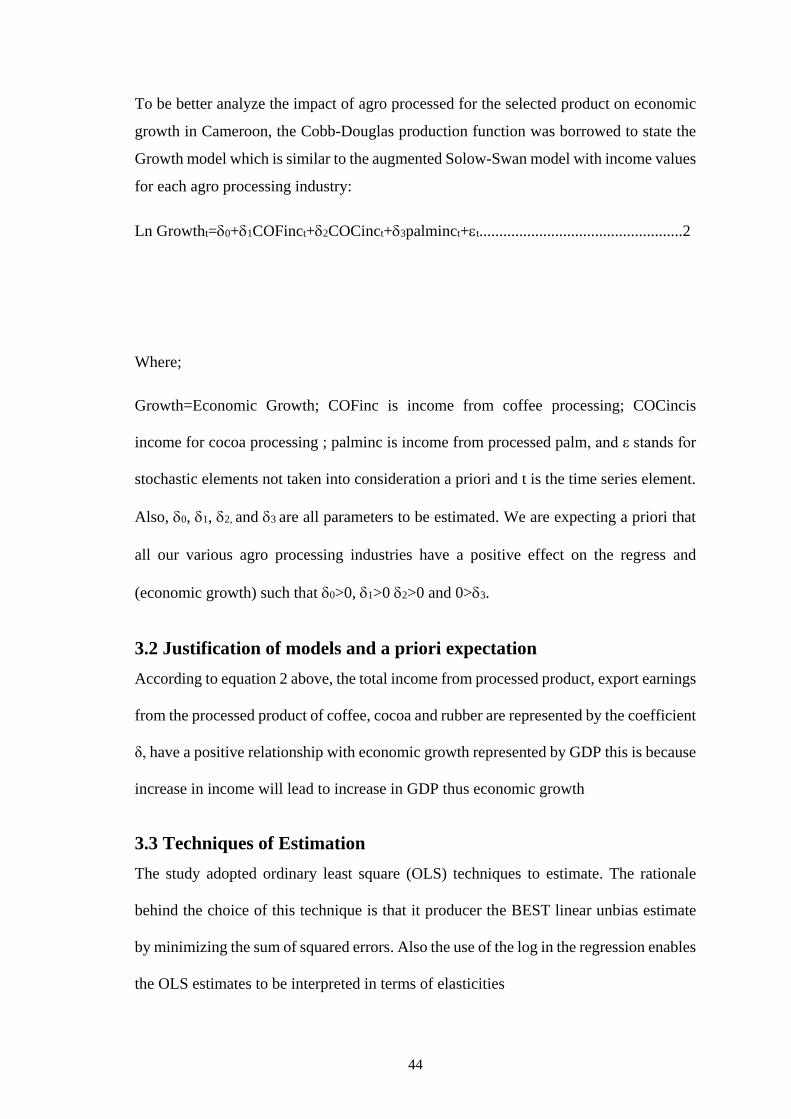
44
To be better analyze the impact of agro processed for the selected product on economic
growth in Cameroon, the Cobb-Douglas production function was borrowed to state the
Growth model which is similar to the augmented Solow-Swan model with income values
for each agro processing industry:
Ln Growtht=0+1COFinct+2COCinct+3palminct+t...................................................2
Where;
Growth=Economic Growth; COFinc is income from coffee processing; COCincis
income for cocoa processing ; palminc is income from processed palm, and ε stands for
stochastic elements not taken into consideration a priori and t is the time series element.
Also, 0, 1, 2, and 3 are all parameters to be estimated. We are expecting a priori that
all our various agro processing industries have a positive effect on the regress and
(economic growth) such that 0>0, 1>0 2>0 and 0>3.
3.2 Justification of models and a priori expectation
According to equation 2 above, the total income from processed product, export earnings
from the processed product of coffee, cocoa and rubber are represented by the coefficient
δ, have a positive relationship with economic growth represented by GDP this is because
increase in income will lead to increase in GDP thus economic growth
3.3 Techniques of Estimation
The study adopted ordinary least square (OLS) techniques to estimate. The rationale
behind the choice of this technique is that it producer the BEST linear unbias estimate
by minimizing the sum of squared errors. Also the use of the log in the regression enables
the OLS estimates to be interpreted in terms of elasticities

45
3.4 Validation of Estimated Parameters
Parameters of the model stated above are analysed and validated based on the following
three main criteria:
3.4.1 Economic or a priori Test
This test is concerned with the magnitude (size) and direction (sign) of the estimated
parameters. With this criterion, economic theories on the variables and their relationship
are made to conform to the a priori or expected signs of the parameters in question. As
such here, the functional relationship as revealed by the signs and magnitude of the
variables of interest is revealed and its consistency with theory and empirical result
established.
3.4.2 Statistical Criteria or First Order Test
This test involves the use of statistical test such as the student t-statistic, probability
values, F-ratio and the R-squared. The adjusted R-squared measures the percentage of
the total variation in growth in Cameroon accounted for by income or agro processing
earnings and export earnings on the total agricultural output. The t-statistic and p-values
justify whether the coefficients of the estimated parameters are significant particularly at
5% while the F-ratio tests the overall significance of the adjusted R-squared and to show
the degree of reliability of the results obtained as well as the forecasting ability of our
model.
3.4.3 Econometric Criteria or Second Order Test
This criterion aimed at testing the assumptions of the error term or stochastic element
and other parameters so as to test for some statistical problems possible in regression
analysis such as auto-correlation or serial correlation between variables, stationarity of

46
variables included in this research study. The main tools used here are the Durbin-
Watson Test, the Phillip-Perron unit-root test, while the existence of heteroskedasticity
is taken care of by the OLS technique of estimation adopted by making the standard
errors robust.
The Variance Inflation Factor (V.I.F.) has also been used to test for multicollinearity only
for the models of economic agro processing industry and growth, through an initial OLS
process since this is not possible in the GMM framework. To test for multicollinearity
the basic premise is that if VIF>2.5, then there is a high degree of Multicollinearity. Our
null hypothesis is that there is no multicollinearity between our independent variables.

47
CHAPTER FOUR
PRESENTATION AND DISCUSSION OF FINDINGS
4.1 Presentation of Results
The results of this study are presented on the basis of trend, summary statistic, correlation
results, unit root test result and the regression result.
4.1.1Trend of GDP, coffee, cocoa and palm processing in relation to
economic trend
The trend of the variables used for the study has been fluctuation or non-stationary over
time as illustrated by the figures below.
Source; computed by author, using stata 2010
25
25.5
26
26.5
Log
Va
lues
1980 1990 2000 2010 2020Years
Trend of Cameroon GDP

48
Figure 1: Fig 4.1 GDP Trend of Cameroon
As observed from the graph above there has been variations of the GDP of Cameroon
over the years. Around the early 80s to mid-80s GDP was low which was accounted for
by low productivity of all sectors and mostly the dependence solely on agricultural sector
during this period, from the mid-80s right up to the early 90s, there was a slight increase
in the GDP of Cameroon from about 25.2billion USD to 25.5 billion USD, this increase
could be associated with the discovery of petroleum in the country and the introduction
of the structural adjustment program, from this period the was a sharp fall of the GDP
which was accounted for by the economic crisis in the mid-90s. from this period on there
has been a steady increase in GDP with its peak being in the years 2013 within our study
period, all of this is due to the recovery of the economy accounted for by the reforms
carried out by the government such as the liberalization of the economy in the early 90s,
Cameroon involving in the millennium development goals (MDGs) HIPC initiative, the
GESP and the recent vision 2035 and to a greater extend agro processing.
Source; computed by author, using stata 2010
Figure 2: Fig 4.2 trend of income from cocoa and its product in Cameroon
19
19.5
20
20.5
Log
Va
lues
1980 1990 2000 2010 2020Years
Trend of Cocoa Production in Cameroon

49
Cocoa is one of the major cash crop produced in Cameroon and thus its production and
processing if of great important to the economy of Cameroon. From the period 1980
which show income from cocoa and its product was high drop gradually to mid-80s due
government interest direction to the petroleum sector away from the agricultural sector
that was the main source of the country income. From the mid-80s to late 80s there was
a slight in the income from cocoa and its product which could be accounted for by the
SAP and stabilization program, from then on the income drop steadily to mid-90s, all
due economic crisis experience by the country during this period. From the mid-90s to
the late 90s income from cocoa and its product increase and this was due the
liberalization of the economy which made the economy more competitive. There was a
sharp drop of income from the late 90s and early 2000s as a result of the financial crisis
that hit the world. From 2000, incomes has been increasing though with little viriation
around mid-2000 and realized again after 2010 but on a whole incomes has been high.
This increase in income is due to Cameroon involving in the millennium development
goals (MDGs) HIPC initiative, the GESP and the recent vision 2035 with most of the
funds targeted towards the agriculture especially in promoting and empowering women.
On a whole GDP growth in Cameroon can also be accounted for by the continual increase
in agro processing industry exiting in the country.

50
Source; computed by author, using stata 2010
Figure 3: Fig 4.3 trend of income from coffee and its product
Fig 4.3 shows income variation from coffee and its product between the year 1980-2000
indicating a downward sloping curve with its highest point being in the year 1980
probably due to government vested interest in the agricultural sector but this gradually
drops still the mid-80s, then went up again till the late 80s. From late 80s income started
dropping again till the early 90s and it kept fluctuating from then on till the late 90s.
From the late 90s there is a sharp fall in income to early 2000 then increase to a level and
remain almost constant with little undulations till 2013. On a general note the income
from the coffee industry had downward trend which can be accounted for by the low and
unstable price of coffee, the closure of the marketing board which regulated the activities
of coffee and cocoa production and the abandonment of many farmers who are at the
extracting phase of the coffee industry due to low returns from the activity.
17.5
18
18.5
19
19.5
20
Log
Va
lues
1980 1990 2000 2010 2020Years
Trend of Coffee Production in Cameroon

51
With regards to fig 4.4 below showing the trend of income from palm and its product
presents a clear contrast from the trend of the income of coffee and its product. The tread
shows a general upward sloping curve with undulation appearing within our study period
like in the mid-80s, mid90s 2000, and around 2011. The continuous increase in income
from this industry is due to the ever increasing number of farmers engage and expansion
of government in palm production. The drop of income in this industry is due to similar
factors that affected the cocoa and coffee industries.
Source; computed by author, using stata 2010
Figure 4: Fig 4.4 trend of income of palm and its product.
17.5
18
18.5
19
19.5
20
Log
Va
lues
1980 1990 2000 2010 2020Years
Trend of Palm Production in Cameroon

52
Table 3: Table 4.1 summary of the trend of variables
Periods Cocoa coffee palm GDP
1980-1999 Drops drops Increases Increases
1999-2000 drops drops Increases Slight drop
2000-2010 Increases drops Increases Increases
2010- Increases drops Increase Increases
4.1.2 Impact of Agricultural processing industry on economic growth
To fully evaluate the impact of agro processing industry on economic growth, we will
use summary statistics, Philip perron unit root test for stationarirty and the regression
4.1.2.1 Summary Statistics
The summary statistics of variables used in this, study show some variation with respect
to their means, standard deviation, minimum and maximum values as shown in the table
below
Table 4: Table 4.3 descriptive statistics of variables
Source; computed by author, using stata 2010
Within our period of study, the average GDP, income from processed palm, coffee and
cocoa in real terms have been, 13609.2million USD, 1.72 million, 1.42million and
4.57million USD respectively with their standard deviation ranging as follows ±
Variables Observation Mean Std Dev Minimum Maximum
GDP (million usd) 34 13609.3 6350.853 7113.905 29567.5
PALM 34 1.72e+08 1.42e+08 3.95e+07 5.09e+08
COFFEE 34 1.42e+08 8.46e+07 4.46e+07 3.67e+08
COCOA 34 4.57e+08 1.77e+08 2.13e+08 9.11e+08

53
7113.905million, 1.42 million, 8.46million and 1.77million USD respectively deviating
from the mean which are not too high thus making the variables good for estimation.
As observe from table 4.1, the industry with maximum amount of income is cocoa
processing followed by palm then coffee sector with value of 9.11million, 5.09million
and 3.67million respectively with minimum and maximum values of 7113.9 million
and29567.5million USD respectively.
4.1.2.2 Diagnostic Test Results
Table 5: Table 4.4 Philips perron unit root test for stationarity
Philips Perron Unit Root Test
Levels First Difference
Variable Test Statistic P-value Test Statistic P-value
LGDP 0.425 0.9824 -6.491 0.0000
LOGCOCOA -2.565 0.1005 -5.656 0.0000
LOG COFFEE -2.686 0.0000
LOGPALM -1.021 0.7454
-7.499 0.0000
Source; computed by author, using stata 2010
The results showed that the variables are all found to be non-stationary at levels using a
5% level of significance accept for coffee which is stationary at 5% level of significant.
The other variables that is GDP, cocoa and palm turn to be stationary after the first
difference at 1% level of significance using both the Philips Perron unit root test, thus
verification of a long run relationship among the variables can be verified
4.1.2.3 Pair-wise Correlation Results
Table 4.3 below presents the correlation coefficients intended to show the relationship
between the variable of interest. The values I parentheses show the significance level of
the correlations.

54
Table 6: Table 4.5 Pair-wise Correlation Results
variables Log gdp logcocoa logcoffee logpalm
Loggdp 1.0000
Logcocoa 0.6369
(0.0001)
1.0000
Lagcoffee -0.5687
(0.0004)
-0.0750
(0.6732)
1.0000
logpalm 0.9397
(0.0000)
0.5205
(0.0016
-0.6513
(0.0000)
1.0000
Source; computed by author, using stata 2010
From table 4.3 above, coffee has a negative and significant correlation with cocoa and
GDP as shown by their log values, meaning increasing coffee production will lead to a
fall in the production of all the other variables but that of palm is not significant,
meanwhile cocoa palm and GDP all have positive and significant correlation to each
other with palm and GDP having a close to perfect correlation
4.1.2.4 Regression Results for growth equation
The regression results presented on table 4.4 below measure the impact of the three
agroprocessing impact on economic growth
Table 7: Table 4.6 regression result for economic growth
Variables(dependent
variable) d1.log
GDP
coefficient Standard error t p>|t|
D1.logcoco 0.1075285 0.056074 1.92 0.065
Logcoffee -0.552602 0.0297218 -1.86 0.073
D1.logpalm 0.2905378 0.0587727 4.94 0.0000
_cons 1.04262 0.551703 1.89 0.069
Number of
observation
33
R-squared 0.6348
Adj.Rsquared 0.5970
F(3,29) 16.80
Prob>F 0.0000
Source; computed by author, using stata 2010
Table 4.5 is use to present results for objective 2 to the forth objective

55
4.1.2.5 To assess the impact of the cocoa agro processed sector on the
economic growth of Cameroon
From the table above showing results of the growth model, cocoa has positive effect on
the economic growth of Cameroon as indicated by its elasticity coefficients, with this
significant at 10% as showed by it p>t =0.065. Going by the coefficient of cocoa
processing sector, a 100% increase in cocoa processing in the country will lead to a
potential increase in GDP by approximately 10.7% with the increase being statistically
significant at 10% level and it is in accordance with our a priori expectation. Such finding
is supported by The big push theory of (Hirschman, 1958), which is an advice for the
hopeless,on how developing countries without real industries because of the lack of
financial and human resources to invest in all the activity sectors, or not to invest at all,
such nations have to concentrate their resources in key sectors during the first phases of
development. Besides, non-competitive countries are organically connected to a fast
growth. Da Silva et al (2009:49) also observed that; “moving the core economic
activities from the farm gate to the agro-industrial sector and its services may represent
productive diversification and lead to higher levels of productivity and income
generation as well as higher shares of non-farm employment in rural areas .(African
transformation report 2014) also adds that Agro processing typically offers a big step up
in generating employment, income, and foreign exchange, which can often be unlocked
by well-designed policies to overcome barriers that prevent domestic players from
emerging, reaching scale, and becoming globally competitive.
4.1.2.6 To assess the impact of the coffee agro processed sector on the
economic growth of Cameroon
Contrary to the above result coffee on its part has a negative effect on economic growth
of Cameroon as indicated by the coefficient with the result being significant at 10%

56
confident interval. With regard to this coefficient, a 100% increase in coffee processing
will decrease GDP by approximately 5.5% which is not in concurrence with the a priori
expectation. This is contrary to empirical studies of (Dhiman and Rani, 2011) who
reported Agro based industry which is regarded as the sunrise sector of the Indian
economy having a large potential for growth and likely socio economic impact
(specifically on employment and income generation) and the World Bank confirmation
of a strong synergy existing between agribusiness, agricultural performance and poverty
reduction in Sub-Saharan Africa. Thus see efficient agribusinesses to stimulate
agricultural growth and reduce rural poverty, giving that agro-industry is fairly accessible
and can be pursued at small-scale.
4.1.2.7 To assess the impact of the palm agro processed sector on the
economic growth of Cameroon
On its part cocoa processing has a positive and significant effect on economic growth
and going by the coefficient with it being significant at 1% confident interval, a 100%
increase in cocoa processing will lead to an approximate 29.1% increase in GDP. Similar
to this result is that of (Wilkinson and Rocha, 2008) who acknowledge agro-processing
plant can open up new crop and livestock opportunities to the farmer and thus increase
the farm income and employment. Particularly the food and beverages processing sector
remains important at all levels of economic growth.
4.1.2.8 To assess the combined impact of the coffee, cocoa and palm
agro processed sector on the economic growth of Cameroon
Overall the agro processing sector with the joint variation of coffee, cocoa and palm
processing sector in Cameroon has the capacity to account for about 59.7% of the total
variation in economic growth in Cameroon as shown by the value of the adjusted R-
squared and significant at 1% level and thus 99% reliable for policy prescription. Such

57
forecasting ability of this prediction is asserting by a high significant level of prob>F
value of 0.0000 with random variables not specified in the model accounting for the
remaining 40.3%.This in line with (Babu, 2000) findings who says agro-processing plant
can open up new crop and livestock opportunities to the farmer and thus increase the
farm income and employment. Particularly the food and beverages processing sector
remains important at all levels of economic development (Wilkinson and Rocha, 2008)
also added there is possibilities for income generation to be restricted in rural areas, but
in rural non-farm earnings from agro-processing and its trading constitute a significant
part of household income thus giving the importance of the agro processing industry on
economic growth both in rural and at the national level.
On the bases of the empirical result we reject the null hypothesis that agro processing
sector has no significant effect on economic growth of Cameroon as shown by their p
value (p>|t| 0.0000)
4.2 Discussion of Result
With regards to our first objective, our results indicated the existed variation and
fluctuation with regards to trends. It revealed that coffee industry as represented by
income from the cash crops and their product had a downward sloping curve which is
opposed by palm with an upward sloping curve. While cocoa on its part though with
fluctuation of up and down hard an almost steady increase. This show that both the
production and the prices of the crop varies with time. Worthy of note is that coffee
industries has face lots of problems which includes the destruction of coffee farms around
the 80s and late 90s by farmers due to low returns from the farm cause predominantly by
fluctuating prices, the closure of the marketing board and inadequate factories that deal
in the processing of coffee. Cocoa on its part gain a lot of attention by farmers and
government due to its relative importance it plays as food and its supplements.

58
Meanwhile palm is continually gaining attention both by government and small holder
due to its indispensable nature
Owing to the fact that agriculture is the backbone of Cameroon economy, agro
processing by implication was supposed to be one of the major activity carried out in the
country, especially by small holders or artisanal processor using lighter equipment and
making use of mostly local raw materials and also establishing a good market for its
product abroad so as to improve on the export earnings and thus balance of payment
situation.
On an individual bases increasing processing of palm and cocoa have positive impact on
the economic growth of Cameroon which is in some position with a priori prediction and
reality with one of economics factors that favour economic growth as increase in
production pushes the GDP upwards, and following the cobb-douglas production
equation that assumes a positive relationship for both sides of the equation. On like this
normal phenomenon explain by the cobb-Douglas production function, coffee has a
negative impact on the economic growth as shown on the empirical result coffee
processing industry has negative on GDP though insignificant. Coffee exhibits a
contrary result to (Babu, 2000) who says agro-processing plant can open up new crop
and livestock opportunities to the farmer and thus increase the farm income and
employment. Particularly the food and beverages processing sector remains important at
all levels of economic development (Wilkinson and Rocha, 2008) also added there is
possibilities for income generation to be restricted in rural areas, but in rural non-farm
earnings from agro-processing and its trading constitute a significant part of household
income thus giving the importance of the agro processing industry on economic growth
both in rural and at the national level.

59
From the empirical result above, the agro processing sector with the joint variation of
coffee, cocoa and palm processing industries in Cameroon has a positive effect on
economic growth that is an increase in agro processing will lead to increase GDP thus
economic growth. This is line with the theory of Rosenstein-Rodan on industrialization,
which explain the importance of industrialization in relation to employment creation and
income generation. With assumption about the returns from spill-overs from industrial
activities which lead to increased returns from other linked sub-sectors (Hoff, 2001; Fan,
2002; Hossain and Papadopoulou, 2010). A phenomenon referred to as the multiplier
effect. Thus when there is increase number of agro processing plant or increase in
production, it will lead to increase employment hence output and a further increase in
income thus overall increase in economic growth. In same light Pawa Tersoo(2014) falls
in line with our studies as he examined the role of agribusiness in all its tri-aggregates to
the socio-economic development of the rural sector in Nigeria. His work acknowledges
the importance of agriculture as it employs a majority of the rural population in a
predominantly agrarian society like Nigeria. He draws conclusion majorly from
documentary evidence on agribusiness and agro-industrial linkage and reveals that, the
farm, off farm and processing components of agribusiness are capable of generating jobs,
provision of income, poverty reduction and infrastructural growth which are all
indicators of economic growth.
4.3 Implication of the Study
The topic under consideration was aimed at assessing the contribution of agro processing
sector on economic growth of Cameroon taking cocoa coffee and palm agro processing
sector as case study. Found coffee processing was having a downward trend since the
80s while palm processing had been increasing continually but palm production does not
meet current demand. Other result obtained showed there was overall positive and

60
significant effect of the agro processing sector on economic growth of Cameroon. Thus
with such result and the is an obvious need for the government to revamp the coffee
sector especially with current situation of unemployment, poverty, food insecurity and
post-harvest losses, unstable prices for agricultural product, government needs to put in
place policies that favor agro processing so as to increase agricultural value thus increase
income, employment, export earnings and overall economic growth while making agro
processing a priority.
4.4 Limitation of the Studies
Thought this study is far from being perfect, it could have been much better if it never
face the following limitation. In the course of achieving this work we had to drop one
variable which was employment in the various industries, which should have given much
inside to the study but data was not found with respect to it. Also our study had to extend
to the year 2016 but we could only source data which ended in 2013, thus our level of
predictability may be affected as five years of any economic cycle is enough for
substantial change to arise.

61
CHAPTER FIVE
SUMMARY OF FINDINGS, CONCLUSION AND
RECOMMENDATION
5.1 Summary of findings
The main objective of this study is to assess the contribution of agro processing sectors
of coffee, cocoa and palm nut on economic growth of Cameroon. To bring out the best
result from the main objective, the study had as specific objective to examine the trend
of coffee, cocoa and palm nut processing in relation to economic trend of Cameroon, to
assess the individual and combine impact of the coffee, cocoa and palm nut agro
processing sector on the economic growth of Cameroon. This were done using statistical
graph and tables for the first objectives and the ordinary least square technique of
estimation to major impact. With regards to objective one, the existed variation and
fluctuation with regards to trends. It revealed that coffee industry as represented by
income from the cash crops and their product had a downward sloping curve which is
opposed by palm with an upward sloping curve. While cocoa on its part though wit
fluctuation of up and down hard an almost steady increase.
Looking at the second objective, we found cocoa has positive and significant effect on
the economic growth of Cameroon
With regards to the third objective, we found coffee processing sector to have a negative
effect on GDP of Cameroon with this effect being significant.
Regarding our fourth objective, we found that palmagro processing sector had an overall
positive and significant effect on GDP

62
And the result with respect to the fifth objective shows that the agro processing sector
with the joint variation of coffee, cocoa and palm processing sectors in Cameroon has a
positive effect and significant impact on economic growth.
5.2 Conclusion
This study was aimed at assessing the contribution of agro processing sector on
economic growth of Cameroon, found coffee processing was having a downward trend
since the 80s while palm processing had been increasing continually. Other result
obtained showed there was overall positive and significant effect of the agro processing
sector on economic growth of Cameroon. Meanwhile cocoa and palm had a positive
impact on economic growth, coffee processing had a negative impact on the economic
growth of Cameroon. Thus we conclude that, for country especially those that depend on
agriculture for their livelihood in order to acquire maximum gain from the sector, they
should make agro processing industry a priority as this will increase employment, non-
farm income, export earnings, reduce postharvest losses and increase overall economic
growth.
5.3 Recommendations
Base on the findings of our study, policies recommendation will be propose with respect
to our objectives and result obtained, with regard to improving agro processing sector in
particular and overall economic growth in Cameroon. This involve the concerted efforts
from all stakeholders: public that is the government and private sectors that is
entrepreneur, and farmers. Thus each of this stake holder will be charge with certain
responsibilities as recommended.

63
To the farmer,
It is recommended that farmer including parastatals should keep record of their
activities in terms of labor inputs, cost of production and revenue from their
activity as this will help both government and NGOs on the amount of support
that can giving to a particular farmer,
Secondly farmer are advice to add value to products by changing farming
practices to access higher income, markets, enhance product quality and
incorporate processing and packaging activities and this should not be limited to
only coffee industry
Farmer should keep themselves up to date with modern methods of farming and
marketing information relating to price and possible avenues to acquire support
especially coffee farmers with their product facing a downward trend
To entrepreneur
To make available data on their activities for those already in the activity of agro
processing as this will provide government with information on implementing
policy option of taxation or subsidizing
An advise to exploit available opportunity in the ago processing sector by
investing in such ventures as this is an area that is still unexploited and lucrative
especially in the palm and cocoa processing as it increase both income and export
earnings
Entrepreneur should shift away from the old routine of maintenance marketing to
a more purposeful and development oriented innovative market, fully backed by
basic consumer research and opportunity identification is required. Thus,

64
marketing strategy should ensure that all sections of the organization are
consumer oriented taking cognizance of both home and foreign taste
Enhance dissemination of marketing information amongst business owners
especially in agro processing industry through marketing information
systems/technologies so that both farmers and entrepreneur have access to real
time prices and other market opportunities both home and abroad that will
increase income and export earnings and encourage investment especially in the
fading coffee processing industry.
To the government
In designing policies on taxation and subsidy government needs reliable and
accurate data in order to know the extent of implementation to various activities
including the agro processing industry thus the government needs to put in place
a sound system through it institution like the national institute for statistic to
acquire such data.
There is a need for government to support public-private sector dialogue and
activities, in order to develop networks and synergies. There is also a need to
provide a more conducive policy environment which includes macro-economic
stability, political stability and contract enforcement focused on pro-poor policies
to improve the entire agro processing industry
The government should provide appropriate training and develop local capacity
for designing and preparing projects, she should also enhance Research and
development (R&D) support focus on modifying processing technologies and
introducing design concepts for technologies especially where activities

65
replicates of processes already developed and tested in other developed countries
especially to revamp the coffee processing industry.
setting up farm settlement schemes with necessary infrastructural facilities, such
as accommodation, access roads, water, energy, communication, health care and
integrated network of satellite, storage facilities to reduce post-harvest losses,
ease transportation, reduce rural-urban migration and motivate more people to
take to farming and related activities especially in coffee producing towns and
villages.
training of business owners to effectively awaken and reinforce entrepreneurial
skills, upgrading processes to make unit operations more efficient and more
responsive to market demands prescribing grades and standards through
regulatory agencies for the finished products to ensure consistently high and
uniform quality especially for export products
Government should put up policies that protect home industries especially on
Food products that are locally fabricated using tariff and non-tariff barriers.
5.4 Area for Further Research
The current study is obviously not exhaustive as far as the dynamics of agro processing
industry and economic growth are concern. As such it is necessary to evaluate the effect
of total agro processing on economic development in Cameroon and the contribution of
the processing crops and processing of animal. Moreover it will be imperative to carry
out an empirical study to tradeoff between the export and import of agro processing out
and total home consumption. Such studies will help enable policy makers to appreciate
the level of production and to know what policy to place as regards importation an
exportation. Also it is expected that issues concerning poverty reduction be handle
especially looking at working condition in such agro processing factory and they has

66
been as the welfare of workers in such industries determines productivity. There could
also be a cross sectional study carried out in the CEMAC region comparing each
countries performance in the agro processing industry.

67
REFERENCES
African Development Bank Group (2012). Bank Financing to Small and Medium
Enterprises in East Africa: Findings of a Survey in Kenya, Tanzania, Uganda
and Zambia. Working Paper Series No. 146. African Development Bank Group,
Tunis 41pp.
Agro processing summit (2015), “Embracing agro processing and harnessing appropriate
technology as a tool to fight unemployment poverty and providing food security
in Africa”. Amabhabesi conferencing center Rundburg, Johannesburg.
Amadou, N. (2007). Analysis of factors affecting the technical efficiency of arabica
coffee production in Cameroon. AERC Research Paper 163, African Economic
Research Consortium, Nairobi, January 2007.
Amin, Aloysius A. (1998). “Cameroon's Fiscal and Economic Growth” African
Economic Research Consortium (AERC), RP85. Nairobi, Kenya
Atinmo, T. &Bakre A.T. (2003). Palm fruit in traditional African food culture. Asia
Pacific Journal Clinical Nutrition 12(3):350–354.
Austin J. M. (1981); Agro-processing Project Analysis, John Hopkins University Press
Baltimore and London.
Babu, S. (2000). "Food and agricultural policies for the 21" century", Food Policy,
25: 105-109.
Bakoume C & Mahbob BA. (2006). Cameroon offers palm oil potential. Oils and fats
International 3:25–26.
Bakoume C., Jannot C., Rafflegeau S., Ndigui B. & Weise S. (2002). Revue du
secteurrural.Rapportpalmier. Yaounde: Integrated Research Application and
Development (IRAD), Agricultural Research for Development (CIRAD),
International Institute of Tropical Agriculture (IITA), Food and Agriculture
Organization (FAO).

68
Benavente, J. M. & Lauterbach, R. (2008). Technological innovation and employment:
complements or substitutes?' The European Journal of Development Research
20(2): 318 – 329.
Berger A., Frame W., & Miller N., (2005) Credit Scoring and the Availability, Price, and
Risk of Small Business Credit, Journal of Money, Credit, and Banking, 37, (37),
191- 222. doi:10.1353/mcb.2005.0019,
http://dx.doi.org/10.1353/mcb.2005.0019
Bhattacharya S.N (1980), Rural Industrialization in India, B R Publishing Corporation,
Delhi, , p 192 Chadha G.K. and P.P.
Bratton, M., & Rothchild, D. (1992). Bases institutionnelles de la gouvernanceen
Afrique, Gouverner l'Afrique, Nouveaux Horizons, Paris, Le Seuil, 2001.
Buzenot, L.,(2009) Les zones franches industrielles d’exportationdans la Caraïbe. Les
causes économiques de leur Emergence, Etudes Caribéennes, 13 (14),1-28.
Carrere R. (2006). Oil palm: The expansion of another destructive monoculture. Oil
palm: From cosmetics to biodiesel. Colonization lives on. World Rainforest
Movement, Montevideo
Carrere R. (2010). Oil palm in Africa: Past, present and future scenarios.: World
Rainforest Movement Series on tree plantations 15.December, Montevideo.
Carret, J. (1999) L’industrialisation de la filière bois au Cameroun entre 1994 et 1998
Observations, Interprétations, Conjectures, [online], available:
http://www.cerna.ensmp.fr/Documents/JCC-Synthese.pdf.
Chengappa P. G. (2004); Emerging Trends in Agro- processing in India; Indian Journal
of Agricultural Economics. Vol. 59, No. 1 March
Cimoli, M.; Dosi, G.; Stiglitz, J.E. (eds). 2009. Industrial policy and development: The
political economy of capabilities accumulation (Oxford, Oxford University
Press).
Cramer, C. (2003). Faut-ilfavoriser la transformation, Le Courrier ACP-UE ,196, 30-32.

69
Da’silva C. et al (2009). Agro-Industries for Development U.K. CAB International
MPG Book Group.
Dada, Lade A., (2007), The African export industry: what happened and how can it be
revived?, Case Study on the Cameroonian cocoa sector, FAO, Agricultural
Management, Marketing And Finance, Working Document 215, Rome:
David, T., &Goertz, G. (2000). Les positions industrielles de I'Europe à la veille de la
seconde guerre mondiale, Revue Economique, 51, (2), 213-227.
doi:10.2307/3503118, http://dx.doi.org/10.2307/3503118 www.sciedu.ca/rwe
Research in World Economy Vol. 2, No. 1; April 2011 Published by Sciedu
Press 65
Davis & Goldberg as cited in Pawa T. (2014) Agribusiness as a veritable tool for rural
development in Nigeria International Letters of Social and Humanistic Sciences,
SciPress Ltd., Switzerland ISSN: 2300-2697, Vol. 14, pp 26-36
DSCE, (2009), Document des Stratégies pour la Croissanceet l’Emploi (DSCE), Mars
2009, Cameroun MINEPAT/CTSE.
Economic Development in Africa Report (2010), Geneva: UNCTAD
Ehui, S. & Delgado, C.(1999) Economy-Wide Impacts of Technological Change
inthe Agro-food Production and Processing Sectors in Sub-Saharan Africa1
International Food Policy Research Institute, 2033 K Street N.W.
Washington, D.C. 20006http://www.cgiar.org/ifpri
Elms, D.K. &Low, P. (eds). (2013). Global value chains in a changing world (Geneva,
Fung Global Institute, Nanyang Technological University and World Trade
Organization).
Energy Information Administration (EIA). (2007). All Africa. Retrieved from
http://allafrica.com/stories/200710300755.html on June 23, 2017
Eze, Onyekachi Richard &Ogiji, Festus O. (2013), Impact of Fiscal Policy on the
Manufacturing Sector Output in Nigeria: An Error Correction Analysis.

70
International Journal of Business and Management Review (IJBMR) Vol.1,
No.3, pp. 35-55. Published by European Centre for Research Training and
Development UK
Fambon, S., A. A. Ajab, M. F. Baye, I. Noumba, I. Tamba& R. Tawah, (2000), ‘Pauvreté
et répartition des revenues au Cameroun durant les années 1990,’ Cahier de
Recherche No. 01-06, Université Laval.
Fan, E. X. (2002), Technological Spill Overs from Foreign Direct Investment A Survey.
Working Paper No. 33. Asian Development Bank, Philippines. 55pp.
FAO (1997). The State of Food and Agriculture. FAO Agriculture Series, No. 30, FAO,
Rome, Italy.
FAO 1997 as cited in Yumkella, K. K. et al. eds. (2011). Agribusiness for Africa’s
Prosperity. Austria: UNIDO.
FAO 2007a, p.3 as cited in Yumkella, K. K. et al. eds. (2011). Agribusiness for Africa’s
Prosperity. Austria: UNIDO.
FAO, 35 pages FAO (Food and Agriculture Organization), (2008), Enabling
Environments For Agribusiness And Agro-Industry Development In Africa,
Proceedings of a FAO Workshop, Accra, Ghana, 8 – 10 October 2007, Rome:
FAO
Gills, D., Perkins, S., Radelet, Roemer, M., & Snodgras, R. (2001). Economics of
Development, (5ième edit), Norton and company.
Greenwald, B. & Stiglitz, J.E. (2013). “Industrial policies, the creation of a learning
society, and economic development”, in J.E. Stiglitz and J.Y. Lin (eds): The
industrial policy revolution: The role of government beyond ideology
(Basingstoke and New York, Palgrave Macmillan).
Haggblade, S., P.B.R. Hazell & T. Reardon (eds.), (2007). Transforming the rural
nonfarm economy, Baltimore: Johns Hopkins University Press, for International
Food Policy Research Institute (IFPRI)NEPAD Secretariat, 2005. Agribusiness,

71
supply chain, and quality control initiative. CAADP Implementation Concept
Note. Midrand: NEPAD.
Hawassi, F. G. (2006). Analysis of processing, marketing and demand for processed
fruits and vegetables in Tanzania. Thesis for Award of PhD Degree at Sokoine
University of Agriculture, Morogoro, Tanzania, 270pp.
Hirschman, A. (1958). The strategy of economic development, Yale University Press,
New Haven.
Hoff, K. (2001). Beyond Rosenstein-rodan: The modern theory of coordination problems
in development. Proceedings of the Annual world bank Conference on
Development Economic 2000, Washington DC. pp. 145 – 188.
Hossain, M. B. T. & Papadopoulou, E. (2010). Competitive capacity and export potential
of agro-processing industries under the trade liberalization regime of
Bangladesh. Asian Journal of Food and Agro-Industry 3(4): 400 – 419.
Hoyle, D. &Levang, P. (2012). Oil palm development in Cameroon. Ad hoc Working
Paper. World Wide Fund for Nature WWF, Institut de Recherche pour le
Developpement (IRD), Centre for International Forestry Research
(CIFOR),Yaounde, Cameroon
Ibeckwe UC. (2008). Role of women in oil fruit processing and marketing in Imo State,
Nigeria.Social Science 3(1):61–65.
Ibi, Ajayi, S. (2006). L’IDE et le développement économiqueen Afrique, [online],
available: www.afdb.org/.../09484246-FR-FDI-AND-ECONOMIC-
GROWTH1-FR-EDIT.PDF - INS (2009), Les Comptes Nationaux du
Cameroun, (Deuxièmeédition), Yaoundé.
Ibitoye O., Akinsorotan A. O, Meludu N. T. & Ibitoye B. O. (2011). Factors affecting oil
palm production in Ondo state of Nigeria. Journal of Agriculture and Social
Research (JASR) 11(1).
Imbs, J.; Wacziarg, R. 2003. “Stages of diversification”, in American Economic
Review,Vol. 93, No. 1, pp. 63–86.

72
IMF (2010) Etudes économiqueset financiers: perspectives économiques régionales,
Afrique Sub saharienne, [online], available:
www.imf.org/external/pubs/ft/reo/2007/afr/fra/afrf.pdf (mai, 2007)
Kachru R.P. (2008). Agro-Processing Industries in India—Growth, Status and Prospects;
Indian Council of Agricultural Research, New Delhi
Kaldor, N. (1995). Causes of growth and stagnation in the World Economy, in
Raffaele Mattioli Lectures, Filippini C. F. Targetti and A.P. Thirlwall (eds),
Cambridge: Cambridge University Press.
Kaldor, N. (1975). “What is Wrong with Economic Theory?”,Quarterly Journal of
Economics 89:347-57.
Kar, G.C. & Mishra S.N. (2004), “Agro industries & economic development”, Deep &
Deep publications pvt. Ltd.
Karthick, V., Mani, K. & Anbarassan, A. (2013). Mango Pulp Processing Industry in
Tamil Nadu-An Economic Analysis. American International Journal of
Research in Humanities, Arts and Social Sciences 2(1): 48 – 52.
Kaufmann, D., Kraay, A., & Zoido-Lobaton, P. (2008). Governance matters, World Bank
Policy Research WP 2196.
Kessous, J. C. & C.P. Ekoka, (2008), ‘Etat des lieux et diagnostic du secteur industrie et
services’, Rapport soumis au Ministère de l’Economie, de la Planification et de
l’Aménagement du Territoire, pp. 1-104.
Khan, A. Sunday (2011). “Volatility of Resource Inflows and Domestic Investment in
Cameroon”, AERC Research Paper 221, Nairobi, Kenya
Khosla, R. & Sharma, M. (2012), Agro Processing Industries in India –An inter State
Growth Analysis. Asian Journal of Research in Business Economics and
Management. Volume 2, Issue 3

73
KINYILI, J.M. (2003). Market Study Report on West Africa: Nigeria, Ghana, Cameroon
and Senegal.May 19 – June 17, 2003
Lall, Weiss, J.& Oikawa, H. (2005). “China’s competitive threat to Latin America: An
analysis for 1990–2002”, in Oxford Development Studies, Vol. 33, No. 2, pp.
163–194.
Larsen, K., Ronald, K. & Florian T, Eds., (2009), Agribusiness and Innovation Systems
in Africa, Washington D.C.: The World Bank
Lazaro, E., Makindara, J. &Kilima, F. (2008). Sustainability Standards and Coffee
Exports from Tanzania. DIIS Working Paperno 2008/1.Copenhagen. Danish
Institute for International Studies.
Louw, A., Ndanga, L., Chikazunga, D. &Jagwe, J. (2008). Restructuring food markets
in the Southern African region: Dynamics in context of the fresh produce sub
sector. A synthesis of country findings. International Institute for Environment
and Development (IIED), London.
Luthfi, F. (2007). The potentials of agro-industry for growth promotion and equality
improvement in Indonesia. Lambung Mangkurat University, Indonesia. Asian
Journal of Agriculture and Development 4(1): 57 – 74.
Madeley, J. (2003). La promotion des PME dans les pays ACP dans le contexte du
développement industriel, Le Courrier ACP-UE , 196, 42-44.
Magariños, C. (2003) Le Courrier ACP-UE n° 196, PP 42-44.
McCormick, D. (2001). Enterprise Clusters in Kenya : Urban Production, Upgrading
Strategies, and Joint Action , Africa Insight, ( 31) 1, 3-11.
Mccormick, D., (2003). Faut-il favoriser les Cluster industrielsen Afrique ?, Le Courrier
ACP-UE, 196, 33-35
MINEPLAT (2010). Perspective de l’économie camerounaise :l’économie camerounaise
dans le contexte de la reprise de l’économie mondiale, division des analyses et
des politiques économiques, Yaoundé.

74
MINEPLAT (2010a) Etude sur les mesures de soutien à la balance courante du
Cameroun, Yaoundé.
MINFI (2009), Programme Economique, Financier, Social et Culturel du Gouvernement
au titre de l’exercice 2009, Yaoundé.
MINFI (2009a). Compétitivité des entreprises du secteur manufacturier au Cameroun,
rapport pricipal, Yaoundé.
MINFI, (2010), Programme Economique, Financier, Social etCulturel du Gouvernement
au titre de l’exercice 2010, Yaoundé.
Muchnik, J., (2003). Alimentation, savoir-faire et innovations agro-alimentairesen
Afrique de l’Ouest. Recueil de rapports du projet ALISA. Union europeenne DG
XII, Bruxelles., Montpellier: CIRAD.
Murphy, Shleifer A., & Vishny, R. (1989). Industrialization and the Big Push, Journal of
Political Economy, 2 (4), 22-54.
Mutabazi, K. D. S., Mdoe, N. S. Y. & Senkondo, E. M. M. (2007). Potential of small
scale dairy businesses for employment creation and poverty reduction: The case
of Southern highlands of Tanzania. Eastern and Southern African Journal of
Agricultural Economics and Development 4(2): 27 – 34.
Nambbodii, N.V. Gandhi & Vasant p, (2003) Growth structure and prospects of Agro-
processing industries in India: Is there improvement since the economic
reforms? Indian Journal of agricultural economics Vol. 8 N 16.
Ocampo, J.A. & Taylor, L. (1998). “Trade liberalisation in developing economies:
Modest benefits but problems with productivity growth, macro prices and
income distribution”, in Economic Journal, Vol. 108, No. 450, pp. 1523–
1546.
OECD (Organisation for Economic Co-operation and Development).
(2013).Perspectives on Global Development 2013: Industrial policies in a
changing world(Paris, OECD Development Centre).

75
OECD/DC (Development Centre), (2008), Business for Development 2008, Promoting
Commercial Agriculture In Africa, A Development Centre Perspective, Paris:
OECD (With five country background studies to be accessed
at:www.oecd.org/dev/publications/businessfordevelopment; for the following
countries: Ghana (by Denise Wolter, 34pages); Mali (by Yoshiko Matsumoto-
Izadifar, 28 pages); Senegal (by Yoshiko Matsumoto-Izadifar, 34
pages);Tanzania (by Denise Wolter, 34 pages); and Zambia (by Federico
Bonaglia, 39 pages)
Oliveira, E. (2003). Les multinationales et les pays envoie de développement : puissance
commerciale et pauvreté, Le Courrier ACP-UE , 196, 36-38.
OMC (2001) Examen des politiques commerciales, Cameroun 2001, Centre
williamRappard, rue de Lausane 154, 1211, Genève 21, Suise.
Otienow. A. & Mwangola, A.(2006). Why Africa has Fallen Short of Building Dynamic
Agro-processing Capabilities: Constraints, Options and Prospects, ATPS
Special Paper Series No. 29, 9 Pp
Park, A.; Nayyar, G &Low, P. (2013). Supply chain perspectives and issues: A literature
review, Geneva, World Trade Organization and Fung Global Institute.
Pawa T. (2014) Agribusiness as a veritable tool for rural development in Nigeria
International Letters of Social and Humanistic Sciences, SciPress Ltd.,
Switzerland ISSN: 2300-2697, Vol. 14, pp 26-36
Pawan, K. D. & Amita, R. (2011)Problems and Prospects of Small Scale Agro Based
Industries: An Analysis of Patiala District, International Journal of
Multidisciplinary Research Vol.1 Issue 4, August 2011, ISSN 2231 5780
www.zenithresearch.org.in 129
Perroux, F. (1955). Note sur la notion de pôle de croissance, Economie Appliquée, 1(2),
307-320.
Perroux, F. (1969). L'économie du vingtième siècle, Paris, PUF, 3è édition
Program of Accompanying Research for agricultural Innovation (September 2015)

76
Puga D., &Venables, A. (1998). Trading arrangements and industrial development?
World Bank Economic Review, 12( 2), 221-249.
Puga D., & Venables, A. (1999). Agglomeration and economic development: import
substitution vs. trade liberalisation, Economic Journal, 109 (455), 292-311.
doi:10.1111/1468-0297.00433, http://dx.doi.org/10.1111/1468-0297.00433
Quddus, A. (2009)Role Of Agro-Industry In Bangladesh Economy: An Empirical
Analysis Of Linkages And Multipliers, Bangladesh J. Agric. Econs. XXXII,
1&2 (2009) 31-48
Reardon, T. &Berdegue, J. (2002). The rapid rise of supermarkets in Latin America:
Challenges and opportunities for development. Development Policy Review
20(4), 371-388.
Reardon, T., Timmer, C.P., Barrett, C. &Berdegué, J. (2003). The Rise of Supermarkets
inAfrica, Asia, and Latin America. American Journal of Agricultural Economics
85 (5), 1140-46.
Reinert, E.S. (2008). How rich countries got rich and why poor countries stay poor (New
York, Carrol & Graf).
Rieger M. (2012). Oil Palm Taxonomy. www.fruitcrops.com. GESP/Growth and
Employment Strategy Paper, 2003, Document de Stratégie de Réduction de la
Pauvreté (DSRP), Ministère de l’Economie, de la Planification et de
l’Aménagement du Territoire (MINEPAT
Rijkers, B., Måns, S. and Josef, L. L. (2009). A Rural-Urban Comparison of
Manufacturing Enterprise Performance. World Bank, Ethiopia.50pp
Rosenstein-Ridan, P. (1943). Problems of industrialization of Eastern and South- Eastern
Europe, Economic Journal,53 (1), 202-211. doi:10.2307/2226317,
http://dx.doi.org/10.2307/2226317
Rosenstein-Ridan, P. (1943). Problems of industrialization of Eastern and South- Eastern
Europe, Economic Journal, 53 (1), 202-211. doi:10.2307/2226317,
http://dx.doi.org/10.2307/2226317

77
Sahu (2003); Small Scale Agro-industry in India: Low Productivity is Its Achilles Heel;
Indian Journal of Agricultural Economics; Vol. 58, No.
Salazar-Xirinachs, J.M. 2008. “Comments on the report of the Commission on Growth
and Development”, Geneva, 4 Sep. Available at:
http://www.ilo.org/employment/
Informationresources/Publicinformation/speeches/WCMS_236831/lang--en/
index.htm [accessed 2 Mar. 2014].
Sautier, D. (2000). Local agri-food systems: a territorial approach to small enterprises in
the African food sector. Commissioned Paper. IDRC Planning Meeting
“Poverty, Livelihoods and Enterprise Development in a Globalizing Economy:
Research Directions in Africa and the Middle East”. Cape Town, April 13-15,
2000.
Schejtman, A. (1994). Agro-industry and changing production patterns in small-
scale agriculture” cepal Review, 53:147-157.
Sivakumar, S. K, Bajasubramanian, R. & Srinivasan, N. (1999). “ Growth linkage
effect of agro industrialization” indian journal of Agriculture of economics,
54(3): 412-419
Srivastava UK (1989); Agro-processing Industries; Potential, Constraints and Task
Ahead; Indian Journal of Agricultural Economics. Vol. 44, No. 3
Todaro, Michael P. & Stephen C. Smith (2012) Economic Development 11th Edition
New York University, The George Washington University.
UN Comtrade Statistics (2010). Available at: http://comtrade.un.org/ [Accessed July 22,
2017].
UN Comtrade Statistics (2017). Available at: http://comtrade.un.org/ [Accessed July 20,
2017].

78
UNCTAD (United Nations Conference on Trade and Development). (1964). Towards a
new trade policy for development, Report by the Secretary-General of UNCTAD
(New York)http://devdata.worldbank.org/data-query/
UNCTAD (2002). Trade and Development Report 2002 (New York and Geneva).
UNIDO (2016) Design of a master plan for a Technological Agro-Industrial Park (TAIP)
in Cameroon TERMS OF REFERENCE, 9 February 2016 Rfx No. 7000001486
UNIDO(2006) African Regional Implementation Review for the Commission on
Sustainable Development (CSD-14), Report on the Review of African
Sustainable Industrial Development
UNIDO, IFAD & FAO, (2008) THE IMPACT of agro-industries for socioeconomic
development and poverty reduction. Discussion paper; UN commission on
sustainable development,16th session, new York, 5-16may 2008.
UNIDO, Industrial Development Report, (2004) Washington D.C.: The World Bank
UNIDO, Industrial Development Report, (2004).
United Nations Conference on Trade and Development (UNCTAD),(2010a). UN
Comtrade Statistics. Available at: http://comtrade.un.org/ [Accessed November
22, 2010].
United Nations Industrial Development Organization (UNIDO),(2004). Industrial
Development Report 2004: Industrialization, Environment and the Millennium
Development Goals in Sub-Saharan Africa; the New Frontier in the Fight
Against Poverty, Vienna: UNIDO.
UNITED NATIONS INDUSTRIAL DEVELOPMENT ORGANIZATION (2016)
Design of a masterplan for a Technological Agro-Industrial Park (TAIP) in
Cameroon TERMS OF REFERENCE Rfx No. 7000001486
Verma, N,K&Kesavan (1986) “AGRO-based industries in Haryana: growth in input
and employment” Agricultural situation in india, 41(4):213-419

79
Vilane, B. R. T., Shongwe, M. I., Motsa, N. M. &Shongwe, V. D. (2012). Adoption
of postharvest technologies used by smallholder farmers in Swaziland.
African Journal of Agricultural Research 7(35): 4983 – 4995.
von Grebmer K., Saltzman A., Birol E., Wiesmann D., Prasai N., Yohannes Y.,
Menon P., Thompson J.& Sonntag A. (2014). 2014 Global Hunger Index:
The Challenge of Hidden Hunger. Bonn/Washington D.C./Dublin:
Welthungerhilfe, International Food Policy Research Institute (IFPRI),
ConcernWorldwide.
Weatherspoon, D. & Reardon, T. (2003). The Rise of Supermarkets in Africa:
Implications of Agro food Systems and the Rural Poor. Development Policy
Review 2003, 21(3), 333-355.
Wellington A. O. & Ada, M. (2006) Why Africa has Fallen Short of Building Dynamic
Agro-processing Capabilities: Constraints, Options and Prospects. ATPS
SPECIAL PAPER SERIES No. 29, African Technology Policy Studies
Network, P.O. Box 10081, 00100, General Post Office, Nairobi, Kenya.
Wilkinson, J. & Rocha, R. (2009) Agro-industry Trends, Patterns and Development
Impacts. In Agro-Industries for Development, ed. da Silva et al., Cambridge:
FAO and UNIDO.
World Bank & IMF, (2010). Global Monitoring Report 2010: The MDGs After the
Crisis.
World Bank & IMF, (2010). Global Monitoring Report 2010: The MDGs After the
Crisis.Washington D.C.: The World Bank.
World Bank (2004), Republic of Cameroon Development Review: A New Resolve to
Sustain Reforms for Inclusive Growth, World Bank Report No. 29268-CM,
Poverty Reduction and Economic Management Sector Unit, Africa Region,
Washington DC: World Bank.
World Bank (2006), World Development Indicators 2006, Washington DC: World Bank.

80
World Bank (2007), Africa Development indicators, [online], available:
http://siteresources.worldbank.org/AFRICAEXT/Resources/english_essay_
adi2010
World Bank, (2009), Doing Business 2009, 1818 H Street NW, Washington, DC 20433,
[online], available:www.doingbusiness.org
World Bank, (2009), Doing Business 2009, 1818 H Street NW, Washington, DC
20433, [online],
Yumkella, K. &Vinanchiarachi, J. (2003). Leading issues on Africa’s path to
industrialisation: The role of support systems and instruments. Journal of African
Economies, 12(10), pp.30-40.
APPENDISES
Appendix 1: Data set used in work
coffee tatot production in 1000usd
cocoa tatot production in million us palm total producton in million usd
120550.7 129.3069 10.02859 GDP in million usd
117412.5 130.7331 10.81404 8868.76
137772.7 116.1611 10.24488 8323.282
68436.73 120.3004 9.903379 8351.209
148154.2 133.55 12.74918 8713.916
107457.5 130.7066 11.83852 8583.777
141815.5 135.9759 10.7002 8435.864
88699.16 146.7024 11.3832 10314.47
128278.6 142.9465 11.61086 11242.98

81
124303.5 138.8591 12.29385 10990.06
108488.9 127.039 12.06619 10128.78
123637.3 115.9921 12.06619 11845.71
81866.23 108.077 12.06619 11381
73504.49 109.364 12.29385 11600.27
79226.53 118.2015 12.52151 12267
79502.64 148.028 12.74918 7113.905
111863.4 138.8879 14.57049 8912.611
68329.3 140.082 13.20451 9547.067
120899.9 138.0859 13.65983 9122.908
105287.3 128.1437 14.79815 9827.794
92609.83 135.4346 15.02582 10022.11
75742.38 134.8823 15.02582 9287.368
44048.76 138.0859 14.57049 9633.109
51569.28 171.1878 15.70881 10879.78
58015.44 184.211 15.93647 13621.74
64461.6 154.6562 15.70881 15775.36
66932.63 181.7795 20.03442 16587.86
51345.81 234.8774 19.80676 17953.07
54456.09 253.1976 20.03442 20431.78
51701.43 260.1538 20.48975 23322.26
71535.19 291.7224 20.48975 23381.14
28279.3 265.1249 14.57049 23622.48
40962.12 297.0956 13.65983 26587.31
44908.25 303.7889 14.11516 26472.05
40947.81 298.1569 29567.5
Appendix 2Trend of Variables

82
25
25.5
26
26.5
Log
Va
lues
1980 1990 2000 2010 2020Years
Trend of Cameroon GDP
19
19.5
20
20.5
Log
Va
lues
1980 1990 2000 2010 2020Years
Trend of Cocoa Production in Cameroon

83
17.5
18
18.5
19
19.5
20
Log
Va
lues
1980 1990 2000 2010 2020Years
Trend of Coffee Production in Cameroon
17.5
18
18.5
19
19.5
20
Log
Va
lues
1980 1990 2000 2010 2020Years
Trend of Palm Production in Cameroon

84
02
04
06
08
01
00
% P
rocesse
d
1980 1990 2000 2010 2020Years
cocoa coffee
palm
Percentage of Prodcuts Processed4
00
00
06
00
00
08
00
00
01
.0e+
06
1.2
e+
06
1.4
e+
06
US
$
1980 1990 2000 2010 2020Year
Trend of Total Agricultural Exports

85
0
200
00
04
00
00
06
00
00
08
00
00
0
US
$
1980 1990 2000 2010 2020Year
Trend of Cocoa Exports
0
1.0
e+
07
2.0
e+
07
3.0
e+
07
US
$
1980 1990 2000 2010 2020Year
Trend of Palm Exports

86
0
100
00
02
00
00
03
00
00
04
00
00
0
US
$
1980 1990 2000 2010 2020Year
Trend of Coffee Exports5
00
01
00
00
150
00
200
00
250
00
300
00
Mill
ion U
S$
1980 1990 2000 2010 2020Years
Trend of Cameroon GDP

87
Appendix 3: Regression result for Export earnings model
Source | SS df MS Number of obs = 34
-------------+------------------------------ F( 3, 30) = 17.86
Model | 2.32854178 3 .776180593 Prob> F = 0.0000
Residual | 1.30404753 30 .043468251 R-squared = 0.6410
-------------+------------------------------ Adj R-squared = 0.6051
Total | 3.63258931 33 .110078464 Root MSE = .20849
------------------------------------------------------------------------------
logtaexp | Coef. Std. Err. t P>|t| [95% Conf. Interval]
-------------+----------------------------------------------------------------
logcoexp | .414239 .0638311 6.49 0.000 .2838784 .5445996
logcofexp | .0760558 .0287255 2.65 0.013 .0173904 .1347211
logpalmexp | .0279439 .054265 0.51 0.610 .08288 -.1387677
_cons | 8.045464 1.370693 5.87 0.000 5.246136 10.84479
------------------------------------------------------------------------------
Appendix 4: Muticollinearity test for export earnings model
Variable | VIF 1/VIF
-------------+----------------------
logcoexp | 1.09 0.914957
logpalmexp | 1.09 0.917424
logcofexp | 1.00 0.997135
-------------+----------------------
Mean VIF | 1.06

88
Appendix 5: OLS-Without test for stationarity
Source | SS df MS Number of obs = 34
-------------+------------------------------ F( 3, 30) = 105.19
Model | 4.98457948 3 1.66152649 Prob> F = 0.0000
Residual | .473843772 30 .015794792 R-squared = 0.9132
-------------+------------------------------ Adj R-squared = 0.9045
Total | 5.45842326 33 .165406765 Root MSE = .12568
------------------------------------------------------------------------------
loggdp | Coef. Std. Err. t P>|t| [95% Conf. Interval]
-------------+----------------------------------------------------------------
logcocoa | .2244207 .0735332 3.05 0.005 .0742459 .3745954
logcoffee | -.0158446 .0576033 -0.28 0.785 -.1334861 .1017969
logpalm | .4415717 .0490395 9.00 0.000 .3414197 .5417238
_cons | 13.13682 1.610006 8.16 0.000 9.848752 16.42489
Durbin-Watson d-statistic( 4, 34) = .7905923

89
Appendix 6: OLS-after test for stationarity
Source | SS df MS Number of obs = 33
-------------+------------------------------ F( 3, 29) = 16.80
Model | .362365939 3 .120788646 Prob> F = 0.0000
Residual | .208472696 29 .007188714 R-squared = 0.6348
-------------+------------------------------ Adj R-squared = 0.5970
Total | .570838635 32 .017838707 Root MSE = .08479
------------------------------------------------------------------------------
D.loggdp | Coef. Std. Err. t P>|t| [95% Conf. Interval]
-------------+----------------------------------------------------------------
logcocoa |
D1. | .1075285 .056074 1.92 0.065 -.0071557 .2222127
|
logcoffee | -.0552602 .0297218 -1.86 0.073 -.1160482 .0055278
|
logpalm |
D1. | .2905378 .0587727 4.94 0.000 .1703341 .4107415
|
_cons | 1.04262 .551703 1.89 0.069 -.085739 2.17098
------------------------------------------------------------------------------
Durbin-Watson d-statistic( 4, 33) = 2.080891
Appendix 7: Summary statistics
Variable | Obs Mean Std. Dev. Min Max
-------------+--------------------------------------------------------
gdp_musd | 34 13609.3 6350.835 7113.905 29567.5
palm | 34 1.72e+08 1.42e+08 3.95e+07 5.09e+08
coffee | 34 1.42e+08 8.46e+07 4.46e+07 3.67e+08
cocoa | 34 4.57e+08 1.77e+08 2.13e+08 9.11e+08

90
Appendix 8: Test for Heteroskedasticity
Breusch-Pagan / Cook-Weisberg test for heteroskedasticity
Ho: Constant variance
Variables: fitted values of loggdp
chi2(1) = 0.27
Prob>chi2 = 0.6001
Appendix 9: Test for Multicollinearity
Variable | VIF 1/VIF
-------------+----------------------
logpalm | 2.84 0.352183
logcoffee | 2.08 0.480316
logcocoa | 1.64 0.608134
-------------+----------------------
Mean VIF | 2.19
APPENDIX 10: PAIRWISE CORRELATION RESULTS
| loggdplogcocoalogcof~elogpalm
-------------+------------------------------------
loggdp | 1.0000
|
|
logcocoa | 0.6369 1.0000
| 0.0001
|
logcoffee | -0.5687 -0.0750 1.0000
| 0.0004 0.6732
|
logpalm | 0.9397 0.5205 -0.6513 1.0000
| 0.0000 0.0016 0.0000

91
Appendix 11: Test for unit root (stationarity)
. pperronlogcocoa
Phillips-Perron test for unit root Number of obs = 33
Newey-West lags = 3
---------- Interpolated Dickey-Fuller ---------
Test 1% Critical 5% Critical 10% Critical
Statistic Value ValueValue
------------------------------------------------------------------------------
Z(rho) -12.331 -17.744 -12.756 -10.360
Z(t) -2.565 -3.696 -2.978 -2.620
------------------------------------------------------------------------------
MacKinnon approximate p-value for Z(t) = 0.1005
. pperrond.logcocoa
Phillips-Perron test for unit root Number of obs = 32
Newey-West lags = 3
---------- Interpolated Dickey-Fuller ---------
Test 1% Critical 5% Critical 10% Critical
Statistic Value ValueValue
------------------------------------------------------------------------------
Z(rho) -27.863 -17.676 -12.724 -10.340
Z(t) -5.656 -3.702 -2.980 -2.622
------------------------------------------------------------------------------
MacKinnon approximate p-value for Z(t) = 0.0000
. pperronlogcoffee
Phillips-Perron test for unit root Number of obs = 33
Newey-West lags = 3
---------- Interpolated Dickey-Fuller ---------
Test 1% Critical 5% Critical 10% Critical
Statistic Value ValueValue
------------------------------------------------------------------------------
Z(rho) -9.752 -17.744 -12.756 -10.360
Z(t) -2.686 -3.696 -2.978 -2.620
------------------------------------------------------------------------------
MacKinnon approximate p-value for Z(t) = 0.0764
. pperronlogpalm
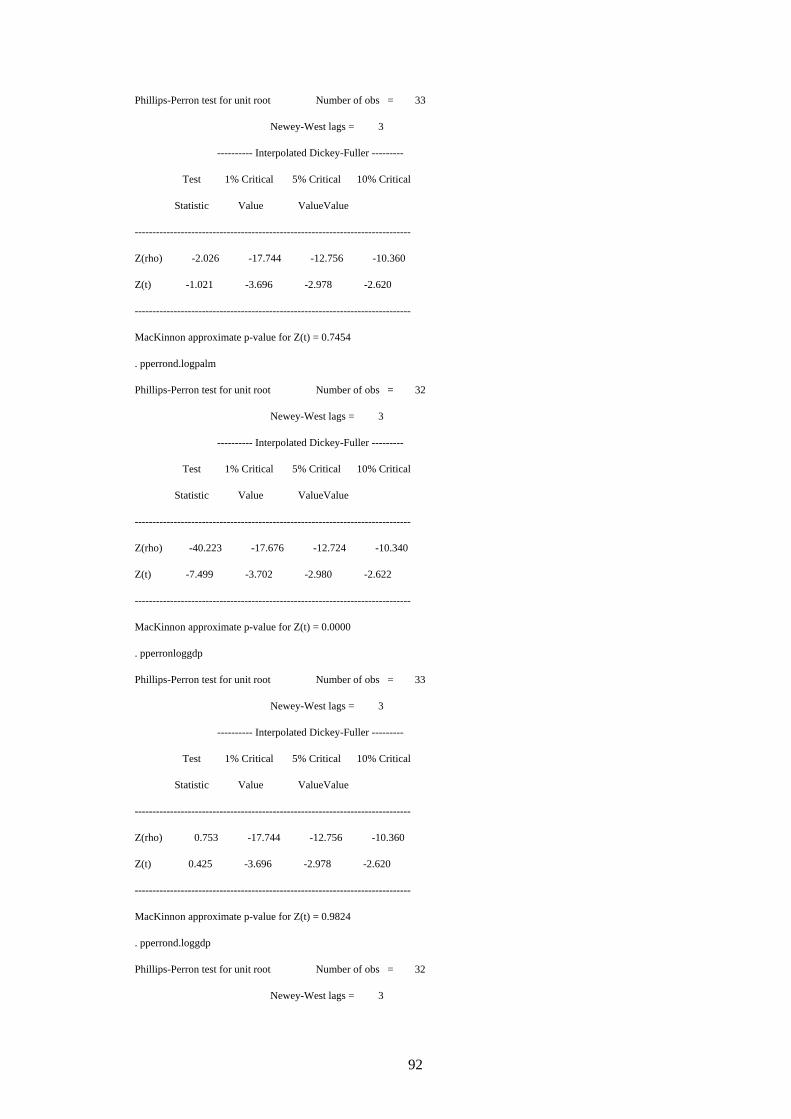
92
Phillips-Perron test for unit root Number of obs = 33
Newey-West lags = 3
---------- Interpolated Dickey-Fuller ---------
Test 1% Critical 5% Critical 10% Critical
Statistic Value ValueValue
------------------------------------------------------------------------------
Z(rho) -2.026 -17.744 -12.756 -10.360
Z(t) -1.021 -3.696 -2.978 -2.620
------------------------------------------------------------------------------
MacKinnon approximate p-value for Z(t) = 0.7454
. pperrond.logpalm
Phillips-Perron test for unit root Number of obs = 32
Newey-West lags = 3
---------- Interpolated Dickey-Fuller ---------
Test 1% Critical 5% Critical 10% Critical
Statistic Value ValueValue
------------------------------------------------------------------------------
Z(rho) -40.223 -17.676 -12.724 -10.340
Z(t) -7.499 -3.702 -2.980 -2.622
------------------------------------------------------------------------------
MacKinnon approximate p-value for Z(t) = 0.0000
. pperronloggdp
Phillips-Perron test for unit root Number of obs = 33
Newey-West lags = 3
---------- Interpolated Dickey-Fuller ---------
Test 1% Critical 5% Critical 10% Critical
Statistic Value ValueValue
------------------------------------------------------------------------------
Z(rho) 0.753 -17.744 -12.756 -10.360
Z(t) 0.425 -3.696 -2.978 -2.620
------------------------------------------------------------------------------
MacKinnon approximate p-value for Z(t) = 0.9824
. pperrond.loggdp
Phillips-Perron test for unit root Number of obs = 32
Newey-West lags = 3

93
---------- Interpolated Dickey-Fuller ---------
Test 1% Critical 5% Critical 10% Critical
Statistic Value ValueValue
------------------------------------------------------------------------------
Z(rho) -36.840 -17.676 -12.724 -10.340
Z(t) -6.491 -3.702 -2.980 -2.622
------------------------------------------------------------------------------
MacKinnon approximate p-value for Z(t) = 0.0000
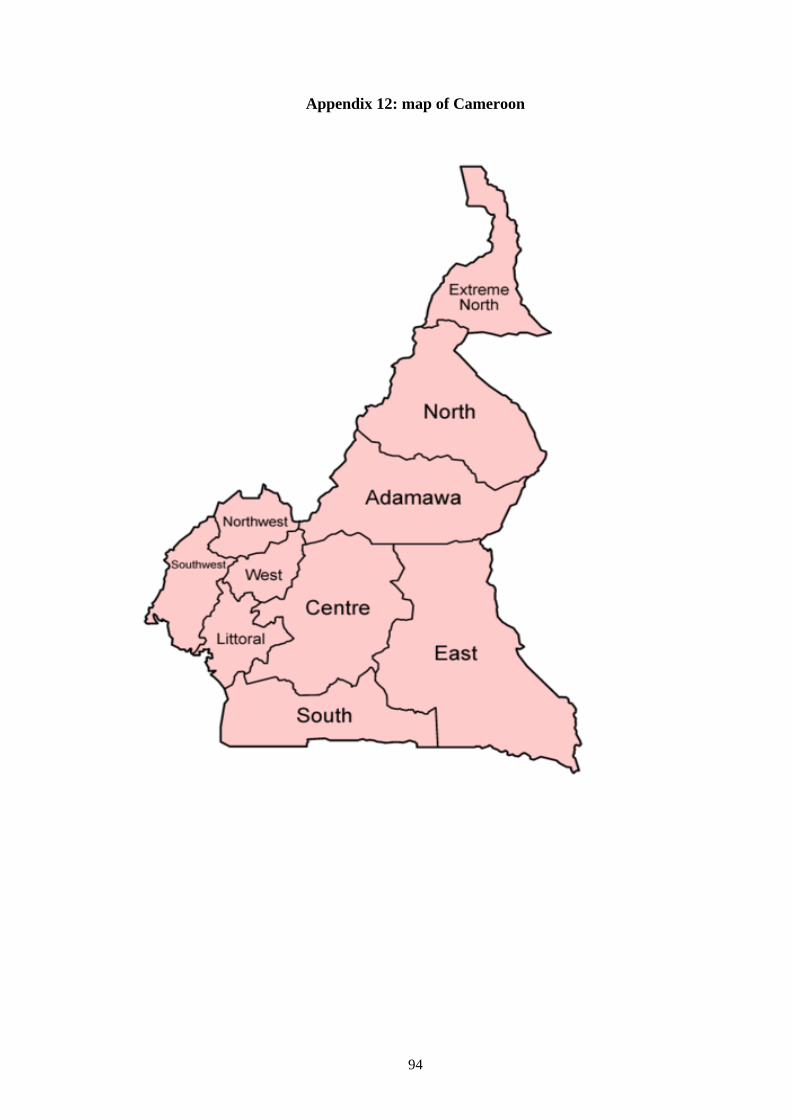
94
Appendix 12: map of Cameroon