Embed Size (px)
Citation preview
PRESENTATION ON 22nd NATIONAL AWARD FOR EXCELLENCE IN ENERGY MANAGEMENT
PANASONIC LIFE SOLUTIONS INDIA PVT LTD.Unit-05, Daman
Mr. Ashish SinghPan India Head- Facility Management & EHS,Factory Manager- Daman Unit-05CII Certified Energy Efficiency professional
Mr. Viral VadgamaAsst. General Manager-Facility Management
CII Certified Energy Efficiency professional
Mr. Bijalkumar PatelDy. Manager-Facility Management(Certified Energy Auditor and Manager)CII Certified Energy Efficiency professional
Mr. Brijrajsinh RanaExecutive Engineer – Facility Management
2ORGANOGRAM FOR THE ENERGY CELL
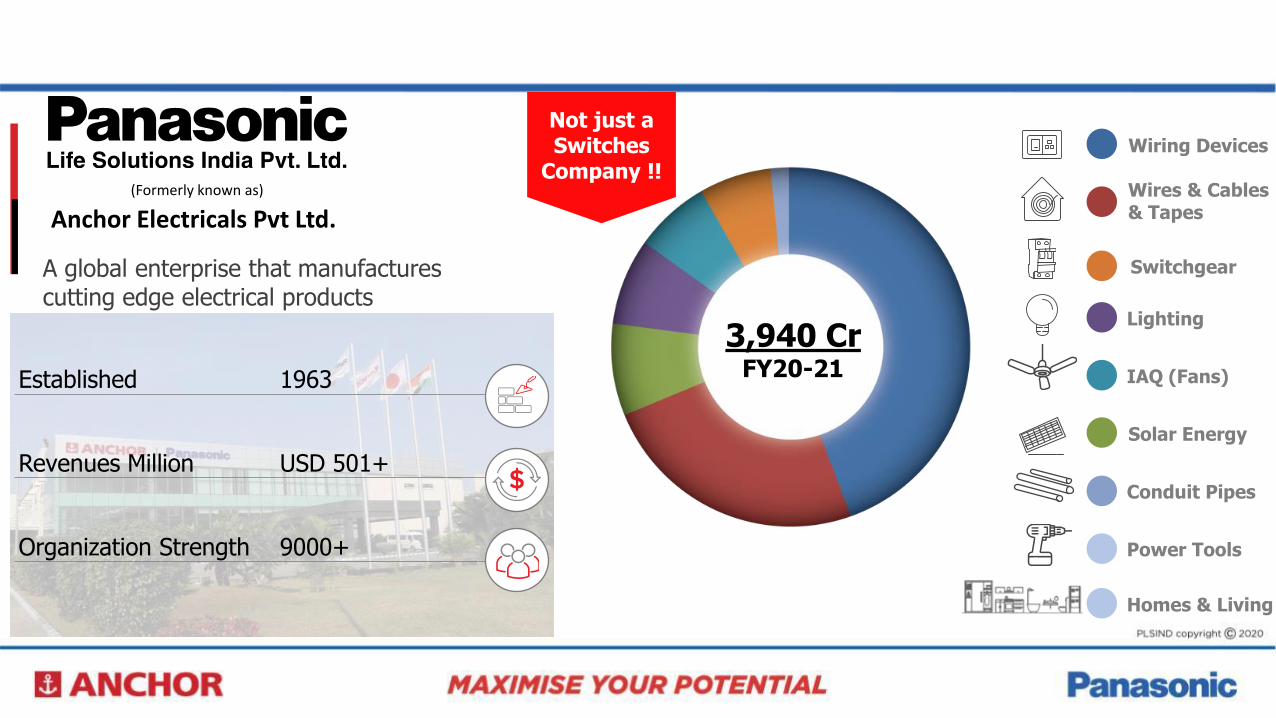
Established 1963
Revenues Million USD 501+
Organization Strength 9000+
A global enterprise that manufactures cutting edge electrical products
Anchor Electricals Pvt Ltd.(Formerly known as)
3,940 CrFY20-21
Wiring Devices
Switchgear
Wires & Cables & Tapes
Lighting
IAQ (Fans)
Solar Energy
Conduit Pipes
Power Tools
Homes & Living
Not just a Switches
Company !!

ENERGY POLICY 6
Continuous monitoring and
controlling energy consumption.
Management commitment for adopting energy efficient
technology, product and design.
Continual improvement is
process to reduce energy performance.
Energy conservation awareness to all
employees.
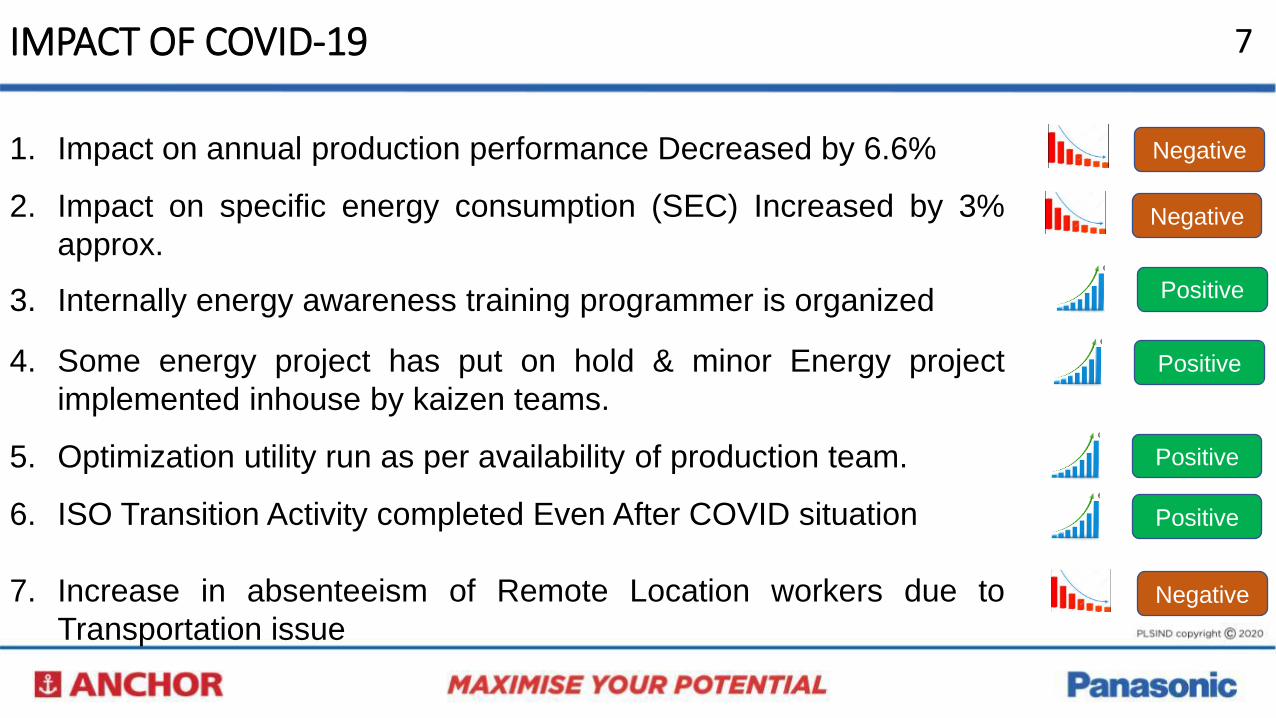
1. Impact on annual production performance Decreased by 6.6%
2. Impact on specific energy consumption (SEC) Increased by 3%
approx.
3. Internally energy awareness training programmer is organized
4. Some energy project has put on hold & minor Energy project
implemented inhouse by kaizen teams.
5. Optimization utility run as per availability of production team.
6. ISO Transition Activity completed Even After COVID situation
7. Increase in absenteeism of Remote Location workers due to
Transportation issue
Positive
7IMPACT OF COVID-19
Negative
Negative
Positive
Positive
Positive
Negative
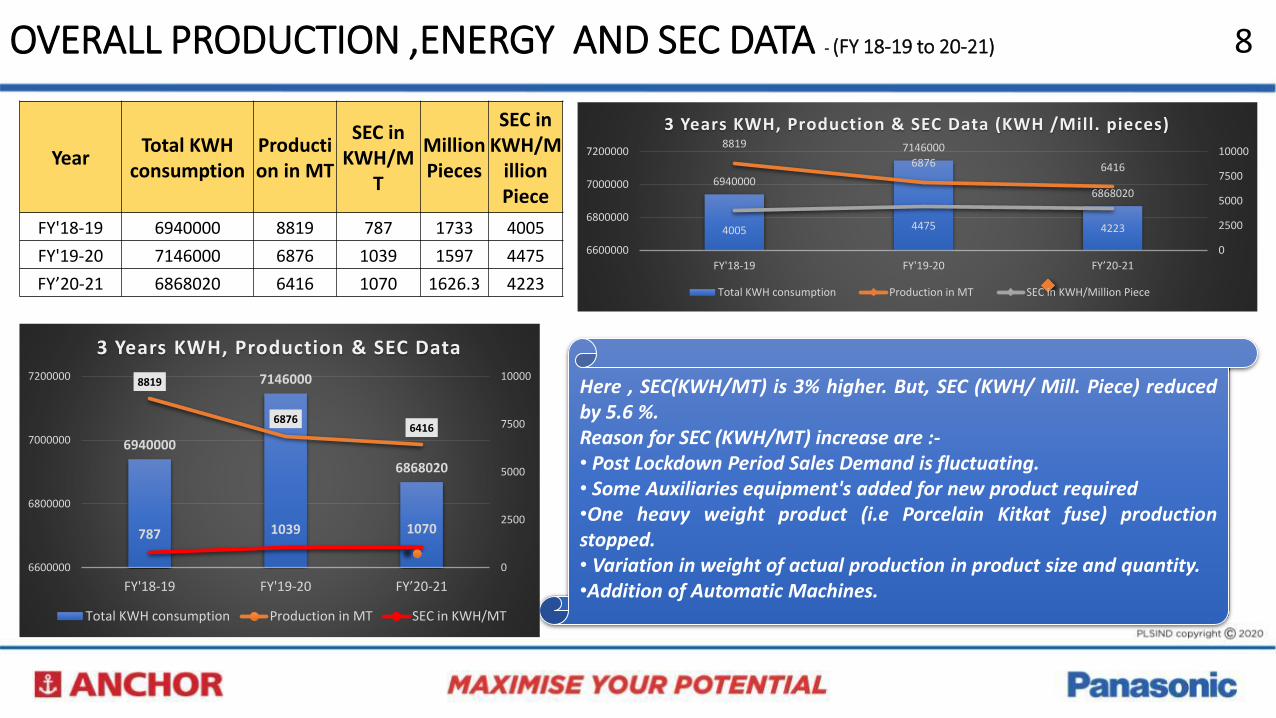
OVERALL PRODUCTION ,ENERGY AND SEC DATA - (FY 18-19 to 20-21) 8
Here , SEC(KWH/MT) is 3% higher. But, SEC (KWH/ Mill. Piece) reducedby 5.6 %.Reason for SEC (KWH/MT) increase are :-• Post Lockdown Period Sales Demand is fluctuating.• Some Auxiliaries equipment's added for new product required•One heavy weight product (i.e Porcelain Kitkat fuse) productionstopped.• Variation in weight of actual production in product size and quantity.•Addition of Automatic Machines.
6940000
7146000
6868020
8819
68766416
787 1039 1070
0
2500
5000
7500
10000
6600000
6800000
7000000
7200000
FY'18-19 FY'19-20 FY’20-21
3 Years KWH, Production & SEC Data
Total KWH consumption Production in MT SEC in KWH/MT
6940000
7146000
6868020
8819
6876 6416
4005 4475 4223
0
2500
5000
7500
10000
6600000
6800000
7000000
7200000
FY'18-19 FY'19-20 FY’20-21
3 Years KWH, Production & SEC Data (KWH /Mill. pieces)
Total KWH consumption Production in MT SEC in KWH/Million Piece
YearTotal KWH
consumptionProduction in MT
SEC in KWH/M
T
Million Pieces
SEC in KWH/M
illion Piece
FY'18-19 6940000 8819 787 1733 4005
FY'19-20 7146000 6876 1039 1597 4475
FY’20-21 6868020 6416 1070 1626.3 4223
9
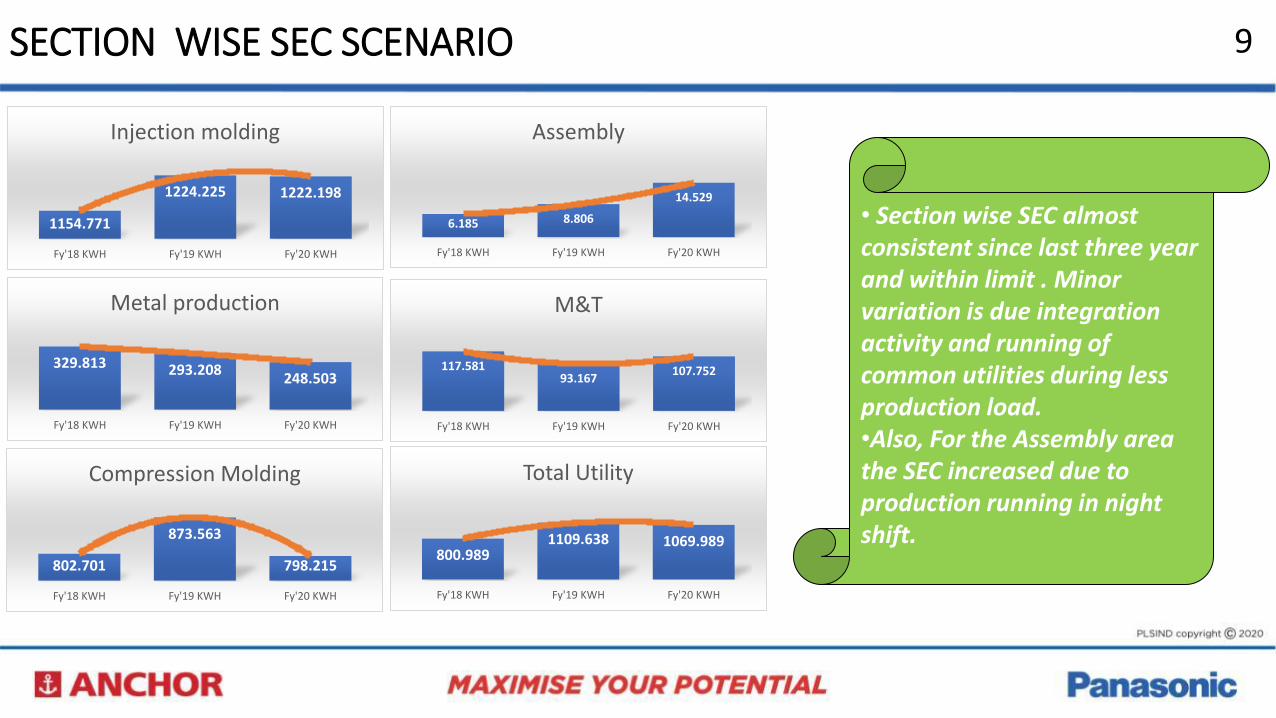
• Section wise SEC almost consistent since last three year and within limit . Minor variation is due integration activity and running of common utilities during less production load. •Also, For the Assembly area the SEC increased due to production running in night shift.
SECTION WISE SEC SCENARIO
1154.771
1224.225 1222.198
Fy'18 KWH Fy'19 KWH Fy'20 KWH
Injection molding
329.813 293.208248.503
Fy'18 KWH Fy'19 KWH Fy'20 KWH
Metal production
802.701
873.563
798.215
Fy'18 KWH Fy'19 KWH Fy'20 KWH
Compression Molding
800.9891109.638 1069.989
Fy'18 KWH Fy'19 KWH Fy'20 KWH
Total Utility
6.185 8.806
14.529
Fy'18 KWH Fy'19 KWH Fy'20 KWH
Assembly
117.58193.167
107.752
Fy'18 KWH Fy'19 KWH Fy'20 KWH
M&T
10
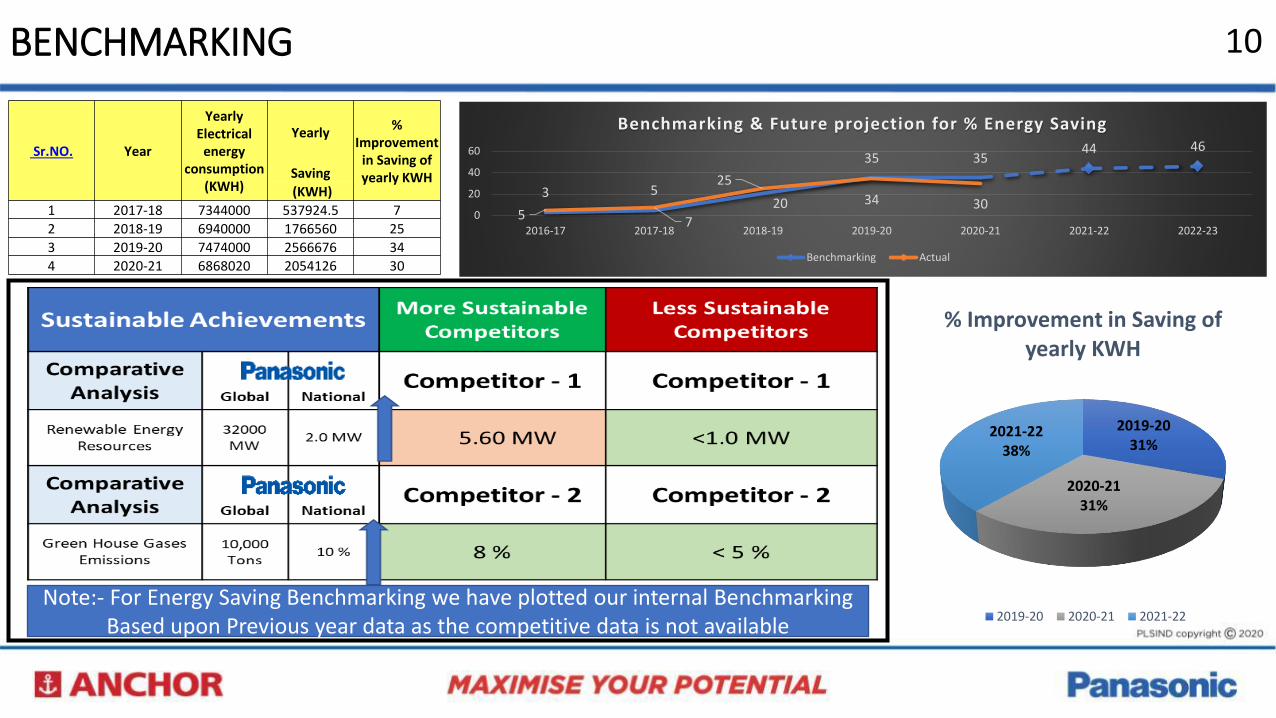
Sr.NO. Year
Yearly Electrical
energy consumption
(KWH)
Yearly %
Improvement in Saving of yearly KWHSaving
(KWH)
1 2017-18 7344000 537924.5 7
2 2018-19 6940000 1766560 25
3 2019-20 7474000 2566676 34
4 2020-21 6868020 2054126 30
BENCHMARKING
Note:- For Energy Saving Benchmarking we have plotted our internal Benchmarking Based upon Previous year data as the competitive data is not available
3 520
35 3544 46
5 7
25
34 300
20
40
60
2016-17 2017-18 2018-19 2019-20 2020-21 2021-22 2022-23
Benchmarking & Future projection for % Energy Saving
Benchmarking Actual
2019-2031%
2020-2131%
2021-2238%
% Improvement in Saving of yearly KWH
2019-20 2020-21 2021-22
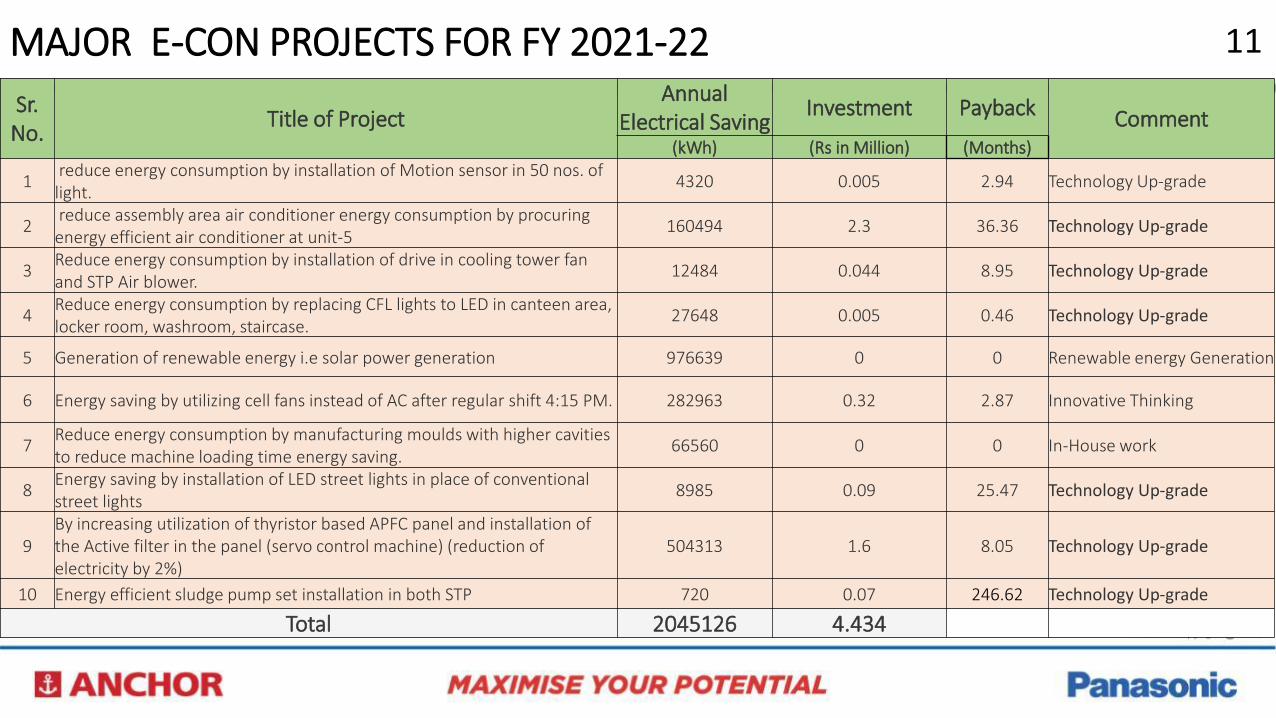
MAJOR E-CON PROJECTS FOR FY 2021-22 11
Sr. No.
Title of ProjectAnnual
Electrical SavingInvestment Payback Comment
(kWh) (Rs in Million) (Months)
1reduce energy consumption by installation of Motion sensor in 50 nos. of light.
4320 0.005 2.94 Technology Up-grade
2reduce assembly area air conditioner energy consumption by procuring energy efficient air conditioner at unit-5
160494 2.3 36.36 Technology Up-grade
3Reduce energy consumption by installation of drive in cooling tower fan and STP Air blower.
12484 0.044 8.95 Technology Up-grade
4Reduce energy consumption by replacing CFL lights to LED in canteen area, locker room, washroom, staircase.
27648 0.005 0.46 Technology Up-grade
5 Generation of renewable energy i.e solar power generation 976639 0 0 Renewable energy Generation
6 Energy saving by utilizing cell fans instead of AC after regular shift 4:15 PM. 282963 0.32 2.87 Innovative Thinking
7Reduce energy consumption by manufacturing moulds with higher cavities to reduce machine loading time energy saving.
66560 0 0 In-House work
8Energy saving by installation of LED street lights in place of conventional street lights
8985 0.09 25.47 Technology Up-grade
9By increasing utilization of thyristor based APFC panel and installation of the Active filter in the panel (servo control machine) (reduction of electricity by 2%)
504313 1.6 8.05 Technology Up-grade
10 Energy efficient sludge pump set installation in both STP 720 0.07 246.62 Technology Up-grade
Total 2045126 4.434
12
79 10
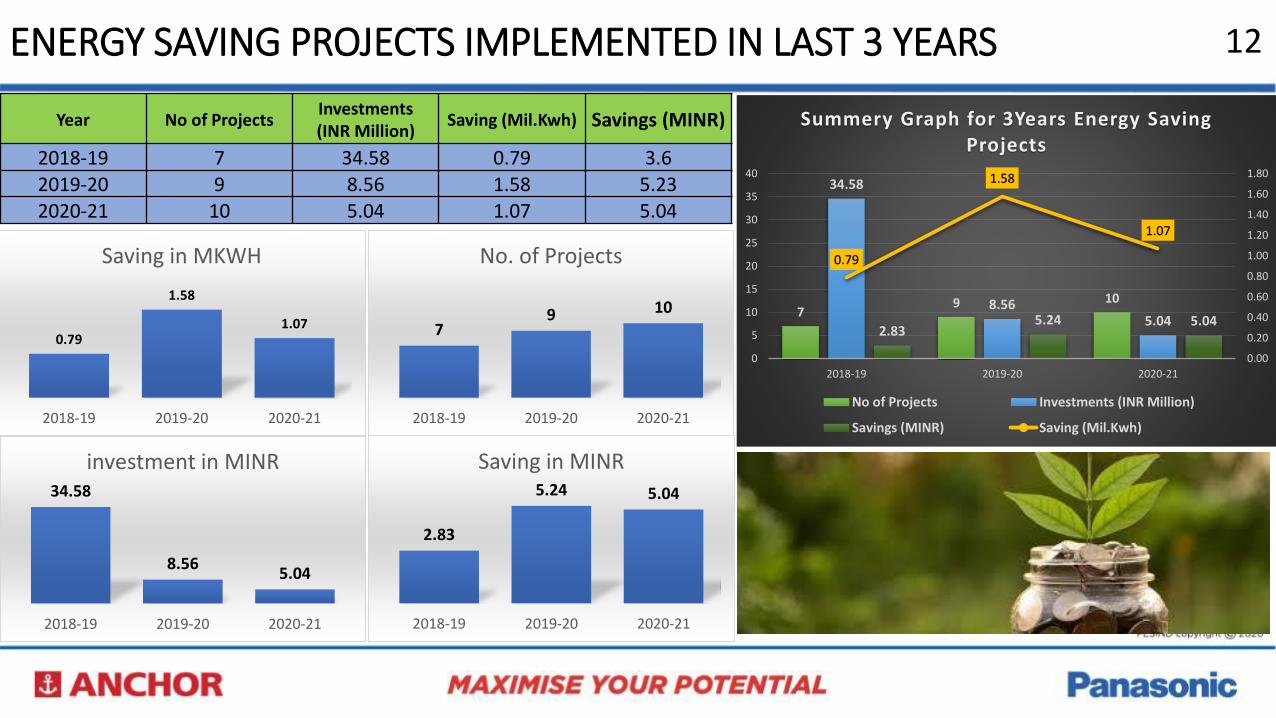
2018-19 2019-20 2020-21
No. of Projects
34.58
8.565.04
2018-19 2019-20 2020-21
investment in MINR
0.79
1.58
1.07
2018-19 2019-20 2020-21
Saving in MKWH
2.83
5.24 5.04
2018-19 2019-20 2020-21
Saving in MINR
Year No of ProjectsInvestments(INR Million)
Saving (Mil.Kwh) Savings (MINR)
2018-19 7 34.58 0.79 3.62019-20 9 8.56 1.58 5.232020-21 10 5.04 1.07 5.04
ENERGY SAVING PROJECTS IMPLEMENTED IN LAST 3 YEARS
79 10
34.58
8.565.04
2.835.24 5.04
0.79
1.58
1.07
0.00
0.20
0.40
0.60
0.80
1.00
1.20
1.40
1.60
1.80
0
5
10
15
20
25
30
35
40
2018-19 2019-20 2020-21
Summery Graph for 3Years Energy Saving Projects
No of Projects Investments (INR Million)
Savings (MINR) Saving (Mil.Kwh)
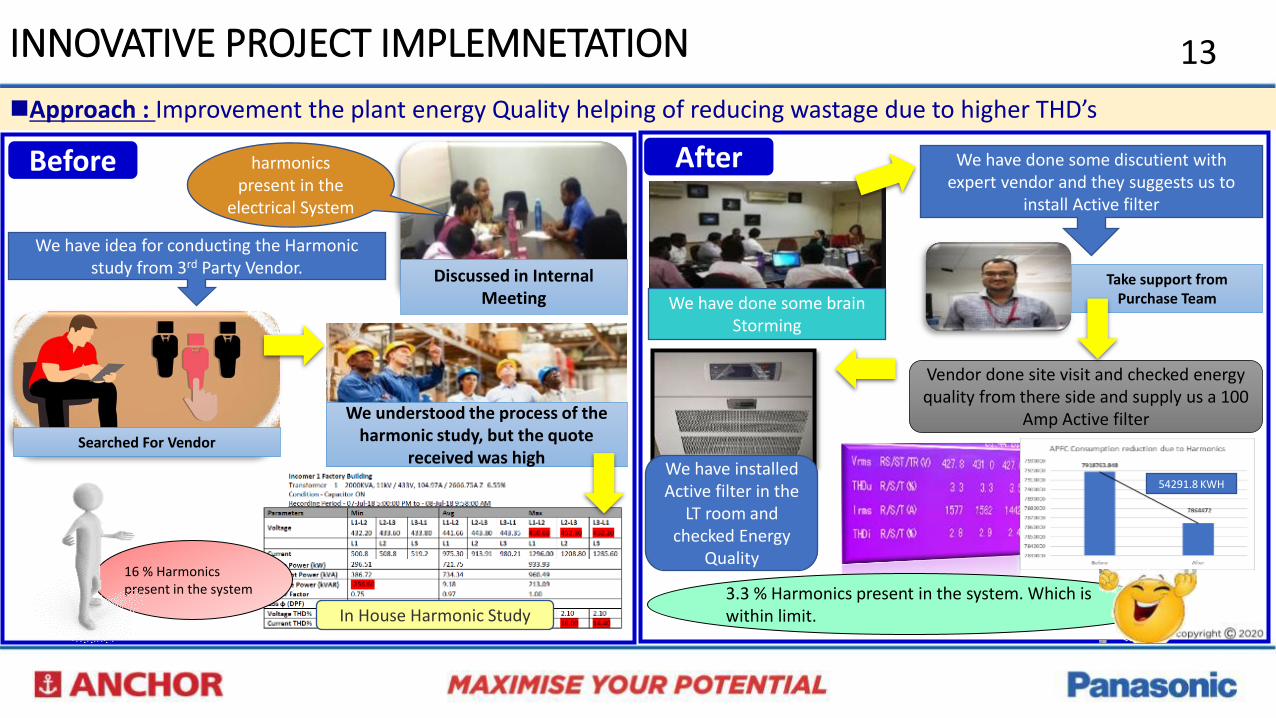
13INNOVATIVE PROJECT IMPLEMNETATION
◼Approach : Improvement the plant energy Quality helping of reducing wastage due to higher THD’s
Before After
Discussed in Internal Meeting
harmonics present in the
electrical System
We have idea for conducting the Harmonic study from 3rd Party Vendor.
Searched For Vendor
We understood the process of the harmonic study, but the quote
received was high
16 % Harmonicspresent in the system
In House Harmonic Study
We have done some brain Storming
We have done some discutient with expert vendor and they suggests us to
install Active filter
Take support from Purchase Team
Vendor done site visit and checked energy quality from there side and supply us a 100
Amp Active filter
We have installed Active filter in the
LT room and checked Energy
Quality
3.3 % Harmonics present in the system. Which is within limit.
54291.8 KWH
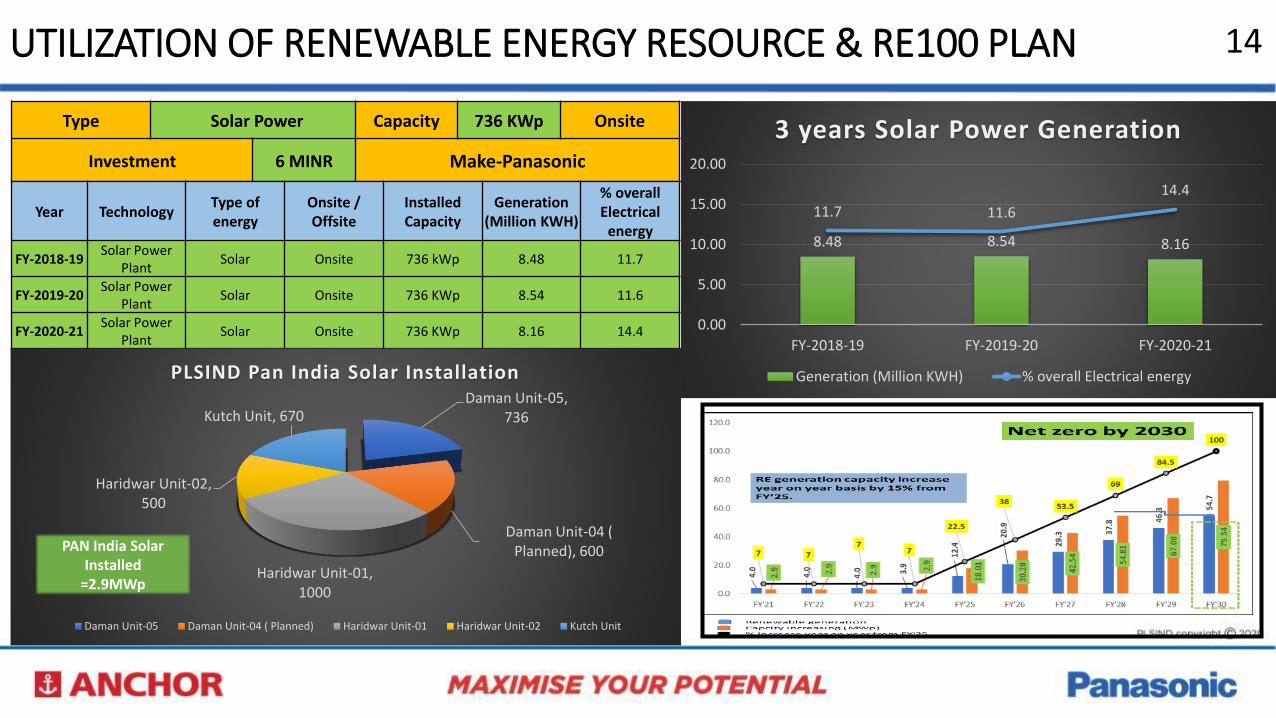
UTILIZATION OF RENEWABLE ENERGY RESOURCE & RE100 PLAN 14
Type Solar Power Capacity 736 KWp Onsite
Investment 6 MINR Make-Panasonic
8.48 8.54 8.16
11.7 11.6
14.4
0.00
5.00
10.00
15.00
20.00
FY-2018-19 FY-2019-20 FY-2020-21
3 years Solar Power Generation
Generation (Million KWH) % overall Electrical energy
Year TechnologyType of energy
Onsite / Offsite
Installed Capacity
Generation (Million KWH)
% overall Electrical
energy
FY-2018-19Solar Power
PlantSolar Onsite 736 kWp 8.48 11.7
FY-2019-20Solar Power
PlantSolar Onsite 736 KWp 8.54 11.6
FY-2020-21Solar Power
PlantSolar Onsite 736 KWp 8.16 14.4
Daman Unit-05, 736
Daman Unit-04 ( Planned), 600
Haridwar Unit-01, 1000
Haridwar Unit-02, 500
Kutch Unit, 670
PLSIND Pan India Solar Installation
Daman Unit-05 Daman Unit-04 ( Planned) Haridwar Unit-01 Haridwar Unit-02 Kutch Unit
PAN India Solar Installed
=2.9MWp
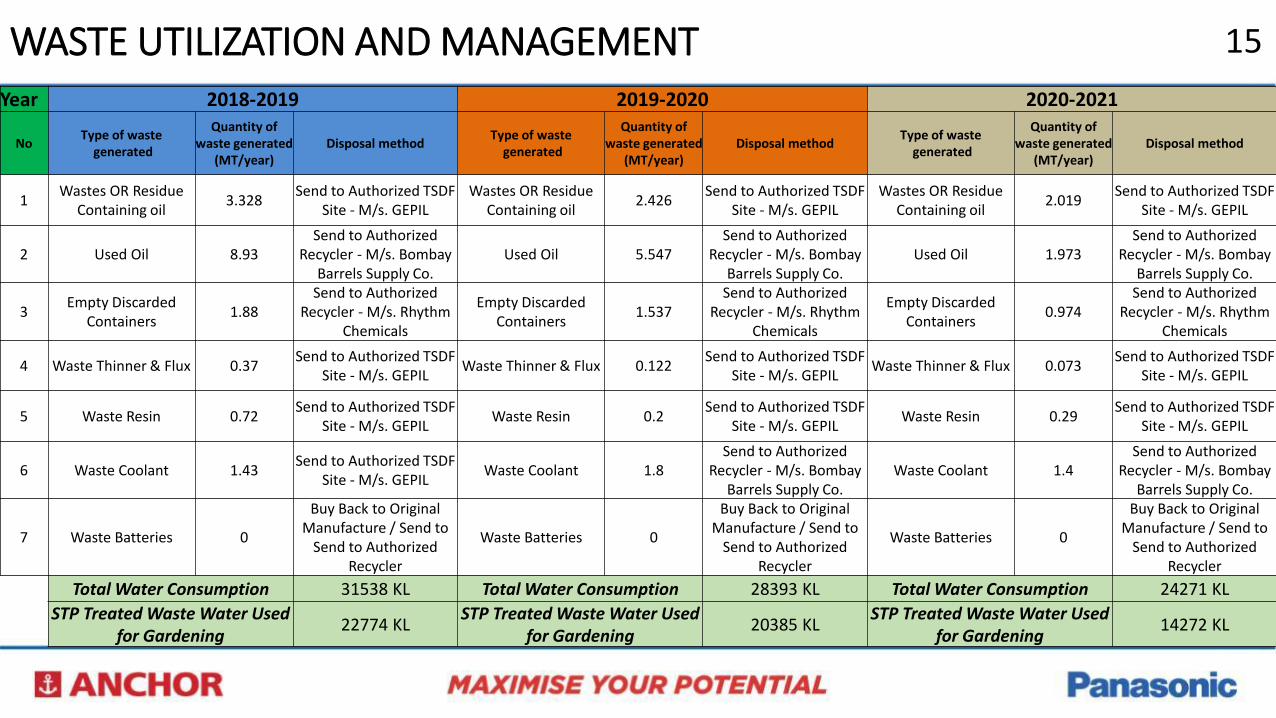
15WASTE UTILIZATION AND MANAGEMENTYear 2018-2019 2019-2020 2020-2021
NoType of waste
generated
Quantity of waste generated
(MT/year)Disposal method
Type of wastegenerated
Quantity of waste generated
(MT/year)Disposal method
Type of wastegenerated
Quantity of waste generated
(MT/year)Disposal method
1Wastes OR Residue
Containing oil3.328
Send to Authorized TSDF Site - M/s. GEPIL
Wastes OR Residue Containing oil
2.426Send to Authorized TSDF
Site - M/s. GEPILWastes OR Residue
Containing oil2.019
Send to Authorized TSDF Site - M/s. GEPIL
2 Used Oil 8.93Send to Authorized
Recycler - M/s. Bombay Barrels Supply Co.
Used Oil 5.547Send to Authorized
Recycler - M/s. Bombay Barrels Supply Co.
Used Oil 1.973Send to Authorized
Recycler - M/s. Bombay Barrels Supply Co.
3Empty Discarded
Containers1.88
Send to Authorized Recycler - M/s. Rhythm
Chemicals
Empty Discarded Containers
1.537Send to Authorized
Recycler - M/s. Rhythm Chemicals
Empty Discarded Containers
0.974Send to Authorized
Recycler - M/s. Rhythm Chemicals
4 Waste Thinner & Flux 0.37Send to Authorized TSDF
Site - M/s. GEPILWaste Thinner & Flux 0.122
Send to Authorized TSDF Site - M/s. GEPIL
Waste Thinner & Flux 0.073Send to Authorized TSDF
Site - M/s. GEPIL
5 Waste Resin 0.72Send to Authorized TSDF
Site - M/s. GEPILWaste Resin 0.2
Send to Authorized TSDF Site - M/s. GEPIL
Waste Resin 0.29Send to Authorized TSDF
Site - M/s. GEPIL
6 Waste Coolant 1.43Send to Authorized TSDF
Site - M/s. GEPILWaste Coolant 1.8
Send to Authorized Recycler - M/s. Bombay
Barrels Supply Co.Waste Coolant 1.4
Send to Authorized Recycler - M/s. Bombay
Barrels Supply Co.
7 Waste Batteries 0
Buy Back to Original Manufacture / Send to
Send to Authorized Recycler
Waste Batteries 0
Buy Back to Original Manufacture / Send to
Send to Authorized Recycler
Waste Batteries 0
Buy Back to Original Manufacture / Send to
Send to Authorized Recycler
Total Water Consumption 31538 KL Total Water Consumption 28393 KL Total Water Consumption 24271 KL
STP Treated Waste Water Used for Gardening
22774 KLSTP Treated Waste Water Used
for Gardening20385 KL
STP Treated Waste Water Used for Gardening
14272 KL

GHG INVENTARISATION – Monthly Energy results are being submitted on Panasonic Global portal 16
Sr.No YearSaved Co2
Emission in TonSaved Co2
Emission in KG
1 FY'18-19 1625.598232 1495.550373
2 FY'19-20 2351.43352 2163.318838
3 FY'20-21 2789.0858 2565.958936
Last year three year % wise PLSIND Contribution for CO2 emission
reduction
FY'18-1924%
FY'19-2035%
FY'20-2141%
Saved Co2 Emission in Ton
FY'18-19
FY'19-20
FY'20-21
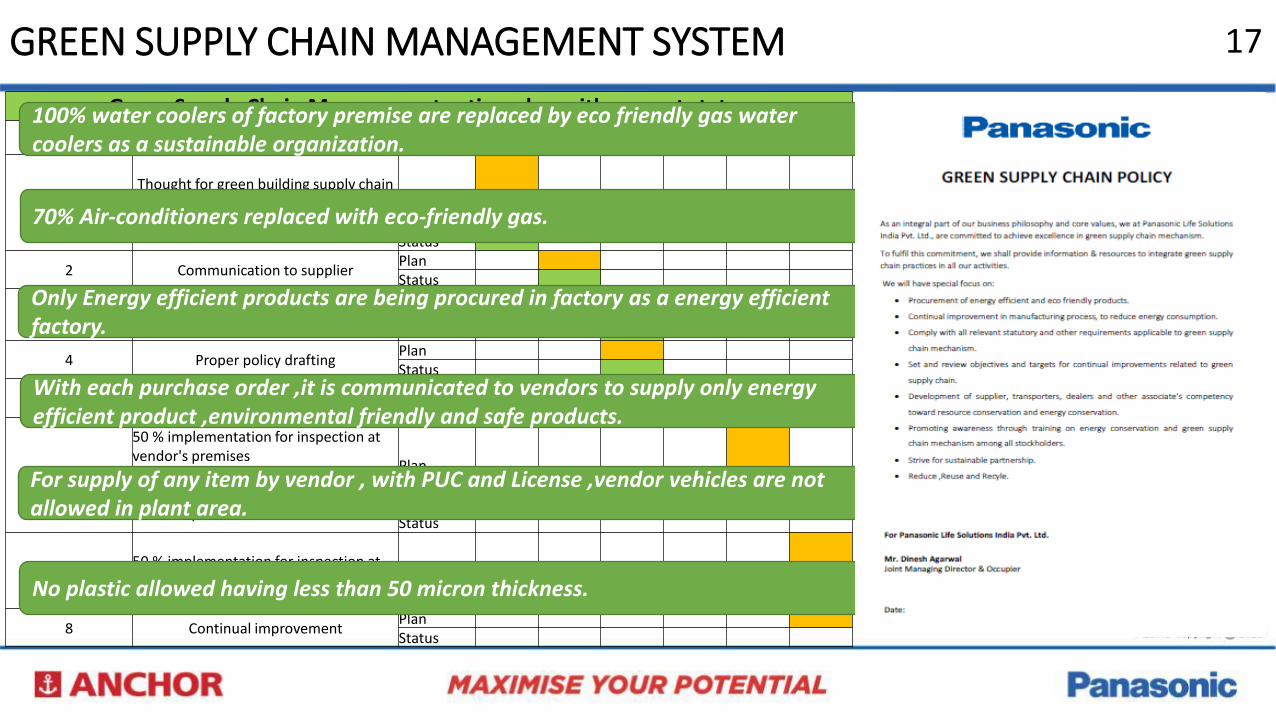
Green Supply Chain Management action plan with current status
Sr.No Activity Plan/Status 2017 2018 2019 2020 2021 2022
1Thought for green building supply chain mechanism implementation with few
small implementation ideas PlanStatus
2 Communication to supplier PlanStatus
3Material inspection started as per green
supply chain mechanism check sheet
Plan
Status
4 Proper policy draftingPlanStatus
5 Policy sharing to All vendorsPlanStatus
6
50 % implementation for inspection at vendor's premises
Plan
50 % implementation for inspection at vendor's premises
Status
750 % implementation for inspection at vendor's premises Plan
Status
8 Continual improvement PlanStatus
100% water coolers of factory premise are replaced by eco friendly gas water coolers as a sustainable organization.
GREEN SUPPLY CHAIN MANAGEMENT SYSTEM 17
Process flow for green supply chain mechanism
70% Air-conditioners replaced with eco-friendly gas.
Only Energy efficient products are being procured in factory as a energy efficient factory.
With each purchase order ,it is communicated to vendors to supply only energy efficient product ,environmental friendly and safe products.
For supply of any item by vendor , with PUC and License ,vendor vehicles are not allowed in plant area.
No plastic allowed having less than 50 micron thickness.
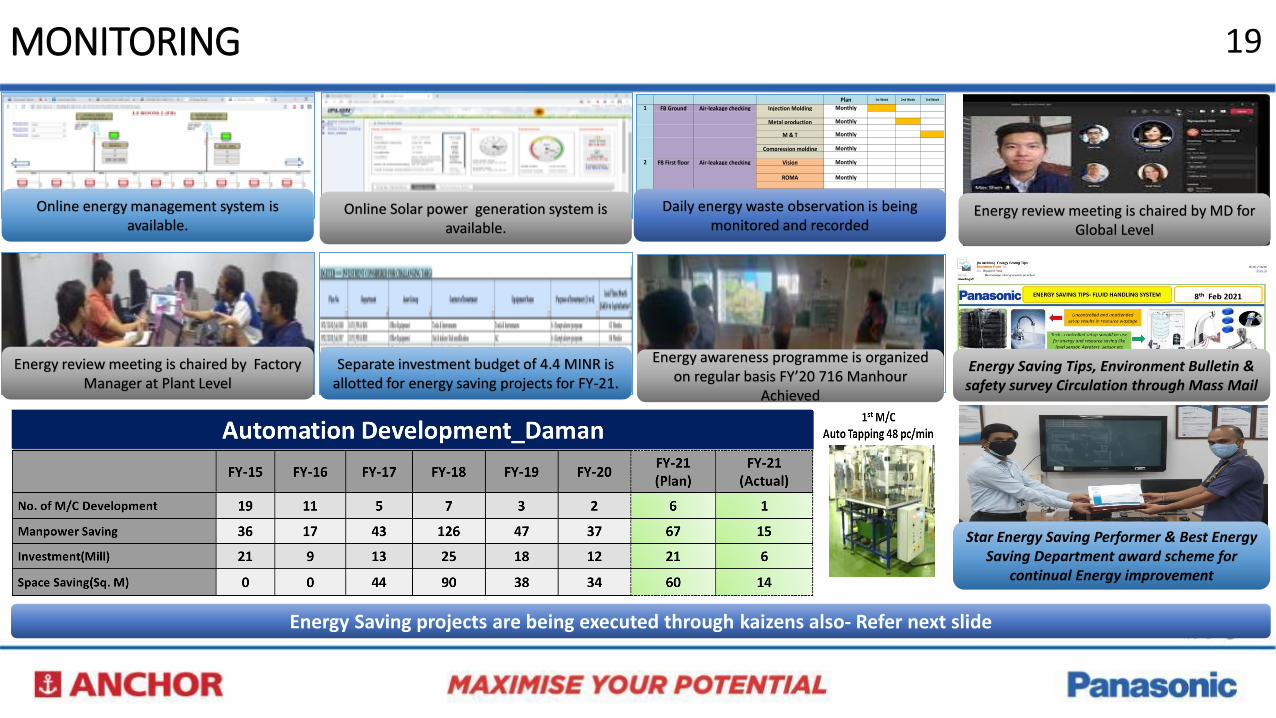
MONITORING 19
Plan 1st Week 2nd Week 3rd Week
1 FB Ground Air-leakage checking Injection Molding Monthly
Metal production Monthly
M & T Monthly
Compression molding Monthly
2 FB First floor Air-leakage checking Vision Monthly
ROMA Monthly
KITKAT & ROMA Monthly
Non-Modular MonthlyOnline energy management system is available.
Online Solar power generation system is available.
Daily energy waste observation is being monitored and recorded
Energy review meeting is chaired by MD for Global Level
Energy review meeting is chaired by Factory Manager at Plant Level
Separate investment budget of 4.4 MINR is allotted for energy saving projects for FY-21.
Energy awareness programme is organized on regular basis FY’20 716 Manhour
Achieved
Energy Saving projects are being executed through kaizens also- Refer next slide
Energy Saving Tips, Environment Bulletin & safety survey Circulation through Mass Mail
Star Energy Saving Performer & Best Energy Saving Department award scheme for
continual Energy improvement
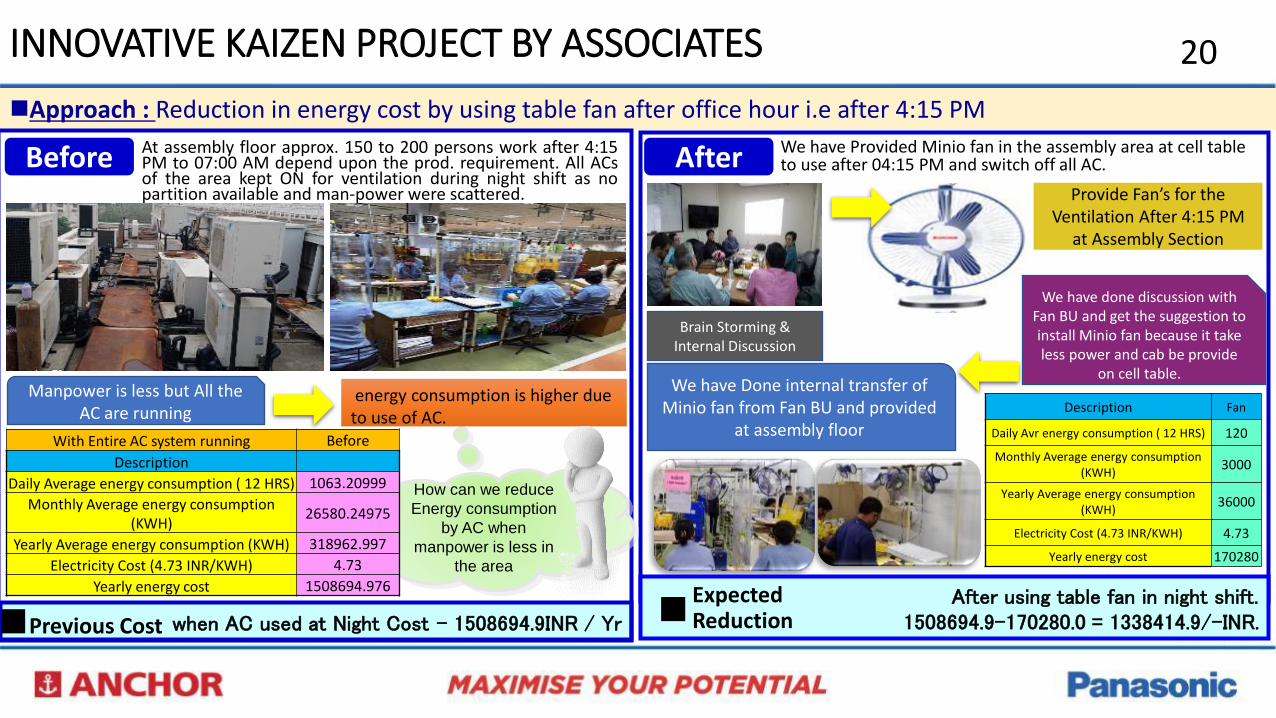
◼Approach : Reduction in energy cost by using table fan after office hour i.e after 4:15 PM
20
when AC used at Night Cost – 1508694.9INR / Yr■Previous Cost
Before AfterAt assembly floor approx. 150 to 200 persons work after 4:15PM to 07:00 AM depend upon the prod. requirement. All ACsof the area kept ON for ventilation during night shift as nopartition available and man-power were scattered.
How can we reduce
Energy consumption
by AC when
manpower is less in
the area
We have Provided Minio fan in the assembly area at cell table to use after 04:15 PM and switch off all AC.
Brain Storming & Internal Discussion
Provide Fan’s for the Ventilation After 4:15 PM
at Assembly Section
We have done discussion with Fan BU and get the suggestion to install Minio fan because it take less power and cab be provide
on cell table.We have Done internal transfer of
Minio fan from Fan BU and provided at assembly floor
Description Fan
Daily Avr energy consumption ( 12 HRS) 120
Monthly Average energy consumption (KWH)
3000
Yearly Average energy consumption (KWH)
36000
Electricity Cost (4.73 INR/KWH) 4.73
Yearly energy cost 170280
Manpower is less but All the AC are running
energy consumption is higher due to use of AC.
With Entire AC system running Before
Description
Daily Average energy consumption ( 12 HRS) 1063.20999
Monthly Average energy consumption (KWH)
26580.24975
Yearly Average energy consumption (KWH) 318962.997
Electricity Cost (4.73 INR/KWH) 4.73
Yearly energy cost 1508694.976After using table fan in night shift.
1508694.9-170280.0 = 1338414.9/-INR.■Expected Reduction
INNOVATIVE KAIZEN PROJECT BY ASSOCIATES
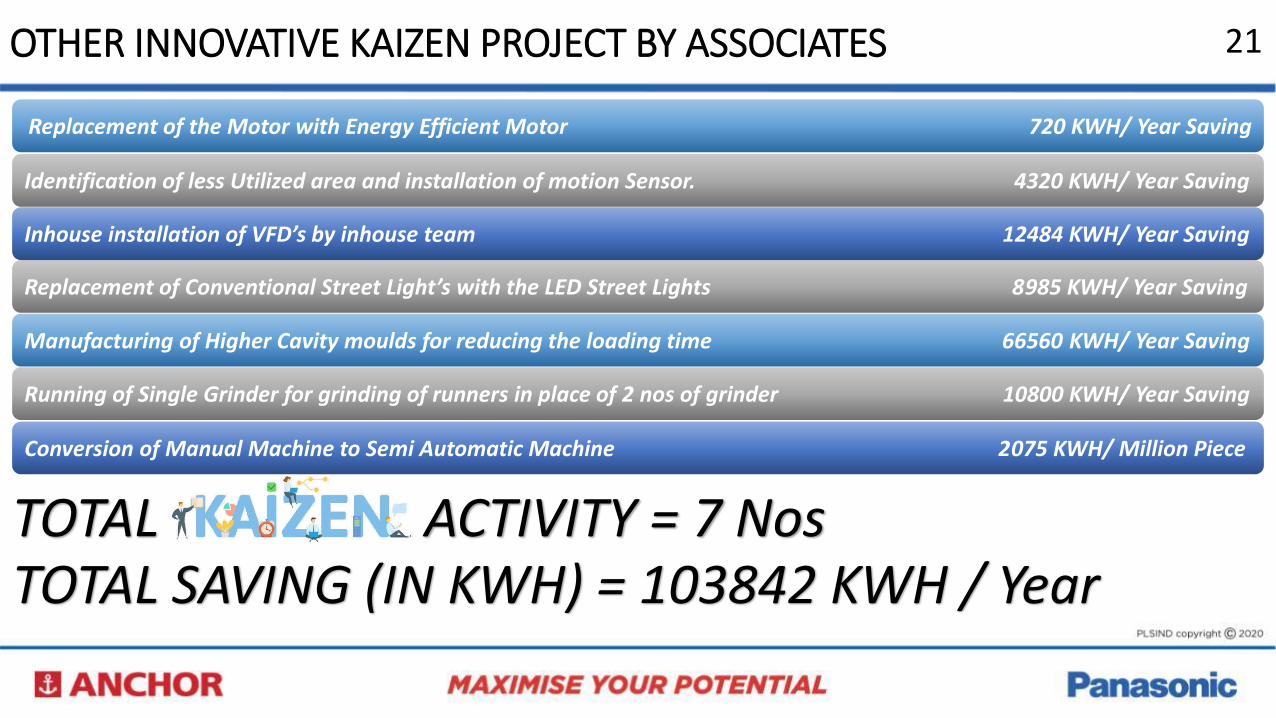
21OTHER INNOVATIVE KAIZEN PROJECT BY ASSOCIATES
Manufacturing of Higher Cavity moulds for reducing the loading time 66560 KWH/ Year Saving
Replacement of the Motor with Energy Efficient Motor 720 KWH/ Year Saving
Replacement of Conventional Street Light’s with the LED Street Lights 8985 KWH/ Year Saving
Inhouse installation of VFD’s by inhouse team 12484 KWH/ Year Saving
Running of Single Grinder for grinding of runners in place of 2 nos of grinder 10800 KWH/ Year Saving
Identification of less Utilized area and installation of motion Sensor. 4320 KWH/ Year Saving
Conversion of Manual Machine to Semi Automatic Machine 2075 KWH/ Million Piece
TOTAL ACTIVITY = 7 NosTOTAL SAVING (IN KWH) = 103842 KWH / Year
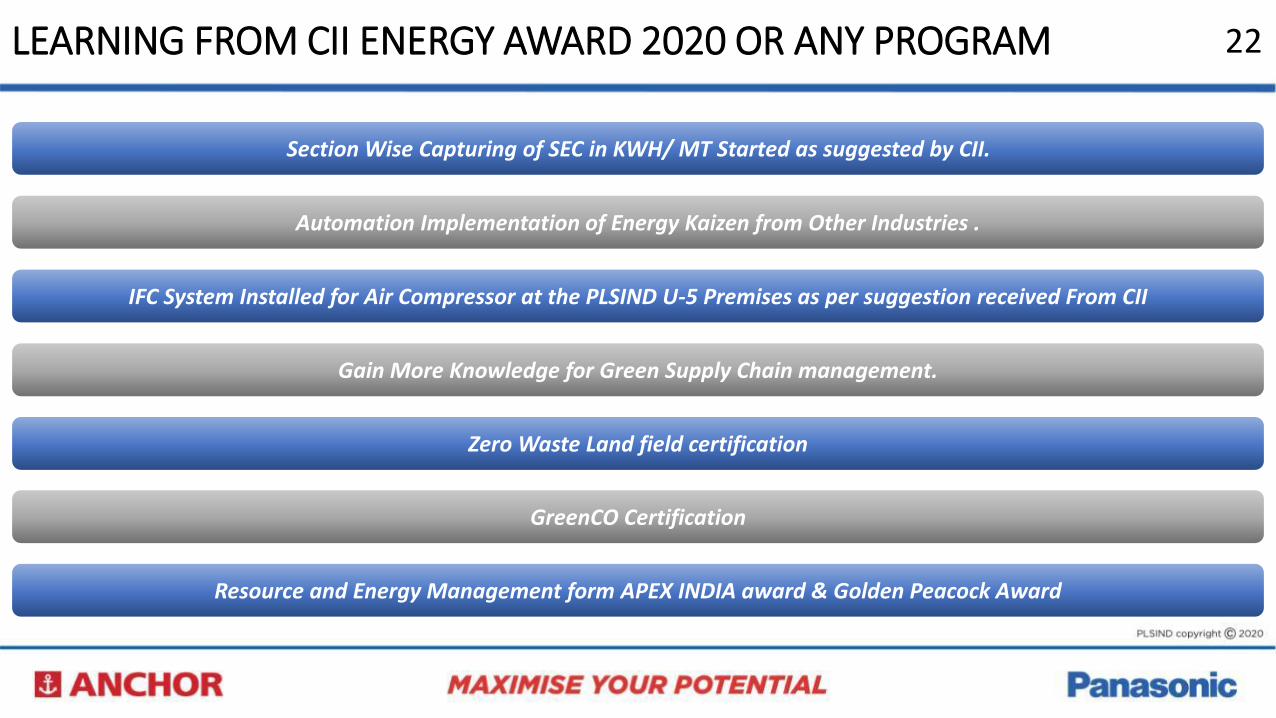
22LEARNING FROM CII ENERGY AWARD 2020 OR ANY PROGRAM
Section Wise Capturing of SEC in KWH/ MT Started as suggested by CII.
Zero Waste Land field certification
Gain More Knowledge for Green Supply Chain management.
IFC System Installed for Air Compressor at the PLSIND U-5 Premises as per suggestion received From CII
GreenCO Certification
Automation Implementation of Energy Kaizen from Other Industries .
Resource and Energy Management form APEX INDIA award & Golden Peacock Award
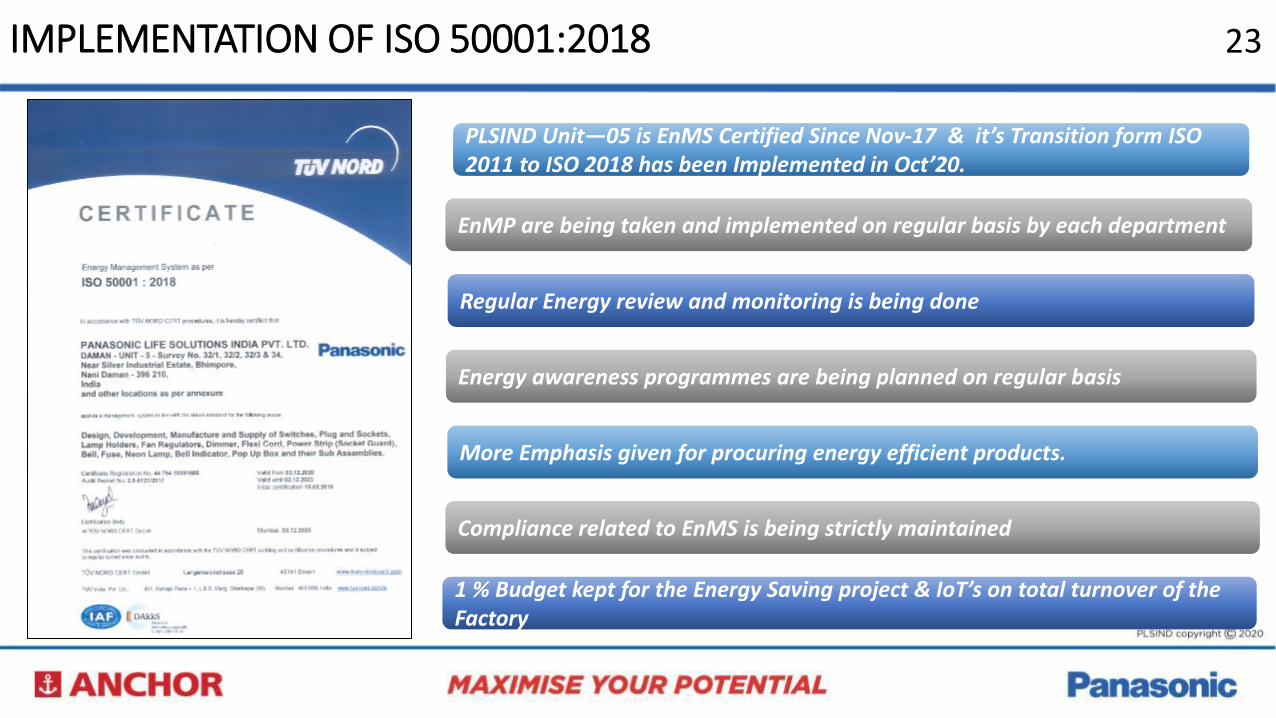
IMPLEMENTATION OF ISO 50001:2018 23
PLSIND Unit—05 is EnMS Certified Since Nov-17 & it’s Transition form ISO 2011 to ISO 2018 has been Implemented in Oct’20.
EnMP are being taken and implemented on regular basis by each department
Regular Energy review and monitoring is being done
Energy awareness programmes are being planned on regular basis
More Emphasis given for procuring energy efficient products.
Compliance related to EnMS is being strictly maintained
1 % Budget kept for the Energy Saving project & IoT’s on total turnover of the Factory
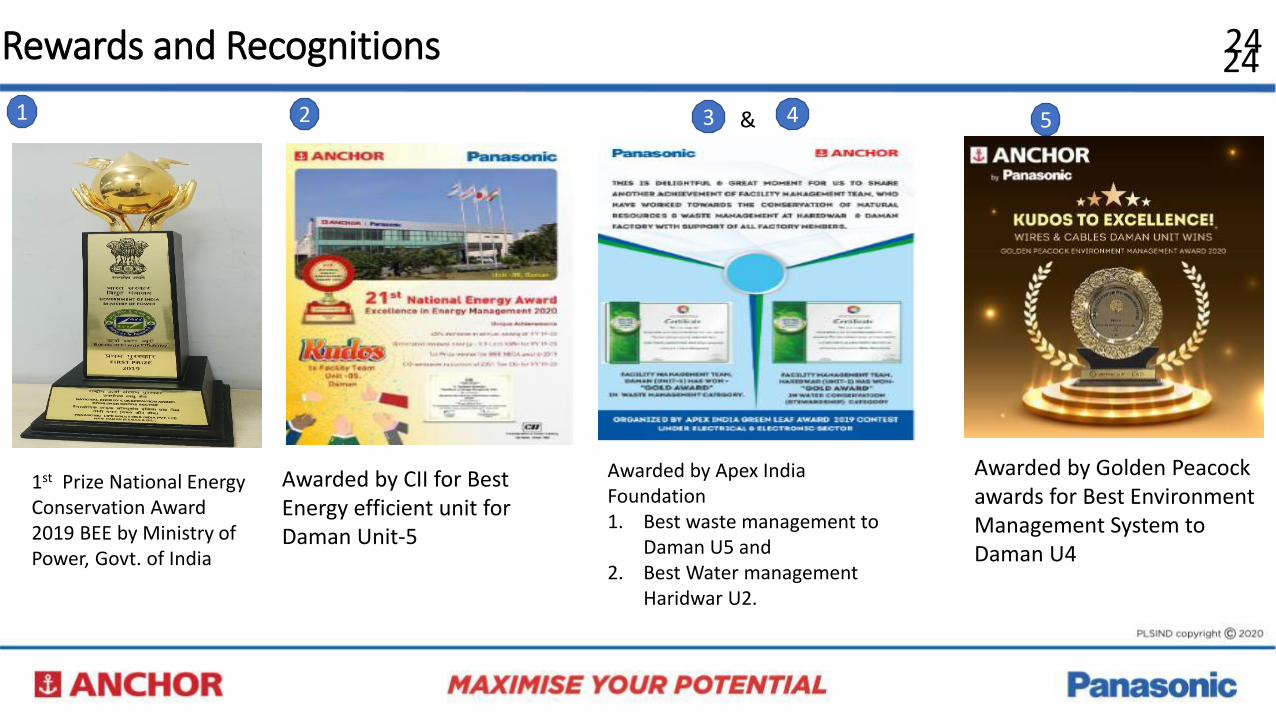
24Rewards and Recognitions
1 2 3 & 5
Awarded by CII for Best Energy efficient unit for Daman Unit-5
Awarded by Apex India Foundation 1. Best waste management to
Daman U5 and 2. Best Water management
Haridwar U2.
Awarded by Golden Peacock awards for Best Environment Management System to Daman U4
4
24
1st Prize National Energy Conservation Award 2019 BEE by Ministry of Power, Govt. of India