Embed Size (px)
Citation preview
pandas: a python data analysis library
Wes McKinney1
1AQR
New York Financial Python Users Group 12/15/2009
Wes McKinney (AQR) pandas: a python data analysis library NYFPUG 1 / 26
Outline
1 MotivationTechnology for quantitative finance
2 pandasOriginsData structuresApplications
Wes McKinney (AQR) pandas: a python data analysis library NYFPUG 2 / 26
Some common financial research tasks
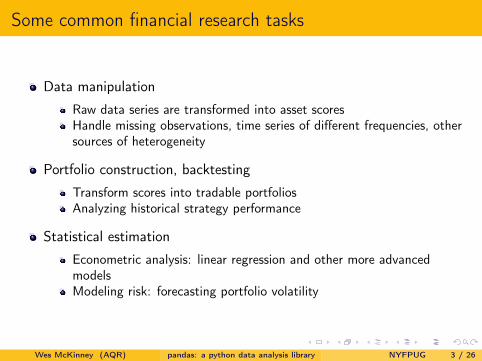
Data manipulation
Raw data series are transformed into asset scoresHandle missing observations, time series of different frequencies, othersources of heterogeneity
Portfolio construction, backtesting
Transform scores into tradable portfoliosAnalyzing historical strategy performance
Statistical estimation
Econometric analysis: linear regression and other more advancedmodelsModeling risk: forecasting portfolio volatility
Wes McKinney (AQR) pandas: a python data analysis library NYFPUG 3 / 26
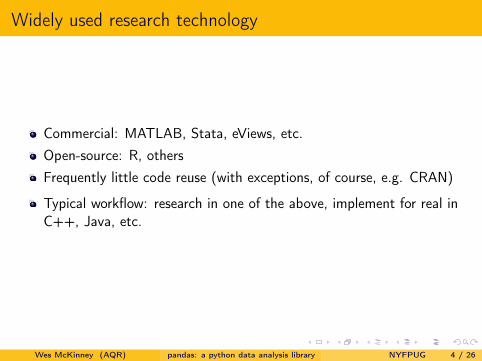
Widely used research technology
Commercial: MATLAB, Stata, eViews, etc.Open-source: R, othersFrequently little code reuse (with exceptions, of course, e.g. CRAN)
Typical workflow: research in one of the above, implement for real inC++, Java, etc.
Wes McKinney (AQR) pandas: a python data analysis library NYFPUG 4 / 26
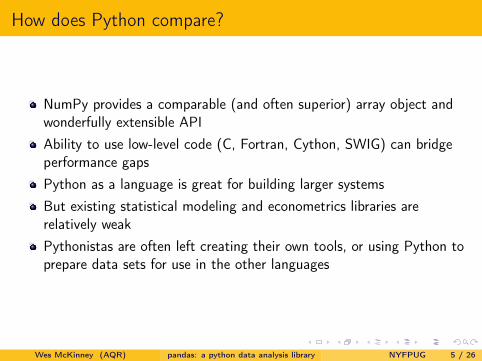
How does Python compare?
NumPy provides a comparable (and often superior) array object andwonderfully extensible APIAbility to use low-level code (C, Fortran, Cython, SWIG) can bridgeperformance gapsPython as a language is great for building larger systemsBut existing statistical modeling and econometrics libraries arerelatively weakPythonistas are often left creating their own tools, or using Python toprepare data sets for use in the other languages
Wes McKinney (AQR) pandas: a python data analysis library NYFPUG 5 / 26
My goal
Help Python become a compelling environment for finance, economicsresearch and other statistical applicationsImplement convenient statistical estimation routinesProvide tools for interfacing with other libraries / languages
Wes McKinney (AQR) pandas: a python data analysis library NYFPUG 6 / 26
pandas origins
Open-sourced by AQR in 2009Idea: data structures which understand labeled data, are lightweightand easy-to-visualizeLink identifiers (dates, tickers, data name) to numerical dataWorks well with both time-series and cross-sectional dataPrevent common errors associated with heterogeneous dataEtymology: panel data system
Wes McKinney (AQR) pandas: a python data analysis library NYFPUG 7 / 26
Basic building blocks: overview
1-dimensional: Series, TimeSeries
NumPy array subclass with item label vector (Index)Both ndarray and dict-like
2-dimensional: DataFrame, DataMatrix
Represents a dict of Series objectsConforms Series to a common Index
3-dimensional: WidePanel, LongPanel
Behave as a dict of DataMatrix objectsThree indices: items, major_axis, minor_axis
Wes McKinney (AQR) pandas: a python data analysis library NYFPUG 8 / 26
Series functionality
ndarray subclass with various conveniencesCombining Series matches Index valuesMany ndarray functions overridden to respect the Index and to excludemissing values (represented as NaN)Operates in essence as an ordered, fixed-length dict
Wes McKinney (AQR) pandas: a python data analysis library NYFPUG 9 / 26

Series example
>>> s >>> s2 >>> s + s2AAPL 3.4 AAPL 3.4 AAPL 6.8GOOG 9.4 GOOG 9.4 GOOG 18.8IBM 7.2 IBM 7.2 IBM 14.4MSFT 1.5 MSFT nan
>>> s + s2.reindex(s.index).fill(0)AAPL 6.8GOOG 18.8IBM 14.4MSFT 1.5
Wes McKinney (AQR) pandas: a python data analysis library NYFPUG 10 / 26
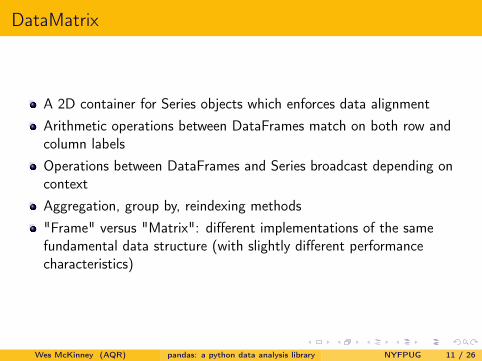
DataMatrix
A 2D container for Series objects which enforces data alignmentArithmetic operations between DataFrames match on both row andcolumn labelsOperations between DataFrames and Series broadcast depending oncontextAggregation, group by, reindexing methods"Frame" versus "Matrix": different implementations of the samefundamental data structure (with slightly different performancecharacteristics)
Wes McKinney (AQR) pandas: a python data analysis library NYFPUG 11 / 26

DataMatrix example
>>> dmA B C D
2000-01-03 00:00:00 -0.0415269 0.88057 -1.7492 0.5484332000-01-04 00:00:00 0.166356 -0.955948 0.0679696 -0.269942000-01-05 00:00:00 0.954089 -0.0122938 -0.906397 -1.294012000-01-06 00:00:00 0.026427 0.643754 -0.167905 -0.354352000-01-07 00:00:00 1.786 -0.399267 0.858169 0.3068752000-01-10 00:00:00 -0.850005 0.963422 -0.228602 1.124012000-01-11 00:00:00 -0.309066 1.28251 1.38328 -0.1141062000-01-12 00:00:00 -0.0533492 0.328646 -1.52632 1.670642000-01-13 00:00:00 0.192041 0.79258 -1.0988 0.5336732000-01-14 00:00:00 0.182775 0.325071 -0.288246 -1.05236
>>> dm.sum(axis=0) >>> dm.sum(axis=1) >>> dm[’A’]A 2.05374198744 2000-01-03 -0.361724 2000-01-03 -0.0415269B 3.84904518163 2000-01-04 -0.991562 2000-01-04 0.166356C -3.65605643845 2000-01-05 -1.258608 2000-01-05 0.954089D 1.09887239512 ... ...
Wes McKinney (AQR) pandas: a python data analysis library NYFPUG 12 / 26
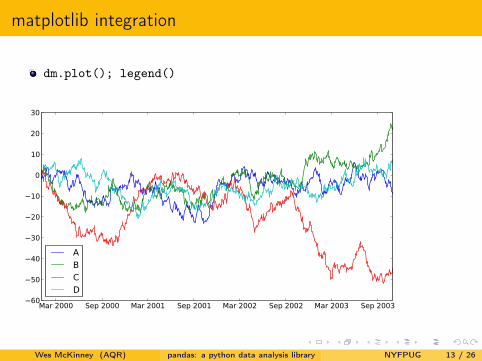
matplotlib integration
dm.plot(); legend()
Mar 2000 Sep 2000 Mar 2001 Sep 2001 Mar 2002 Sep 2002 Mar 2003 Sep 200360
50
40
30
20
10
0
10
20
30
ABCD
Wes McKinney (AQR) pandas: a python data analysis library NYFPUG 13 / 26
WidePanel
Panel data stored in 3D ndarray ("wide" format)Slicing and aggregation produce DataMatrix objectsAny axis can be reindexedFast conversion to "long" (stacked) format for output to CSV or forregression analysisRecent addition to pandas, still a work in progress
Wes McKinney (AQR) pandas: a python data analysis library NYFPUG 14 / 26
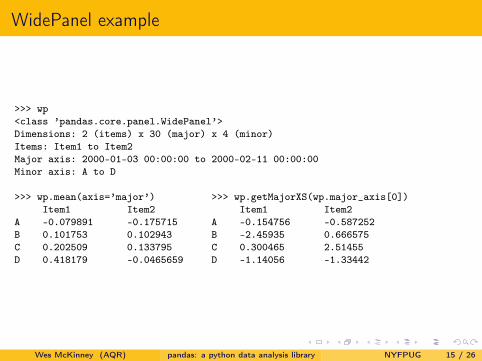
WidePanel example
>>> wp<class ’pandas.core.panel.WidePanel’>Dimensions: 2 (items) x 30 (major) x 4 (minor)Items: Item1 to Item2Major axis: 2000-01-03 00:00:00 to 2000-02-11 00:00:00Minor axis: A to D
>>> wp.mean(axis=’major’) >>> wp.getMajorXS(wp.major_axis[0])Item1 Item2 Item1 Item2
A -0.079891 -0.175715 A -0.154756 -0.587252B 0.101753 0.102943 B -2.45935 0.666575C 0.202509 0.133795 C 0.300465 2.51455D 0.418179 -0.0465659 D -1.14056 -1.33442
Wes McKinney (AQR) pandas: a python data analysis library NYFPUG 15 / 26
LongPanel
2D “stacked” representation of panel data (balanced or unbalanced)Supports much of WidePanel functionalityBuilt-in support for constructing dummy variables for regressionmodelingCan be lexicographically sorted
Wes McKinney (AQR) pandas: a python data analysis library NYFPUG 16 / 26
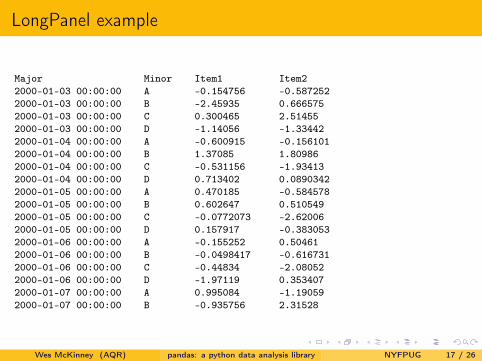
LongPanel example
Major Minor Item1 Item22000-01-03 00:00:00 A -0.154756 -0.5872522000-01-03 00:00:00 B -2.45935 0.6665752000-01-03 00:00:00 C 0.300465 2.514552000-01-03 00:00:00 D -1.14056 -1.334422000-01-04 00:00:00 A -0.600915 -0.1561012000-01-04 00:00:00 B 1.37085 1.809862000-01-04 00:00:00 C -0.531156 -1.934132000-01-04 00:00:00 D 0.713402 0.08903422000-01-05 00:00:00 A 0.470185 -0.5845782000-01-05 00:00:00 B 0.602647 0.5105492000-01-05 00:00:00 C -0.0772073 -2.620062000-01-05 00:00:00 D 0.157917 -0.3830532000-01-06 00:00:00 A -0.155252 0.504612000-01-06 00:00:00 B -0.0498417 -0.6167312000-01-06 00:00:00 C -0.44834 -2.080522000-01-06 00:00:00 D -1.97119 0.3534072000-01-07 00:00:00 A 0.995084 -1.190592000-01-07 00:00:00 B -0.935756 2.31528
Wes McKinney (AQR) pandas: a python data analysis library NYFPUG 17 / 26
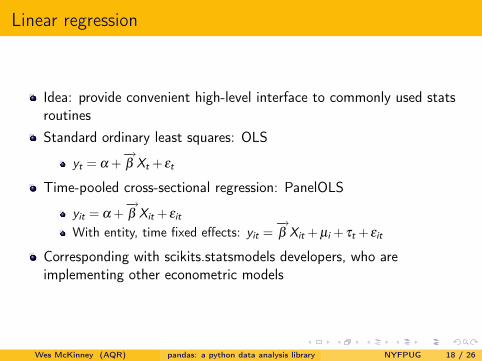
Linear regression
Idea: provide convenient high-level interface to commonly used statsroutinesStandard ordinary least squares: OLS
yt = α +−→β Xt + εt
Time-pooled cross-sectional regression: PanelOLS
yit = α +−→β Xit + εit
With entity, time fixed effects: yit =−→β Xit + µi + τt + εit
Corresponding with scikits.statsmodels developers, who areimplementing other econometric models
Wes McKinney (AQR) pandas: a python data analysis library NYFPUG 18 / 26
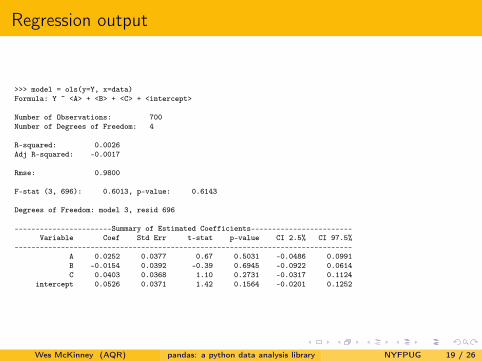
Regression output
>>> model = ols(y=Y, x=data)Formula: Y ~ <A> + <B> + <C> + <intercept>
Number of Observations: 700Number of Degrees of Freedom: 4
R-squared: 0.0026Adj R-squared: -0.0017
Rmse: 0.9800
F-stat (3, 696): 0.6013, p-value: 0.6143
Degrees of Freedom: model 3, resid 696
-----------------------Summary of Estimated Coefficients------------------------Variable Coef Std Err t-stat p-value CI 2.5% CI 97.5%
--------------------------------------------------------------------------------A 0.0252 0.0377 0.67 0.5031 -0.0486 0.0991B -0.0154 0.0392 -0.39 0.6945 -0.0922 0.0614C 0.0403 0.0368 1.10 0.2731 -0.0317 0.1124
intercept 0.0526 0.0371 1.42 0.1564 -0.0201 0.1252
Wes McKinney (AQR) pandas: a python data analysis library NYFPUG 19 / 26
Additional regression functionality
Supports rolling and expanding time series regressions (for forecasting)A few common adjustments for heteroskedasticity and autocorrelation(Newey-West correction, clustering)
Does not try to reinvent every wheel available in R, Stata, etc., butrather to reduce how often you need to use another language
Wes McKinney (AQR) pandas: a python data analysis library NYFPUG 20 / 26
Comparison with other Python libraries
scikits.statsmodels
Implements statistical models using only NumPy and SciPypandas can hopefully be a companion library with high-level interfacesto scikits.statsmodels classes
scikits.timeseries
Supports many kinds of time series-specific manipulations, built onnumpy.MaskedArraypandas provides support for generic date offsets and creating fixedfrequency dates using the DateRange class. Could likely be enhancedby using scikits.timeseries functionalitypandas makes no intention of competing: rather it tries to be simpleand easy-to-use for the majority of applications
Wes McKinney (AQR) pandas: a python data analysis library NYFPUG 21 / 26

Comparison with other Python libraries
tabular
A new library released recently providing spreadsheet-like functionalityfor 2D datapandas is mostly intended for manipulating numerical data and buildingmodels with it
Others?
Wes McKinney (AQR) pandas: a python data analysis library NYFPUG 22 / 26
Ideas for future
Expand existing functionality to address other applicationsImplement more statistical models / wrap scikits.statsmodels classesDevelop seamless rpy interface to leverage CRAN wealthBetter / more efficient IO functions for getting data into pandas
Wes McKinney (AQR) pandas: a python data analysis library NYFPUG 23 / 26
Summary
pandas provides a good starting place for working with time series andcross-sectional data sets
Let me know if you find it useful, or have suggestions
Python use is growing in finance: with some more work we can furtherovercome the C++ / Java / MATLAB monoculture
Wes McKinney (AQR) pandas: a python data analysis library NYFPUG 24 / 26
Thank you
Cython and NumPy developersJonathan Taylor and the scikits.statsmodels guysIPython devs: F. Perez et alEnthought, for inviting me
Contact: [email protected]: pandas.googlecode.comOfficial release on PyPI forthcoming
Wes McKinney (AQR) pandas: a python data analysis library NYFPUG 25 / 26

AQR Disclaimer
The views and opinions expressed herein are those of the author and do not necessarily reflect the
views of AQR Capital Management, LLC its affiliates, or its employees. The information set forth
herein has been obtained or derived from sources believed by author to be reliable. However, the
author does not make any representation or warranty, express or implied, as to the information’s
accuracy or completeness, nor does the author recommend that the attached information serve
as the basis of any investment decision. This document has been provided to you solely for
information purposes and does not constitute an offer or solicitation of an offer, or any advice
or recommendation, to purchase any securities or other financial instruments, and may not be
construed as such. This document is intended exclusively for the use of the person to whom it has
been delivered by the author, and it is not to be reproduced or redistributed to any other person.
Wes McKinney (AQR) pandas: a python data analysis library NYFPUG 26 / 26