Embed Size (px)
Citation preview
Paper 4a – Home Based Trip Production Model
Zenith Model Recalibration and Validation Version 3.0.1
May 2014
Public Transport Victoria

Page Intentionally Left Blank
i
Zenith Model Recalibration and Validation Version 3.0.1
Paper 4a – Home Based Trip Productions Draft Report
Project No. ZML-VIC-Year4
COPYRIGHT: The concepts and information contained in this document are the property of Veitch Lister Consulting Pty Ltd. Use or copying of this document in whole or in part without the written permission of Veitch Lister Consulting constitutes an infringement of copyright.
LIMITATION: This report has been prepared on behalf of and for the exclusive use of Veitch Lister Consulting Pty Ltd’s Client, and is subject to and issued in connection with the provisions of the agreement between Veitch Lister Consulting and its Client. Veitch Lister Consulting accepts no liability or responsibility whatsoever for or in respect of any use of or reliance upon this report by any third party.
Date Revision Prepared
By Checked
By Approved By Description
16/03/2014 A JP JC TV Draft Report
02/05/2014 B MP JC TV Draft Report
Zenith Model Recalibration and Validation Version 3.0.1 Paper 4a – Home Based Trip Productions – Draft Report
ii D:\ZML-VIC - Year 4\Deliverables\Documents\04_trip_generation\Working\ZML-VIC_ZenithVictoria_HomeBasedTripGen_Working.docx
Executive Summary
The Zenith Model of Victoria is one of a family of models developed by Veitch Lister Consulting (VLC) for transport planning in Australian cities and regions. This document is one in a series of working papers that collectively describe the calibration and validation of the Zenith Model of Victoria. In particular, this document describes the Home Based Trip Production Model.
The aim of the Home Based Trip Production Model is to estimate (for each household) the number of trips that will be made by that household for a range of home based trip purposes. These purposes are:
Home Based Work – White Collar Home Based Work – Blue Collar Home Based Education – Primary Home Based Education – Secondary Home Based Education – Tertiary Home Based Recreation Home Based Recreation Home Based Other
Separate predictive models have been estimated and validated for each of the above trip purposes.
Each predictive model was developed using the number of trips recorded (for each trip purpose) by each household which took part in the VISTA survey.
The household variables which were used as predictors were:
Household size; Number of white collar workers; Number of blue collar workers; Number of dependants aged 0-17; Number of dependants aged 18-64; Number of dependants aged 65+; and Number of cars owned.
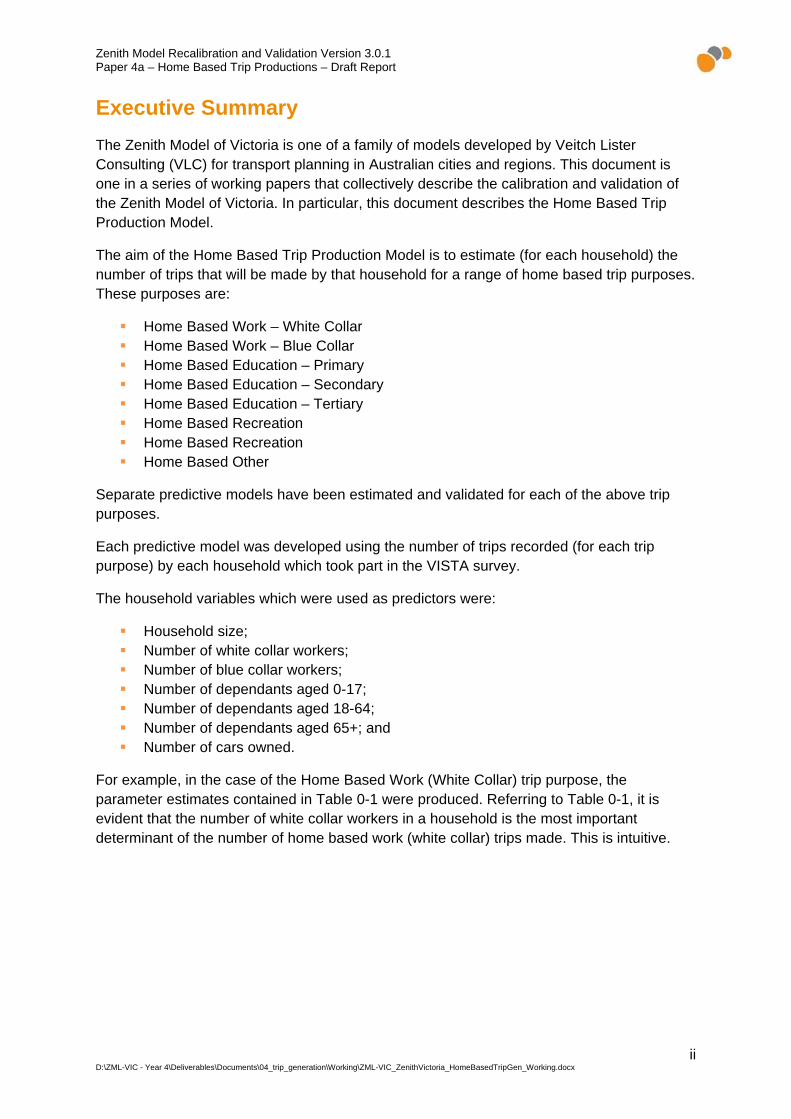
For example, in the case of the Home Based Work (White Collar) trip purpose, the parameter estimates contained in Table 0-1 were produced. Referring to Table 0-1, it is evident that the number of white collar workers in a household is the most important determinant of the number of home based work (white collar) trips made. This is intuitive.
Zenith Model Recalibration and Validation Version 3.0.1 Paper 4a – Home Based Trip Productions – Draft Report
iii D:\ZML-VIC - Year 4\Deliverables\Documents\04_trip_generation\Working\ZML-VIC_ZenithVictoria_HomeBasedTripGen_Working.docx
Table 0-1 - Parameters Estimates for Home Based Work - White Collar
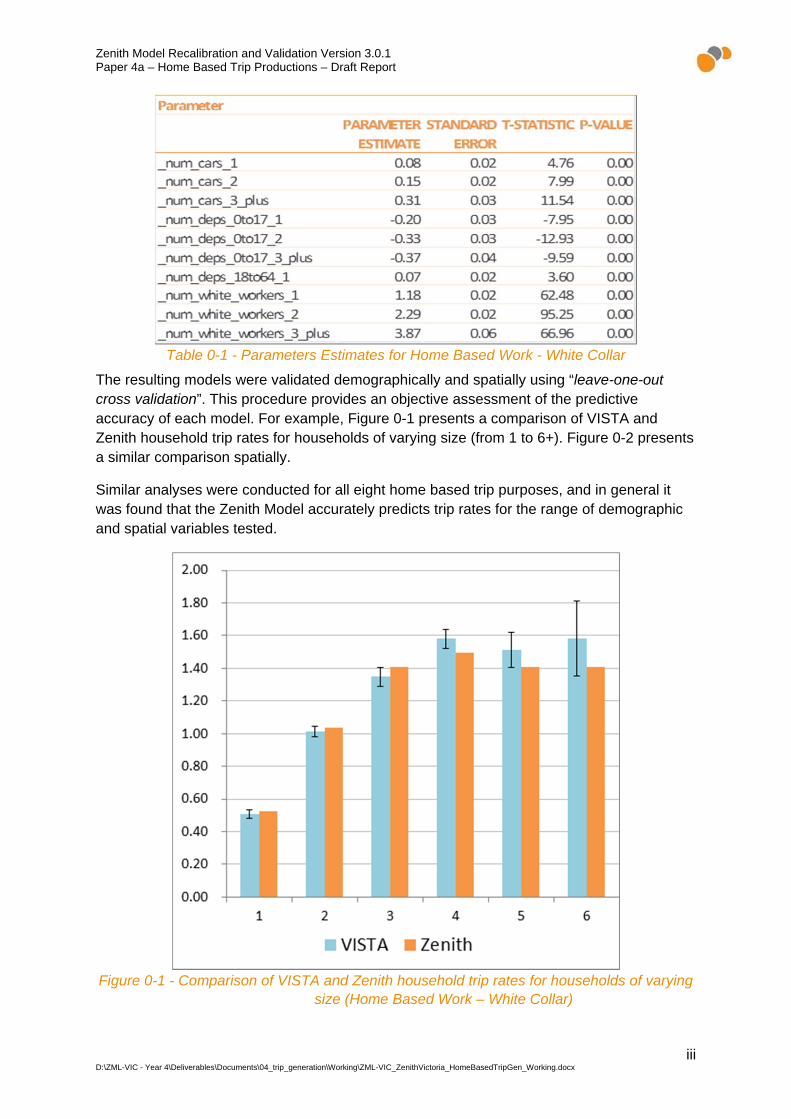
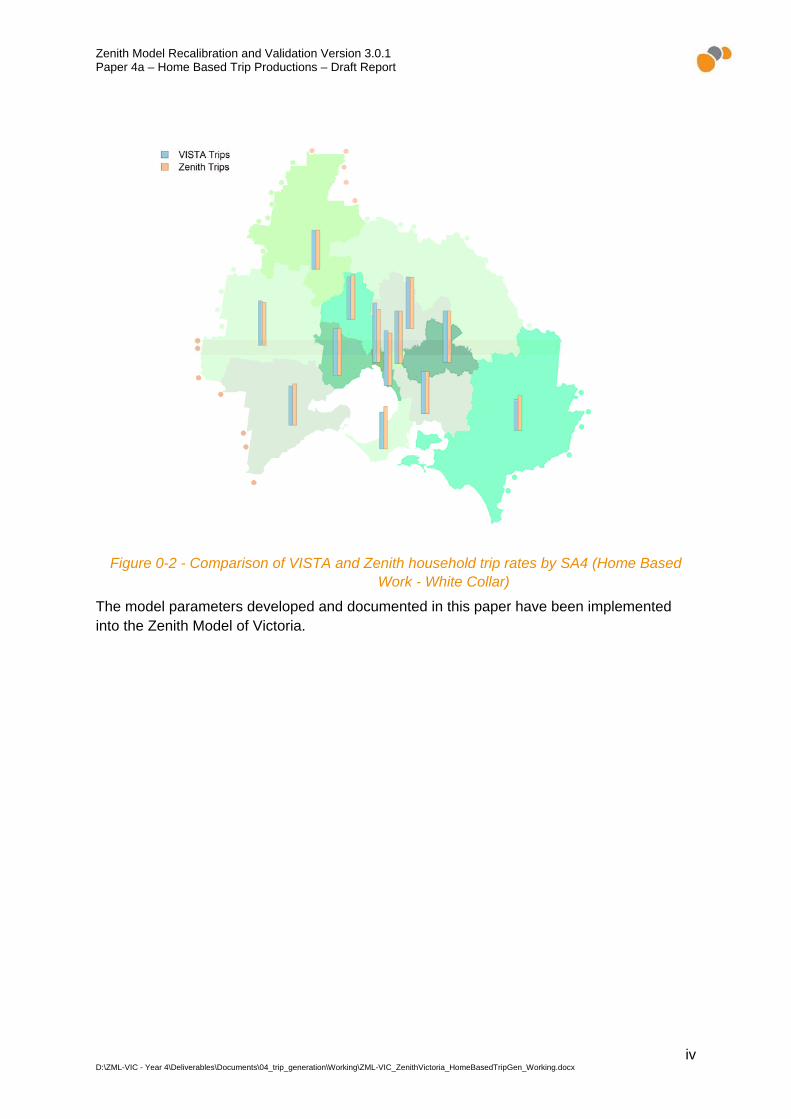
The resulting models were validated demographically and spatially using “leave-one-out cross validation”. This procedure provides an objective assessment of the predictive accuracy of each model. For example, Figure 0-1 presents a comparison of VISTA and Zenith household trip rates for households of varying size (from 1 to 6+). Figure 0-2 presents a similar comparison spatially.
Similar analyses were conducted for all eight home based trip purposes, and in general it was found that the Zenith Model accurately predicts trip rates for the range of demographic and spatial variables tested.
Figure 0-1 - Comparison of VISTA and Zenith household trip rates for households of varying
size (Home Based Work – White Collar)
Zenith Model Recalibration and Validation Version 3.0.1 Paper 4a – Home Based Trip Productions – Draft Report
iv D:\ZML-VIC - Year 4\Deliverables\Documents\04_trip_generation\Working\ZML-VIC_ZenithVictoria_HomeBasedTripGen_Working.docx
Figure 0-2 - Comparison of VISTA and Zenith household trip rates by SA4 (Home Based
Work - White Collar)
The model parameters developed and documented in this paper have been implemented into the Zenith Model of Victoria.
Zenith Model Recalibration and Validation Version 3.0.1 Paper 4a – Home Based Trip Productions – Draft Report
v D:\ZML-VIC - Year 4\Deliverables\Documents\04_trip_generation\Working\ZML-VIC_ZenithVictoria_HomeBasedTripGen_Working.docx
Contents
Executive Summary .............................................................................................................. ii
Contents ................................................................................................................................ v
List of Figures ..................................................................................................................... vii
List of Tables ...................................................................................................................... viii
1 Introduction .................................................................................................................... 1
1.1 Background ............................................................................................................................. 1
1.2 Report Structure ...................................................................................................................... 1
1.3 Related Documents ................................................................................................................. 2
2 Data Sources .................................................................................................................. 3
3 Methodology .................................................................................................................. 4
3.1.1 Data Set Construction ....................................................................................................................... 4
3.1.2 Model Estimation Procedures ........................................................................................................... 4
3.1.3 Model Validation Procedures ............................................................................................................ 4
3.1.4 Variable Naming ................................................................................................................................ 4
4 Parameter Estimates and Validation Results .............................................................. 6
4.1 Home Based Work – White Collar .......................................................................................... 6
4.1.1 Model Estimation ............................................................................................................................... 6
4.1.2 Model Validation ................................................................................................................................ 6
4.2 Home Based Work – Blue Collar .......................................................................................... 11
4.2.1 Model Estimation ............................................................................................................................. 11
4.2.2 Model Validation .............................................................................................................................. 11
4.3 Home Based Education – Primary ........................................................................................ 16
4.3.1 Model Estimation ............................................................................................................................. 16
4.3.2 Model Validation .............................................................................................................................. 16
4.4 Home Based Education – Secondary ................................................................................... 21
4.4.1 Model Estimation ............................................................................................................................. 21
4.4.2 Model Validation .............................................................................................................................. 21
4.5 Home Based Education – Tertiary ........................................................................................ 26
4.5.1 Model Estimation ............................................................................................................................. 26
4.5.2 Model Validation .............................................................................................................................. 26
4.6 Home Based Shopping ......................................................................................................... 31
4.6.1 Model Estimation ............................................................................................................................. 31
4.6.2 Model Validation .............................................................................................................................. 31
4.7 Home Based Recreation ....................................................................................................... 36
4.7.1 Model Estimation ............................................................................................................................. 36
4.7.2 Model Validation .............................................................................................................................. 36
Zenith Model Recalibration and Validation Version 3.0.1 Paper 4a – Home Based Trip Productions – Draft Report
vi D:\ZML-VIC - Year 4\Deliverables\Documents\04_trip_generation\Working\ZML-VIC_ZenithVictoria_HomeBasedTripGen_Working.docx
4.8 Home Based Other ............................................................................................................... 41
4.8.1 Model Estimation ............................................................................................................................. 41
4.8.2 Model Validation .............................................................................................................................. 41
Zenith Model Recalibration and Validation Version 3.0.1 Paper 4a – Home Based Trip Productions – Draft Report
vii D:\ZML-VIC - Year 4\Deliverables\Documents\04_trip_generation\Working\ZML-VIC_ZenithVictoria_HomeBasedTripGen_Working.docx
List of Figures
Figure 0-1 - Comparison of VISTA and Zenith household trip rates for households of varying size (Home Based Work – White Collar) ................................................................................ iii Figure 0-2 - Comparison of VISTA and Zenith household trip rates by SA4 (Home Based Work - White Collar) ................................................................................................................ iv Figure 4-1 - Comparison of Modelled and VISTA Trip Rates by SA4 (White Collar Work) ..... 9 Figure 4-2 - Comparison of Modelled and VISTA Trip Rates by SA4 (Blue Collar Work) ..... 14 Figure 4-3 - Comparison of Modelled and VISTA Trip Rates by SA4 (Primary Education) .. 19 Figure 4-4 - Comparison of Modelled and VISTA Trip Rates by SA4 (Secondary Education) .............................................................................................................................................. 24 Figure 4-5 - Comparison of Modelled and VISTA Trip Rates by SA4 (Tertiary Education) .. 29 Figure 4-6 - Comparison of Modelled and VISTA Trip Rates by SA4 (Shopping) ................ 34 Figure 4-7 - Comparison of Modelled and VISTA Trip Rates by SA4 (Recreation) .............. 39 Figure 4-8 - Comparison of Modelled and VISTA Trip Rates by SA4 (Other Trips) .............. 44
Zenith Model Recalibration and Validation Version 3.0.1 Paper 4a – Home Based Trip Productions – Draft Report
viii D:\ZML-VIC - Year 4\Deliverables\Documents\04_trip_generation\Working\ZML-VIC_ZenithVictoria_HomeBasedTripGen_Working.docx
List of Tables
Table 0-1 - Parameters Estimates for Home Based Work - White Collar ............................... iii Table 4-1 –Parameter Estimates and Properties for Home Based Work – White Collar ........ 6 Table 4-2 - Validation by Demographic Categories (White Collar Work) ................................ 8 Table 4-3 - Comparison of Modelled and VISTA Trip Rates by SA4 (White Collar Work) .... 10 Table 4-4 –Parameter Estimates and Properties for Home Based Work – Blue Collar ........ 11 Table 4-5 - Validation by Demographic Categories (Home Based Work - Blue Collar) ........ 12 Table 4-6 - Comparison of Modelled and VISTA Trip Rates by SA4 (Blue Collar Work) ...... 15 Table 4-7 –Parameter Estimates and Properties for Home Based Education – Primary...... 16 Table 4-8 - Validation by Demographic Categories (Primary Education).............................. 17 Table 4-9 - Comparison of Modelled and VISTA Trip Rates by SA4 (Primary Education) ... 20 Table 4-10 –Parameter Estimates and Properties for Home Based Education – Secondary 21 Table 4-11 - Validation by Demographic Categories (Secondary Education) ....................... 22 Table 4-12 - Comparison of Modelled and VISTA Trip Rates by SA4 (Secondary Education) .............................................................................................................................................. 25 Table 4-13 –Parameter Estimates and Properties for Home Based Education – Tertiary .... 26 Table 4-14 - Validation by Demographic Categories (Tertiary Education) ............................ 27 Table 4-15 - Comparison of Modelled and VISTA Trip Rates by SA4 (Tertiary Education) .. 30 Table 4-16 –Parameter Estimates and Properties for Home Based Shopping ..................... 31 Table 4-17 - Validation by Demographic Categories (Shopping) .......................................... 32 Table 4-18 - Comparison of Modelled and VISTA Trip Rates by SA4 (Shopping)................ 35 Table 4-19 –Parameter Estimates and Properties for Home Based Recreation................... 36 Table 4-20 - Validation by Demographic Categories (Recreation) ....................................... 37 Table 4-21 - Comparison of Modelled and VISTA Trip Rates by SA4 (Recreation) ............. 40 Table 4-22 –Parameter Estimates and Properties for Home Based Other ........................... 41 Table 4-23 - Validation by Demographic Categories (Other Trips) ....................................... 42 Table 4-24 - Comparison of Modelled and VISTA Trip Rates by SA4 (Other Trips) ............. 45
Zenith Model Recalibration and Validation Version 3.0.1 Paper 4a – Home Based Trip Productions – Draft Report
ix D:\ZML-VIC - Year 4\Deliverables\Documents\04_trip_generation\Working\ZML-VIC_ZenithVictoria_HomeBasedTripGen_Working.docx
Page Intentionally Left Blank
Zenith Model Recalibration and Validation Version 3.0.1 Paper 4a – Home Based Trip Productions – Draft Report
1 D:\ZML-VIC - Year 4\Deliverables\Documents\04_trip_generation\Working\ZML-VIC_ZenithVictoria_HomeBasedTripGen_Working.docx
1 Introduction
1.1 Background
The Zenith Model of Victoria is one of a family of models developed by Veitch Lister Consulting (VLC) for transport planning in Australian cities and regions. This document is one in a series of working papers that collectively describe the calibration and validation of the Zenith Model of Victoria.
The primary focus of this document is the Home Based Trip Production Model. Home based trips are trips which have one end at the home (e.g. a trip from home to work, or from the shops to home).
The aim of the Home Based Trip Production Model is to estimate (for each travel zone) the number of trips that will be produced for a range of home based trip purposes. These purposes are:
1. Home based work (white collar) - HWW 2. Home based work (blue collar) - HWB 3. Home based education (primary) - HPR 4. Home based education (secondary) - HSE 5. Home based education (tertiary) - HTE 6. Home based shopping - HBS 7. Home based recreation - HBR 8. Home based other - HBO
The scope of this paper is limited to the estimation and validation of the Home Based Trip Production Models developed for the Zenith Model of Victoria. Details regarding methodology (including how the model is implemented in Zenith) are contained in the associated methodology document from the Framework series (“Zenith Framework – Trip Generation”).
1.2 Report Structure
The balance of this report is structured as follows:
Chapter 2: Describes the data sources used to estimate and validate the Home Based Trip Production Models;
Chapter 3: Describes the methodology by which each Home Based Trip Production Model has been estimated and validated; and
Chapter 4: Presents the parameter estimates and validation results for each trip purpose.
Zenith Model Recalibration and Validation Version 3.0.1 Paper 4a – Home Based Trip Productions – Draft Report
2 D:\ZML-VIC - Year 4\Deliverables\Documents\04_trip_generation\Working\ZML-VIC_ZenithVictoria_HomeBasedTripGen_Working.docx
1.3 Related Documents
The Zenith Model of Victoria is described in two complementary sets of technical notes:
Zenith Framework Papers – these describe the methodology of the Zenith Model Zenith Victoria Papers – these describe the calibration and validation of the Zenith
Model in the Victorian market.
This document is part of the second series and is intended to be read alongside the corresponding note from the first series “Zenith Framework: Trip Generation”.
Zenith Model Recalibration and Validation Version 3.0.1 Paper 4a – Home Based Trip Productions – Draft Report
3 D:\ZML-VIC - Year 4\Deliverables\Documents\04_trip_generation\Working\ZML-VIC_ZenithVictoria_HomeBasedTripGen_Working.docx
2 Data Sources
The only source of information used to develop Home Based Trip Production Models for the Zenith Model of Victoria was the Victorian Integrated Survey of Travel and Activity (VISTA).
Data from the following two editions of the VISTA survey were pooled to maximise the available sample:
VISTA07 (a sample of 17,115 Victorian households surveyed between June 2007 and June 2008); and
VISTA09 (a sample of 16,269 Victorian households surveyed between July 2009 and July 2010).
A more recent VISTA survey began in July 2012 but is not currently available for transport modelling purposes. Therefore VISTA07 and VISTA09 represent the latest available Victorian household travel surveys.
Data collected on weekends, public holidays and during school holidays were removed to facilitate the development of average weekday models.
Zenith Model Recalibration and Validation Version 3.0.1 Paper 4a – Home Based Trip Productions – Draft Report
4 D:\ZML-VIC - Year 4\Deliverables\Documents\04_trip_generation\Working\ZML-VIC_ZenithVictoria_HomeBasedTripGen_Working.docx
3 Methodology
3.1.1 Data Set Construction
A data set was constructed using each VISTA household as a data point.
The response variable (i.e. the dependant variable) for each household was the daily number of home based trips (for each trip purpose) made by the household.
The predictors (i.e. the independent variables) were a series of dummy variables which were used to represent the following household variables:
Household size; Number of white collar workers; Number of blue collar workers; Number of dependants aged 0-17; Number of dependants aged 18-64; Number of dependants aged 65+; and Number of cars owned.
3.1.2 Model Estimation Procedures
Parameter estimation was performed using unconstrained least squares linear regression.
Variable selection was performed using “leave-one-out cross validation”. This ensured that the selected model was that which exhibited greatest predictive accuracy.
3.1.3 Model Validation Procedures
Model validation was performed using “leave-one-out cross validation” to produce a modelled “prediction” of the number of trips made by each household for each trip purpose. The VISTA households were then grouped according to household size, household income and number of cars owned, with the actual number of trips made by the households (as recorded in VISTA) compared to the Zenith Model’s predictions. This enabled an objective analysis of the predictive accuracy of each model for a variety of household types.
A similar analysis was conducted spatially, with households grouped into regions (SA4s).
3.1.4 Variable Naming
In the models which follow, the following abbreviated variable names are used.
Zenith Model Recalibration and Validation Version 3.0.1 Paper 4a – Home Based Trip Productions – Draft Report
5 D:\ZML-VIC - Year 4\Deliverables\Documents\04_trip_generation\Working\ZML-VIC_ZenithVictoria_HomeBasedTripGen_Working.docx
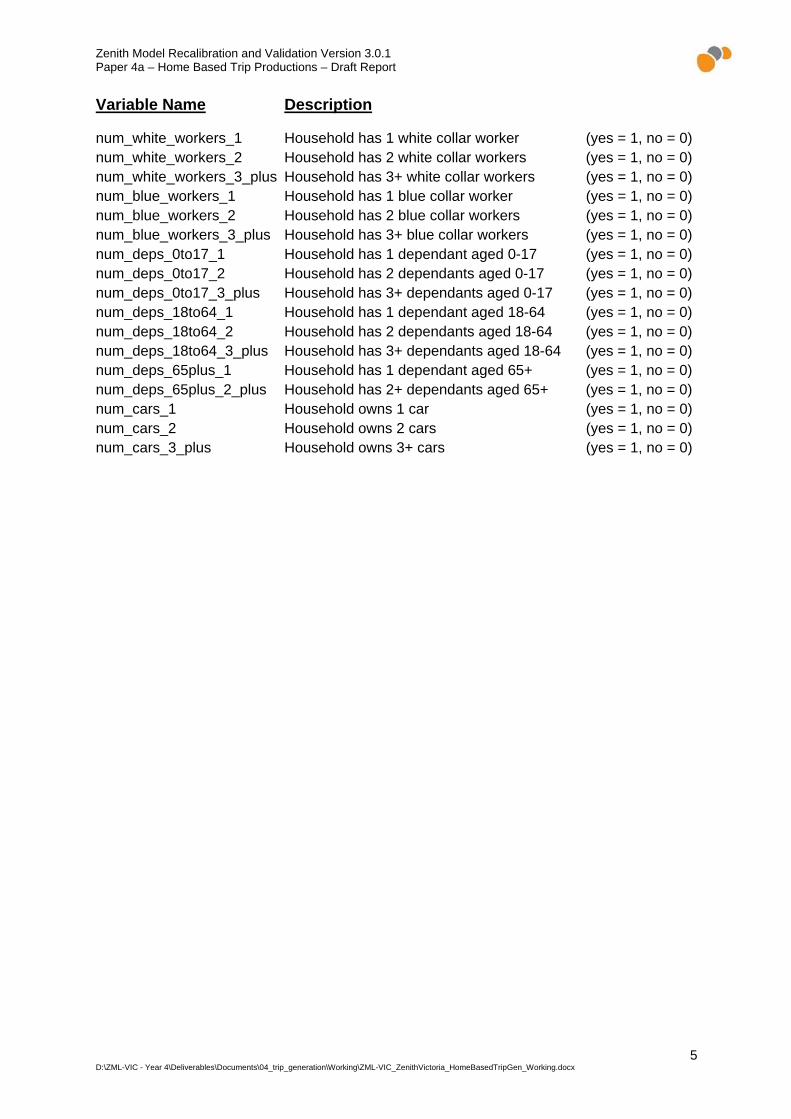
Variable Name Description
num_white_workers_1 Household has 1 white collar worker (yes = 1, no = 0) num_white_workers_2 Household has 2 white collar workers (yes = 1, no = 0) num_white_workers_3_plus Household has 3+ white collar workers (yes = 1, no = 0) num_blue_workers_1 Household has 1 blue collar worker (yes = 1, no = 0) num_blue_workers_2 Household has 2 blue collar workers (yes = 1, no = 0) num_blue_workers_3_plus Household has 3+ blue collar workers (yes = 1, no = 0) num_deps_0to17_1 Household has 1 dependant aged 0-17 (yes = 1, no = 0) num_deps_0to17_2 Household has 2 dependants aged 0-17 (yes = 1, no = 0) num_deps_0to17_3_plus Household has 3+ dependants aged 0-17 (yes = 1, no = 0) num_deps_18to64_1 Household has 1 dependant aged 18-64 (yes = 1, no = 0) num_deps_18to64_2 Household has 2 dependants aged 18-64 (yes = 1, no = 0) num_deps_18to64_3_plus Household has 3+ dependants aged 18-64 (yes = 1, no = 0) num_deps_65plus_1 Household has 1 dependant aged 65+ (yes = 1, no = 0) num_deps_65plus_2_plus Household has 2+ dependants aged 65+ (yes = 1, no = 0) num_cars_1 Household owns 1 car (yes = 1, no = 0) num_cars_2 Household owns 2 cars (yes = 1, no = 0) num_cars_3_plus Household owns 3+ cars (yes = 1, no = 0)
Zenith Model Recalibration and Validation Version 3.0.1 Paper 4a – Home Based Trip Productions – Draft Report
6 D:\ZML-VIC - Year 4\Deliverables\Documents\04_trip_generation\Working\ZML-VIC_ZenithVictoria_HomeBasedTripGen_Working.docx
4 Parameter Estimates and Validation Results
This Chapter details the parameter estimates and validation results for the eight home based trip purposes considered within the Zenith Model.
4.1 Home Based Work – White Collar
4.1.1 Model Estimation
4.1.1.1 Parameter Estimates
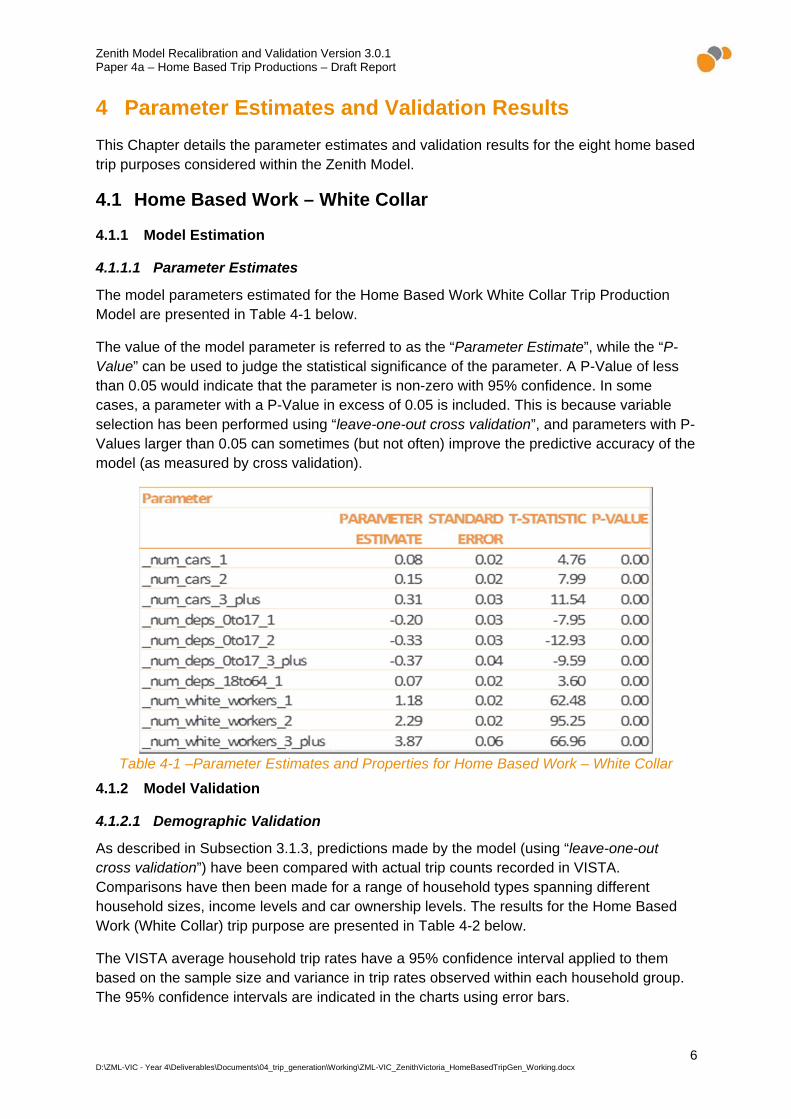
The model parameters estimated for the Home Based Work White Collar Trip Production Model are presented in Table 4-1 below.
The value of the model parameter is referred to as the “Parameter Estimate”, while the “P-Value” can be used to judge the statistical significance of the parameter. A P-Value of less than 0.05 would indicate that the parameter is non-zero with 95% confidence. In some cases, a parameter with a P-Value in excess of 0.05 is included. This is because variable selection has been performed using “leave-one-out cross validation”, and parameters with P-Values larger than 0.05 can sometimes (but not often) improve the predictive accuracy of the model (as measured by cross validation).
Table 4-1 –Parameter Estimates and Properties for Home Based Work – White Collar
4.1.2 Model Validation
4.1.2.1 Demographic Validation
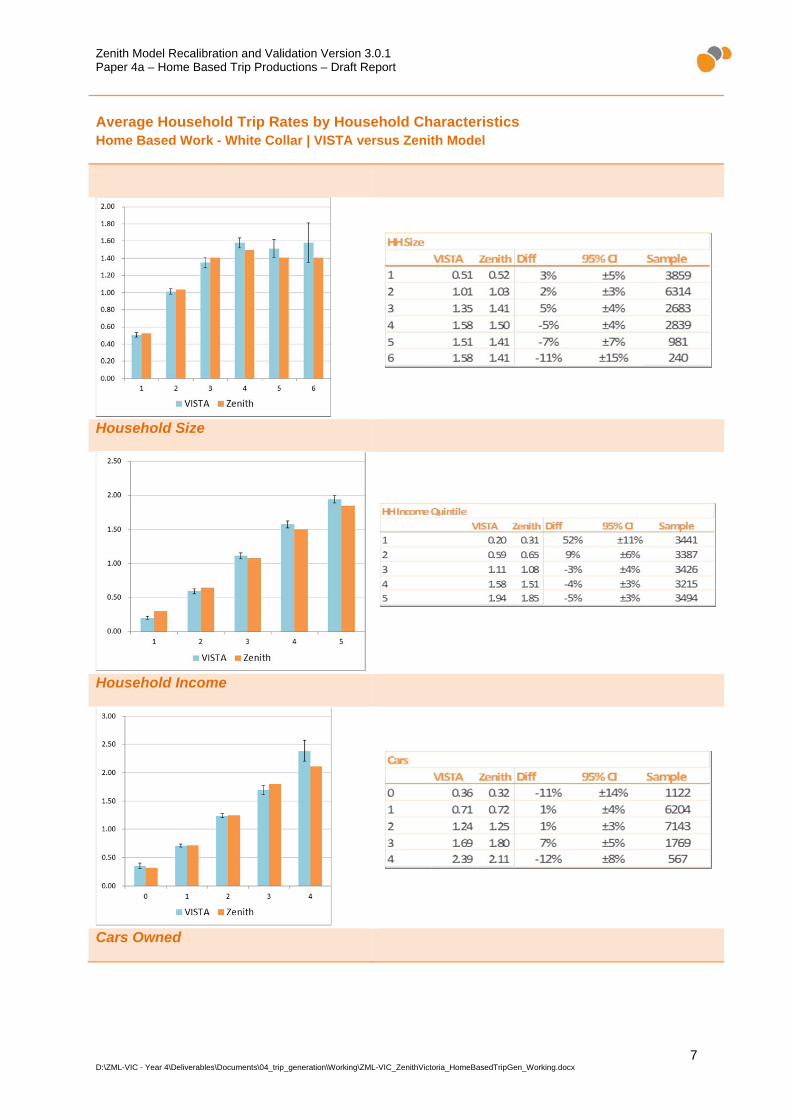
As described in Subsection 3.1.3, predictions made by the model (using “leave-one-out cross validation”) have been compared with actual trip counts recorded in VISTA. Comparisons have then been made for a range of household types spanning different household sizes, income levels and car ownership levels. The results for the Home Based Work (White Collar) trip purpose are presented in Table 4-2 below.
The VISTA average household trip rates have a 95% confidence interval applied to them based on the sample size and variance in trip rates observed within each household group. The 95% confidence intervals are indicated in the charts using error bars.
Zenith Model Recalibration and Validation Version 3.0.1 Paper 4a – Home Based Trip Productions – Draft Report
7 D:\ZML-VIC - Year 4\Deliverables\Documents\04_trip_generation\Working\ZML-VIC_ZenithVictoria_HomeBasedTripGen_Working.docx
Average Household Trip Rates by Household Characteristics Home Based Work - White Collar | VISTA versus Zenith Model
Household Size
Household Income
Cars Owned
Zenith Model Recalibration and Validation Version 3.0.1 Paper 4a – Home Based Trip Productions – Draft Report
8 D:\ZML-VIC - Year 4\Deliverables\Documents\04_trip_generation\Working\ZML-VIC_ZenithVictoria_HomeBasedTripGen_Working.docx
Table 4-2 - Validation by Demographic Categories (White Collar Work)
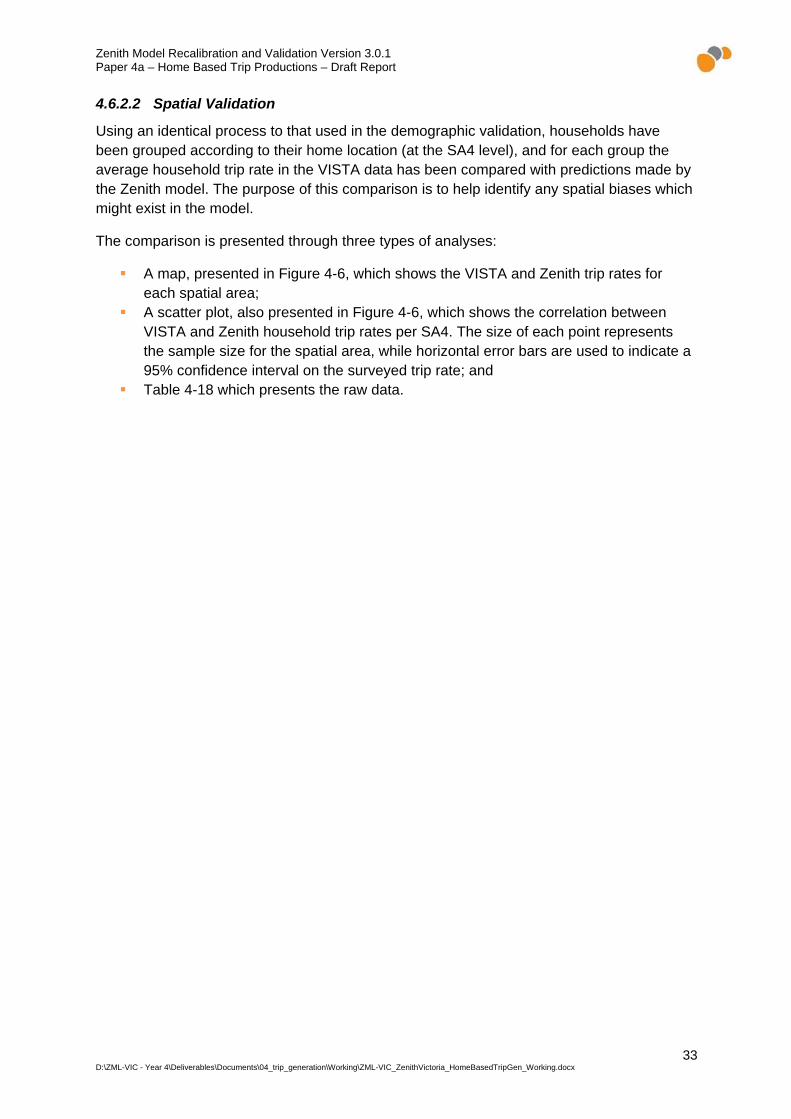
4.1.2.2 Spatial Validation
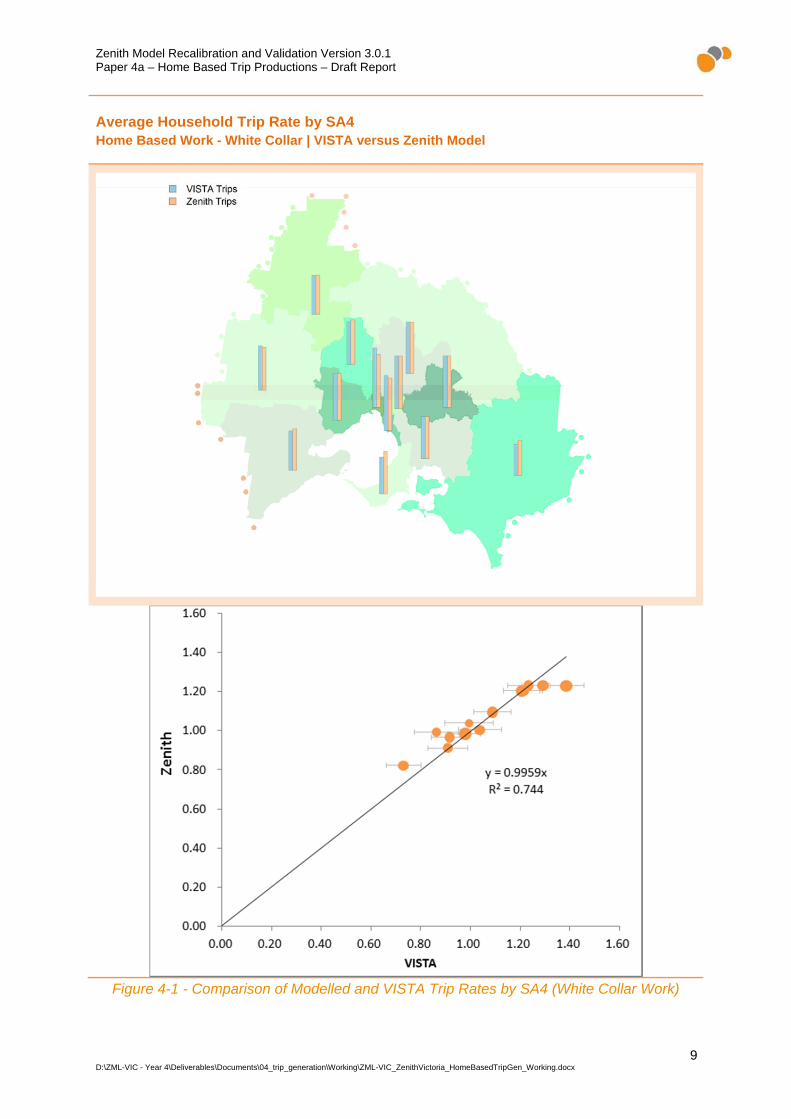
Using an identical process to that used in the demographic validation, households have been grouped according to their home location (at the SA4 level), and for each group the average household trip rate in the VISTA data has been compared with predictions made by the Zenith model. The purpose of this comparison is to help identify any spatial biases which might exist in the model.
The comparison is presented through three types of analyses:
A map, presented in Figure 4-1, which shows the VISTA and Zenith trip rates for each spatial area;
A scatter plot, also presented in Figure 4-1, which shows the correlation between VISTA and Zenith household trip rates per SA4. The size of each point represents the sample size for the spatial area, while horizontal error bars are used to indicate a 95% confidence interval on the surveyed trip rate; and
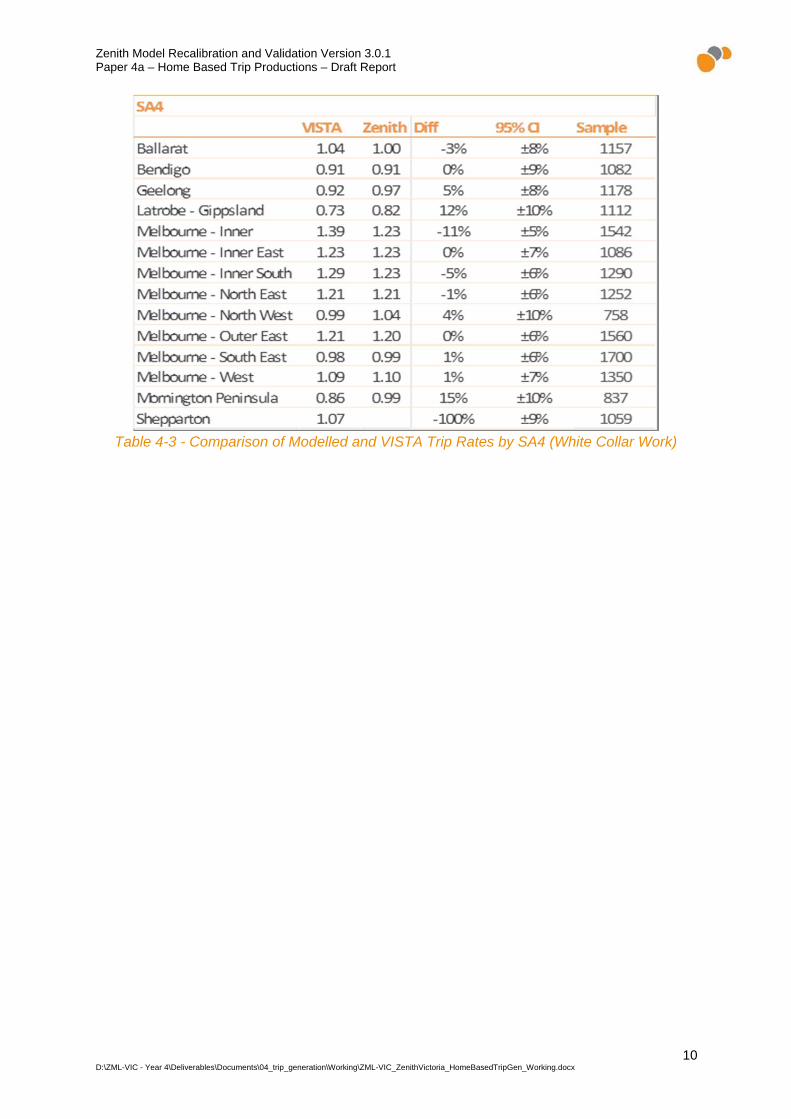
Table 4-3 which presents the raw data.
Zenith Model Recalibration and Validation Version 3.0.1 Paper 4a – Home Based Trip Productions – Draft Report
9 D:\ZML-VIC - Year 4\Deliverables\Documents\04_trip_generation\Working\ZML-VIC_ZenithVictoria_HomeBasedTripGen_Working.docx
Average Household Trip Rate by SA4 Home Based Work - White Collar | VISTA versus Zenith Model
Figure 4-1 - Comparison of Modelled and VISTA Trip Rates by SA4 (White Collar Work)
Zenith Model Recalibration and Validation Version 3.0.1 Paper 4a – Home Based Trip Productions – Draft Report
10 D:\ZML-VIC - Year 4\Deliverables\Documents\04_trip_generation\Working\ZML-VIC_ZenithVictoria_HomeBasedTripGen_Working.docx
Table 4-3 - Comparison of Modelled and VISTA Trip Rates by SA4 (White Collar Work)
Zenith Model Recalibration and Validation Version 3.0.1 Paper 4a – Home Based Trip Productions – Draft Report
11 D:\ZML-VIC - Year 4\Deliverables\Documents\04_trip_generation\Working\ZML-VIC_ZenithVictoria_HomeBasedTripGen_Working.docx
4.2 Home Based Work – Blue Collar
4.2.1 Model Estimation
4.2.1.1 Parameter Estimates
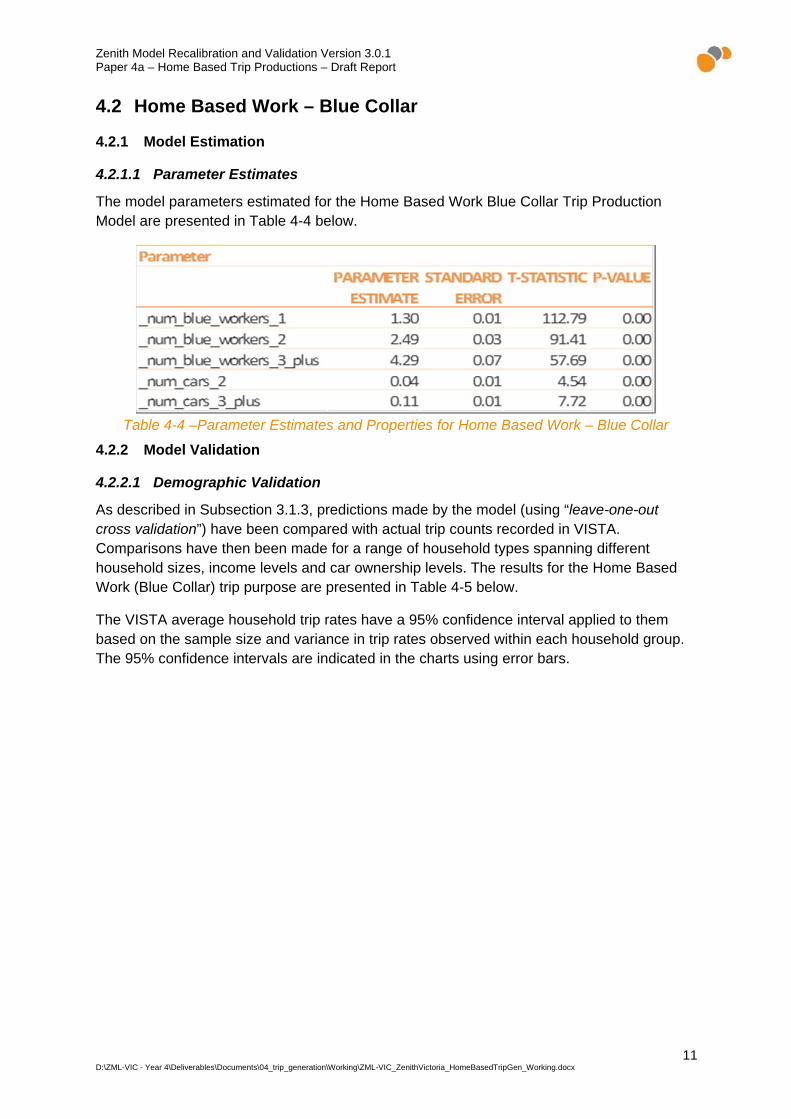
The model parameters estimated for the Home Based Work Blue Collar Trip Production Model are presented in Table 4-4 below.
Table 4-4 –Parameter Estimates and Properties for Home Based Work – Blue Collar
4.2.2 Model Validation
4.2.2.1 Demographic Validation
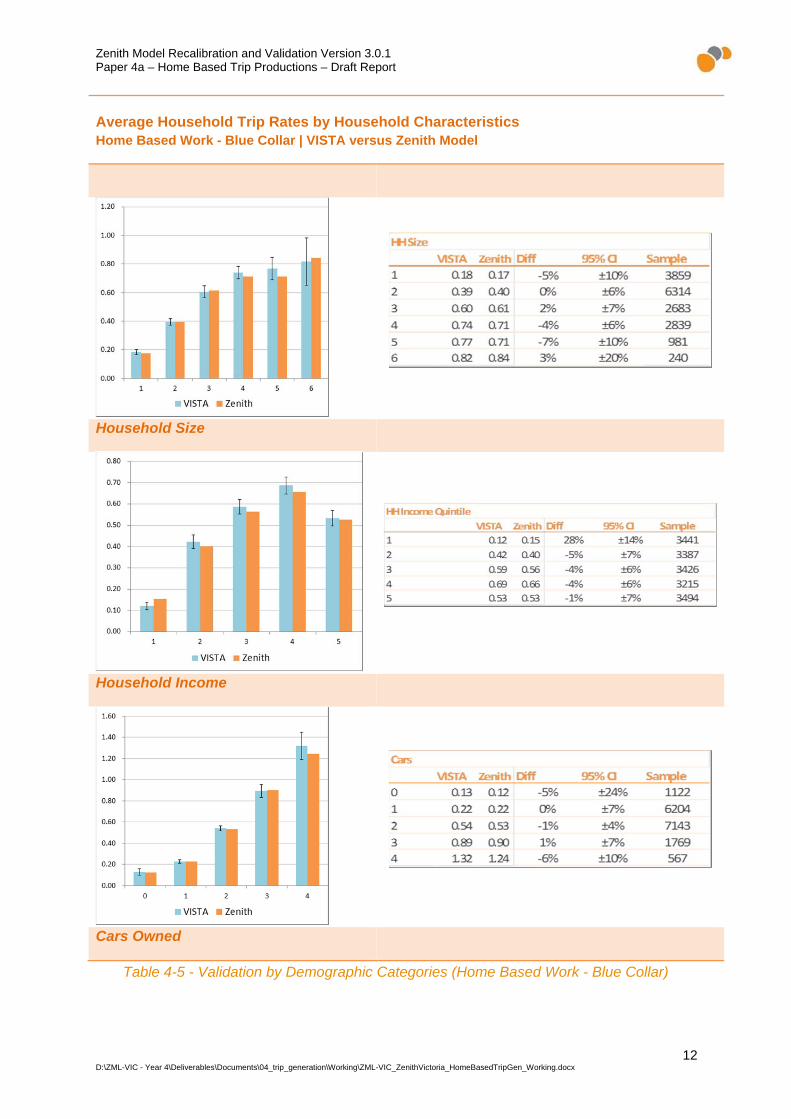
As described in Subsection 3.1.3, predictions made by the model (using “leave-one-out cross validation”) have been compared with actual trip counts recorded in VISTA. Comparisons have then been made for a range of household types spanning different household sizes, income levels and car ownership levels. The results for the Home Based Work (Blue Collar) trip purpose are presented in Table 4-5 below.
The VISTA average household trip rates have a 95% confidence interval applied to them based on the sample size and variance in trip rates observed within each household group. The 95% confidence intervals are indicated in the charts using error bars.
Zenith Model Recalibration and Validation Version 3.0.1 Paper 4a – Home Based Trip Productions – Draft Report
12 D:\ZML-VIC - Year 4\Deliverables\Documents\04_trip_generation\Working\ZML-VIC_ZenithVictoria_HomeBasedTripGen_Working.docx
Average Household Trip Rates by Household Characteristics Home Based Work - Blue Collar | VISTA versus Zenith Model
Household Size
Household Income
Cars Owned
Table 4-5 - Validation by Demographic Categories (Home Based Work - Blue Collar)

Zenith Model Recalibration and Validation Version 3.0.1 Paper 4a – Home Based Trip Productions – Draft Report
13 D:\ZML-VIC - Year 4\Deliverables\Documents\04_trip_generation\Working\ZML-VIC_ZenithVictoria_HomeBasedTripGen_Working.docx
4.2.2.2 Spatial Validation
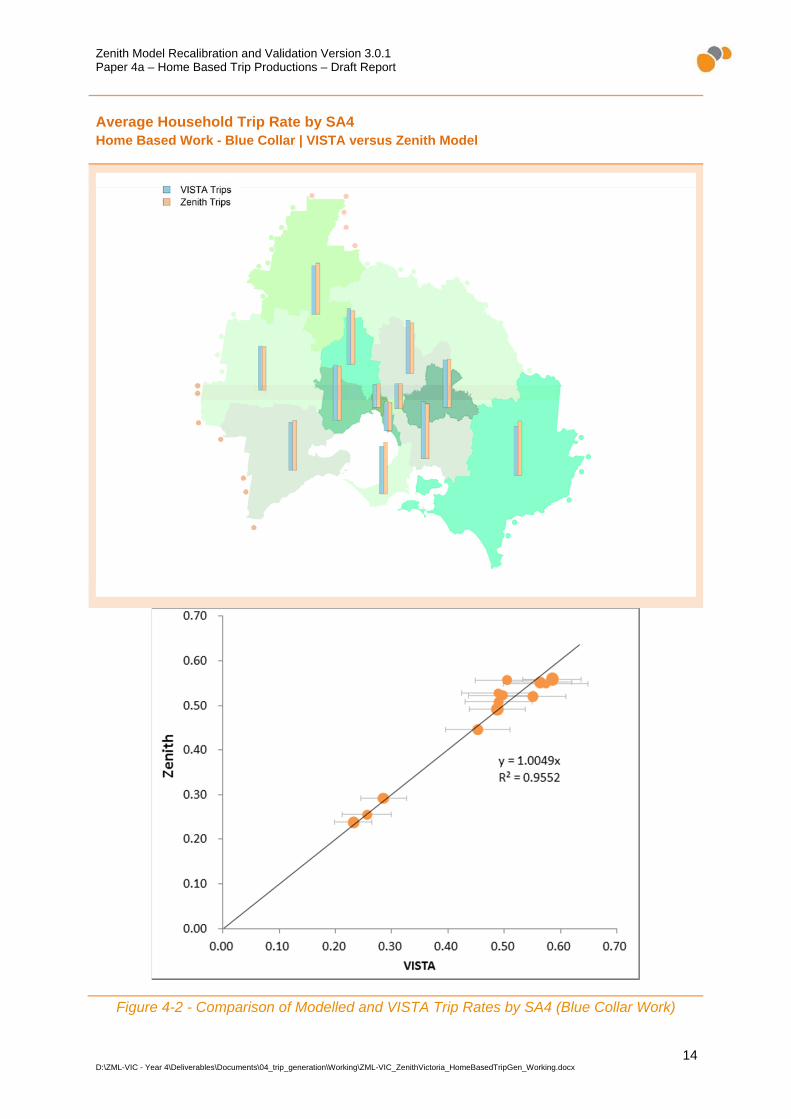
Using an identical process to that used in the demographic validation, households have been grouped according to their home location (at the SA4 level), and for each group the average household trip rate in the VISTA data has been compared with predictions made by the Zenith model. The purpose of this comparison is to help identify any spatial biases which might exist in the model.
The comparison is presented through three types of analyses:
A map, presented in Figure 4-2, which shows the VISTA and Zenith trip rates for each spatial area;
A scatter plot, also presented in Figure 4-2, which shows the correlation between VISTA and Zenith household trip rates per SA4. The size of each point represents the sample size for the spatial area, while horizontal error bars are used to indicate a 95% confidence interval on the surveyed trip rate; and
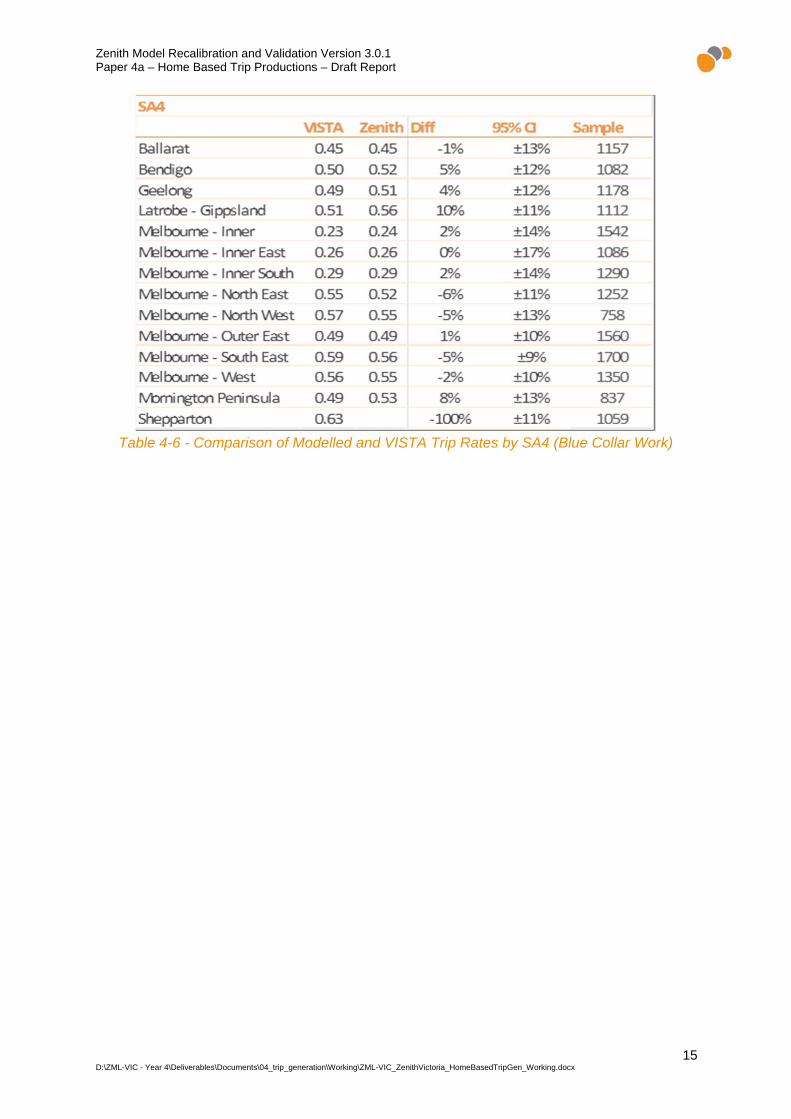
Table 4-6 which presents the raw data.
Zenith Model Recalibration and Validation Version 3.0.1 Paper 4a – Home Based Trip Productions – Draft Report
14 D:\ZML-VIC - Year 4\Deliverables\Documents\04_trip_generation\Working\ZML-VIC_ZenithVictoria_HomeBasedTripGen_Working.docx
Average Household Trip Rate by SA4 Home Based Work - Blue Collar | VISTA versus Zenith Model
Figure 4-2 - Comparison of Modelled and VISTA Trip Rates by SA4 (Blue Collar Work)
Zenith Model Recalibration and Validation Version 3.0.1 Paper 4a – Home Based Trip Productions – Draft Report
15 D:\ZML-VIC - Year 4\Deliverables\Documents\04_trip_generation\Working\ZML-VIC_ZenithVictoria_HomeBasedTripGen_Working.docx
Table 4-6 - Comparison of Modelled and VISTA Trip Rates by SA4 (Blue Collar Work)
Zenith Model Recalibration and Validation Version 3.0.1 Paper 4a – Home Based Trip Productions – Draft Report
16 D:\ZML-VIC - Year 4\Deliverables\Documents\04_trip_generation\Working\ZML-VIC_ZenithVictoria_HomeBasedTripGen_Working.docx
4.3 Home Based Education – Primary
4.3.1 Model Estimation
4.3.1.1 Parameter Estimates
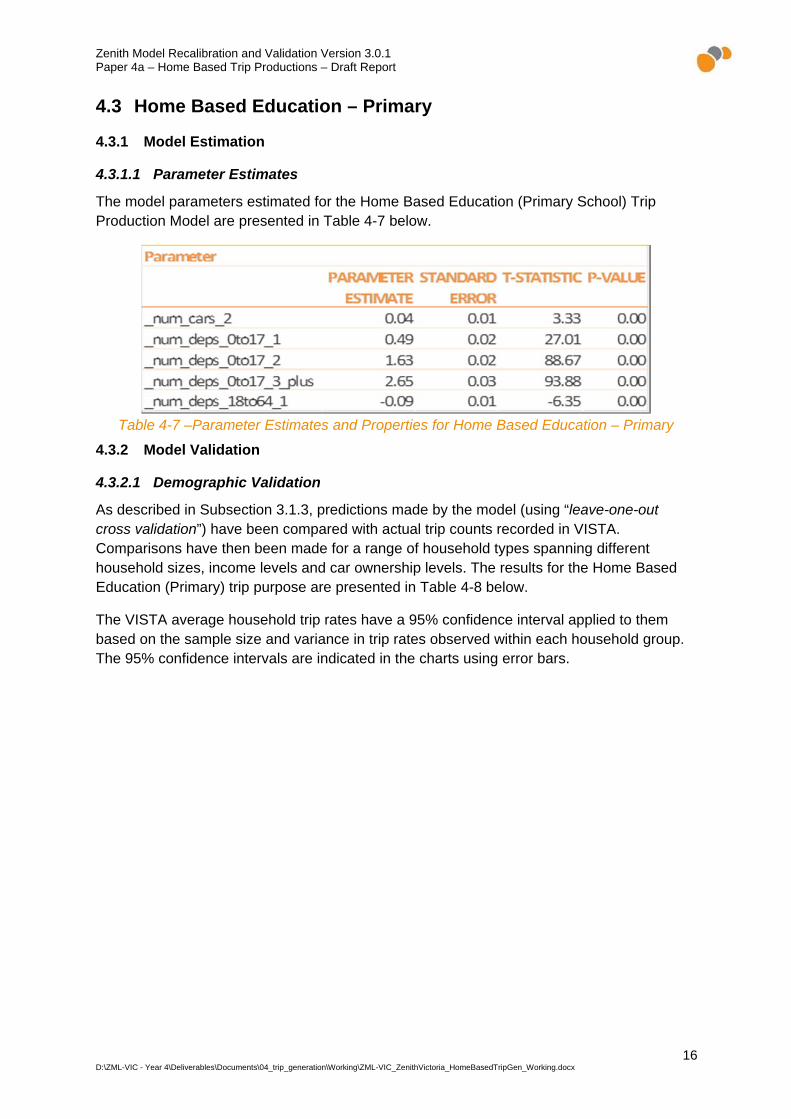
The model parameters estimated for the Home Based Education (Primary School) Trip Production Model are presented in Table 4-7 below.
Table 4-7 –Parameter Estimates and Properties for Home Based Education – Primary
4.3.2 Model Validation
4.3.2.1 Demographic Validation
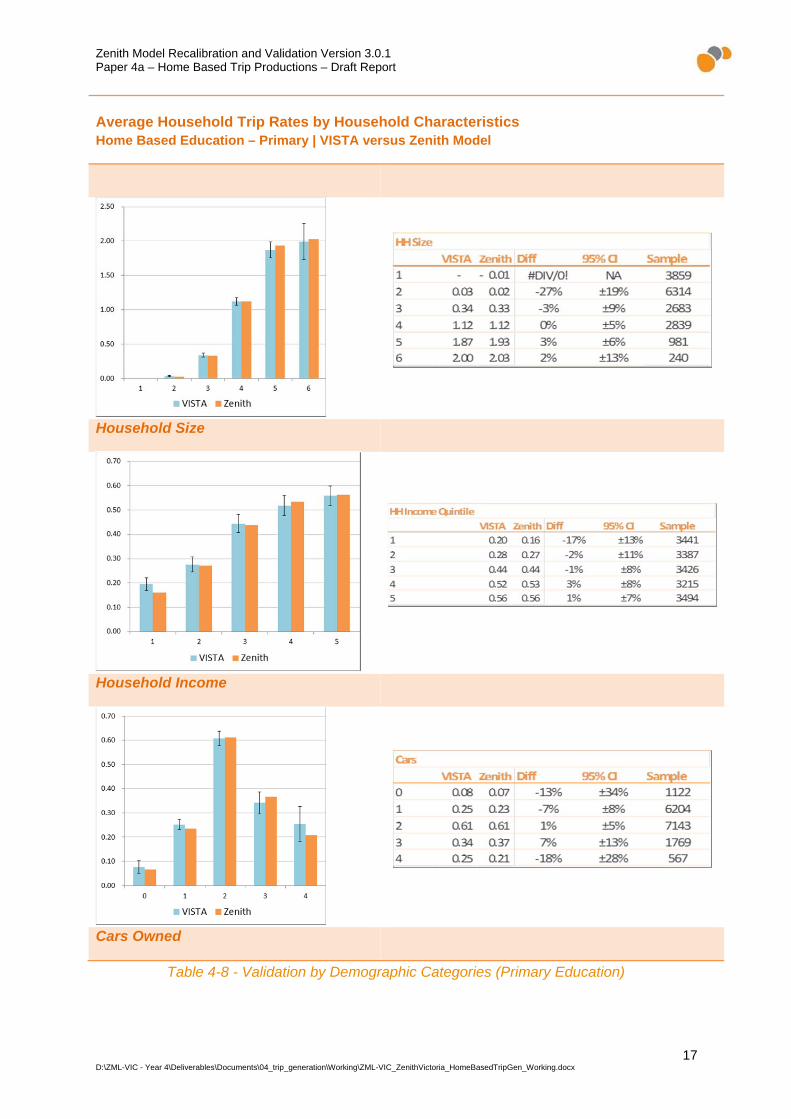
As described in Subsection 3.1.3, predictions made by the model (using “leave-one-out cross validation”) have been compared with actual trip counts recorded in VISTA. Comparisons have then been made for a range of household types spanning different household sizes, income levels and car ownership levels. The results for the Home Based Education (Primary) trip purpose are presented in Table 4-8 below.
The VISTA average household trip rates have a 95% confidence interval applied to them based on the sample size and variance in trip rates observed within each household group. The 95% confidence intervals are indicated in the charts using error bars.
Zenith Model Recalibration and Validation Version 3.0.1 Paper 4a – Home Based Trip Productions – Draft Report
17 D:\ZML-VIC - Year 4\Deliverables\Documents\04_trip_generation\Working\ZML-VIC_ZenithVictoria_HomeBasedTripGen_Working.docx
Average Household Trip Rates by Household Characteristics Home Based Education – Primary | VISTA versus Zenith Model
Household Size
Household Income
Cars Owned
Table 4-8 - Validation by Demographic Categories (Primary Education)

Zenith Model Recalibration and Validation Version 3.0.1 Paper 4a – Home Based Trip Productions – Draft Report
18 D:\ZML-VIC - Year 4\Deliverables\Documents\04_trip_generation\Working\ZML-VIC_ZenithVictoria_HomeBasedTripGen_Working.docx
4.3.2.2 Spatial Validation
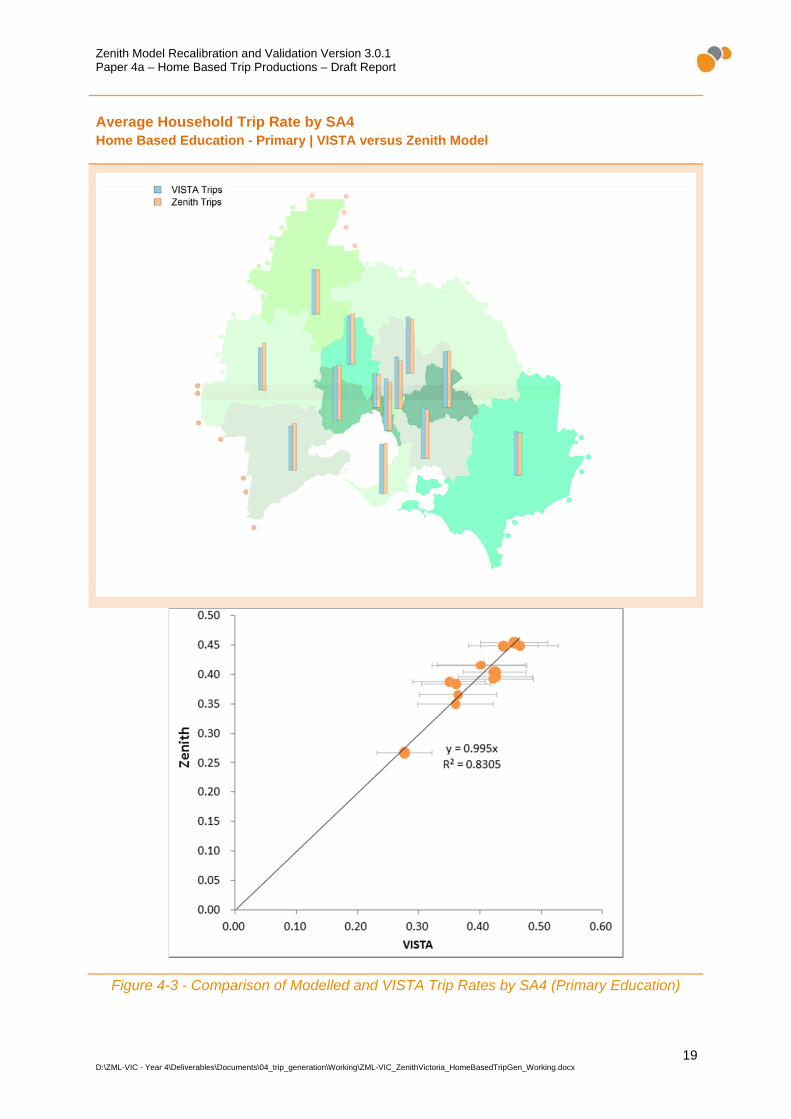
Using an identical process to that used in the demographic validation, households have been grouped according to their home location (at the SA4 level), and for each group the average household trip rate in the VISTA data has been compared with predictions made by the Zenith model. The purpose of this comparison is to help identify any spatial biases which might exist in the model.
The comparison is presented through three types of analyses:
A map, presented in Figure 4-3, which shows the VISTA and Zenith trip rates for each spatial area;
A scatter plot, also presented in Figure 4-3, which shows the correlation between VISTA and Zenith household trip rates per SA4. The size of each point represents the sample size for the spatial area, while horizontal error bars are used to indicate a 95% confidence interval on the surveyed trip rate; and
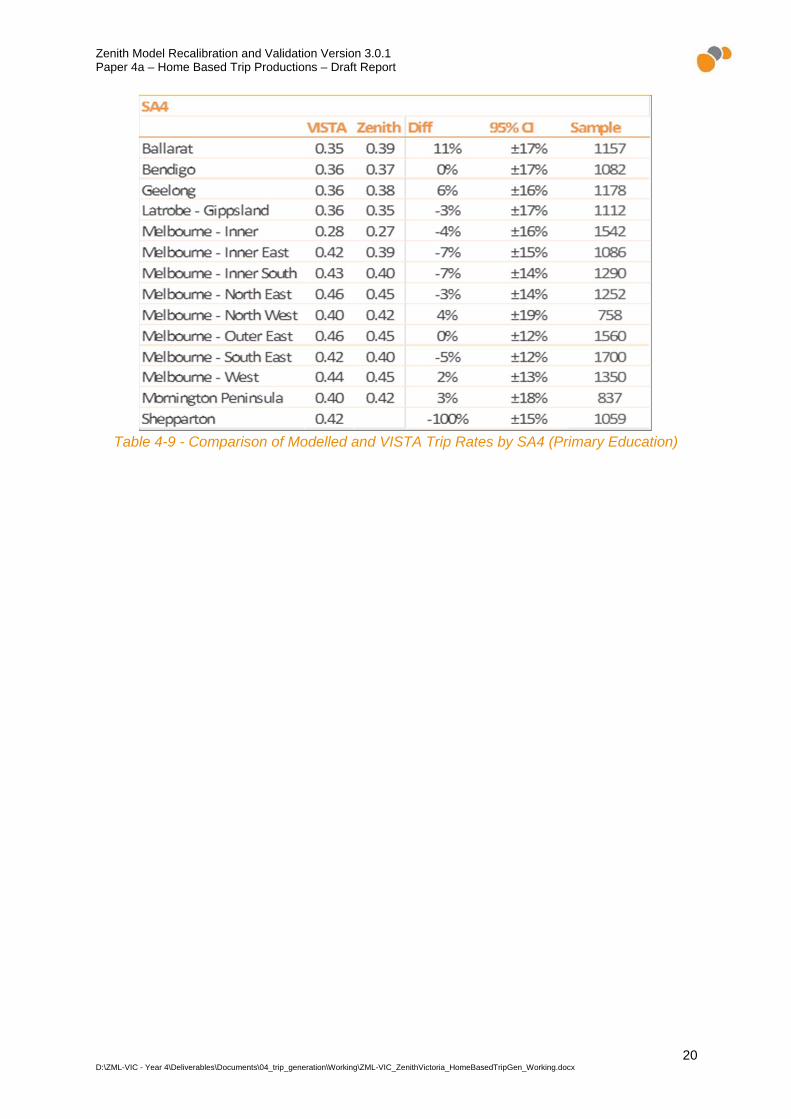
Table 4-9 which presents the raw data.
Zenith Model Recalibration and Validation Version 3.0.1 Paper 4a – Home Based Trip Productions – Draft Report
19 D:\ZML-VIC - Year 4\Deliverables\Documents\04_trip_generation\Working\ZML-VIC_ZenithVictoria_HomeBasedTripGen_Working.docx
Average Household Trip Rate by SA4 Home Based Education - Primary | VISTA versus Zenith Model
Figure 4-3 - Comparison of Modelled and VISTA Trip Rates by SA4 (Primary Education)
Zenith Model Recalibration and Validation Version 3.0.1 Paper 4a – Home Based Trip Productions – Draft Report
20 D:\ZML-VIC - Year 4\Deliverables\Documents\04_trip_generation\Working\ZML-VIC_ZenithVictoria_HomeBasedTripGen_Working.docx
Table 4-9 - Comparison of Modelled and VISTA Trip Rates by SA4 (Primary Education)
Zenith Model Recalibration and Validation Version 3.0.1 Paper 4a – Home Based Trip Productions – Draft Report
21 D:\ZML-VIC - Year 4\Deliverables\Documents\04_trip_generation\Working\ZML-VIC_ZenithVictoria_HomeBasedTripGen_Working.docx
4.4 Home Based Education – Secondary
4.4.1 Model Estimation
4.4.1.1 Parameter Estimates
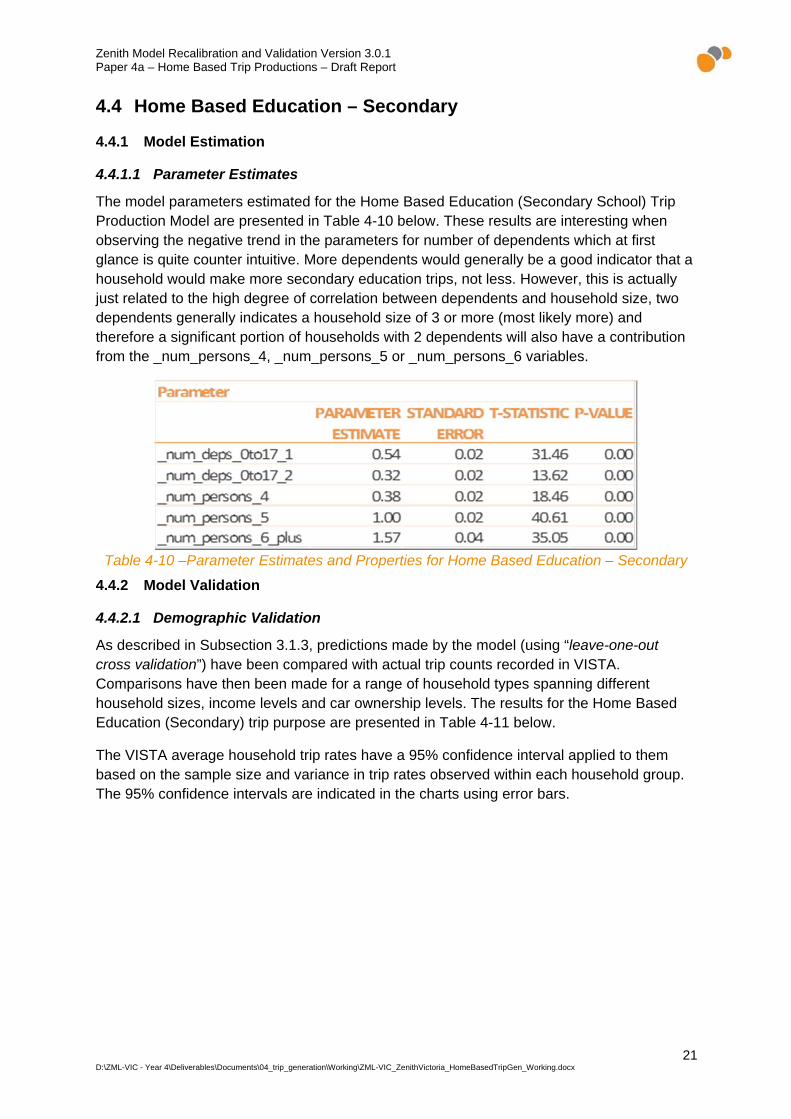
The model parameters estimated for the Home Based Education (Secondary School) Trip Production Model are presented in Table 4-10 below. These results are interesting when observing the negative trend in the parameters for number of dependents which at first glance is quite counter intuitive. More dependents would generally be a good indicator that a household would make more secondary education trips, not less. However, this is actually just related to the high degree of correlation between dependents and household size, two dependents generally indicates a household size of 3 or more (most likely more) and therefore a significant portion of households with 2 dependents will also have a contribution from the _num_persons_4, _num_persons_5 or _num_persons_6 variables.
Table 4-10 –Parameter Estimates and Properties for Home Based Education – Secondary
4.4.2 Model Validation
4.4.2.1 Demographic Validation
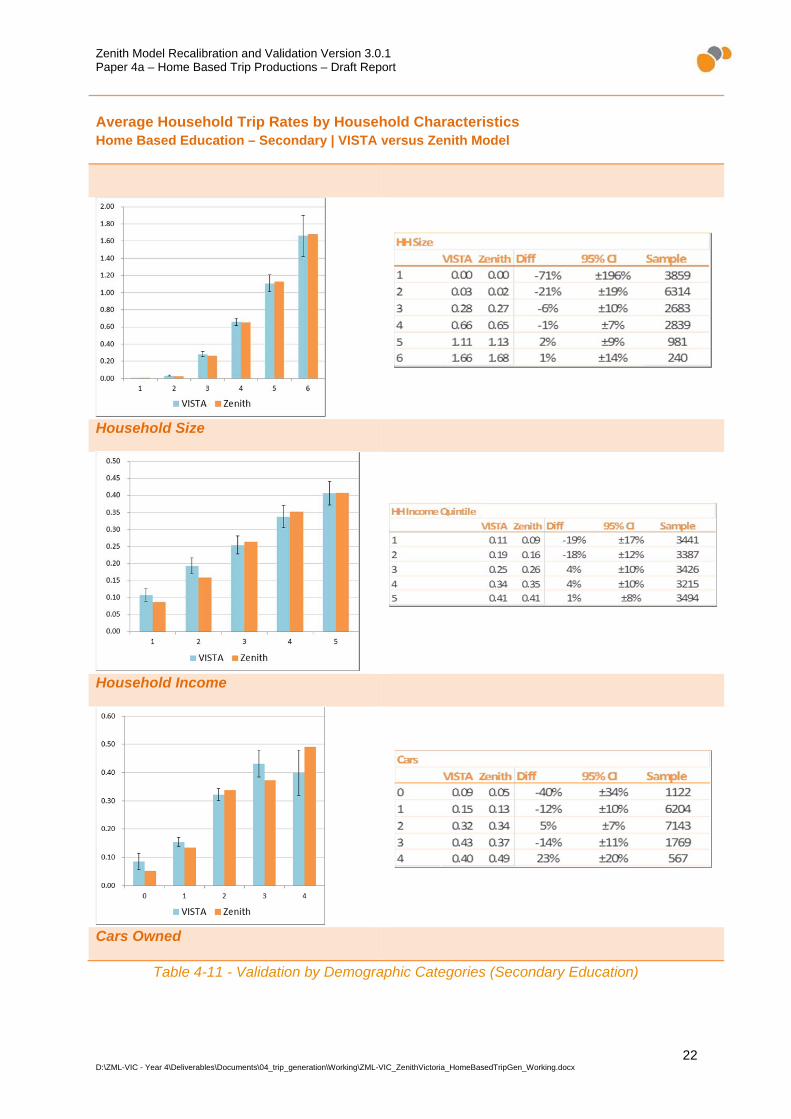
As described in Subsection 3.1.3, predictions made by the model (using “leave-one-out cross validation”) have been compared with actual trip counts recorded in VISTA. Comparisons have then been made for a range of household types spanning different household sizes, income levels and car ownership levels. The results for the Home Based Education (Secondary) trip purpose are presented in Table 4-11 below.
The VISTA average household trip rates have a 95% confidence interval applied to them based on the sample size and variance in trip rates observed within each household group. The 95% confidence intervals are indicated in the charts using error bars.
Zenith Model Recalibration and Validation Version 3.0.1 Paper 4a – Home Based Trip Productions – Draft Report
22 D:\ZML-VIC - Year 4\Deliverables\Documents\04_trip_generation\Working\ZML-VIC_ZenithVictoria_HomeBasedTripGen_Working.docx
Average Household Trip Rates by Household Characteristics Home Based Education – Secondary | VISTA versus Zenith Model
Household Size
Household Income
Cars Owned
Table 4-11 - Validation by Demographic Categories (Secondary Education)

Zenith Model Recalibration and Validation Version 3.0.1 Paper 4a – Home Based Trip Productions – Draft Report
23 D:\ZML-VIC - Year 4\Deliverables\Documents\04_trip_generation\Working\ZML-VIC_ZenithVictoria_HomeBasedTripGen_Working.docx
4.4.2.2 Spatial Validation
Using an identical process to that used in the demographic validation, households have been grouped according to their home location (at the SA4 level), and for each group the average household trip rate in the VISTA data has been compared with predictions made by the Zenith model. The purpose of this comparison is to help identify any spatial biases which might exist in the model.
The comparison is presented through three types of analyses:
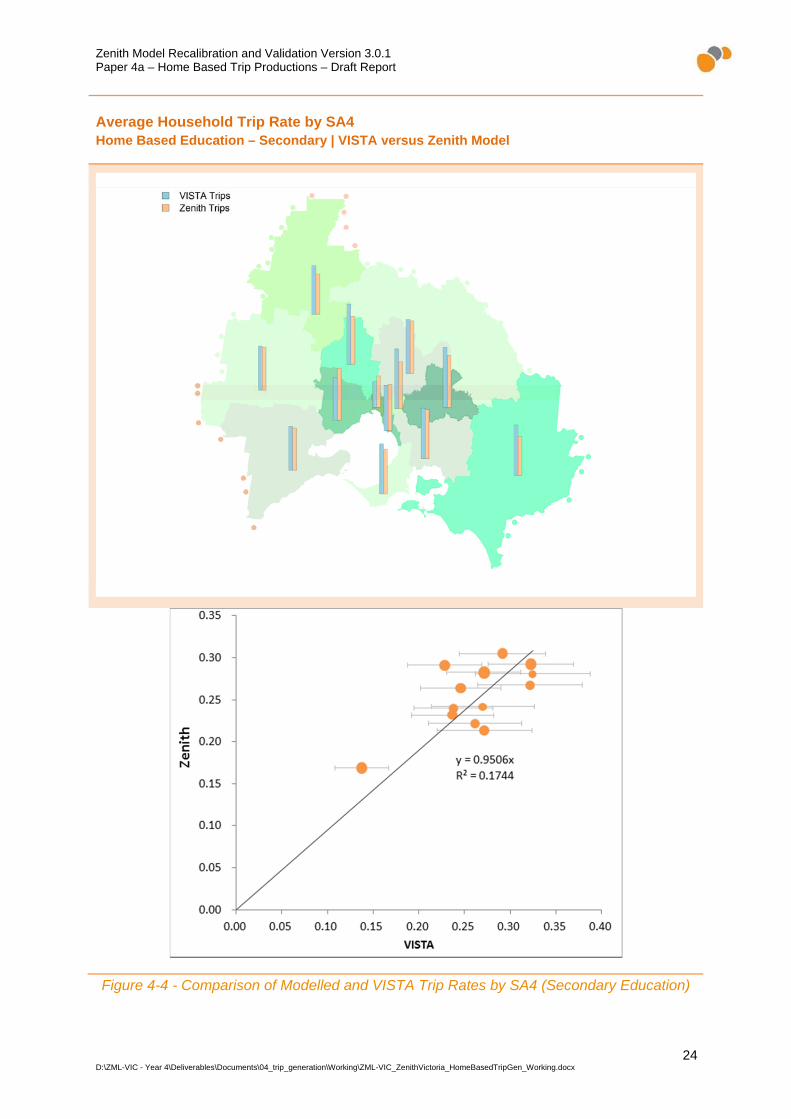
A map, presented in Figure 4-4, which shows the VISTA and Zenith trip rates for each spatial area;
A scatter plot, also presented in Figure 4-4, which shows the correlation between VISTA and Zenith household trip rates per SA4. The size of each point represents the sample size for the spatial area, while horizontal error bars are used to indicate a 95% confidence interval on the surveyed trip rate; and
Table 4-12 which presents the raw data.
Zenith Model Recalibration and Validation Version 3.0.1 Paper 4a – Home Based Trip Productions – Draft Report
24 D:\ZML-VIC - Year 4\Deliverables\Documents\04_trip_generation\Working\ZML-VIC_ZenithVictoria_HomeBasedTripGen_Working.docx
Average Household Trip Rate by SA4 Home Based Education – Secondary | VISTA versus Zenith Model
Figure 4-4 - Comparison of Modelled and VISTA Trip Rates by SA4 (Secondary Education)

Zenith Model Recalibration and Validation Version 3.0.1 Paper 4a – Home Based Trip Productions – Draft Report
25 D:\ZML-VIC - Year 4\Deliverables\Documents\04_trip_generation\Working\ZML-VIC_ZenithVictoria_HomeBasedTripGen_Working.docx
Table 4-12 - Comparison of Modelled and VISTA Trip Rates by SA4 (Secondary Education)
Zenith Model Recalibration and Validation Version 3.0.1 Paper 4a – Home Based Trip Productions – Draft Report
26 D:\ZML-VIC - Year 4\Deliverables\Documents\04_trip_generation\Working\ZML-VIC_ZenithVictoria_HomeBasedTripGen_Working.docx
4.5 Home Based Education – Tertiary
4.5.1 Model Estimation
4.5.1.1 Parameter Estimates
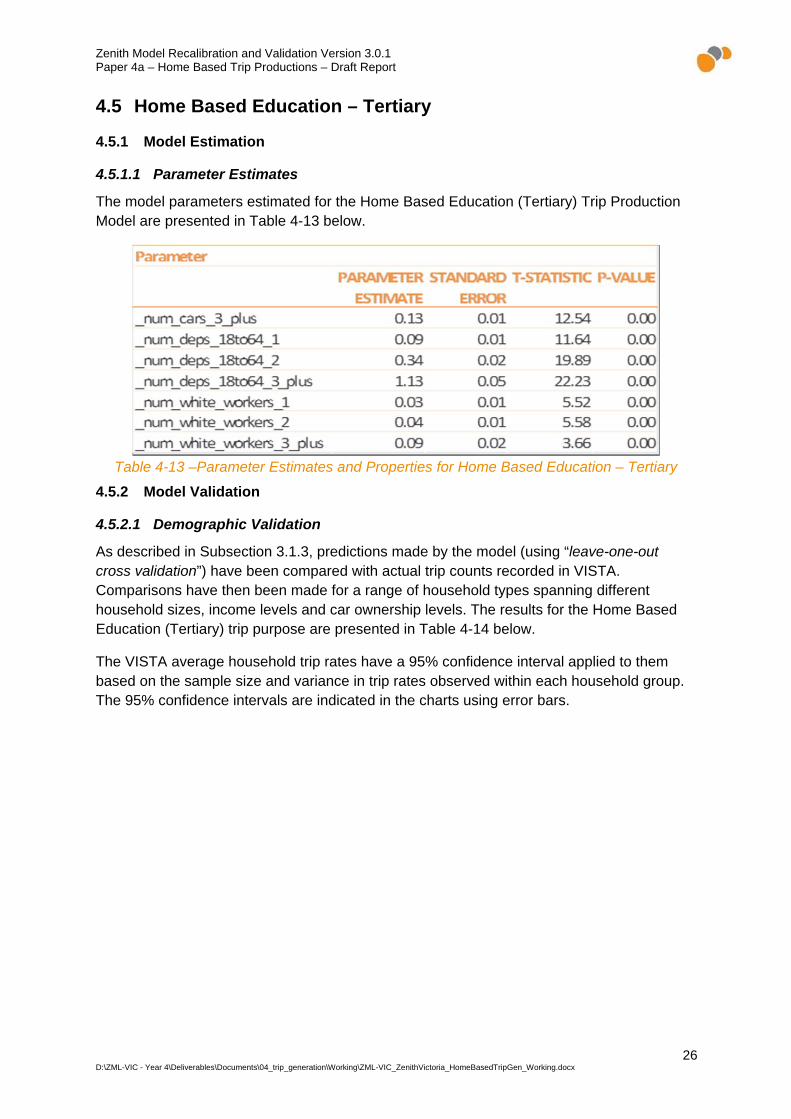
The model parameters estimated for the Home Based Education (Tertiary) Trip Production Model are presented in Table 4-13 below.
Table 4-13 –Parameter Estimates and Properties for Home Based Education – Tertiary
4.5.2 Model Validation
4.5.2.1 Demographic Validation
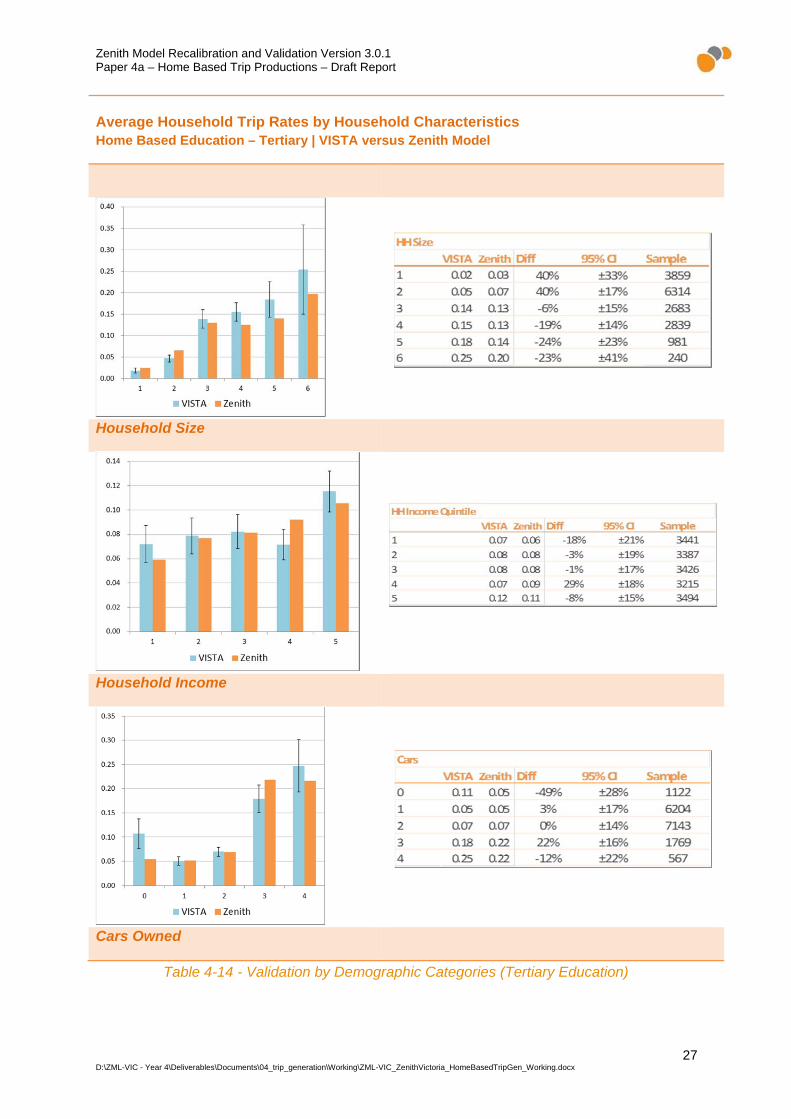
As described in Subsection 3.1.3, predictions made by the model (using “leave-one-out cross validation”) have been compared with actual trip counts recorded in VISTA. Comparisons have then been made for a range of household types spanning different household sizes, income levels and car ownership levels. The results for the Home Based Education (Tertiary) trip purpose are presented in Table 4-14 below.
The VISTA average household trip rates have a 95% confidence interval applied to them based on the sample size and variance in trip rates observed within each household group. The 95% confidence intervals are indicated in the charts using error bars.
Zenith Model Recalibration and Validation Version 3.0.1 Paper 4a – Home Based Trip Productions – Draft Report
27 D:\ZML-VIC - Year 4\Deliverables\Documents\04_trip_generation\Working\ZML-VIC_ZenithVictoria_HomeBasedTripGen_Working.docx
Average Household Trip Rates by Household Characteristics Home Based Education – Tertiary | VISTA versus Zenith Model
Household Size
Household Income
Cars Owned
Table 4-14 - Validation by Demographic Categories (Tertiary Education)

Zenith Model Recalibration and Validation Version 3.0.1 Paper 4a – Home Based Trip Productions – Draft Report
28 D:\ZML-VIC - Year 4\Deliverables\Documents\04_trip_generation\Working\ZML-VIC_ZenithVictoria_HomeBasedTripGen_Working.docx
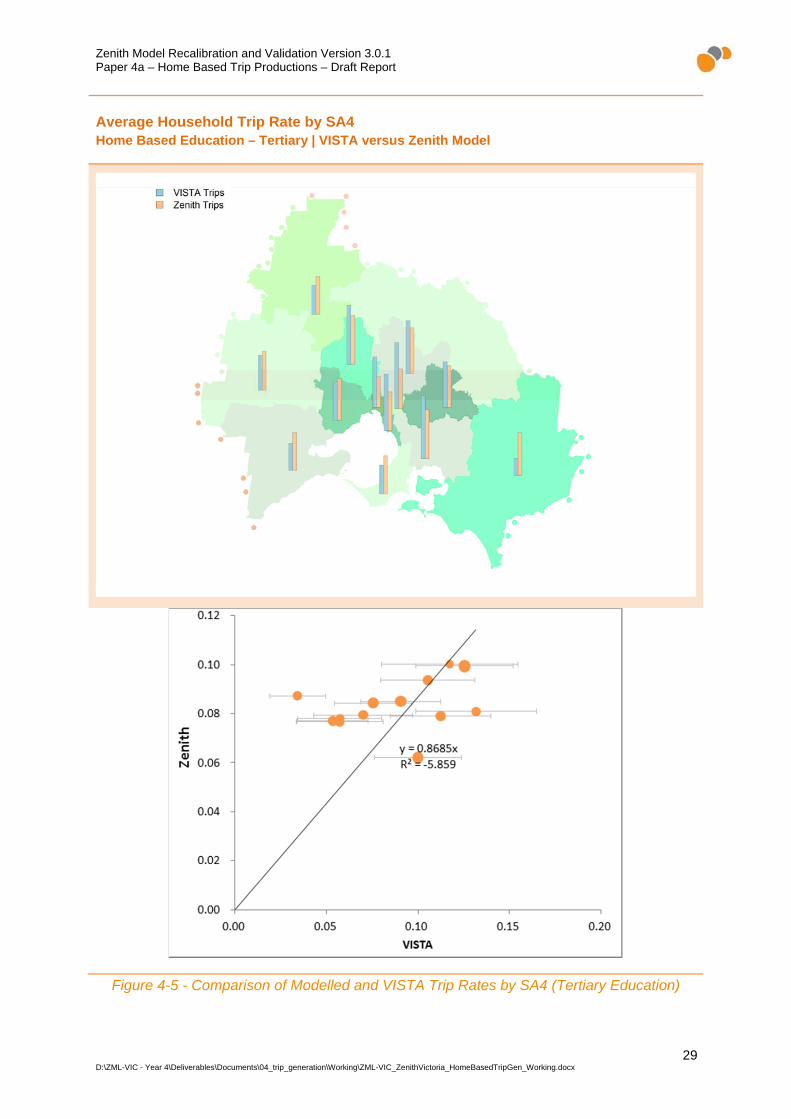
4.5.2.2 Spatial Validation
Using an identical process to that used in the demographic validation, households have been grouped according to their home location (at the SA4 level), and for each group the average household trip rate in the VISTA data has been compared with predictions made by the Zenith model. The purpose of this comparison is to help identify any spatial biases which might exist in the model.
The comparison is presented through three types of analyses:
A map, presented in Figure 4-5, which shows the VISTA and Zenith trip rates for each spatial area;
A scatter plot, also presented in Figure 4-5, which shows the correlation between VISTA and Zenith household trip rates per SA4. The size of each point represents the sample size for the spatial area, while horizontal error bars are used to indicate a 95% confidence interval on the surveyed trip rate; and
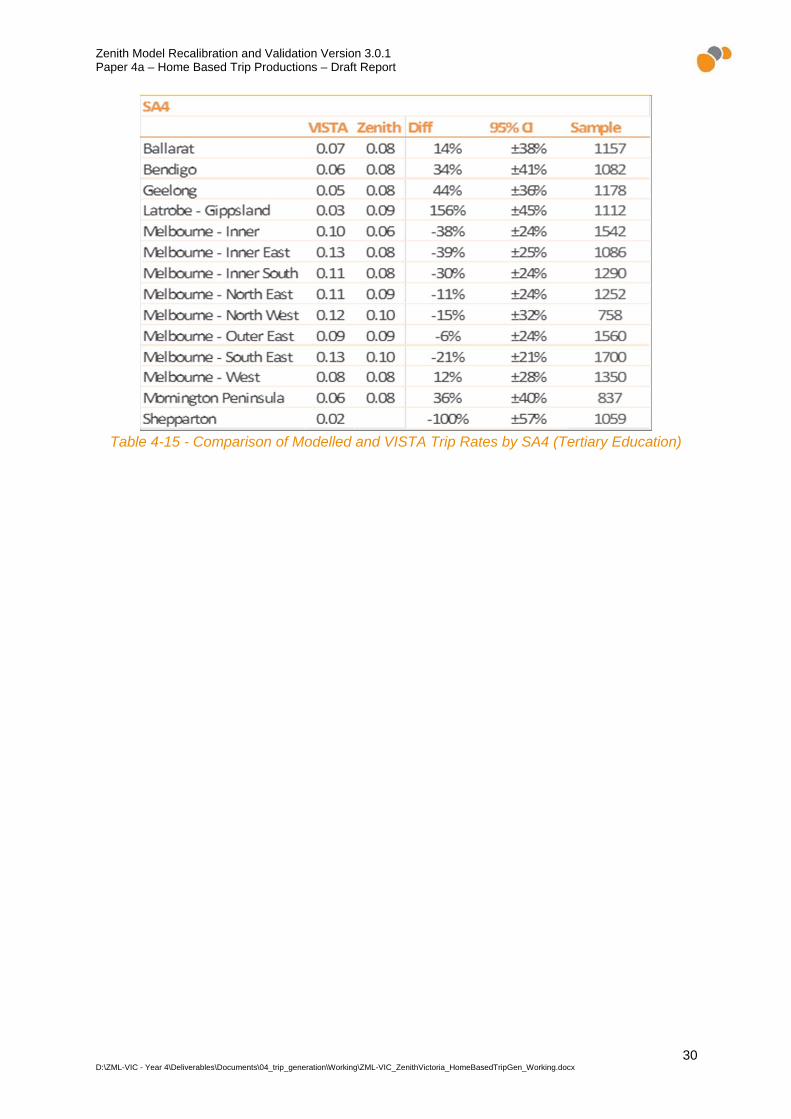
Table 4-15 which presents the raw data.
Zenith Model Recalibration and Validation Version 3.0.1 Paper 4a – Home Based Trip Productions – Draft Report
29 D:\ZML-VIC - Year 4\Deliverables\Documents\04_trip_generation\Working\ZML-VIC_ZenithVictoria_HomeBasedTripGen_Working.docx
Average Household Trip Rate by SA4 Home Based Education – Tertiary | VISTA versus Zenith Model
Figure 4-5 - Comparison of Modelled and VISTA Trip Rates by SA4 (Tertiary Education)
Zenith Model Recalibration and Validation Version 3.0.1 Paper 4a – Home Based Trip Productions – Draft Report
30 D:\ZML-VIC - Year 4\Deliverables\Documents\04_trip_generation\Working\ZML-VIC_ZenithVictoria_HomeBasedTripGen_Working.docx
Table 4-15 - Comparison of Modelled and VISTA Trip Rates by SA4 (Tertiary Education)
Zenith Model Recalibration and Validation Version 3.0.1 Paper 4a – Home Based Trip Productions – Draft Report
31 D:\ZML-VIC - Year 4\Deliverables\Documents\04_trip_generation\Working\ZML-VIC_ZenithVictoria_HomeBasedTripGen_Working.docx
4.6 Home Based Shopping
4.6.1 Model Estimation
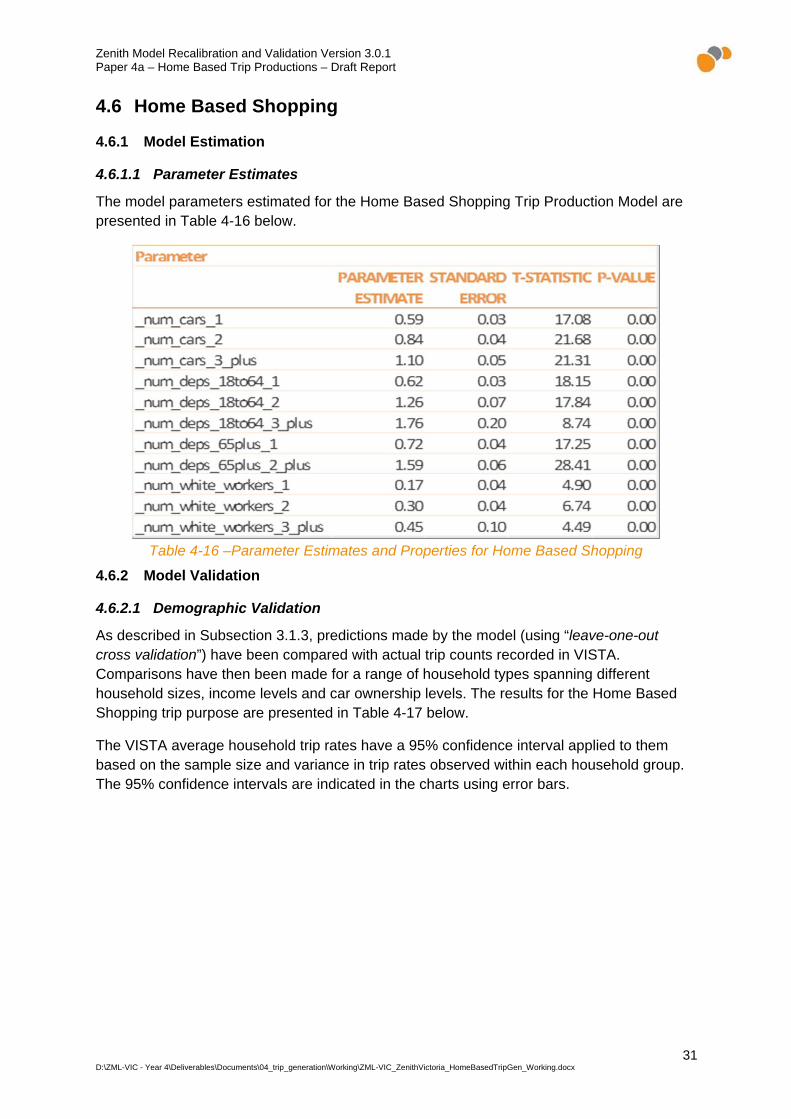
4.6.1.1 Parameter Estimates
The model parameters estimated for the Home Based Shopping Trip Production Model are presented in Table 4-16 below.
Table 4-16 –Parameter Estimates and Properties for Home Based Shopping
4.6.2 Model Validation
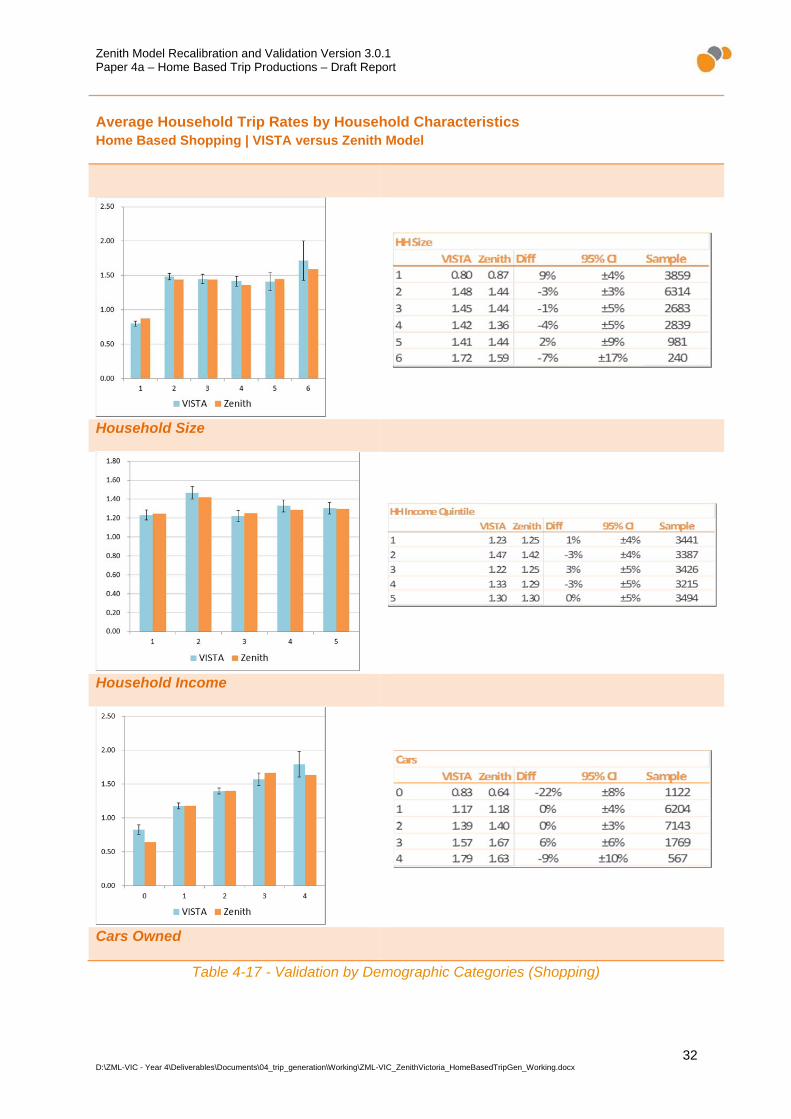
4.6.2.1 Demographic Validation
As described in Subsection 3.1.3, predictions made by the model (using “leave-one-out cross validation”) have been compared with actual trip counts recorded in VISTA. Comparisons have then been made for a range of household types spanning different household sizes, income levels and car ownership levels. The results for the Home Based Shopping trip purpose are presented in Table 4-17 below.
The VISTA average household trip rates have a 95% confidence interval applied to them based on the sample size and variance in trip rates observed within each household group. The 95% confidence intervals are indicated in the charts using error bars.
Zenith Model Recalibration and Validation Version 3.0.1 Paper 4a – Home Based Trip Productions – Draft Report
32 D:\ZML-VIC - Year 4\Deliverables\Documents\04_trip_generation\Working\ZML-VIC_ZenithVictoria_HomeBasedTripGen_Working.docx
Average Household Trip Rates by Household Characteristics Home Based Shopping | VISTA versus Zenith Model
Household Size
Household Income
Cars Owned
Table 4-17 - Validation by Demographic Categories (Shopping)
Zenith Model Recalibration and Validation Version 3.0.1 Paper 4a – Home Based Trip Productions – Draft Report
33 D:\ZML-VIC - Year 4\Deliverables\Documents\04_trip_generation\Working\ZML-VIC_ZenithVictoria_HomeBasedTripGen_Working.docx
4.6.2.2 Spatial Validation
Using an identical process to that used in the demographic validation, households have been grouped according to their home location (at the SA4 level), and for each group the average household trip rate in the VISTA data has been compared with predictions made by the Zenith model. The purpose of this comparison is to help identify any spatial biases which might exist in the model.
The comparison is presented through three types of analyses:
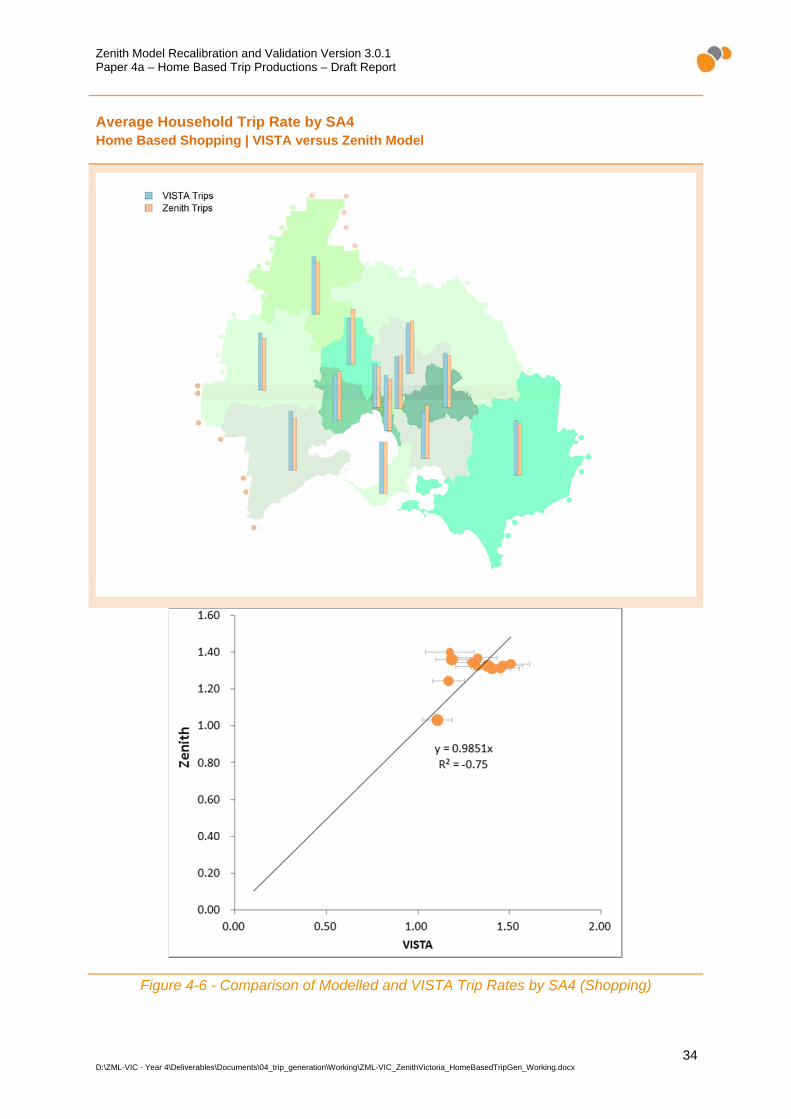
A map, presented in Figure 4-6, which shows the VISTA and Zenith trip rates for each spatial area;
A scatter plot, also presented in Figure 4-6, which shows the correlation between VISTA and Zenith household trip rates per SA4. The size of each point represents the sample size for the spatial area, while horizontal error bars are used to indicate a 95% confidence interval on the surveyed trip rate; and
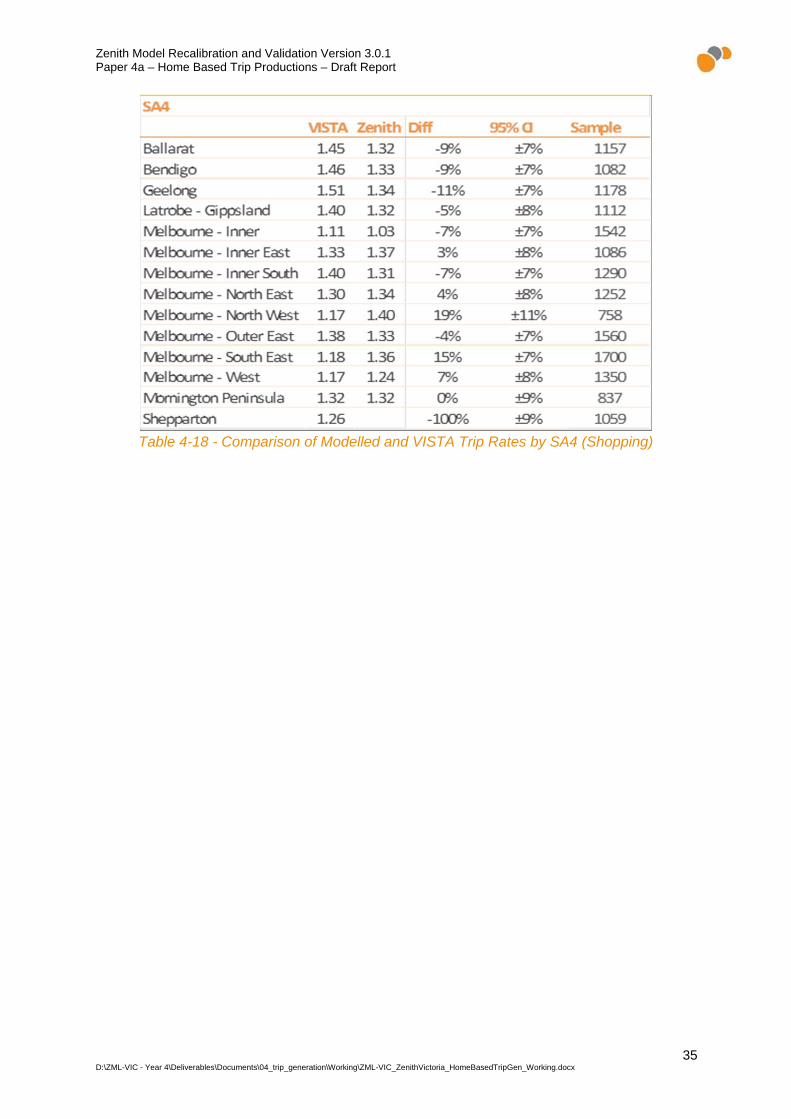
Table 4-18 which presents the raw data.
Zenith Model Recalibration and Validation Version 3.0.1 Paper 4a – Home Based Trip Productions – Draft Report
34 D:\ZML-VIC - Year 4\Deliverables\Documents\04_trip_generation\Working\ZML-VIC_ZenithVictoria_HomeBasedTripGen_Working.docx
Average Household Trip Rate by SA4 Home Based Shopping | VISTA versus Zenith Model
Figure 4-6 - Comparison of Modelled and VISTA Trip Rates by SA4 (Shopping)
Zenith Model Recalibration and Validation Version 3.0.1 Paper 4a – Home Based Trip Productions – Draft Report
35 D:\ZML-VIC - Year 4\Deliverables\Documents\04_trip_generation\Working\ZML-VIC_ZenithVictoria_HomeBasedTripGen_Working.docx
Table 4-18 - Comparison of Modelled and VISTA Trip Rates by SA4 (Shopping)
Zenith Model Recalibration and Validation Version 3.0.1 Paper 4a – Home Based Trip Productions – Draft Report
36 D:\ZML-VIC - Year 4\Deliverables\Documents\04_trip_generation\Working\ZML-VIC_ZenithVictoria_HomeBasedTripGen_Working.docx
4.7 Home Based Recreation
4.7.1 Model Estimation
4.7.1.1 Parameter Estimates
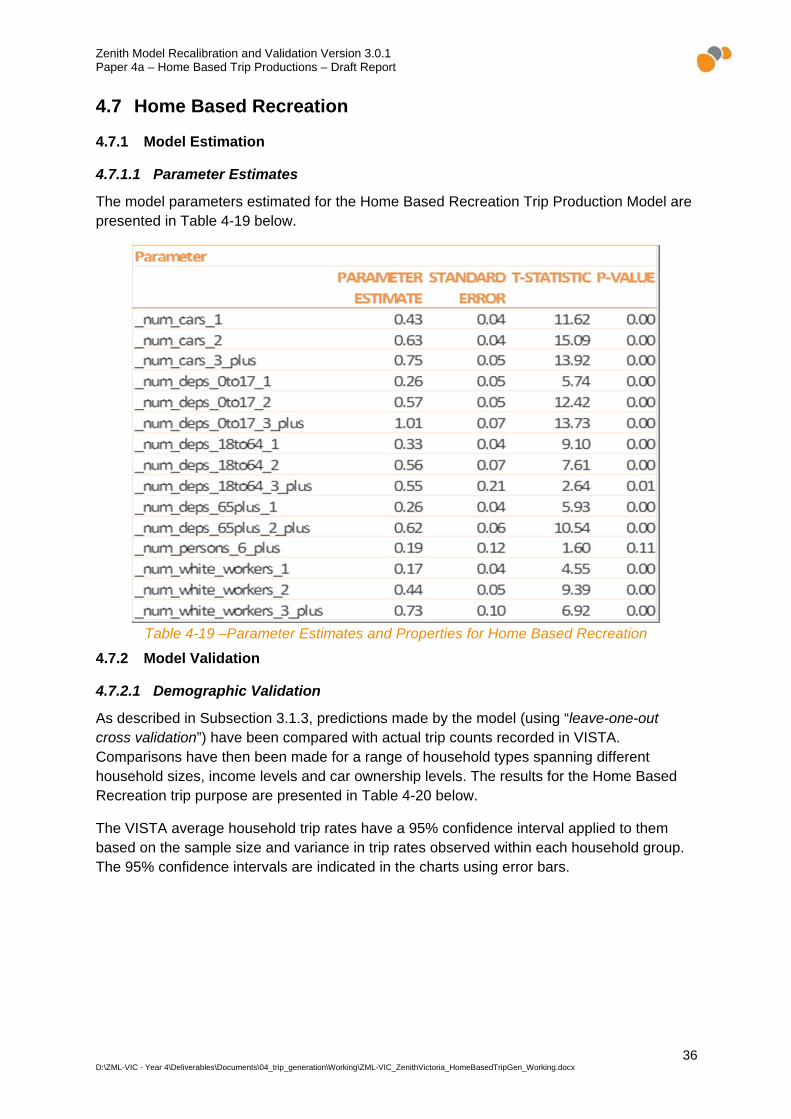
The model parameters estimated for the Home Based Recreation Trip Production Model are presented in Table 4-19 below.
Table 4-19 –Parameter Estimates and Properties for Home Based Recreation
4.7.2 Model Validation
4.7.2.1 Demographic Validation
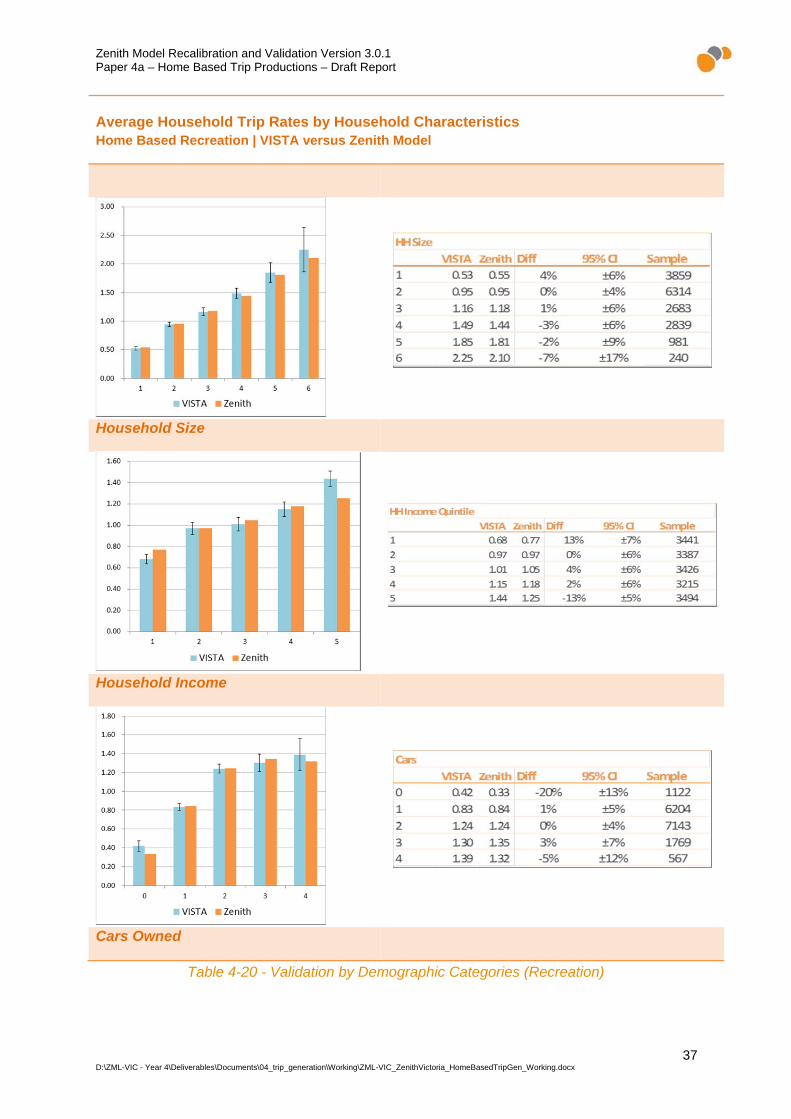
As described in Subsection 3.1.3, predictions made by the model (using “leave-one-out cross validation”) have been compared with actual trip counts recorded in VISTA. Comparisons have then been made for a range of household types spanning different household sizes, income levels and car ownership levels. The results for the Home Based Recreation trip purpose are presented in Table 4-20 below.
The VISTA average household trip rates have a 95% confidence interval applied to them based on the sample size and variance in trip rates observed within each household group. The 95% confidence intervals are indicated in the charts using error bars.
Zenith Model Recalibration and Validation Version 3.0.1 Paper 4a – Home Based Trip Productions – Draft Report
37 D:\ZML-VIC - Year 4\Deliverables\Documents\04_trip_generation\Working\ZML-VIC_ZenithVictoria_HomeBasedTripGen_Working.docx
Average Household Trip Rates by Household Characteristics Home Based Recreation | VISTA versus Zenith Model
Household Size
Household Income
Cars Owned
Table 4-20 - Validation by Demographic Categories (Recreation)

Zenith Model Recalibration and Validation Version 3.0.1 Paper 4a – Home Based Trip Productions – Draft Report
38 D:\ZML-VIC - Year 4\Deliverables\Documents\04_trip_generation\Working\ZML-VIC_ZenithVictoria_HomeBasedTripGen_Working.docx
4.7.2.2 Spatial Validation
Using an identical process to that used in the demographic validation, households have been grouped according to their home location (at the SA4 level), and for each group the average household trip rate in the VISTA data has been compared with predictions made by the Zenith model. The purpose of this comparison is to help identify any spatial biases which might exist in the model.
The comparison is presented through three types of analyses:
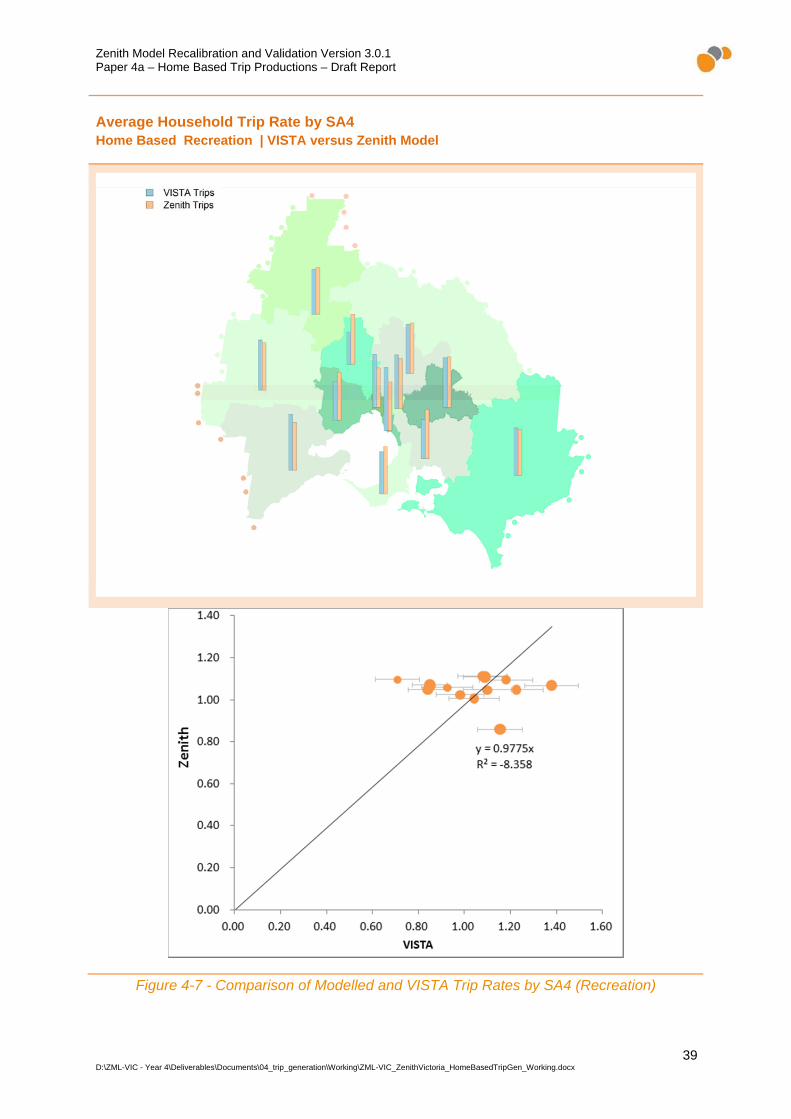
A map, presented in Figure 4-7, which shows the VISTA and Zenith trip rates for each spatial area;
A scatter plot, also presented in Figure 4-7, which shows the correlation between VISTA and Zenith household trip rates per SA4. The size of each point represents the sample size for the spatial area, while horizontal error bars are used to indicate a 95% confidence interval on the surveyed trip rate; and
Table 4-21 which presents the raw data.
Zenith Model Recalibration and Validation Version 3.0.1 Paper 4a – Home Based Trip Productions – Draft Report
39 D:\ZML-VIC - Year 4\Deliverables\Documents\04_trip_generation\Working\ZML-VIC_ZenithVictoria_HomeBasedTripGen_Working.docx
Average Household Trip Rate by SA4 Home Based Recreation | VISTA versus Zenith Model
Figure 4-7 - Comparison of Modelled and VISTA Trip Rates by SA4 (Recreation)

Zenith Model Recalibration and Validation Version 3.0.1 Paper 4a – Home Based Trip Productions – Draft Report
40 D:\ZML-VIC - Year 4\Deliverables\Documents\04_trip_generation\Working\ZML-VIC_ZenithVictoria_HomeBasedTripGen_Working.docx
Table 4-21 - Comparison of Modelled and VISTA Trip Rates by SA4 (Recreation)
Zenith Model Recalibration and Validation Version 3.0.1 Paper 4a – Home Based Trip Productions – Draft Report
41 D:\ZML-VIC - Year 4\Deliverables\Documents\04_trip_generation\Working\ZML-VIC_ZenithVictoria_HomeBasedTripGen_Working.docx
4.8 Home Based Other
4.8.1 Model Estimation
4.8.1.1 Parameter Estimates
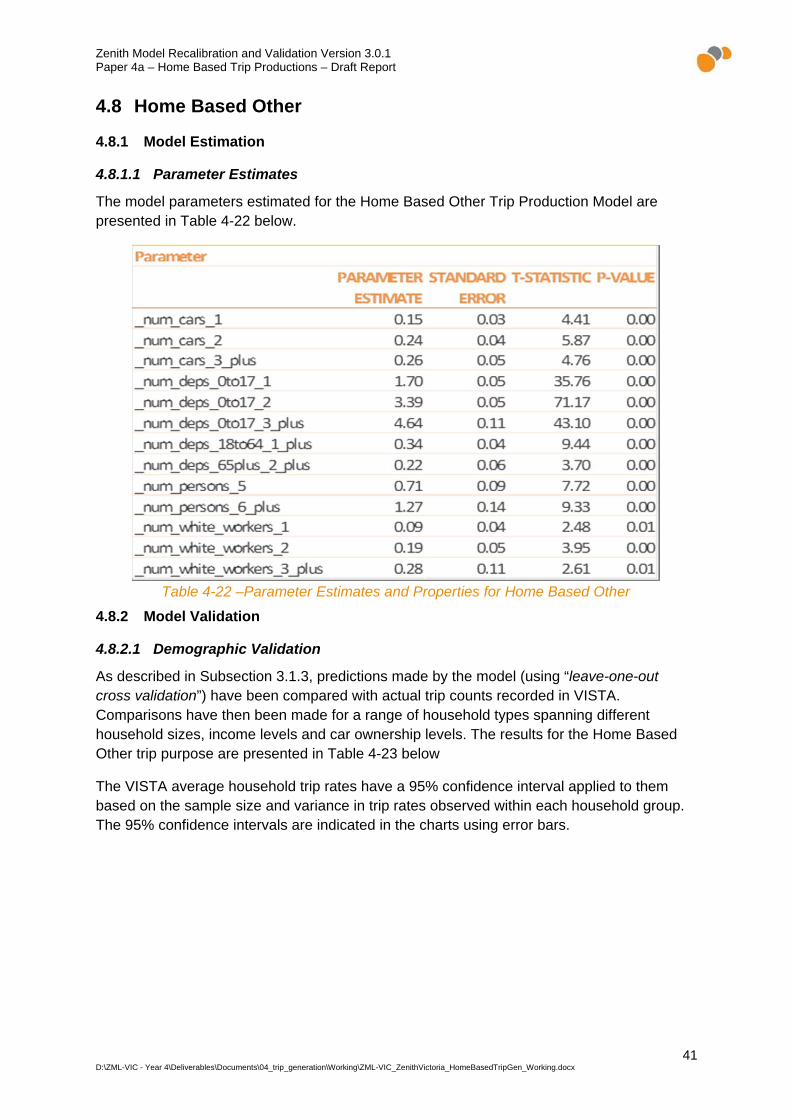
The model parameters estimated for the Home Based Other Trip Production Model are presented in Table 4-22 below.
Table 4-22 –Parameter Estimates and Properties for Home Based Other
4.8.2 Model Validation
4.8.2.1 Demographic Validation
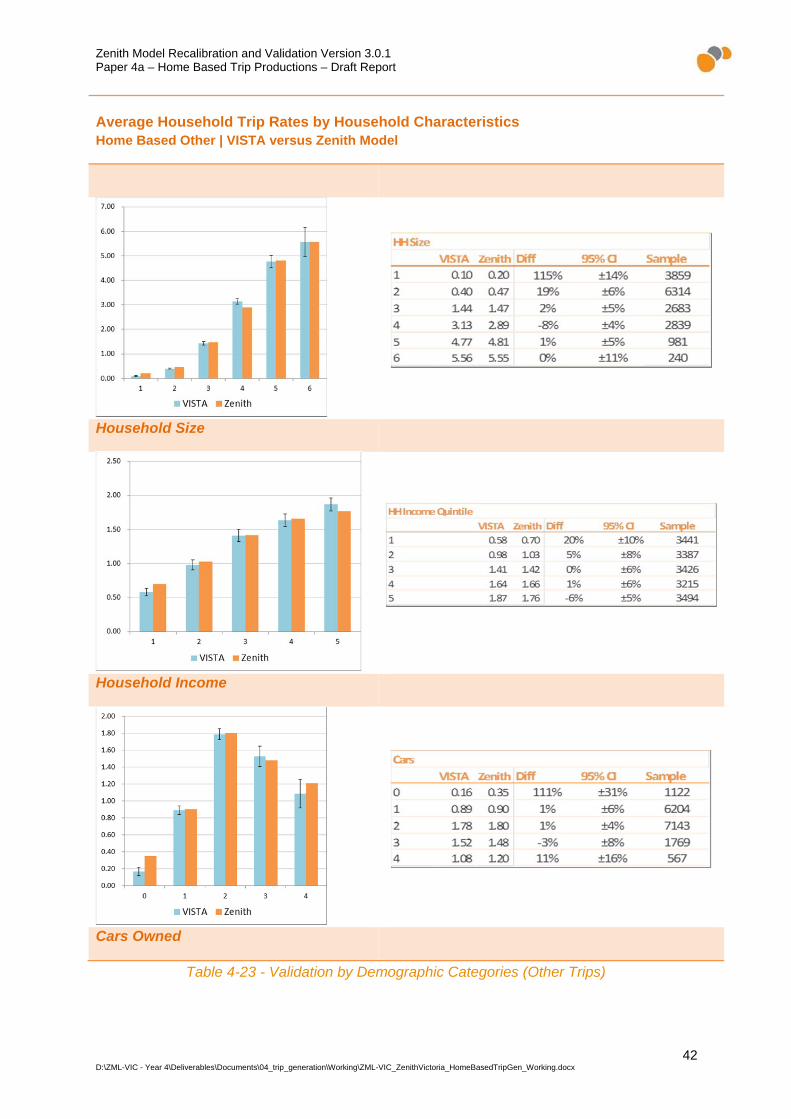
As described in Subsection 3.1.3, predictions made by the model (using “leave-one-out cross validation”) have been compared with actual trip counts recorded in VISTA. Comparisons have then been made for a range of household types spanning different household sizes, income levels and car ownership levels. The results for the Home Based Other trip purpose are presented in Table 4-23 below
The VISTA average household trip rates have a 95% confidence interval applied to them based on the sample size and variance in trip rates observed within each household group. The 95% confidence intervals are indicated in the charts using error bars.
Zenith Model Recalibration and Validation Version 3.0.1 Paper 4a – Home Based Trip Productions – Draft Report
42 D:\ZML-VIC - Year 4\Deliverables\Documents\04_trip_generation\Working\ZML-VIC_ZenithVictoria_HomeBasedTripGen_Working.docx
Average Household Trip Rates by Household Characteristics Home Based Other | VISTA versus Zenith Model
Household Size
Household Income
Cars Owned
Table 4-23 - Validation by Demographic Categories (Other Trips)

Zenith Model Recalibration and Validation Version 3.0.1 Paper 4a – Home Based Trip Productions – Draft Report
43 D:\ZML-VIC - Year 4\Deliverables\Documents\04_trip_generation\Working\ZML-VIC_ZenithVictoria_HomeBasedTripGen_Working.docx
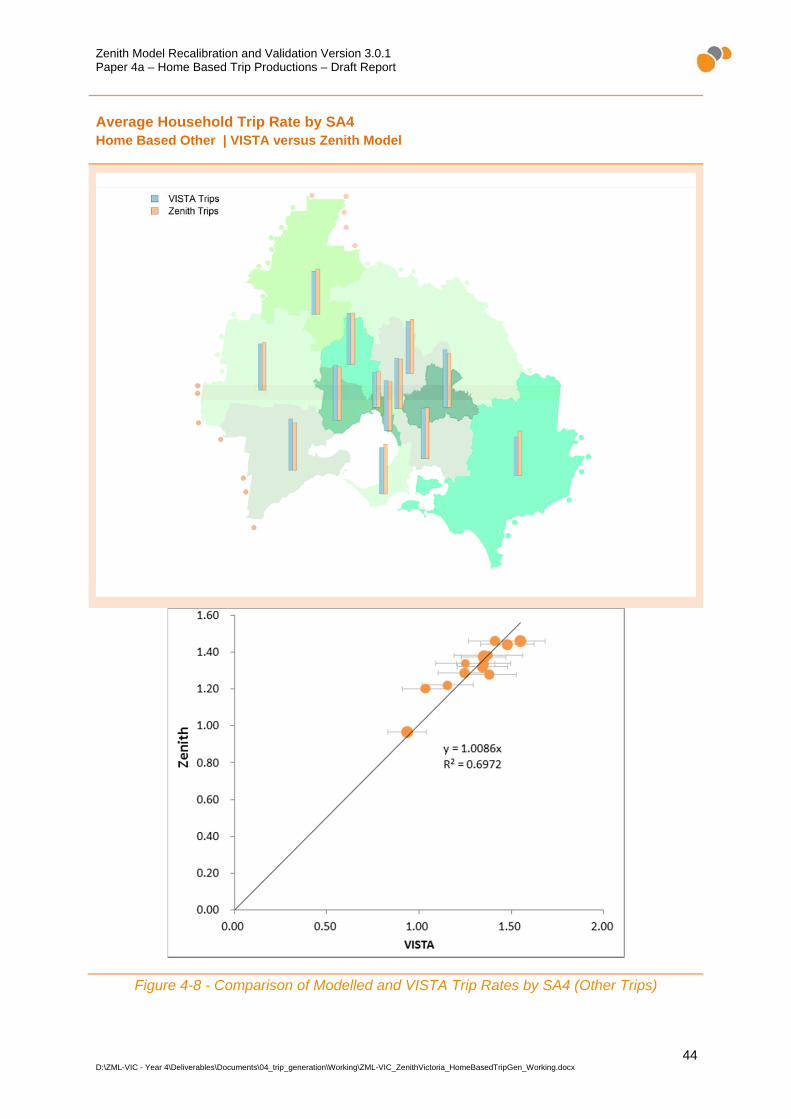
4.8.2.2 Spatial Validation
Using an identical process to that used in the demographic validation, households have been grouped according to their home location (at the SA4 level), and for each group the average household trip rate in the VISTA data has been compared with predictions made by the Zenith Model. The purpose of this comparison is to help identify any spatial biases which might exist in the model.
The comparison is presented through three types of analyses:
A map, presented in Figure 4-8, which compares the VISTA and Zenith household trip rates for each SA4;
A scatter plot, also presented in Figure 4-8, which shows the correlation between VISTA and Zenith household trip rates per SA4. The size of each point represents the sample size for the spatial area, while horizontal error bars are used to indicate a 95% confidence interval on the surveyed trip rate; and
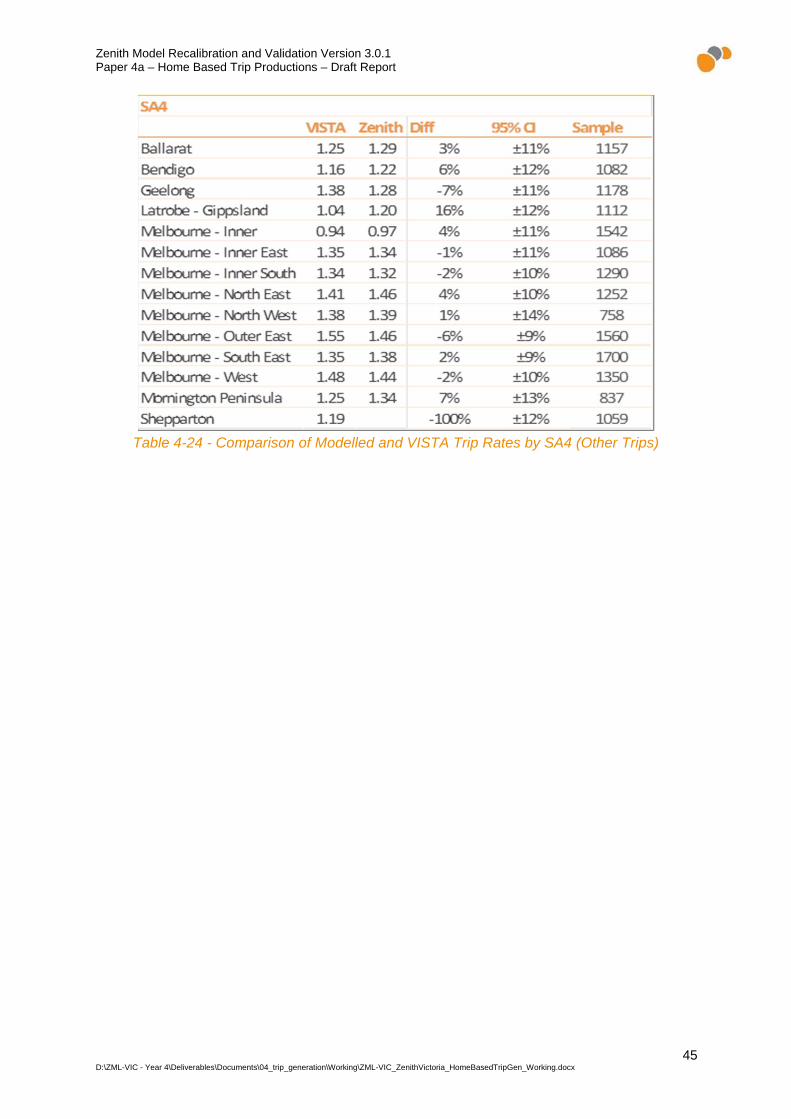
Table 4-24 which presents the raw data.
Zenith Model Recalibration and Validation Version 3.0.1 Paper 4a – Home Based Trip Productions – Draft Report
44 D:\ZML-VIC - Year 4\Deliverables\Documents\04_trip_generation\Working\ZML-VIC_ZenithVictoria_HomeBasedTripGen_Working.docx
Average Household Trip Rate by SA4 Home Based Other | VISTA versus Zenith Model
Figure 4-8 - Comparison of Modelled and VISTA Trip Rates by SA4 (Other Trips)
Zenith Model Recalibration and Validation Version 3.0.1 Paper 4a – Home Based Trip Productions – Draft Report
45 D:\ZML-VIC - Year 4\Deliverables\Documents\04_trip_generation\Working\ZML-VIC_ZenithVictoria_HomeBasedTripGen_Working.docx
Table 4-24 - Comparison of Modelled and VISTA Trip Rates by SA4 (Other Trips)