Embed Size (px)
Citation preview

Study of Adsorption of Corrosion Inhibitor 1-(2-aminoethyl)-2-oleyl-2-imidazolinium Chloride on
Carbon Steel Under CO2 Environment by Using In-Situ AFM Measurements
Zineb Belarbi, Bruce Brown, Marc Singer, Nesic Srdjan Institute for Corrosion and Multiphase Technology
Ohio University 342 West State Street
Athens, OH 45701
ABSTRACT
The most common corrosion inhibitors used to minimize corrosion of carbon steel in the oil and gas industry contain imidazoline molecules. However, the behavior of imidazoline molecules at the interface remains poorly understood, especially with respect to the adhesive and cohesive forces of inhibitor films. The objective of this work is to understand the adsorption/desorption process of 1-(2-aminoethyl)-2-oleyl-2-imidazolinium chloride on carbon steel. In order to study adsorption of imidazolinium chloride on carbon steel, in-situ atomic force microscopy (AFM) measurements were performed in air, with and without imidazolinium chloride, in a 1 wt% NaCl solution purged with CO2 at pH 4. In-situ electrochemical/AFM measurements confirmed the formation of an inhibitor film on carbon steel surface, resulting in a decrease in corrosion rate as determined by electrochemical measurements. Quantitative force measurements were also performed to evaluate the force required for penetration of the inhibitor film adsorbed on carbon steel.
Keywords: CO2 corrosion, imidazoline, AFM, inhibition, carbon steel, CO2 corrosion.
INTRODUCTION & BACKGROUND
The use of atomic force microscopy (AFM) for corrosion research studies is becoming more widespread over the last decade. Several research groups have coupled the use of atomic force microscopy with the study of corrosion and corrosion inhibition studies on mild steel,[1-5] but until now they have not coupled the AFM contact mode and force spectroscopy studies with in situ corrosion rate and electrochemical spectroscopy measurements during the AFM analysis.
One of the earliest papers found about using AFM for imaging the adsorption of corrosion inhibitors on steel was conducted by Kinsella and Becker. [1] This paper won the Marshall Fordham Best Research paper award at Corrosion & Prevention 2008, Australia. The research showed the advantage of using AFM imaging techniques over other methods, since the AFM could physically measure the assembly
1
Paper No.
9290
©2017 by NACE International.Requests for permission to publish this manuscript in any form, in part or in whole, must be in writing toNACE International, Publications Division, 15835 Park Ten Place, Houston, Texas 77084.The material presented and the views expressed in this paper are solely those of the author(s) and are not necessarily endorsed by the Association.

of molecules on the surface in the presence of an aqueous phase. Specimen of AISI 304L stainless steel were polished to a mirror finish, etched in order to observe grain structure, and measured by AFM. Topography of the surface was obtained along with proving the adsorption of inhibitor on the surface by use of force-distance plots. Topographical AFM images were correlated to three basic shapes of an inhibitor layer (rod, sphere, and bi-layer).
A study on the inhibition effect of tall oil fatty acid (TOFA) imidazolium chloride on the corrosion of mild steel in chloride solutions saturated with CO2 was done by Jevremović, et al. [2] in 2013. This research compared measurement methods of weight loss for inhibitor efficiency, electrochemical quartz crystal microbalance (EQCM) for determination of thermodynamic parameters of adsorption, and AFM to
characterize the microstructure and changes in surface roughness after 24 hour exposures at 20C
and 70C. The AFM research in this case was carried out on corroded surfaces taken out of the solution and tested in a dry contact mode in the AFM. The inhibitor was found to have a 95% efficiency for an API 5L X65 materials tested at two temperatures, where the EQCM measurements were used to prove the adsorption kinetics could be described by a Langmuir adsorption isotherm and the AFM measurements provided micrometer scale visual comparisons indicating the decrease in surface roughness due to adsorption and formation of the inhibitor layer.
Pandarinathan, et al. [3], used in situ AFM measurements to investigate the adsorbed aggregate structures of a 1-dodecylpyridinium chloride (PDC) on mild steel and correlated these with electrochemical corrosion rate measurements from separate glass cell experiments in 2014. Epoxy mounted UNS 1030 carbon steel specimens were polished using diamond suspensions to achieve an RMS surface roughness of ~ 30 nm before testing. In situ low force AFM contact mode measurements were conducted in de-aerated salt solutions with and without inhibitor for time intervals of 5 minutes, 30 minutes, and 4 hours to obtain topographical images for comparison. It was observed that the in situ AFM results correlated well with the glass cell corrosion rate measurements such that they concluded the aggregate structure of the inhibitor layer had influenced the final corrosion rate.
The next major achievement for inhibitor related research by AFM was published by Xiong, et al. [4], in 2014. This paper received the 2016 CORROSION Journal Best Paper Award, having studied the properties of an adsorbed imidazolium chloride corrosion inhibitor on mica, gold, and X65 steel surfaces. AFM topographical and force spectroscopy images were collected in deionized water in oxygen purged environment for varied concentrations of the inhibitor. Surface scratching procedures were conducted to determine the depth of the inhibitor layers and quantitative force measurements were done to prove the existence of the inhibitor layer and to prove the inhibitor had been removed from the scratched regions. The Tall Oil Fatty Acid (TOFA) imidazolium chloride inhibitor tested in this study was found to form single or bi-layer structures dependent upon bulk concentration. It was also determined that the mechanical stress necessary to physically remove adsorbed inhibitor molecules was on the order of MPa.
Further research using AFM force spectroscopy was conducted by Zhao, et al. [5], in a study focused on the inhibition efficiency of six imidazoline derivatives on N80 steel. The study, published in 2016, used characteristics found in AFM force spectroscopy measurements to support the corrosion efficiencies determined for each inhibitor tested. When AFM force spectroscopy curves were conducted, the approach curve shows a positive force when the tip makes contact with surface which can be related to the penetration of an inhibitor layer and the withdraw curve shows a negative force when the tip is removed from the surface which can be related to the adhesion of an inhibitor to the surface. In their research, ex situ AFM analysis was conducted of N80 steel specimen after immersion in the inhibited solution for 30 minutes, then removing and drying in hot air. The average adhesive force measurements for 10 consecutive force distance curves ranged from 4.03 to 8.69 nN for the six inhibitors tested. A correlation made between the force spectroscopy and inhibition efficiency found that the inhibitors with the highest inhibition efficiency had an adhesion force of 4.5 to 5.0 nN under an inhibitor dosage of 50 ppm.
2
©2017 by NACE International.Requests for permission to publish this manuscript in any form, in part or in whole, must be in writing toNACE International, Publications Division, 15835 Park Ten Place, Houston, Texas 77084.The material presented and the views expressed in this paper are solely those of the author(s) and are not necessarily endorsed by the Association.

The research presented in this paper provides a further advance for the research on this topic –AFM corrosion studies by in situ coupling electrochemical (EC) methods with atomic force spectroscopy (AFM). Both methods have simultaneously been applied to study the adsorption of 1-(2-aminoethyl)-2-oleyl-2-imidazolinium chloride corrosion inhibitor on carbon steel at 25°C and 1 bar pCO2. The emphasis was to correlate the electrochemical and AFM measurements for a better understanding of the inhibition mechanism by imidazolinium chloride adsorbed on steel under an aqueous CO2 environment.
EXPERIMENTAL PROCEDURE
Materials and Chemicals
Steel samples used for electrochemical measurements were made of API 5L X65 carbon steel with a
uniform, fine structure microstructure composed of pearlite in a ferrite matrix. The chemical
composition of the carbon steel is provided in Table 1. The steel specimen started as a 0.5” x 0.5” x
0.080” (1.27 cm x 1.27 cm x 0.2 cm) square, but had the corners removed to create the octagonal
shape with a 0.2 sq.in. (1.29 cm2) surface area. Sodium chloride (NaCl) was dissolved in deionized
water that was saturated with 1 bar CO2. The molecular structure of corrosion inhibitor 1-(2-
aminoethyl)-2-oleyl-2-imidazolinium chloride is shown in Figure 1 .
Table 1
Composition (wt.%) of API† 5L X65 carbon steel
Element C Nb Mn P S Ti V Ni Fe
X65 0.05 0.03 1.51 0.004 <0.001 0.01 0.04 0.04 balance
Figure 1. Molecular structure of 1-(2-aminoethyl)-2-oleyl-2-imidazolinium chloride
†
American Petroleum Institute (API), 1220 L St. NW, Washington, DC 20005.
NHN
+
NH2
CH3
3
©2017 by NACE International.Requests for permission to publish this manuscript in any form, in part or in whole, must be in writing toNACE International, Publications Division, 15835 Park Ten Place, Houston, Texas 77084.The material presented and the views expressed in this paper are solely those of the author(s) and are not necessarily endorsed by the Association.
Electrochemical measurements
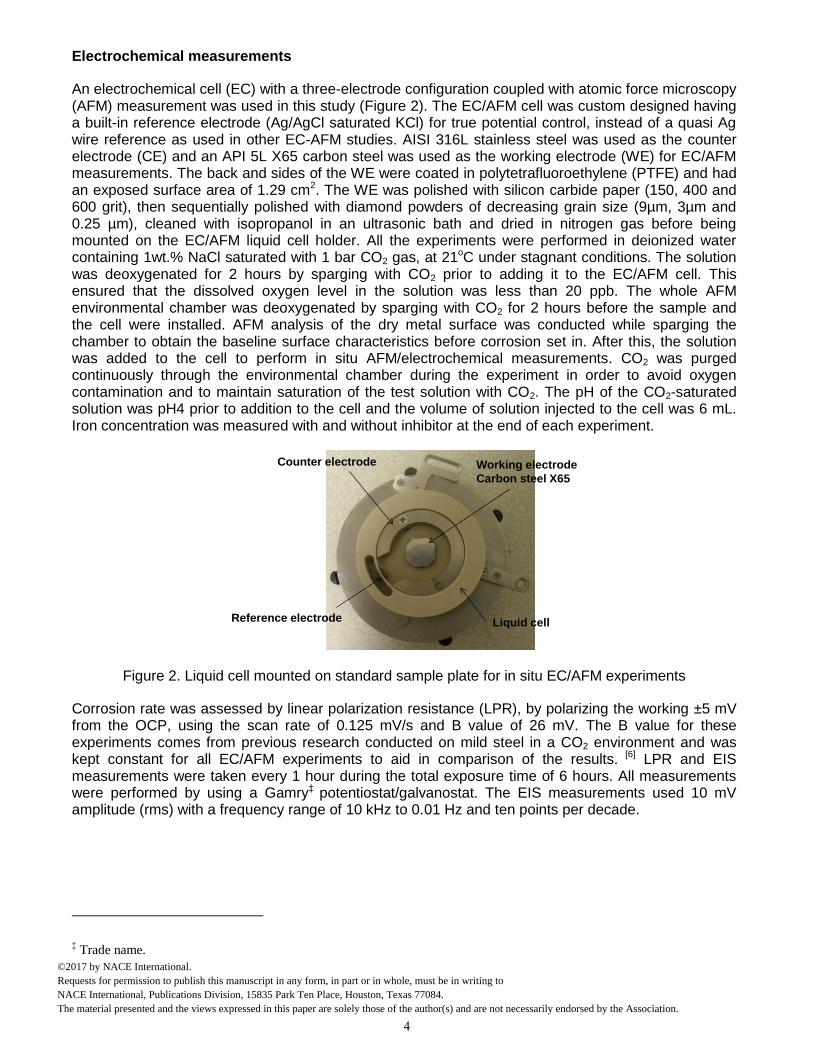
An electrochemical cell (EC) with a three-electrode configuration coupled with atomic force microscopy (AFM) measurement was used in this study (Figure 2). The EC/AFM cell was custom designed having a built-in reference electrode (Ag/AgCl saturated KCl) for true potential control, instead of a quasi Ag wire reference as used in other EC-AFM studies. AISI 316L stainless steel was used as the counter electrode (CE) and an API 5L X65 carbon steel was used as the working electrode (WE) for EC/AFM measurements. The back and sides of the WE were coated in polytetrafluoroethylene (PTFE) and had an exposed surface area of 1.29 cm2. The WE was polished with silicon carbide paper (150, 400 and 600 grit), then sequentially polished with diamond powders of decreasing grain size (9µm, 3µm and 0.25 µm), cleaned with isopropanol in an ultrasonic bath and dried in nitrogen gas before being mounted on the EC/AFM liquid cell holder. All the experiments were performed in deionized water containing 1wt.% NaCl saturated with 1 bar CO2 gas, at 21oC under stagnant conditions. The solution was deoxygenated for 2 hours by sparging with CO2 prior to adding it to the EC/AFM cell. This ensured that the dissolved oxygen level in the solution was less than 20 ppb. The whole AFM environmental chamber was deoxygenated by sparging with CO2 for 2 hours before the sample and the cell were installed. AFM analysis of the dry metal surface was conducted while sparging the chamber to obtain the baseline surface characteristics before corrosion set in. After this, the solution was added to the cell to perform in situ AFM/electrochemical measurements. CO2 was purged continuously through the environmental chamber during the experiment in order to avoid oxygen contamination and to maintain saturation of the test solution with CO2. The pH of the CO2-saturated solution was pH4 prior to addition to the cell and the volume of solution injected to the cell was 6 mL. Iron concentration was measured with and without inhibitor at the end of each experiment.
Figure 2. Liquid cell mounted on standard sample plate for in situ EC/AFM experiments
Corrosion rate was assessed by linear polarization resistance (LPR), by polarizing the working ±5 mV from the OCP, using the scan rate of 0.125 mV/s and B value of 26 mV. The B value for these experiments comes from previous research conducted on mild steel in a CO2 environment and was kept constant for all EC/AFM experiments to aid in comparison of the results. [6] LPR and EIS measurements were taken every 1 hour during the total exposure time of 6 hours. All measurements were performed by using a Gamry‡ potentiostat/galvanostat. The EIS measurements used 10 mV amplitude (rms) with a frequency range of 10 kHz to 0.01 Hz and ten points per decade.
‡ Trade name.
Counter electrode
Reference electrode
Working electrode
Carbon steel X65
Liquid cell
4
©2017 by NACE International.Requests for permission to publish this manuscript in any form, in part or in whole, must be in writing toNACE International, Publications Division, 15835 Park Ten Place, Houston, Texas 77084.The material presented and the views expressed in this paper are solely those of the author(s) and are not necessarily endorsed by the Association.

In Situ AFM Analysis
In-situ AFM measurements were performed by using the commercial Keysight§ 5500 Scanning Probe Microscope system held in a vibration isolation stage (Figure 3). An n-type silicon probe was used (kn~0.3N/m, MikroMasch**) and operated in soft contact mode. In soft contact mode, the tip is scanned over the substrate with an imaging force below the force required for disrupting the adsorbed inhibitor film. The freshly polished steel surface was scanned by AFM to assess the bare surface before contact with test solution; after that the AFM scanning and force measurements were carried out in the solution with and without inhibitor. All AFM analyses were repeated and almost identical results were obtained. Anaerobic environment was ensured by assembling the AFM instrument inside the environmental chamber (Figure 3). The AFM topography and deflection images (5 µm x 5µm) were recorded at 512 × 512 pixels resolution. The sequence of representative AFM images recorded for a period of 6 h is shown for all the experiments. The test duration of 6 h corresponds to the time sufficient to obtain a stable inhibitor layer structure at the surface which remained unchanged thereafter. [4], In-situ AFM measurements were performed at the same time as the electrochemical experiments.
Figure 3. Experimental arrangement of in situ EC/AFM setup.
RESULTS AND DISCUSSION
In situ AFM results
Figure 4 and Figure 5 show the 3D topography images and surface profiles of untreated carbon steel X65 before and after contacting the solution. Before immersion, the roughness of the surface shown from the profile curve was ~ 20 nm. The surface morphology and profile measurements on carbon
§ Trade name.
** Trade name.
Environmental
chamber
Gas inlet to
chamber
Gas outlet
Connection to
potentiostat
Scanner
5
©2017 by NACE International.Requests for permission to publish this manuscript in any form, in part or in whole, must be in writing toNACE International, Publications Division, 15835 Park Ten Place, Houston, Texas 77084.The material presented and the views expressed in this paper are solely those of the author(s) and are not necessarily endorsed by the Association.

steel surface were used as “blank” values for analyzing the adsorption of inhibitor molecules. After immersion in an uninhibited aqueous solution, the steel surface shows a rough texture indicating metal dissolution due to corrosion. The maximum roughness of the surface indicated by the surface profile curve after 6h immersion was 300 nm. The time-dependent topography and corresponding profile change of the steel surface immersed in the aqueous solution with 100 ppmv imidazolinium are presented in Figure 6 and Figure 7. After 6 h immersion in the inhibited solution, the steel surface shows only some minor roughening indicating minimal metal dissolution due to protection of the surface by the inhibitor. The maximum roughness of the surface indicated by the profilometry after 6 h immersion was 50 nm. It is evident from comparison with Figure 4 and Figure 5 that the corroded surface is quite different when comparing the unprotected to the protected surface. The difference can be ascribed to imidazolinium chloride in the test solution spontaneously forming film at the steel surface.
Figure 4. In situ AFM topography of carbon steel X65 in CO2-Saturated uninhibited NaCl
solution. Sequence shows (a) untreated bare steel before immersion and after immersion for (b) 10 min, (c) 1 h, and (d) 6 h.
(a)
(c)
(b)
(d)
6
©2017 by NACE International.Requests for permission to publish this manuscript in any form, in part or in whole, must be in writing toNACE International, Publications Division, 15835 Park Ten Place, Houston, Texas 77084.The material presented and the views expressed in this paper are solely those of the author(s) and are not necessarily endorsed by the Association.
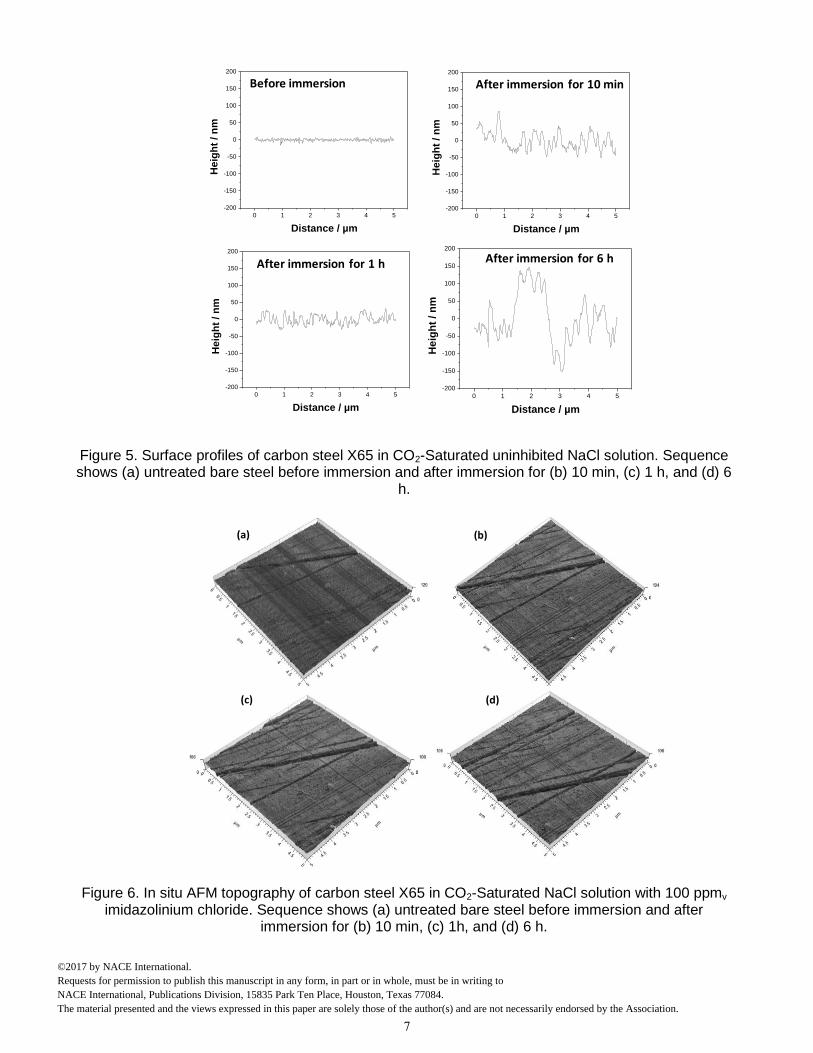
Figure 5. Surface profiles of carbon steel X65 in CO2-Saturated uninhibited NaCl solution. Sequence shows (a) untreated bare steel before immersion and after immersion for (b) 10 min, (c) 1 h, and (d) 6
h.
Figure 6. In situ AFM topography of carbon steel X65 in CO2-Saturated NaCl solution with 100 ppmv
imidazolinium chloride. Sequence shows (a) untreated bare steel before immersion and after immersion for (b) 10 min, (c) 1h, and (d) 6 h.
0 1 2 3 4 5
-200
-150
-100
-50
0
50
100
150
200
He
igh
t /
nm
Distance / µm
Before immersion
0 1 2 3 4 5
-200
-150
-100
-50
0
50
100
150
200
He
igh
t / n
m
Distance / µm
After immersion for 10 min
0 1 2 3 4 5
-200
-150
-100
-50
0
50
100
150
200
He
igh
t / n
m
Distance / µm
After immersion for 1 h
0 1 2 3 4 5
-200
-150
-100
-50
0
50
100
150
200
He
igh
t /
nm
Distance / µm
After immersion for 6 h
(d)
(b)(a)
(c)
7
©2017 by NACE International.Requests for permission to publish this manuscript in any form, in part or in whole, must be in writing toNACE International, Publications Division, 15835 Park Ten Place, Houston, Texas 77084.The material presented and the views expressed in this paper are solely those of the author(s) and are not necessarily endorsed by the Association.

Figure 7. Surface profile of carbon steel X65 in CO2-Saturated NaCl solution with 100 ppmv
imidazolinium chloride. Sequence shows (a) untreated bare steel before immersion and after immersion for (b) 10 min, (c) 1h, and (d) 6 h.
Besides surface morphology, AFM is able to quantitatively measure interactions between the AFM tip and inhibitor molecules [7, 8]. The penetration forces shown in this study were obtained from force-distance curves which recorded the interaction during the tip approaching process. Figure 8 shows the force-distance curve on carbon steel in NaCl solution in the presence and the absence of imidazolinium chloride. On the steel surface exposed to uninhibited solution after 6 h of immersion, which is free of adsorbed inhibitor molecules, the force between the tip and surface was zero when the distance was larger than 5 nm, indicating that there was no interaction of the AFM tip and the surface. When the distance of the tip was approximately 2 nm, the tip was attracted to the surface due to short-range attractive forces. At this point, the tip came in contact with the surface, and the interaction between the tip and surface becomes repulsive. Further attempt of downward movement of the AFM tip pushes it against the steel surface and the force increases dramatically, because the tip is not able to penetrate the hard surface. This force curve is used as a “blank” for further study in the presence of the inhibitor.
The presence of adsorbed inhibitor film produces long range repulsive intermolecular force pushing
against the AFM tip. As the tip approaches the sample, the cantilever experiences a repulsive force
starting at a separation of 12 nm. This repulsive force grows in magnitude until it peaks and the the
cantilever irreversibly “jumps” to the sample surface. In the case of the film formed after 6 h immersion,
the repulsive force reaches a maximum at about 0.5 nN before the tip penetrates the inhibitor film as
shown in
Figure 8. Further movement of the AFM tip towards the surface causes the force to increase as the tip
is pressed against the steel surface. The maximum force before the tip penetrated the film is the
Before immersion After immersion for 10 min
After immersion for 1 h After immersion for 6 h
0 1 2 3 4 5
-200
-150
-100
-50
0
50
100
150
200
He
igh
t / n
m
Distance / µm
0 1 2 3 4 5
-200
-150
-100
-50
0
50
100
150
200
He
igh
t / n
m
Distance / µm
0 1 2 3 4 5
-200
-150
-100
-50
0
50
100
150
200
He
igh
t / n
m
Distance / µm
0 1 2 3 4 5
-200
-150
-100
-50
0
50
100
150
200
He
igh
t / n
m
Distance / µm
8
©2017 by NACE International.Requests for permission to publish this manuscript in any form, in part or in whole, must be in writing toNACE International, Publications Division, 15835 Park Ten Place, Houston, Texas 77084.The material presented and the views expressed in this paper are solely those of the author(s) and are not necessarily endorsed by the Association.

threshold value for penetrating the inhibitor layer, and in this research it is called the “penetration
force”. It is worth emphasizing that the force-distance curve is not an accurate way to measure the film
thickness, because of the following reasons:
1. The tip-to-inhibitor interaction happens before the tip is in contact with the inhibitor film due to van der Waal type forces,
2. The inhibitor molecules can also adsorb on the tip surface and increase the apparent tip-to-sample distance, and
3. The measured distance in a force-distance curve includes the bending of the AFM cantilever when the repulsive tip-to-inhibitor interaction occurs.
All these facts make the force-distance curve show an overestimation of the film thickness; it may be said that it can provide an indication of film thickness only within an order of magnitude (e.g. nm).
Figure 8. Force spectroscopy on carbon steel X65 in presence and absence of inhibitor (kn =
0.3 N/m) after 6 h of immersion
In situ electrochemical results
The electrochemical measurements at carbon steel surfaces were conducted to determine if a correlation exists between corrosion measurements and AFM analysis of steel with and without inhibitor and understand the mechanism of adsorption of inhibitor. The electrochemical tests were run at the same time as the in situ AFM analysis.
LPR corrosion rate
The working electrode was monitored at open-circuit conditions for 1 hour pre-corrosion before the first LPR curves were recorded. The evolution of the corrosion rates (CR) and the open circuit potential (OCP) measurements with time for X65 carbon steel, exposed to a 1 wt.% NaCl aqueous solution saturated with CO2 at 20oC in the absence and in the presence of imidazolinium chloride, are shown in Figure 9. In the absence of inhibitor, corrosion rate (CR) was 0.95 mm y-1 and OCP was -0.67 V vs. Ag/AgCl. In the presence of imidazolinium chloride, the final CR decreased to 0.03 mm y-1. The OCP after adding imidazolinium chloride became more positive. Such an effect is due to the reduction in both anodic and cathodic reactions at the steel surface (caused by adsorption of the inhibitor).
0 5 10 15 20 25 30 35 40 45 50
0.0
0.5
1.0
1.5
2.0
2.5
3.0
3.5
4.0
4.5
5.0
Distance / nm
Fo
rce / n
N
0 ppm
100 ppm
9
©2017 by NACE International.Requests for permission to publish this manuscript in any form, in part or in whole, must be in writing toNACE International, Publications Division, 15835 Park Ten Place, Houston, Texas 77084.The material presented and the views expressed in this paper are solely those of the author(s) and are not necessarily endorsed by the Association.

Figure 9. Corrosion rate (a) and open circuit potential (b) of carbon steel immersed in 1% wt. NaCl solution in presence and absence of inhibitor at 20oC as a function of time.
EIS study on the corrosion of carbon steel in CO2-Saturated NaCl solution
The LPR measurements were complemented with electrochemical impedance spectroscopy (EIS). The impedance diagrams plotted at the corrosion potential Ecor without and with 100 ppm imidazolinium chloride are presented in Figure 10 and Figure 11, after 6h of immersion in 1% wt. NaCl solution. In absence of inhibitor and at the Ecor, the diagram exhibit one high frequency (HF) capacitive and low frequency (LF) inductive loop. In the presence of inhibitor, the inductive loop had disappeared and the size of the HF loop has increased. The inhibitor increased the low frequency limit of the impedance loop (polarization resistance) by approximately a factor of fifteen. This result also confirms that imidazolinium chloride is effective in an CO2 aqueous environment. The results obtained from the LPR measurements are in accordance with the results obtained from the EIS.
Figure 10. Nyquist diagram of carbon steel immersed in 1% NaCl solution after 6 h in presence and absence of inhibitor at 20oC.
0 1 2 3 4 5 6 7
0.0
0.5
1.0
1.5
2.0
CR (0 ppm)
CR (100 ppm)
Co
rro
sio
n r
ate
/ m
m y
-1
t / h
0 1 2 3 4 5 6
-0.68
-0.66
-0.64
-0.62
-0.60
-0.58
-0.56 OCP (0 ppm)
OCP (100 ppm)
OC
P/ V
vs. A
g/A
gC
l sat
t / h
(a) (b)
0 1 2 3 4 5 6 7 8 9
0
1
2
3
4
5
6
0.0 0.2 0.4 0.6
0.0
0.1
0.2
0.3
0.03 Hz
100 Hz
100 Hz
0.1 Hz
Z' / K cm2
- Z
'' / K
cm
2
10 kHz
1 Hz
0 ppm
100 ppm
0.03 Hz
Z' / K cm2
- Z
'' /
K
cm
2
0.1 Hz
0 ppm
100 ppm
10
©2017 by NACE International.Requests for permission to publish this manuscript in any form, in part or in whole, must be in writing toNACE International, Publications Division, 15835 Park Ten Place, Houston, Texas 77084.The material presented and the views expressed in this paper are solely those of the author(s) and are not necessarily endorsed by the Association.
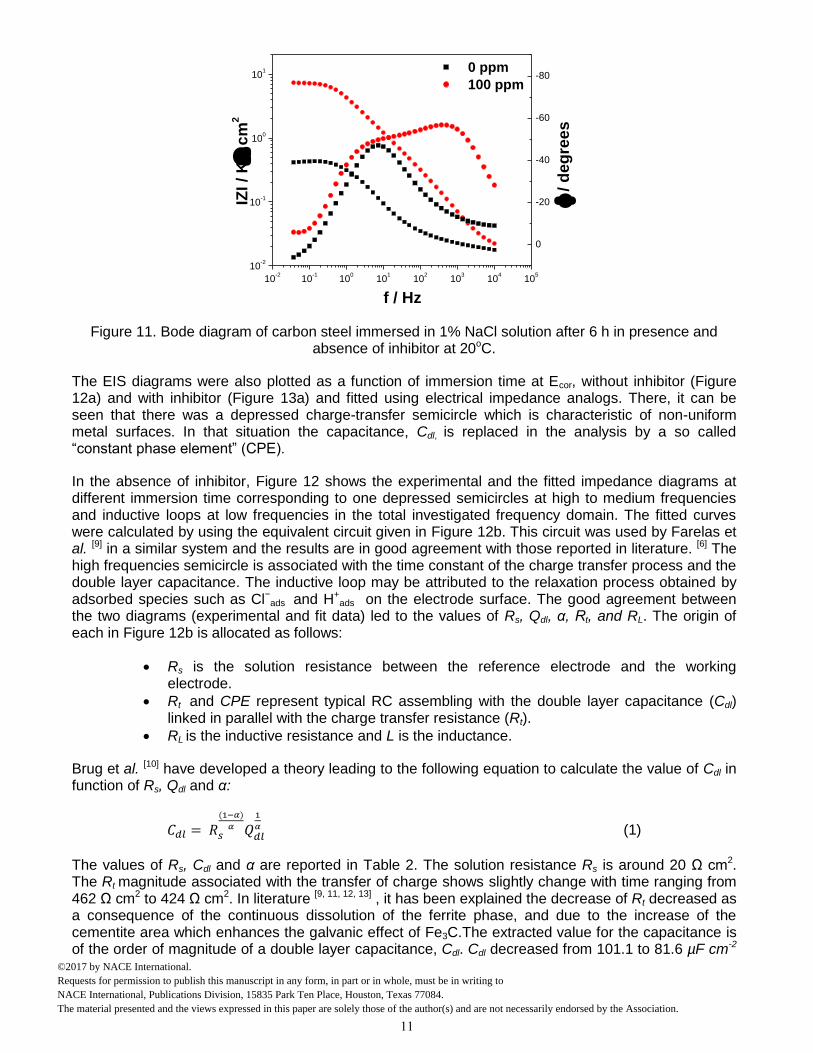
Figure 11. Bode diagram of carbon steel immersed in 1% NaCl solution after 6 h in presence and absence of inhibitor at 20oC.
The EIS diagrams were also plotted as a function of immersion time at Ecor, without inhibitor (Figure 12a) and with inhibitor (Figure 13a) and fitted using electrical impedance analogs. There, it can be seen that there was a depressed charge-transfer semicircle which is characteristic of non-uniform metal surfaces. In that situation the capacitance, Cdl, is replaced in the analysis by a so called “constant phase element” (CPE).
In the absence of inhibitor, Figure 12 shows the experimental and the fitted impedance diagrams at different immersion time corresponding to one depressed semicircles at high to medium frequencies and inductive loops at low frequencies in the total investigated frequency domain. The fitted curves were calculated by using the equivalent circuit given in Figure 12b. This circuit was used by Farelas et al. [9] in a similar system and the results are in good agreement with those reported in literature. [6] The high frequencies semicircle is associated with the time constant of the charge transfer process and the double layer capacitance. The inductive loop may be attributed to the relaxation process obtained by adsorbed species such as Cl−ads
and H+ads on the electrode surface. The good agreement between
the two diagrams (experimental and fit data) led to the values of Rs, Qdl, α, Rt, and RL. The origin of each in Figure 12b is allocated as follows:
Rs is the solution resistance between the reference electrode and the working electrode.
Rt and CPE represent typical RC assembling with the double layer capacitance (Cdl) linked in parallel with the charge transfer resistance (Rt).
RL is the inductive resistance and L is the inductance.
Brug et al. [10] have developed a theory leading to the following equation to calculate the value of Cdl in function of Rs, Qdl and α:
𝐶𝑑𝑙 = 𝑅𝑠
(1−𝛼)
𝛼 𝑄𝑑𝑙
1
𝛼 (1)
The values of Rs, Cdl and α are reported in Table 2. The solution resistance Rs is around 20 Ω cm2. The Rt magnitude associated with the transfer of charge shows slightly change with time ranging from 462 Ω cm2 to 424 Ω cm2. In literature [9, 11, 12, 13] , it has been explained the decrease of Rt decreased as a consequence of the continuous dissolution of the ferrite phase, and due to the increase of the cementite area which enhances the galvanic effect of Fe3C.The extracted value for the capacitance is of the order of magnitude of a double layer capacitance, Cdl. Cdl decreased from 101.1 to 81.6 µF cm-2
10-2
10-1
100
101
102
103
104
105
10-2
10-1
100
101
f / Hz
0 ppm
100 ppm
IZI / K
cm
2
/ d
eg
rees
0
-20
-40
-60
-80
11
©2017 by NACE International.Requests for permission to publish this manuscript in any form, in part or in whole, must be in writing toNACE International, Publications Division, 15835 Park Ten Place, Houston, Texas 77084.The material presented and the views expressed in this paper are solely those of the author(s) and are not necessarily endorsed by the Association.

due to the physical–electrical properties of the corrosion products. Cdl is directly proportional to the active area.
Figure 12. Experimental ( ) and fitted data (--) of carbon steel immersed in 1% wt. NaCl solution in absence of inhibitor at 20oC (a) and (b) equivalent circuit used for the regression calculation.
Table 2
Values of Rs, Cdl and α as function of immersion time at Ecor without inhibitor
Time (h) Rs(Ω cm2) Cdl (µF cm-2) Rt (Ω cm2) α
1 2 3 4 5 6
20.7 21.1 21.0 21.0 20.6 20.5
101.8 96.5 79.8 82.0 82.4 81.6
462.9 472.2 466.2 464.5 478.8 424.2
0.80 0.80 0.78 0.78 0.77 0.78
In the presence of the inhibitor (Figure 13a), the low frequency response and its evolution with immersion time are different, compared to uninhibited solution. The inductive loop in LF range disappears. This result indicates that the inhibitor clearly influenced the electrochemical processes at Ecor. The AFM analysis has shown that there was no significant change in the surface topography of steel surface with the time (Figure 6). This can be attributed to imidazolinium chloride forming a uniform surface layer at carbon steel soon after coming in contact with the inhibited test solution. Therefore, the impedance diagram obtained at each time was fitted to the electrical equivalent circuit presented in Figure 13b. The Rt increases with immersion time. This indicates inhibitor adsorption at steel resists the transport of ions between the steel surface and the soultion, thus lowering the corrosion rate. Furthermore, α is slightly smaller with than without inhibitor, this result suggests that the presence of inhibitor increases the surface heterogeneities. [14] The double layer capacitance (Cdl) decreases with immersion time, and then remains at about 1.1 µF cm-2 throughout the rest of the
0.0 0.1 0.2 0.3 0.4 0.5
0.0
0.1
0.2
(a)
0.03 Hz
Z' / K cm2
- Z
'' / K
cm
2
10 kHz
1 Hz
t = 1 h
t = 3 h
t = 6 h
Rs
Rt
CPE
RLL
(b)
12
©2017 by NACE International.Requests for permission to publish this manuscript in any form, in part or in whole, must be in writing toNACE International, Publications Division, 15835 Park Ten Place, Houston, Texas 77084.The material presented and the views expressed in this paper are solely those of the author(s) and are not necessarily endorsed by the Association.

measurement. The resistance of the inhibitor film ‘Rf’ increases with immersion time. The same behavior was reported in literature [15]. It can be seen that the film capacitance Cf increases with the time of immersion to reach 13.3 µF.cm-2. If the planar condenser model is assumed, then one can relate the capacitance C and the film thickness d by Equation (2). [16]
𝐶𝑓 =𝜀𝜀0
𝑑 (2)
where ɛ0 is the permittivity of the vacuum (9 x 10-14 F cm-1), ɛ is the dielectric constant of inhibitor and d is the thickness of the inhibitor film. It was found that the dielectric constant of five 1-alkyl-3-methylimidazolium salts at 298.15 K falls between 15.2 and 8.8, and it decreases with increasing chain length of the alkyl residue of the cation [17]. If we assume that ɛ = 8.8 and Cf = 13.3 µF.cm-2 * 1.26 cm2 = 16.8 µF, then the calculated thickness of the inhibitor layer from Equation (2) would be 37.7 cm. It would be impossible to form a thickness of inhibitor film in this magnitude; therefore, the dielectric property used for the inhibitor film was wrong. It was reported in literature [18], that an inhibitor film of thiol which has a capacitance of 4 µF does not have a properly defined dielectric property.
Figure 13. Experimental ( ) and fitted data ( ̶ ) of carbon steel immersed in 1% wt. NaCl solution in presence of inhibitor at 20oC (a) and (b) equivalent circuit used for the regression calculation.
Table 3
Values of Rs, Cdl, Rf, Cf and α as function of immersion time at Ecor with inhibitor
Time (h)
Rs
(Ω cm2) Cdl
(µF cm-2) Rt
(Ω cm2) α Rf
(Ω cm2) Cf
(µF cm-2)
1 2 3 4 5 6
19.0 19.9 21.3 18.1 15.7 14.8
14.8 11.8 7.6 1.8 1.1 1.1
1908.3 2988.7 4430.3 6134.9 7629.3 8536.5
0.75 0.77 0.77 0.69 0.68 0.69
6.8 17.3 46.9 46.4 62 82
5.1 4.4 4.6 7.8 11.8 13.3
13
©2017 by NACE International.Requests for permission to publish this manuscript in any form, in part or in whole, must be in writing toNACE International, Publications Division, 15835 Park Ten Place, Houston, Texas 77084.The material presented and the views expressed in this paper are solely those of the author(s) and are not necessarily endorsed by the Association.

CONCLUSIONS
Based on the results of the experiments and data presented herein, the following conclusions were made: The adsorption of corrosion inhibitor imidazolinium chloride at the carbon steel surface has been confirmed by in situ atomic force spectroscopy measurements coupled with electrochemical experiments. In-situ electrochemical/AFM measurements confirmed the formation of inhibitor film on carbon steel surface immersed in CO2-saturated aqueous solution, resulting in a decrease in corrosion rates as determined by electrochemical measurements. The low frequency response of the impedance diagrams plotted at the corrosion potential and its evolution with time of immersion are different with and without inhibitor, which shows that the inhibitor clearly influenced the electrochemical process at the steel surface. The inhibitor decreases the capacitance of the double layer; the obtained results showed that the inhibitor film does not have a properly defined dielectric property.
ACKNOWLEDGMENTS
The authors would like to thank Mr. Al Schubert and Mr. Cody Shafer for their contribution to this work. Also, the technical support from the lab’s staff at Institute for corrosion and multiphase technology by Mr. Alexi Barxias and Mr. Phil Bullington is highly appreciated. The authors are grateful to Dr. Alain Pailleret of the “Laboratoire Interfaces et Systèmes Electrochimiques– Pierre and Marie Curie University, France” for his help.
BIBLIOGRAPHY
[1] B. Kinsella and T. Becker., "The Use of Atomic Force Microscopy in Corrosion Research,"
Corrosion and Materials, vol. 34, no. 4, pp. 31-39, 2009.
[2] I. Jevremović, M.Singer, S. Nešić and V. Mišković-Stanković, " Inhibition properties of self-
assembled corrosion inhibitor talloil diethylenetriamine imidazoline for mild steel corrosion in
chloride solution saturated with carbon dioxide," Corrosion Science, vol. 77, pp. 265-272, 2013.
[3] V. Pandarinathan, K. Lepková, S. Bailey, T. Becker and R. Gubner, "Adsorption of Corrosion
Inhibitor 1-Dodecylpyridinium Chloride on Carbon Steel Studied by in Situ AFM and
Electrochemical Methods," Industrial & Engineering Chemistry Research, vol. 53, no. 14, pp.
5858-5865, 2014.
[4] Y. Xiong, B. Brown, B. Kinsella and A. P. S. Nešić, "Atomic Force Microscopy Study of the
Adsorption of Surfactant Corrosion Inhibitor Films," Corrosion, vol. 70, no. 3, pp. 247-260, 2014.
[5] J. Zhao, F. Gu, T. Zhao and R. Jiang, Research on Chemical Intermediates, vol. 42, no. 6, pp.
5753-5764, 2016.
[6] Z. Belarbi, F. Farelas, M. Singer and S. Nesic, "Role of amines in the mitigation of CO2 Top of the
Line Corrosion," Corrosion, vol. 72, no. 10, pp. 1300-1310, 2016.
[7] A. L. Weisenhorn, P. K. Hansma, T. R. Albrecht and C. F. Quate, "Forces in atomic force
microscopy in air and water," Applied Physics Letters, vol. 54, no. 26, pp. 2651-2653, 1989.
[8] Y. H. Liu, D. F. Evans, Q. Song and D. W. Grainger, "Structure and frictional properties of self-
14
©2017 by NACE International.Requests for permission to publish this manuscript in any form, in part or in whole, must be in writing toNACE International, Publications Division, 15835 Park Ten Place, Houston, Texas 77084.The material presented and the views expressed in this paper are solely those of the author(s) and are not necessarily endorsed by the Association.

assembled surfactant monolayers," Langmuir , vol. 12, no. 5, pp. 1235-1244, 1996.
[9] F. Farelas, M. Galicia, B. Brown, S. Nesic and H. Castaneda, "Evolution of dissolution processes
at the interface of carbon steel corroding in a CO2 environment studied by EIS," Corrosion
Science, vol. 52, pp. 509-517, (2010.
[10] G. J. Brug, A. G. V. D. Eeden, M. Sluyters-Rehbach and J. H. Sluyters, "The analysis of electrode
impedances complicated by the presence of a constant phase element," Journal of
Electroanalytical Chemistry, vol. 176, pp. 275-295, 1984.
[11] D. Staicopolus, " The role of cementite in the acidic corrosion of steel," Journal of Electrochemical
Society, vol. 110, no. 11, pp. 1121-1124, 1963.
[12] K. Videm, J. Kvarekvaal, T. Pérez and G. Fitzsimons, "Surface Effects on the electrochemistry of
iron and carbon steels electrodes in aqueous CO2 solution," in CORROSION/96, paper No.1,
NACE,, Houston, TX, 1996.
[13] S. Al-Hassan, B. Mishra, D. Olson and M. Salama, "Effet of microsctructure on corrosion of steels
in aqueous solutions containing carbon dioxide," Corrosion, vol. 54, no. 6, pp. 480-491, 1998.
[14] I. Frateur, L. L. Rojas, C. Methivier, A. Galtayries and P. Marcus, "Influence of bovine serum
albumin in sulferic acid aqueous solution on the corroion and passivation od an iron-chromium
alloy," Electrochemica Acta, vol. 51, pp. 1550-1557, 2006.
[15] H. O. Curkovic, E. S.-L. and H. Takenouti, "Electrochemical quartz crystal microbalance and
electrochemical impedance spectroscopy study of copper corrosion inhbtion by imidazole,"
Corrosion Science, vol. 51, pp. 4342-2348, 2009.
[16] K. Marusˇic´, H. O. C´urkovic´ and H. Takenouti, "Inhibiting effect of 4-methyl-1-p-tolylimidazole to
the corrosion of bronze patinated in sulfate medium," electrochemica Acta, vol. 56, pp. 7491-7502,
2011.
[17] C. Wakai, A. Oleinikova, M. Ott and H. Weingartner, "How polar are ionic liquids? Determination of
the static dielectric constant of an imidazolium-based ionic liquid by microwave dielectric
spectroscopy," The Journal of Physical Chemistry B Letters, vol. 109, pp. 17028-17030, 2005.
[18] M. Evesque, M. Keddam and H. Takenouti, "The formation of self-assembling membrane of
hexadecane-thiol on silver to prevent the tarnishing," Electrochemica Acta, vol. 49, pp. 2937-2943,
2004.
15
©2017 by NACE International.Requests for permission to publish this manuscript in any form, in part or in whole, must be in writing toNACE International, Publications Division, 15835 Park Ten Place, Houston, Texas 77084.The material presented and the views expressed in this paper are solely those of the author(s) and are not necessarily endorsed by the Association.