Embed Size (px)
Citation preview
Examiner’s use only
Team Leader’s use only
Question Leave Number Blank
1
2
3
4
5
6
7
8
9
10
Total
Surname Initial(s)
Signature
Turn over
Paper Reference
1 3 8 9 1 H Paper Reference(s)
1389/1HEdexcel GCSEStatisticsPaper 1H
Higher TierThursday 22 June 2006 – MorningTime: 2 hours 30 minutes
Materials required for examination Items included with question papersRuler graduated in centimetres and Nilmillimetres, protractor, pen, compass,HB pencil, eraser, electronic calculator.
Instructions to CandidatesIn the boxes above, write your centre number, candidate number, your surname, initials and signature. Check that you have the correct question paper. Answer ALL the questions. Write your answers in the spaces provided in this question paper.You must NOT write on the formulae page or any blank pages. Anything you write on these pages will gain NO credit.If you need more space to complete your answer to any question, use additional answer sheets.
Information for CandidatesThe marks for individual questions and the parts of questions are shown in round brackets: e.g. (2).This question paper has 8 questions in Section A and 8 questions in Section B. The total mark for this paper is 100.There are 32 pages in this question paper. Any blank pages are indicated.
Advice to CandidatesWork steadily through the paper. Do not spend too long on one question.Show all stages in any calculations.If you cannot answer a question, leave it and attempt the next one.Return at the end to those you have left out.
Examiner’s use only
Team Leader’s use only
Question Leave Number Blank
Section A
1
2
3
4
5
6
7
8 Section B
1
2
3
4
5
6
7
8
Total
Surname Initial(s)
Signature
Centre No.
*N22582A0132*Turn over
Candidate No.
This publication may be reproduced only in accordance with Edexcel Limited copyright policy. ©2006 Edexcel Limited.
Printer’s Log. No.
N22582AW850/R1389/57570 6/6/6/4
2
*N22582A0232*
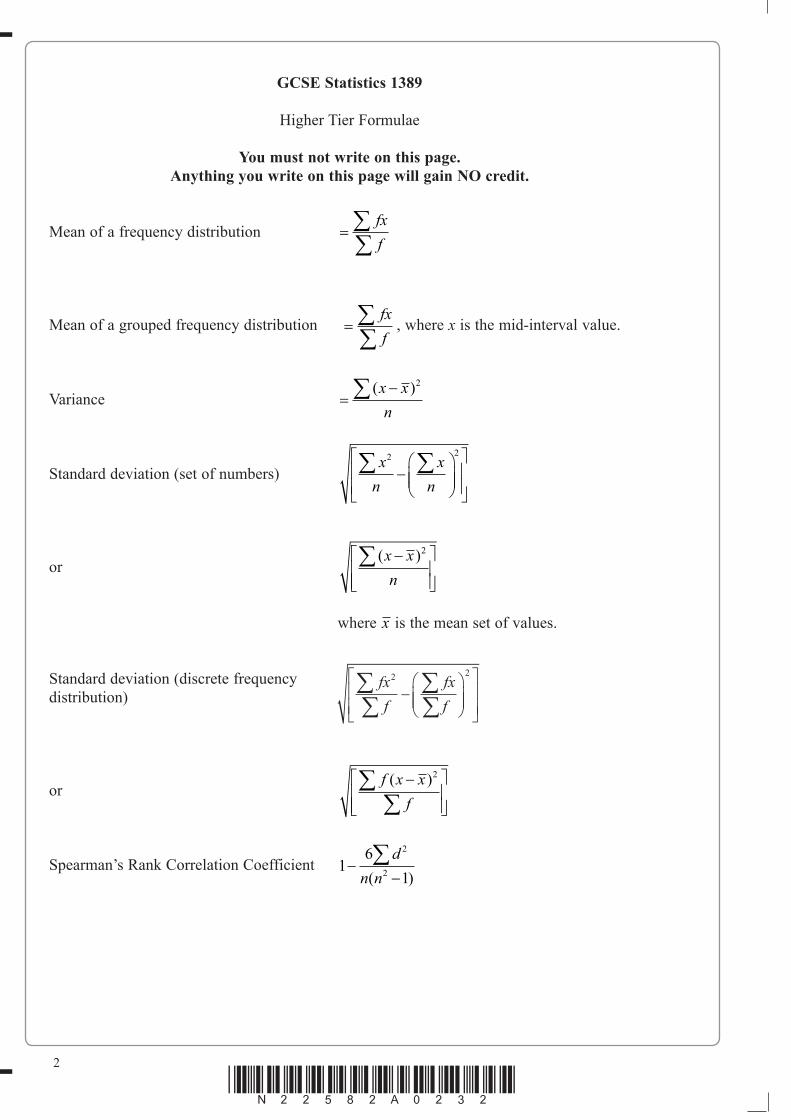
GCSE Statistics 1389
Higher Tier Formulae
You must not write on this page.Anything you write on this page will gain NO credit.
Mean of a frequency distribution = ∑∑
fx
f
Mean of a grouped frequency distribution = ∑∑
fx
f, where x is the mid-interval value.
Variance =−∑ ( )x x
n
2
Standard deviation (set of numbers) x
n
x
n
2 2∑ ∑−
⎛
⎝⎜⎜
⎞
⎠⎟⎟
⎡
⎣⎢⎢
⎤
⎦⎥⎥
or ( )x x
n
−⎡
⎣⎢⎢
⎤
⎦⎥⎥
∑ 2
where x is the mean set of values.
Standard deviation (discrete frequencydistribution)
fxf
fxf
22
∑∑ ∑
∑−⎛
⎝⎜⎜
⎞
⎠⎟⎟
⎡
⎣⎢⎢
⎤
⎦⎥⎥
or f x x
f
( )−⎡
⎣⎢⎢
⎤
⎦⎥⎥
∑∑
2
Spearman’s Rank Correlation Coefficient 16
1
2
2−−
∑d
n n( )

3
Turn over*N22582A0332*
BLANK PAGE
Leave blank
4
*N22582A0432*
SECTION A
Answer ALL the questions. Write your answers in the spaces provided.
You must write down all stages in your working.
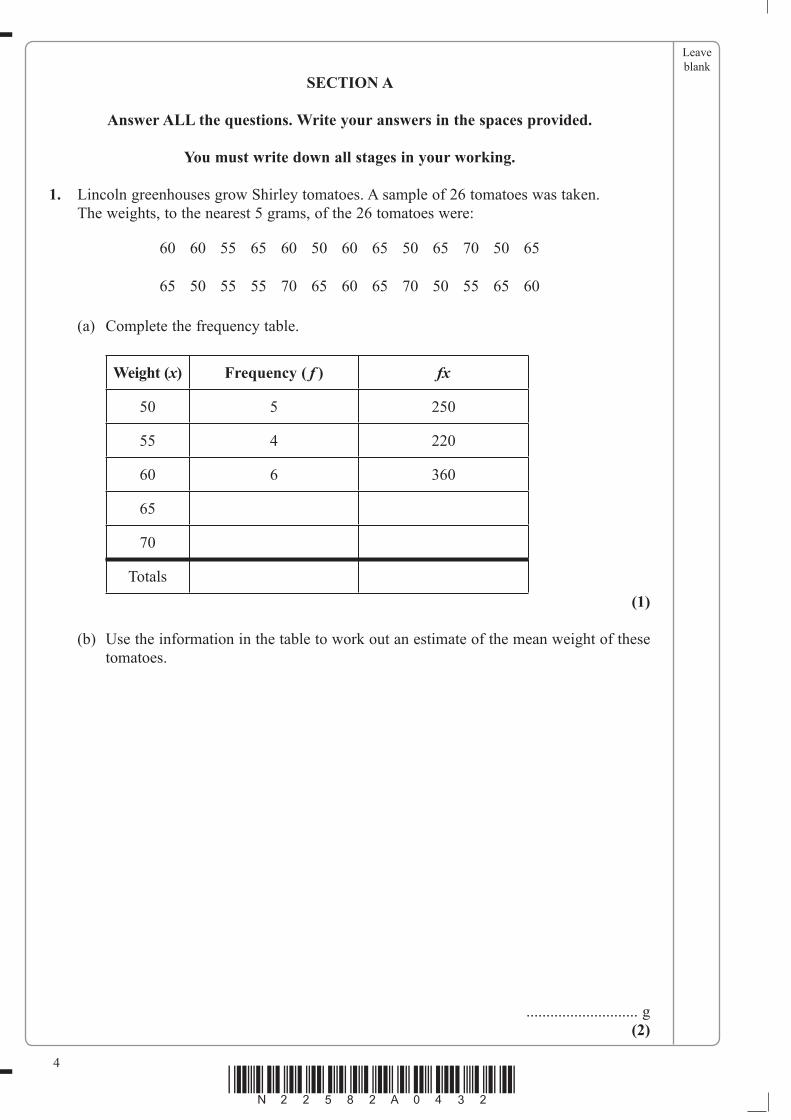
1. Lincoln greenhouses grow Shirley tomatoes. A sample of 26 tomatoes was taken. The weights, to the nearest 5 grams, of the 26 tomatoes were:
60 60 55 65 60 50 60 65 50 65 70 50 65
65 50 55 55 70 65 60 65 70 50 55 65 60
(a) Complete the frequency table.
Weight (x) Frequency ( f ) fx
50 5 250
55 4 220
60 6 360
65
70
Totals(1)
(b) Use the information in the table to work out an estimate of the mean weight of these tomatoes.
............................ g(2)
Leave blank
5
Turn over*N22582A0532*
Supermarkets want each tomato they sell to be about the same weight.
(c) What other statistical information might the supermarkets need before deciding whether or not Shirley tomatoes will meet their requirements?
.......................................................................................................................................
.......................................................................................................................................
.......................................................................................................................................
.......................................................................................................................................
.......................................................................................................................................
.......................................................................................................................................(1) Q1
(Total 4 marks)
Leave blank
6
*N22582A0632*
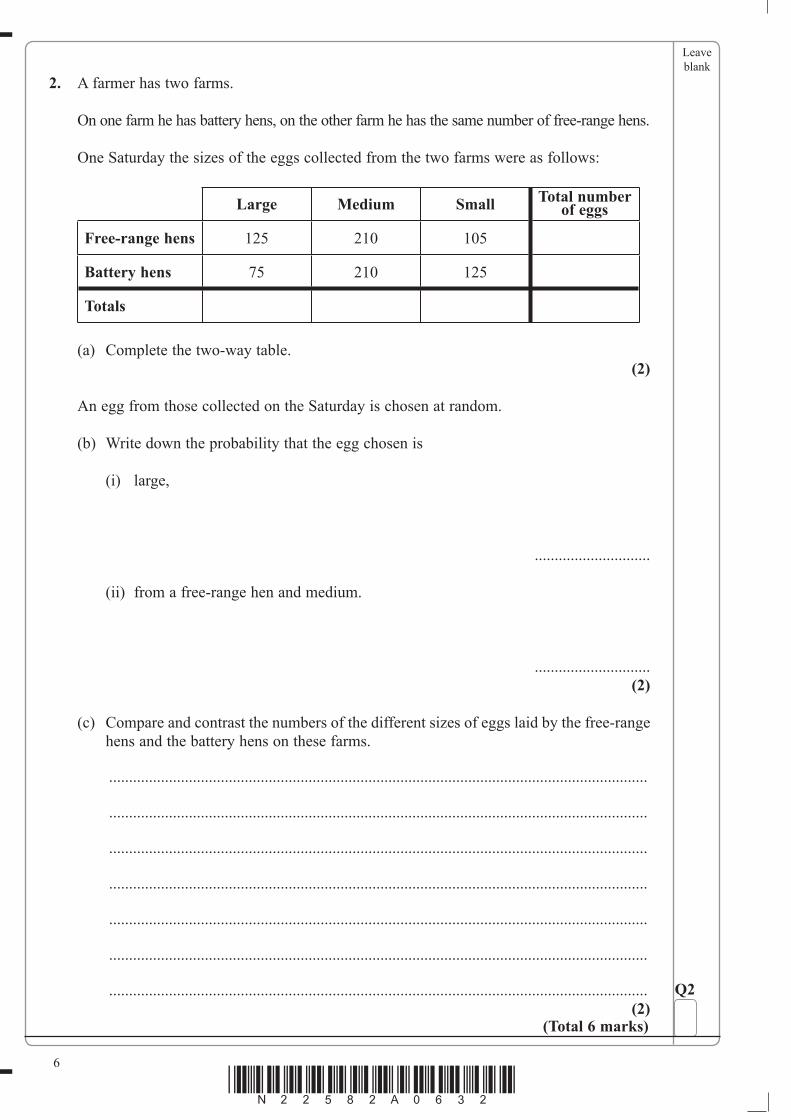
2. A farmer has two farms.
On one farm he has battery hens, on the other farm he has the same number of free-range hens.
One Saturday the sizes of the eggs collected from the two farms were as follows:
Large Medium Small Total number of eggs
Free-range hens 125 210 105
Battery hens 75 210 125
Totals
(a) Complete the two-way table.(2)
An egg from those collected on the Saturday is chosen at random.
(b) Write down the probability that the egg chosen is
(i) large,
.............................
(ii) from a free-range hen and medium.
.............................(2)
(c) Compare and contrast the numbers of the different sizes of eggs laid by the free-range hens and the battery hens on these farms.
.......................................................................................................................................
.......................................................................................................................................
.......................................................................................................................................
.......................................................................................................................................
.......................................................................................................................................
.......................................................................................................................................
.......................................................................................................................................(2)
Q2
(Total 6 marks)
Leave blank
7
Turn over*N22582A0732*
3. John and Matt are playing tennis. The odds against John winning a game are 2 : 1
(a) What is the probability that John wins the next game?
...................(1)
(b) What are the odds against Matt winning the next game?
...................(1)
John and Matt play six games of tennis.
(c) Work out how many games John can be expected to win.
...................(1) Q3
(Total 3 marks)
Leave blank
8
*N22582A0832*
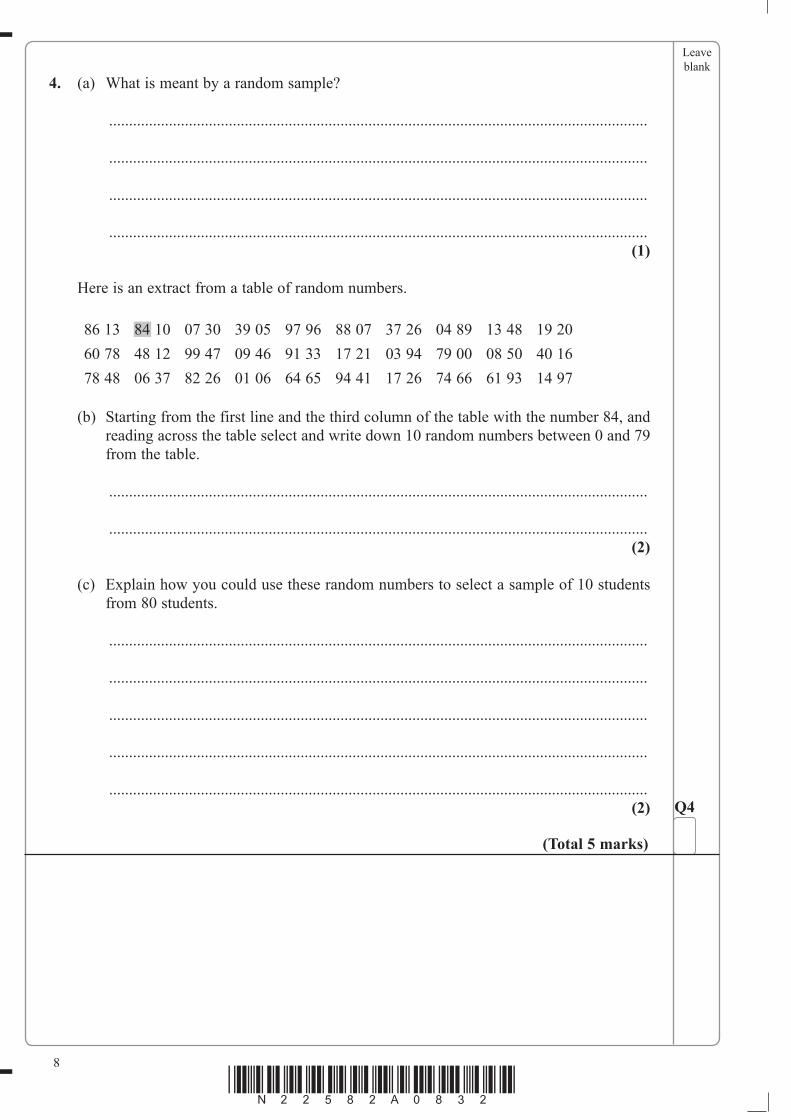
4. (a) What is meant by a random sample?
.......................................................................................................................................
.......................................................................................................................................
.......................................................................................................................................
.......................................................................................................................................(1)
Here is an extract from a table of random numbers.
86 13 84 10 07 30 39 05 97 96 88 07 37 26 04 89 13 48 19 2060 78 48 12 99 47 09 46 91 33 17 21 03 94 79 00 08 50 40 1678 48 06 37 82 26 01 06 64 65 94 41 17 26 74 66 61 93 14 97
(b) Starting from the first line and the third column of the table with the number 84, and reading across the table select and write down 10 random numbers between 0 and 79 from the table.
.......................................................................................................................................
.......................................................................................................................................(2)
(c) Explain how you could use these random numbers to select a sample of 10 students from 80 students.
.......................................................................................................................................
.......................................................................................................................................
.......................................................................................................................................
.......................................................................................................................................
.......................................................................................................................................(2) Q4
(Total 5 marks)

9
Turn over*N22582A0932*
BLANK PAGE
Leave blank
10
*N22582A01032*
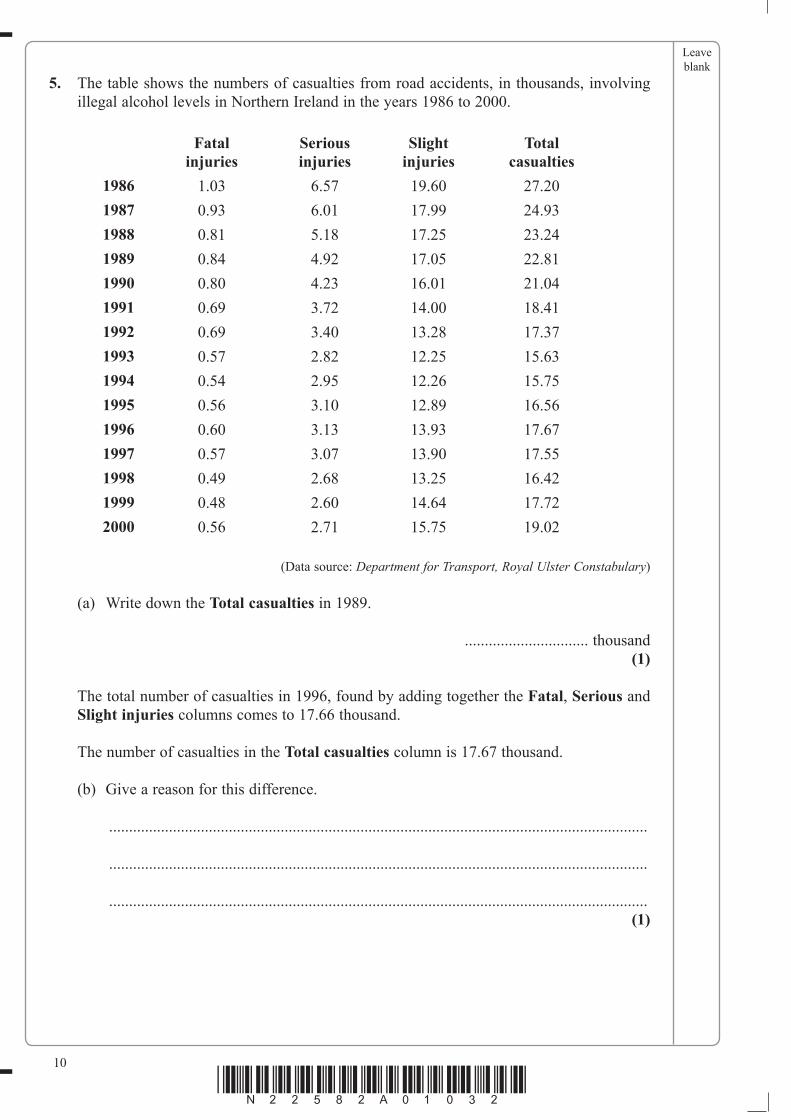
5. The table shows the numbers of casualties from road accidents, in thousands, involving illegal alcohol levels in Northern Ireland in the years 1986 to 2000.
Fatalinjuries
Seriousinjuries
Slightinjuries
Totalcasualties
1986 1.03 6.57 19.60 27.201987 0.93 6.01 17.99 24.931988 0.81 5.18 17.25 23.241989 0.84 4.92 17.05 22.811990 0.80 4.23 16.01 21.041991 0.69 3.72 14.00 18.411992 0.69 3.40 13.28 17.371993 0.57 2.82 12.25 15.631994 0.54 2.95 12.26 15.751995 0.56 3.10 12.89 16.561996 0.60 3.13 13.93 17.671997 0.57 3.07 13.90 17.551998 0.49 2.68 13.25 16.421999 0.48 2.60 14.64 17.722000 0.56 2.71 15.75 19.02
(Data source: Department for Transport, Royal Ulster Constabulary)
(a) Write down the Total casualties in 1989.
............................... thousand(1)
The total number of casualties in 1996, found by adding together the Fatal, Serious and Slight injuries columns comes to 17.66 thousand.
The number of casualties in the Total casualties column is 17.67 thousand.
(b) Give a reason for this difference.
.......................................................................................................................................
.......................................................................................................................................
.......................................................................................................................................(1)
Leave blank
11
Turn over*N22582A01132*
(c) Describe the trend in the numbers of Fatal injuries in the years
(i) 1986 to 1991,
................................................................................................................................
................................................................................................................................
................................................................................................................................
................................................................................................................................
................................................................................................................................
(ii) 1993 to 2000.
................................................................................................................................
................................................................................................................................
................................................................................................................................
................................................................................................................................
................................................................................................................................(2) Q5
(Total 4 marks)
Leave blank
12
*N22582A01232*
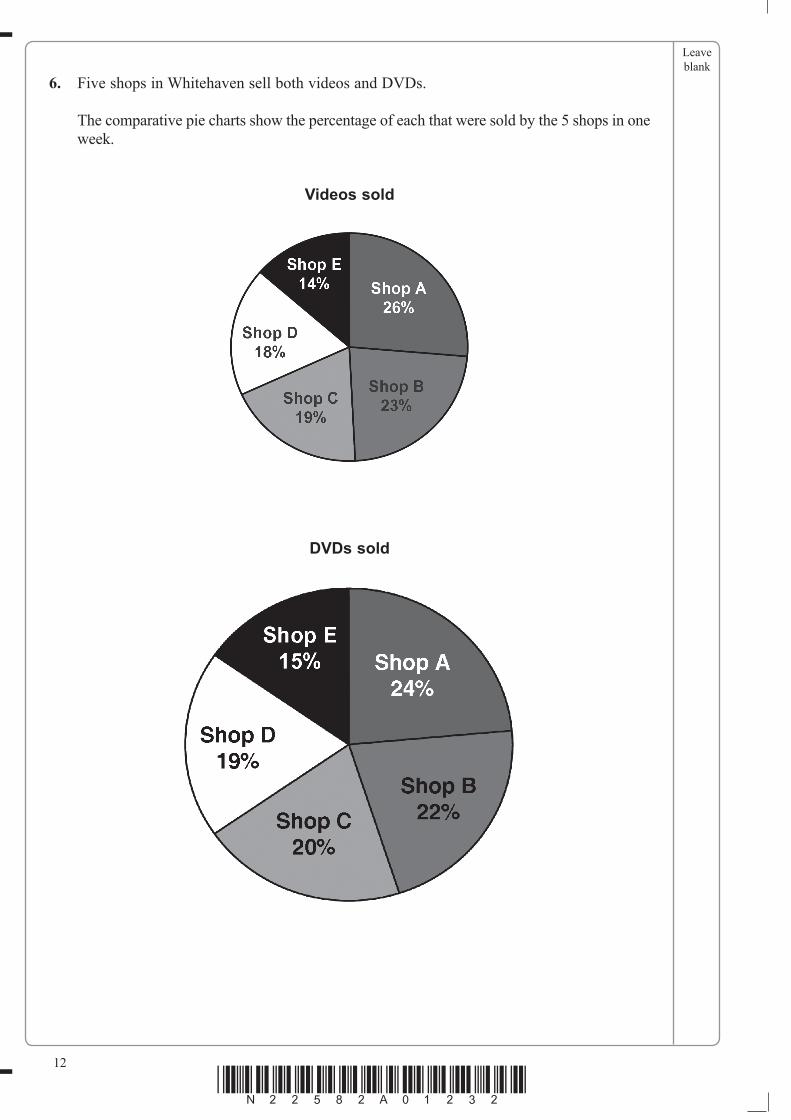
6. Five shops in Whitehaven sell both videos and DVDs.
The comparative pie charts show the percentage of each that were sold by the 5 shops in one week.
Videos sold
DVDs sold
Leave blank
13
Turn over*N22582A01332*
(a) Comment on the sales of videos compared to DVDs in Whitehaven. Give reasons for your opinion.
.......................................................................................................................................
.......................................................................................................................................
.......................................................................................................................................
.......................................................................................................................................
.......................................................................................................................................
.......................................................................................................................................(2)
(b) Discuss any relationship between the percentages of videos sold and the percentages of DVDs sold in each of the 5 shops.
.......................................................................................................................................
.......................................................................................................................................
.......................................................................................................................................
.......................................................................................................................................
.......................................................................................................................................(1) Q6
(Total 3 marks)
Leave blank
14
*N22582A01432*
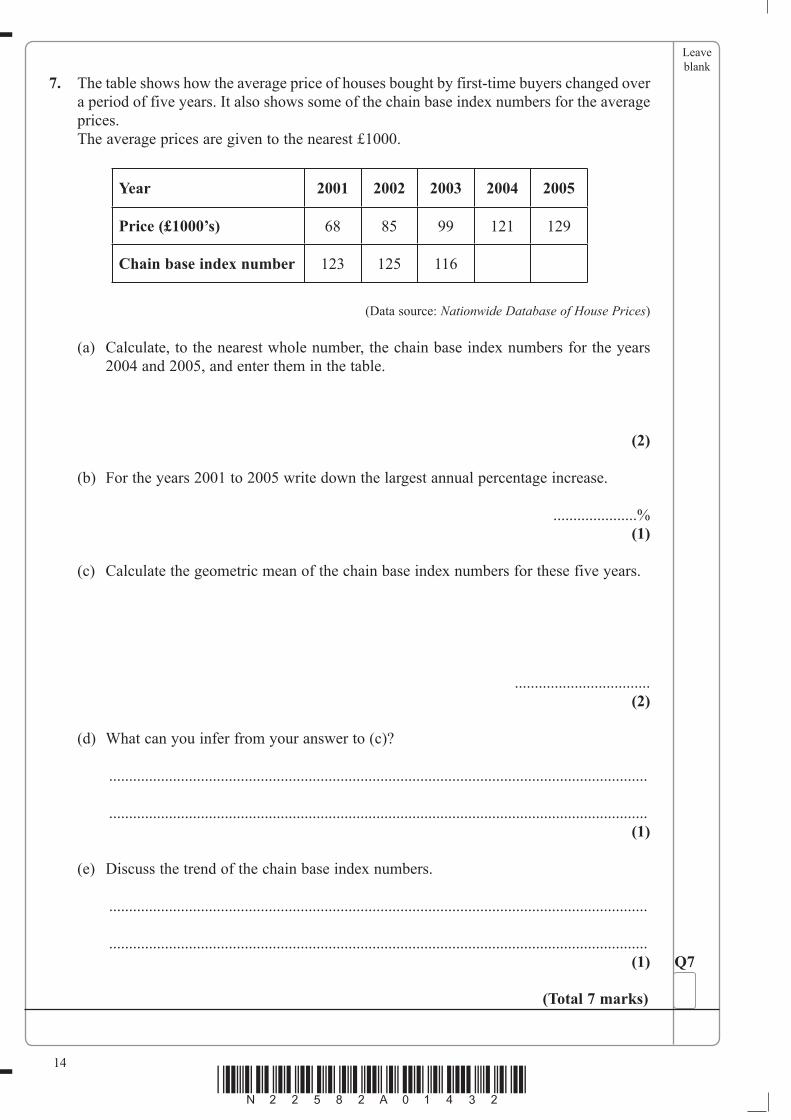
7. The table shows how the average price of houses bought by first-time buyers changed over a period of five years. It also shows some of the chain base index numbers for the average prices.
The average prices are given to the nearest £1000.
Year 2001 2002 2003 2004 2005
Price (£1000’s) 68 85 99 121 129
Chain base index number 123 125 116
(Data source: Nationwide Database of House Prices)
(a) Calculate, to the nearest whole number, the chain base index numbers for the years 2004 and 2005, and enter them in the table.
(2)
(b) For the years 2001 to 2005 write down the largest annual percentage increase.
.....................%(1)
(c) Calculate the geometric mean of the chain base index numbers for these five years.
..................................(2)
(d) What can you infer from your answer to (c)?
.......................................................................................................................................
.......................................................................................................................................(1)
(e) Discuss the trend of the chain base index numbers.
.......................................................................................................................................
.......................................................................................................................................(1) Q7
(Total 7 marks)
Leave blank
15
Turn over*N22582A01532*
8. A steel manufacturer finds that the total quantity of raw materials used by his company each week is normally distributed with a mean of 1000 tonnes and a standard deviation of 200 tonnes.
(a) Calculate an estimate of the maximum quantity of raw materials the company is likely to use per week.
........................... tonnes(1)
The manager of the steel manufacturing company decides to make a regular order for the same amount of raw materials to be delivered each week on a Monday.
(b) Discuss what would be a suitable figure for the quantity to be ordered.
.......................................................................................................................................
.......................................................................................................................................
.......................................................................................................................................
.......................................................................................................................................
.......................................................................................................................................
.......................................................................................................................................(2)
TOTAL FOR SECTION A: 35 MARKS
Q8
(Total 3 marks)
Leave blank
16
*N22582A01632*
SECTION B
Answer ALL the questions. Write your answers in the spaces provided.
You must write down all stages in your working.
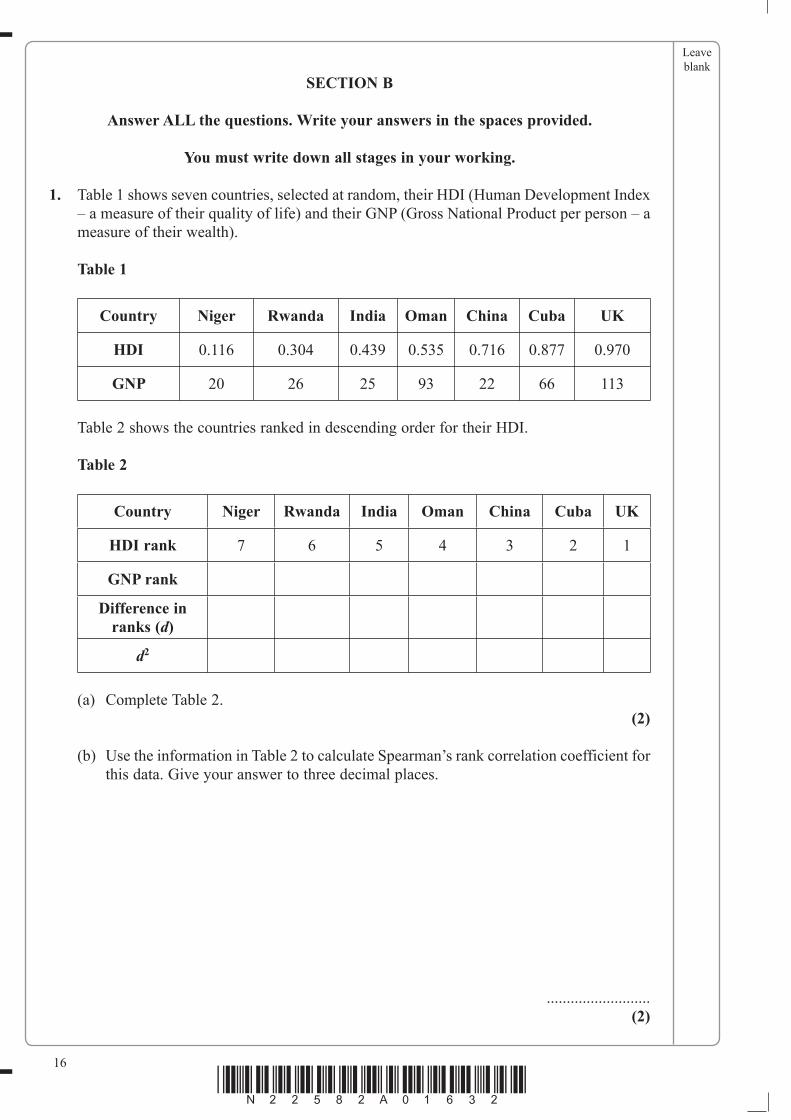
1. Table 1 shows seven countries, selected at random, their HDI (Human Development Index – a measure of their quality of life) and their GNP (Gross National Product per person – a measure of their wealth).
Table 1
Country Niger Rwanda India Oman China Cuba UK
HDI 0.116 0.304 0.439 0.535 0.716 0.877 0.970
GNP 20 26 25 93 22 66 113
Table 2 shows the countries ranked in descending order for their HDI.
Table 2
Country Niger Rwanda India Oman China Cuba UK
HDI rank 7 6 5 4 3 2 1
GNP rank
Difference in ranks (d)
d2
(a) Complete Table 2.(2)
(b) Use the information in Table 2 to calculate Spearman’s rank correlation coefficient for this data. Give your answer to three decimal places.
..........................(2)

Leave blank
17
Turn over*N22582A01732*
(c) Interpret your answer to part (b).
.......................................................................................................................................
.......................................................................................................................................
.......................................................................................................................................
.......................................................................................................................................
.......................................................................................................................................
.......................................................................................................................................(2) Q1
(Total 6 marks)
Leave blank
18
*N22582A01832*
2. A market research company wants to find out the views of customers about a new supermarket that has just opened.
(a) Give two reasons why the company should take a sample rather than a census.
(i) ................................................................................................................................
................................................................................................................................
................................................................................................................................
(ii) ................................................................................................................................
................................................................................................................................
................................................................................................................................(2)
The market research company wants to take a sample of 100 customers.
The sample is to be taken by asking pre-determined numbers of customers of different ages and genders to fill in a questionnaire.
(b) Name a suitable sampling method.
................................................................................(1)
(c) Write down an example of a closed question that could be used on this questionnaire.
.............................................................................................................................................
.............................................................................................................................................
.............................................................................................................................................(2)
(d) Give two reasons why a pilot survey (pre-test) should be carried out.
(i) ................................................................................................................................
................................................................................................................................
................................................................................................................................
(ii) ................................................................................................................................
................................................................................................................................
................................................................................................................................(2)

Leave blank
19
Turn over*N22582A01932*
One question on the questionnaire is
“Do you agree that the goods are well laid-out and easy to find?”
(e) Discuss whether this is a suitably worded question for the questionnaire.
.......................................................................................................................................
.......................................................................................................................................
.......................................................................................................................................
.......................................................................................................................................
.......................................................................................................................................(2) Q2
(Total 9 marks)
Leave blank
20
*N22582A02032*
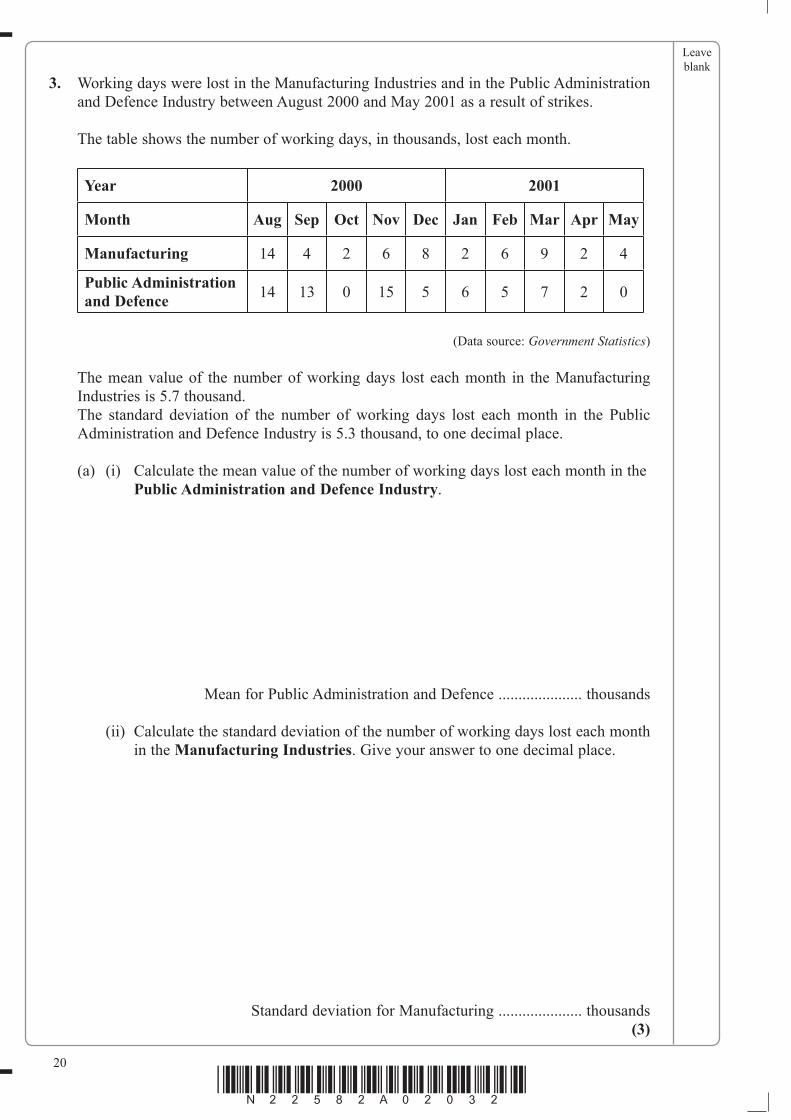
3. Working days were lost in the Manufacturing Industries and in the Public Administration and Defence Industry between August 2000 and May 2001 as a result of strikes.
The table shows the number of working days, in thousands, lost each month.
Year 2000 2001
Month Aug Sep Oct Nov Dec Jan Feb Mar Apr May
Manufacturing 14 4 2 6 8 2 6 9 2 4
Public Administrationand Defence 14 13 0 15 5 6 5 7 2 0
(Data source: Government Statistics)
The mean value of the number of working days lost each month in the Manufacturing Industries is 5.7 thousand.
The standard deviation of the number of working days lost each month in the Public Administration and Defence Industry is 5.3 thousand, to one decimal place.
(a) (i) Calculate the mean value of the number of working days lost each month in the Public Administration and Defence Industry.
Mean for Public Administration and Defence ..................... thousands
(ii) Calculate the standard deviation of the number of working days lost each month in the Manufacturing Industries. Give your answer to one decimal place.
Standard deviation for Manufacturing ..................... thousands(3)

Leave blank
21
Turn over*N22582A02132*
You may assume that, between August 2000 and May 2001, there were approximately the same number of people employed in the Manufacturing Industries as there were employed in the Public Administration and Defence Industry.
(b) Using the given summary statistics and your answers to part (a), compare the numbers of working days lost each month due to strikes in the two industries between August 2000 and May 2001.
.......................................................................................................................................
.......................................................................................................................................
.......................................................................................................................................
.......................................................................................................................................
.......................................................................................................................................
.......................................................................................................................................
.......................................................................................................................................(2) Q3
(Total 5 marks)
Leave blank
22
*N22582A02232*
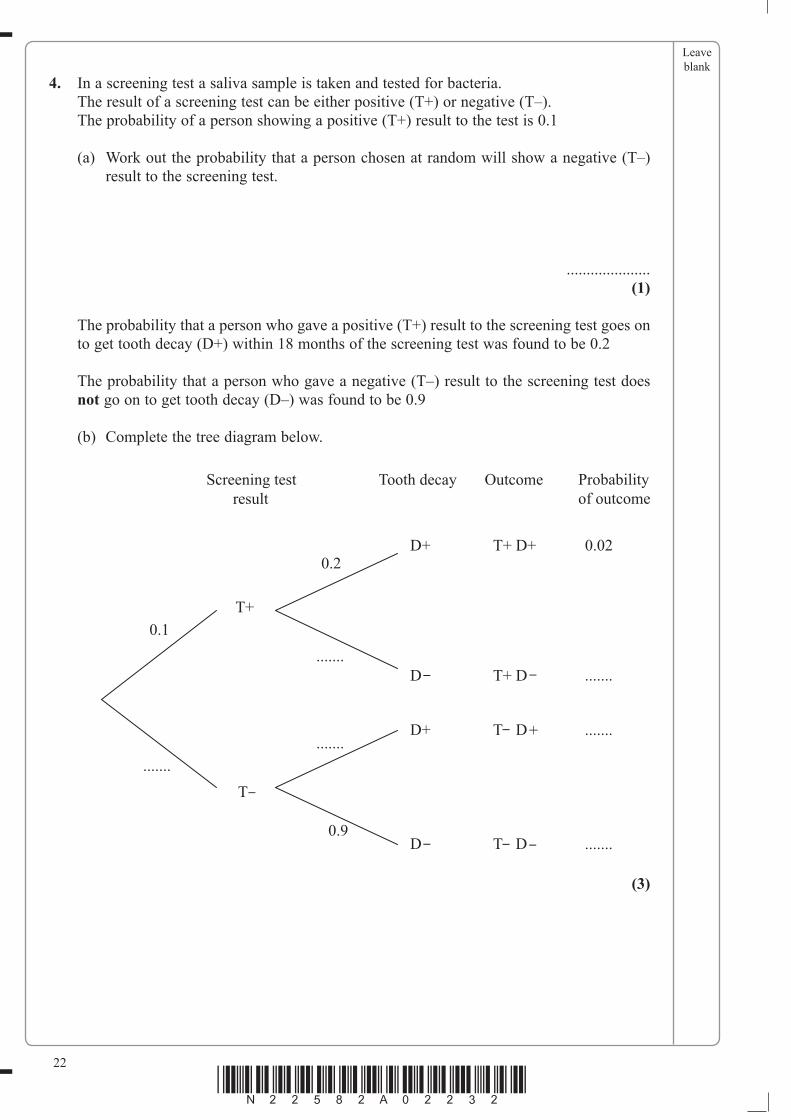
4. In a screening test a saliva sample is taken and tested for bacteria. The result of a screening test can be either positive (T+) or negative (T–). The probability of a person showing a positive (T+) result to the test is 0.1
(a) Work out the probability that a person chosen at random will show a negative (T–) result to the screening test.
.....................(1)
The probability that a person who gave a positive (T+) result to the screening test goes on to get tooth decay (D+) within 18 months of the screening test was found to be 0.2
The probability that a person who gave a negative (T–) result to the screening test does not go on to get tooth decay (D–) was found to be 0.9
(b) Complete the tree diagram below.
(3)
Leave blank
23
Turn over*N22582A02332*
(c) Given that a person has tooth decay (D+), what is the probability that the person gave a positive (T+) result in the screening test within the last 18 months?
...................(2)
(d) What can you infer from this result about the usefulness of the screening test?
.......................................................................................................................................
.......................................................................................................................................
.......................................................................................................................................
.......................................................................................................................................
.......................................................................................................................................
.......................................................................................................................................
.......................................................................................................................................
.......................................................................................................................................(2)
(Data source: Dental Journal) Q4
(Total 8 marks)
Leave blank
24
*N22582A02432*
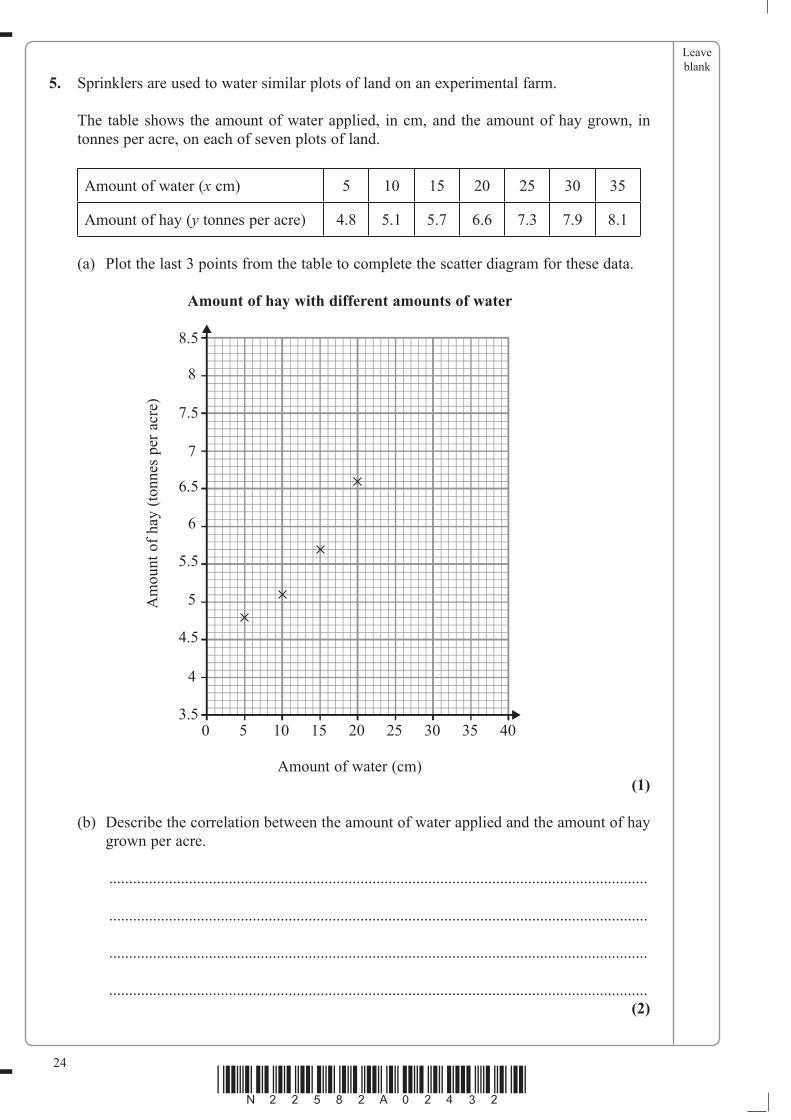
5. Sprinklers are used to water similar plots of land on an experimental farm.
The table shows the amount of water applied, in cm, and the amount of hay grown, in tonnes per acre, on each of seven plots of land.
Amount of water (x cm) 5 10 15 20 25 30 35
Amount of hay (y tonnes per acre) 4.8 5.1 5.7 6.6 7.3 7.9 8.1
(a) Plot the last 3 points from the table to complete the scatter diagram for these data.
Amount of hay with different amounts of water
0 5 10 15 20 25 30 35 403.5
4
4.5
5
5.5
6
6.5
7
7.5
8
8.5
Amount of water (cm)(1)
(b) Describe the correlation between the amount of water applied and the amount of hay grown per acre.
.......................................................................................................................................
.......................................................................................................................................
.......................................................................................................................................
.......................................................................................................................................(2)
Am
ount
of h
ay (t
onne
s pe
r acr
e)
Leave blank
25
Turn over*N22582A02532*
(c) Calculate the coordinates of the mean point (x y, ) for the data.
........................(2)
On the scatter diagram
(d) (i) plot the point ( ,x , y ),
(ii) draw the line of best fit.(2)
(e) Estimate the amount of hay grown when 32 cm of water is applied by the sprinklers to another one of these plots.
..................... tonnes per acre(2)
(f) Extend your line of best fit to find the amount of hay grown when no water is applied by the sprinklers. Discuss this answer.
.......................................................................................................................................
.......................................................................................................................................
.......................................................................................................................................
.......................................................................................................................................
.......................................................................................................................................
.......................................................................................................................................(2) Q5
(Total 11 marks)
Leave blank
26
*N22582A02632*
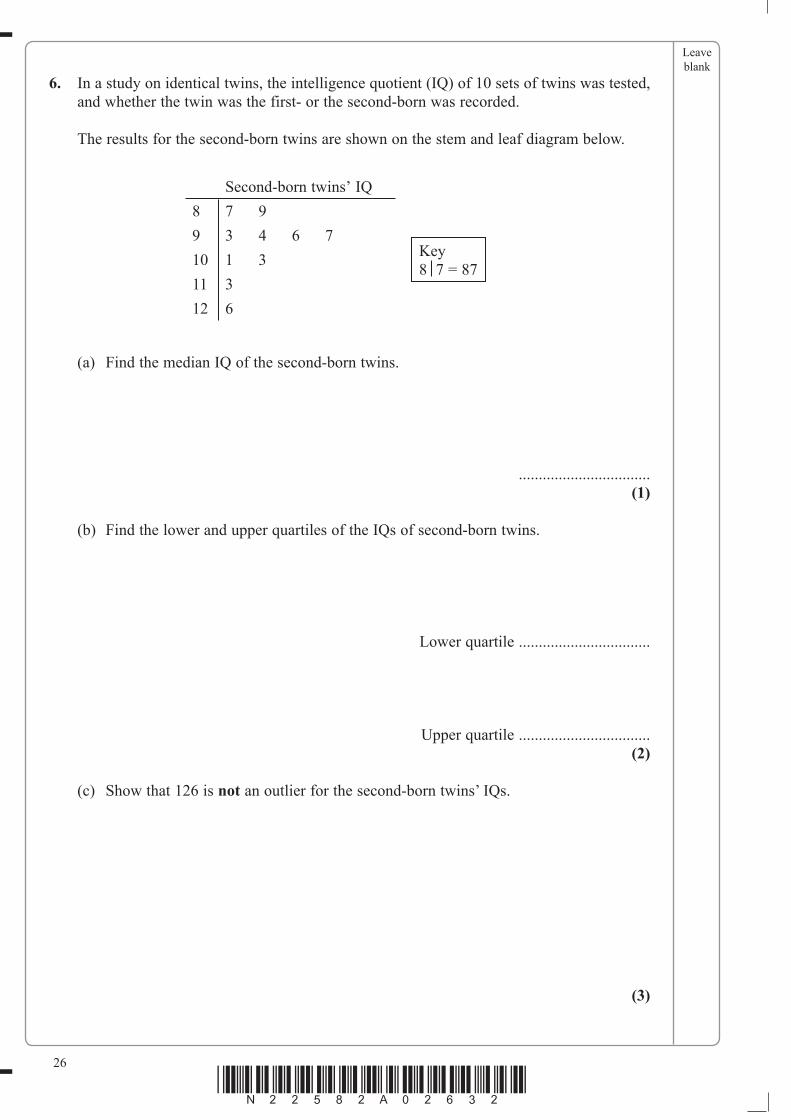
6. In a study on identical twins, the intelligence quotient (IQ) of 10 sets of twins was tested, and whether the twin was the first- or the second-born was recorded.
The results for the second-born twins are shown on the stem and leaf diagram below.
(a) Find the median IQ of the second-born twins.
.................................(1)
(b) Find the lower and upper quartiles of the IQs of second-born twins.
Lower quartile .................................
Upper quartile .................................(2)
(c) Show that 126 is not an outlier for the second-born twins’ IQs.
(3)
Key8 7 = 87
Second-born twins’ IQ 8 7 99 3 4 6 710 1 311 312 6
Leave blank
27
Turn over*N22582A02732*
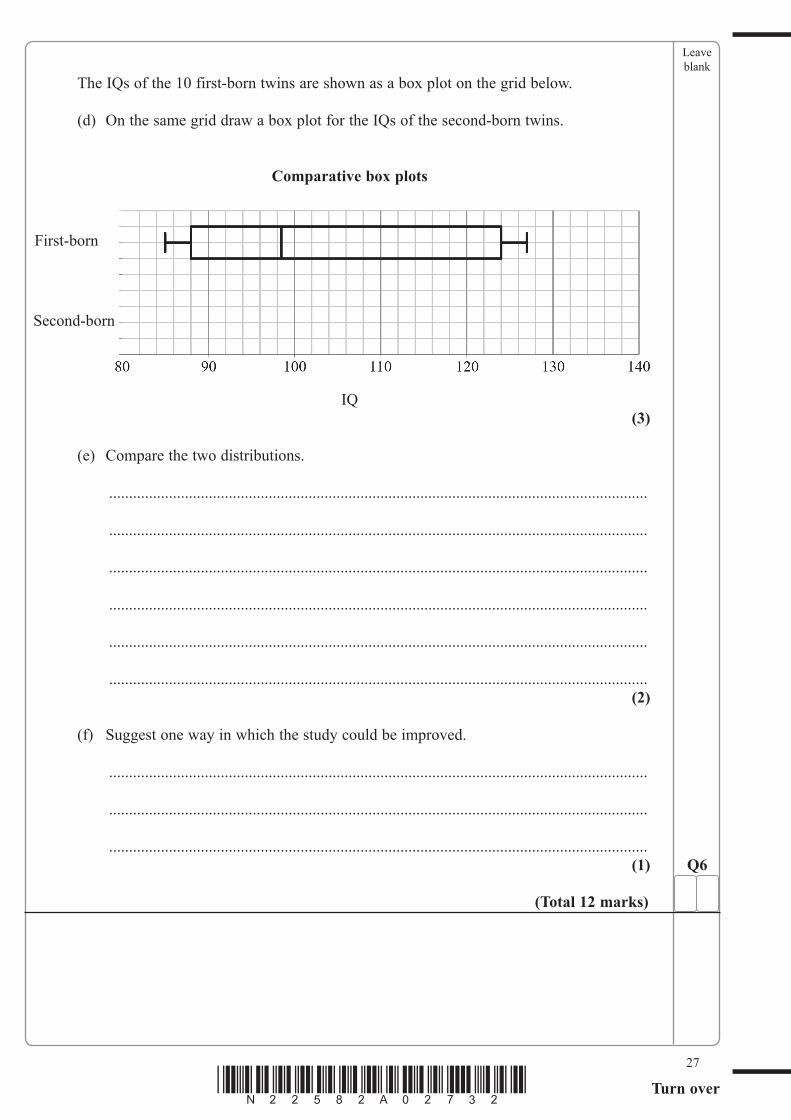
The IQs of the 10 first-born twins are shown as a box plot on the grid below.
(d) On the same grid draw a box plot for the IQs of the second-born twins.
Comparative box plots
IQ(3)
(e) Compare the two distributions.
.......................................................................................................................................
.......................................................................................................................................
.......................................................................................................................................
.......................................................................................................................................
.......................................................................................................................................
.......................................................................................................................................(2)
(f) Suggest one way in which the study could be improved.
.......................................................................................................................................
.......................................................................................................................................
.......................................................................................................................................(1) Q6
(Total 12 marks)
First-born
Second-born
Leave blank
28
*N22582A02832*
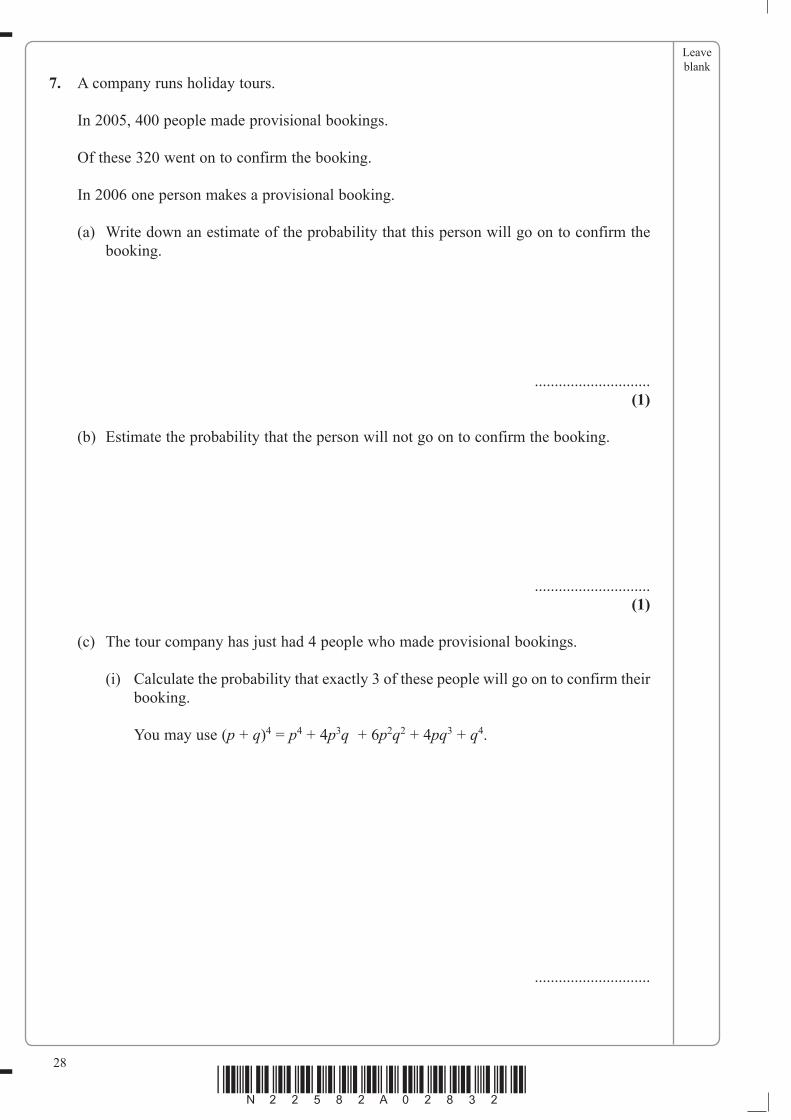
7. A company runs holiday tours.
In 2005, 400 people made provisional bookings.
Of these 320 went on to confirm the booking.
In 2006 one person makes a provisional booking.
(a) Write down an estimate of the probability that this person will go on to confirm the booking.
.............................(1)
(b) Estimate the probability that the person will not go on to confirm the booking.
.............................(1)
(c) The tour company has just had 4 people who made provisional bookings.
(i) Calculate the probability that exactly 3 of these people will go on to confirm their booking.
You may use (p + q)4 = p4 + 4p3q + 6p2q2 + 4pq3 + q4.
.............................
Leave blank
29
Turn over*N22582A02932*
(ii) For these 4 provisional bookings, find which are the two most likely numbers of people who go on to confirm their bookings. Show your working.
....................(5) Q7
(Total 7 marks)
Leave blank
30
*N22582A03032*
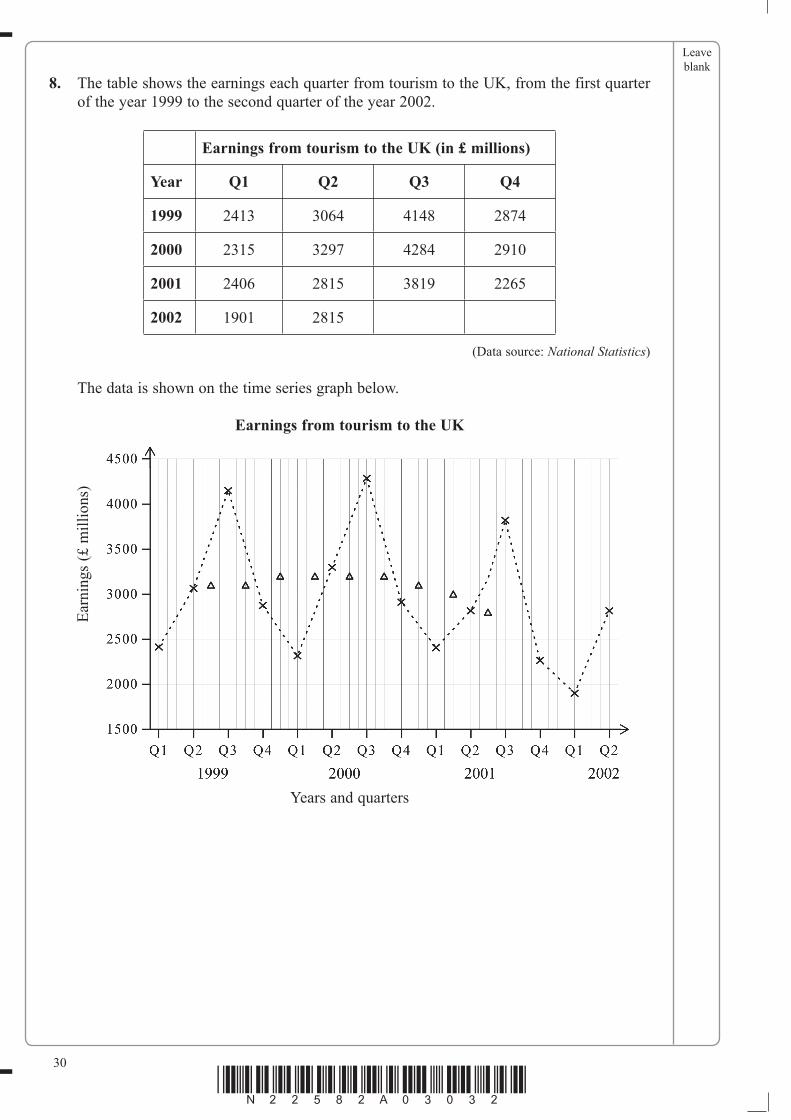
8. The table shows the earnings each quarter from tourism to the UK, from the first quarter of the year 1999 to the second quarter of the year 2002.
Earnings from tourism to the UK (in £ millions)
Year Q1 Q2 Q3 Q4
1999 2413 3064 4148 2874
2000 2315 3297 4284 2910
2001 2406 2815 3819 2265
2002 1901 2815
(Data source: National Statistics)
The data is shown on the time series graph below.
Earnings from tourism to the UK
Years and quarters
Earn
ings
(£ m
illio
ns)
Leave blank
31
*N22582A03132*
(a) In which quarter of each year was the greatest amount of money earned?
.......................................................................................................................................(1)
(b) Give one reason why the earnings from tourism were higher in this quarter of each year.
.......................................................................................................................................
.......................................................................................................................................(1)
The first 9 four-quarterly moving averages, in £ millions, to two significant figures are:
3100 3100 3200 3200 3200 3200 3100 3000 2800
(c) Calculate the last two moving averages.
£.................... million, £.................... million.(2)
(d) Plot the last two moving averages on the time series graph.(1)
(e) What can be inferred from the moving averages about the way the earnings from tourism changed for the years 1999 to 2002?
.......................................................................................................................................
.......................................................................................................................................
.......................................................................................................................................
.......................................................................................................................................(2)
TOTAL FOR SECTION B: 65 MARKSTOTAL FOR PAPER: 100 MARKS
END
Q8
(Total 7 marks)

32
*N22582A03232*
BLANK PAGE