Embed Size (px)
Citation preview

PAPERS PUBLISHED
Kavitha,T and R. Nelson, 2013. Diversity of Arbuscular Mycorrhizal Fungi (AMF) in
the Rhizosphere of Helianthus annuus L. Am- Euras. J. Agric. and Environ. Sci, 13 (7):
982-987.
Kavitha,T and R. Nelson, 2013. Exploiting the biocontrol activity of Trichoderma spp
against root rot causing phytopathogens. ARPN. J. Agric. and Bio. Sci, 8(7): 571-574.
Kavitha,T., R. Nelson and S. Josephin Jesi, 2013. Screening of rhizobacteria for plant
growth promoting traits and antifungal activity against charcoal rot pathogen
Macrophomina phaseolina. Int. J. Pharm. Bio. Sci, 4(4): 177-186.
Kavitha,T and R. Nelson, 2013. Effect of Arbuscular Mycorrhizal (AM) fungi on
growth and yield of sunflower (Helianthus annuus L.). J. Exp. Biol. Agric. Sci,
(Accepted for May issue -2014).
Other Publications
Kavitha,T. and R. Nelson, 2011. Microbial synthesis of Metal Nanoparticles and their
Applications (Review article). RJOBS, 3(1): 50-57.
Thenmozhi.R., T. Reshma, T. Kavitha, K. Madhusudhanan, D. Praveen Kumar, 2011.
Studies on VAM colonization on selected medicinal plants. Arch. Appl. Sci. Res, 3(5):
445-449.
Kavitha,T., and R. Nelson and Ramesh Babu, 2012. Using jackfruit (Artocarpus
heterophyllus) pulp as substrate for cellulose production by Rhizopus stolonifer. Res. J.
Sci. and Technol, 4(2): 67-69.
Kavitha,T., R. Nelson, R. Thenmozhi and E. Priya, 2012. Antimicrobial activity and
phytochemical analysis of Anisomeles malabarica (L) R.BR. J. Micobiol. Biotech. Res,
2(1): 1-5.

American-Eurasian J. Agric. & Environ. Sci., 13 (7): 982-987, 2013ISSN 1818-6769© IDOSI Publications, 2013DOI: 10.5829/idosi.aejaes.2013.13.07.73110
Corresponding Author: T. Kavitha, Department of Microbiology, J. J. College of Arts and Science,Pudukkottai.622422, Tamil Nadu, India. Mob: +9965363456.
982
Diversity of Arbuscular Mycorrhizal Fungi (AMF) inthe Rhizosphere of L.
T. Kavitha and R. Nelson1 2
Department of Microbiology, J.J. College of Arts and Science,1
Pudukkottai. 622-422, Tamil Nadu, IndiaPG and Research Department of Botany, Government Arts College,2
Ariyalur, 621-713, Tamil Nadu, India
Abstract: In this investigation an attempt was made to reveal the root colonization and species diversity ofAMF in the Rhizosphere of sunflower, collected from different areas which differed in physico- chemicalparameter. The higher colonization was observed at Arasadipatti (Pudukkottai), Thalaimalaipatti (Trichy)Thirukkanurpatti (Thanjavur) and the lower colonization was observed at Thirumalaisamuthirum (Thanjavur).The colonization among root samples collected from ten different soils, ranged from 20%-70%, this may due tosome biotic and abiotic stress. Altogether fourteen species of AMF were isolated, of which seven species werecontributed by Glomus spp., three by Gigaspora spp. and two by Acalospora spp. and Scutilospora spp.,The spore densities of soils studied varied from 210 to 740/100g soils. The highest isolation frequency, of 60%was represented by Glomus mossae and the lowest was by Glomus species 1, Gigaspora sp1, Gigaspora sp2.Among the ten soils, species richness and Shannon-Wiener index of diversity (H’) were found to be greaterat Vallamputhur (Thanjavur), Sampson’s index of dominance (D) was found to be high at Kummankulum(Pudukkottai).
Key words: AMF diversity Colonization Spore density Sunflower
INTRODUCTION essential element for growth and development. It has
Arbuscular Mycorrhizal (AM) fungi are the symbiotic enzyme activities of the rhizosphere soil were muchfungi, which form mutualistic association with feeder related to AM fungal activity [4]. The other functionsroots of most terrestrial plants. These fungi are the major attributed to AM fungi include production of plantcomponent of soil microbial communities in terrestrial eco growth hormones, protection of host roots fromsystems, which can form mutually beneficial symbiosis pathogens, uptake of heavy metals, salinity tolerance [5].with 90% of vascular plants [1]. On global basis, Distribution, diversity, abundance and functioning of AMmycorrhizae occurs in 83% of dicots and 79% of fungi are primarily based upon the root colonization andmonocots, where as all gymnosperms are mycorrhizal. spore count which further depend upon manyDense AM fungi infection is common in most environmental factors [6]. In addition to the sensitivity tospecies of Leguminosae and Gramineae. Most of the soil type, some other factors that affect behavior of AMeconomically important crops are infected by AM fungi are host plant, crop rotation; soil pH, moisturefungi [2]. These fungi enter cortex of roots to obtain content of soil, soil temperature, nutrient levels andcarbon from their host plants, while assisting the interaction with other soil biota. The objective of thisplants with the uptake of phosphorus and the other investigation is to reveal the species diversity of AMmineral nutrients from soil [3]. This association is fungi in Rhizosphere of sunflower in differentbeneficial to plants because, phosphorus is a major agroecological stations.
been observed that alkaline and acid phosphatase
Am-Euras. J. Agric. & Environ. Sci., 13 (7): 982-987, 2013
983
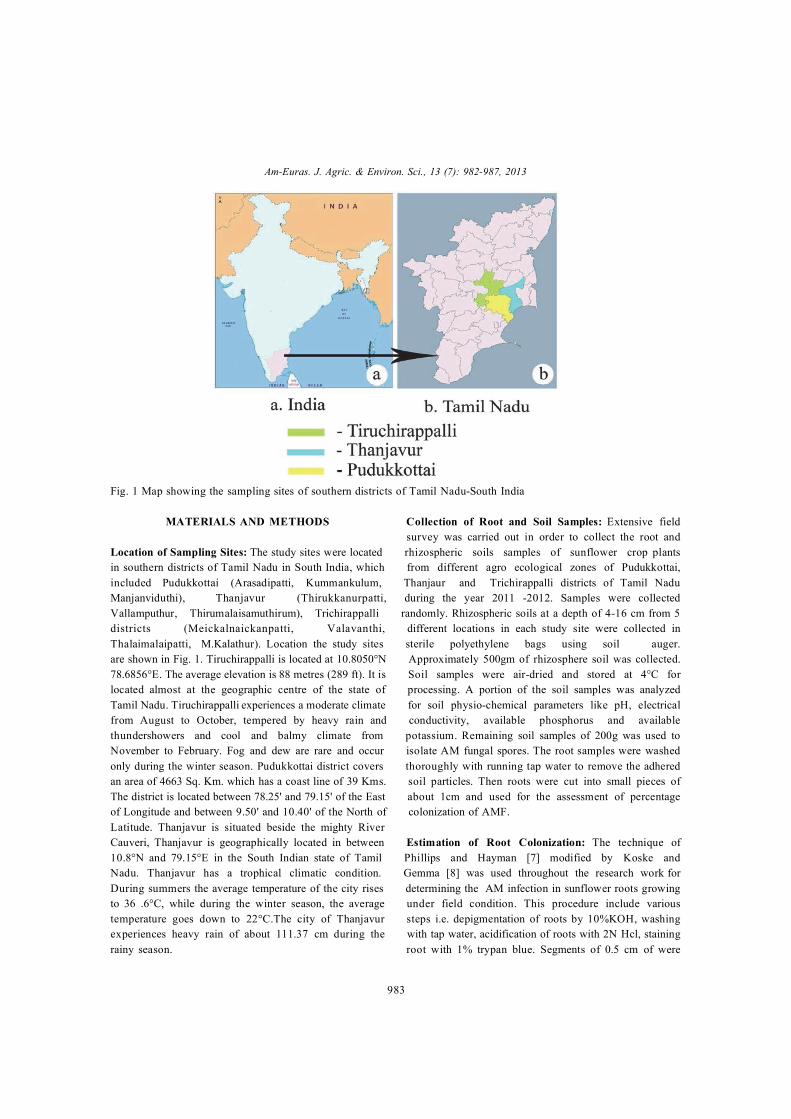
Fig. 1 Map showing the sampling sites of southern districts of Tamil Nadu-South India
MATERIALS AND METHODS Collection of Root and Soil Samples: Extensive field
Location of Sampling Sites: The study sites were located rhizospheric soils samples of sunflower crop plantsin southern districts of Tamil Nadu in South India, which from different agro ecological zones of Pudukkottai,included Pudukkottai (Arasadipatti, Kummankulum, Thanjaur and Trichirappalli districts of Tamil NaduManjanviduthi), Thanjavur (Thirukkanurpatti, during the year 2011 -2012. Samples were collectedVallamputhur, Thirumalaisamuthirum), Trichirappalli randomly. Rhizospheric soils at a depth of 4-16 cm from 5districts (Meickalnaickanpatti, Valavanthi, different locations in each study site were collected inThalaimalaipatti, M.Kalathur). Location the study sites sterile polyethylene bags using soil auger.are shown in Fig. 1. Tiruchirappalli is located at 10.8050°N Approximately 500gm of rhizosphere soil was collected.78.6856°E. The average elevation is 88 metres (289 ft). It is Soil samples were air-dried and stored at 4°C forlocated almost at the geographic centre of the state of processing. A portion of the soil samples was analyzedTamil Nadu. Tiruchirappalli experiences a moderate climate for soil physio-chemical parameters like pH, electricalfrom August to October, tempered by heavy rain and conductivity, available phosphorus and availablethundershowers and cool and balmy climate from potassium. Remaining soil samples of 200g was used toNovember to February. Fog and dew are rare and occur isolate AM fungal spores. The root samples were washedonly during the winter season. Pudukkottai district covers thoroughly with running tap water to remove the adheredan area of 4663 Sq. Km. which has a coast line of 39 Kms. soil particles. Then roots were cut into small pieces ofThe district is located between 78.25' and 79.15' of the East about 1cm and used for the assessment of percentageof Longitude and between 9.50' and 10.40' of the North of colonization of AMF.Latitude. Thanjavur is situated beside the mighty RiverCauveri, Thanjavur is geographically located in between Estimation of Root Colonization: The technique of10.8°N and 79.15°E in the South Indian state of Tamil Phillips and Hayman [7] modified by Koske andNadu. Thanjavur has a trophical climatic condition. Gemma [8] was used throughout the research work forDuring summers the average temperature of the city rises determining the AM infection in sunflower roots growingto 36 .6°C, while during the winter season, the average under field condition. This procedure include varioustemperature goes down to 22°C.The city of Thanjavur steps i.e. depigmentation of roots by 10%KOH, washingexperiences heavy rain of about 111.37 cm during the with tap water, acidification of roots with 2N Hcl, stainingrainy season. root with 1% trypan blue. Segments of 0.5 cm of were
survey was carried out in order to collect the root and

Number of AM positive segments Root colonization (%) = X100Total number of segments observed
Am-Euras. J. Agric. & Environ. Sci., 13 (7): 982-987, 2013
984
placed in slide and observed under Microscope. Statistical Analysis: Ecological measures of diversityMycorhizal infection (vesicles, arbuscles) in each segment used to describe the structure of AMF communitieswas observed in order to estimate the mycorrhizal included spore density, species richness, relativeinfection levels. The root infection percentages were abundance, isolation frequency, Shannon-Wiener indexcalculated from the number of infected segments out of of diversity, Simpson’s index of dominance [11-13].total root segments. The formula used to calculate these parameters is given in
species, at least to some extent. Relative abundance was
Isolation of AM Fungi: AM spores were extracted of AMF. Isolation frequency was defined as thefrom the collected soil samples by wet sieving and percentage of soil samples in which a species occurred,decanting method to obtain viable and debris free which revealed extent of distribution of given AMFAM spores [9]. Soil mass 100gm was suspended in species in an ecosystem. The degree of diversity was500ml of distilled water, heavier particles gradually reflected by Shannon-Wiener index of diversity. Since thesettle down the bottom of the container. The isolated spores lacked distinguishable fine taxonomicsuspension was passed through the series of character, few species were identified to species level andsieves of the following pores dimensions 710mm, were not included in the statistical analysis, except as part425mm, 250mm and 45mm. Residues from the last two of total spore density. The Pearson correlation coefficientsieves were washed and collected in the beaker. After was employed to determine the relationship between5 minutes the supernatant was filtered through Whatmann Spore density and Species Richness, Relative abundanceNo. 1 filter paper. The filter paper containing the residues and Isolation frequency.was placed on the Petri plates and was observedunder light binocular microscope for spore counting. RESULT AND DISCUSSIONThe healthy and fresh spores were isolated with the helpof needle and were placed on the slide and were mounted Diversity of AM Fungal Spores and Colonization:in Poly Vinyl Lacto Glycerol (PVLG) to make permanent Rhizosphere soil samples collected from various localitiesslides. revealed the presence of several species of AM fungi.
Identification of AM Fungi: The isolated AM spores were sample collected from ten different agro ecosystems.microscopically examined for spore morphology viz. size From which 14 species were identified. The identifiedof spores, nature and number of spore walls, spore species were Glomus mossae, G. fasiculatum,inclusions and hypha attachment. The isolated AM G. microsporum, G. aggregatum, G. intradices,spores were then identified on morphological basis by Glomus sp1, Glomus sp2, Gigaspora sp1, G. gigantiea,referring to the latest taxonomy on AM fungi given by Gigaspora sp2, Acalospora scrobiculata, A. lavis,Schenck and Perex [10]. Scutilospora sp1, Scutilospora sp2 (Table 3).
the Table 1. Spore density reflects the biomass of AMF
defined as the percentage of spore number of a species,which indicated the sporulation ability of different species
A total of 4,446 spores of AMF were wet sieved from soil
Table 1: Diversity measures used to describe AM communities
Spore density (SD) The number spores in 100gm soil
Species richness (SR) Number of identified AMF species per soil sample
Relative abundance (RA) Spore number of a species (genus) X100
------------------------------------------------------
Total number of identified spore samples
IF (Isolation Frequency) The number soil samples in which AMF species occurred X100
-----------------------------------------------------------------------------------
The total number of soil samples
Simpson’s index of dominance D= (n N)i /2
Shannon –Wiener index of Diversity (H’) H’= - P In Pi i
P is the relative abundance of each identified species per sampling site and calculated by the following formula,i
P = n where n is the spore numbers of a species and N is the total number of identified species per sampling sitesi i /N, i

Am-Euras. J. Agric. & Environ. Sci., 13 (7): 982-987, 2013
985
Table 2: Relative abundance (RA) and Isolation frequency of AM in Rhizosphere soil of Sunflower
S.No Name of the Organisms Relative Abundance (RA)% Isolation Frequency (IF) %
1 Glomus mossae 16.17 60
2 Glomus faciculatum 21.64 50
3 Glomus microsporum 7.21 20
4 Glomus aggrigatum 9.96 305 Glomus intradices 6.52 20
6 Glomus sp1 0.68 10
7 Glomus sp2 2.40 30
8 Gigaspora sp1 0.68 10
9 Gigaspora gigantiea 4.12 30
10 Gigaspora sp2 1.37 1011 Acalospora scrobiculata 8.59 40
12 Acalospora lavis 13.40 50
13 Scutilospora sp1 4.12 30
14 Scutilospora sp2 4.46 40
Table 3: Diversity measurement of AMF community
Factors S1 S2 S3 S4 S5 S6 S7 S8 S9 S10
Spore density (SD)/100g of soil 704 470 350 284 210 413 425 530 680 560
Species Richness (SR) 5 5 4 2 4 3 3 6 7 3
Shannon-Wiener index of diversity (H’) 1.6068 1.52 1.1372 0.5297 1.1658 0.7355 0.9189 1.0862 1.805 0.9794
Sampson’s index of dominance (D) 0.2291 0.2254 0.3291 0.1498 0.2054 0.5803 0.4616 0.1952 0.1665 0.4618
Meickalnaickanpatti-S1, Valavanthi -S2, Thalaimalaipatti -S3, M.Kalathur -S4, Arasadipatti- S5, Kummankulum-S6,
Manjanviduthi -S7, Thirukkanurpatti -S8, Vallamputhur –S9, Thirumalaisamuthirum- S10
Supriya Gaur and Purshotam Kaushik [14] isolated a total [17, 18]. Based on relative abundance and isolationof 16 species of AM from three medicinal plants of which frequency, it was observed that Glomus fasciculatum wasmore than fifty percent of the total species identified most dominant (21.64% of RA) followed by Glomusbelonged to the genus Glomus. Like wise Sharma et al. mossae (16.17% of RA) and Acalospora lavis (13.40 % of[15] described seven species of Glomus from sunflower RA). However Glomus mossae contributed to greaterrhizosphere. Similarly in this study also seven species of isolation frequency (60%) and was widely distributed,Glomus were isolated and identified. Sharma et al. [16] followed by Glomus fasciculatum and Acalospora lavisidentified seven species of Acalospora from Sunflower (50%). This finding was in accordance Karthikeyan andrhizosphere soil of Haryana, India. Whereas, in the selvaraj [19]. Correlation analysis revealed that there waspresent study two Acalospora species (Acalospora lavis positive correlation between relative abundance andand A. tuberculata) have been identified (Table 2). In this isolation frequency (SPSS software version16.0, (r =.815)investigation the species richness was maximum at (Fig. 3). This finding was supported by earlier works [20].Vallamputhur (SR 7%, SD 680/100g soil) however the They suggested that AMF colonization varied widelyspore density was minimum when compared to among different vegetable crops and fruit yielding crops,Meickalnaickanpatti (SR 5%, SD 704/100g soil). Spore Glomus was represented by10 species. Furthermore,density and species richness were found to be less in Shannon-Wiener index of diversity (H’) and Sampson’sM. Kalathur (SR 2%, SD 284/100g soil). Kummankulum, index of dominance (D) showed greater diversityManjanviduthi and Thirumalaisamuthirum had the same (Table 3).SR (3%) value but differed in SD (413, 425, 560)respectively; similar results were recorded at AM Fungal Colonization in Root of Sunflower:Thalaimalaipatti and Arasadipatti (Table 3). Correlation Arbuscular mycorrhizal fungal taxa have a specificanalysis demonstrated that spore density of AMF multidimensional niche determined by the plant speciesspecies was positively correlated with species richness that are present at the site and by edaphic factors such as(SPSS software version16.0, r = 618) (Fig. 2). The result of pH, moisture content and phosphorus (P) and nitrogenthe present study coincides with the previous reports (N) availability [21]. Variation in spore density and percent

Am-Euras. J. Agric. & Environ. Sci., 13 (7): 982-987, 2013
986
Fig. 2: Correlation between spore density and species Fig. 3: Correlation between Isolation Frequency (IF) andrichness Relative Abundance (RA)
Table 4: Percentage root colonization of AMF in roots of SunflowerS.No Study sites Percentage of AM Colonization in Root samples No. of vesicles per Root samples No. of Arbuscles per Root samples1 S1 50 4 62 S2 60 3 23 S3 70 5 44 S4 40 2 65 S5 70 3 56 S6 60 2 47 S6 50 4 78 S8 70 3 49 S9 60 2 510 S10 30 3 6
colonization among different sampling sites attributed to 2. Hayman, D.S., 1982. The physiology of vesicularhost specificity, edaphic and climatic conditions [22]. arbuscular endomycorrhizal symbiosis. Can, J. Bot.,Table 4 reveals that the percentage of AMF colonization 61: 944-963.of sunflower root varied greatly among different study 3. Auge, R.M., 2001. Water relations, droughtsites. Highest infection rate of 70% was observed at and VA mycorrhizal symbiosis, Mycorrhiza,Thalaimalaipatti, Arasadipatti, Thirukkanurpatti and 11: 3-42.lowest infection rate of 30% was recorded at 4. Chethan Kumar, K.V., K.R. Chandrashekar andThirumalaisamuthirum. The colonization rate of 35% in R. Lakshmipathy, 2008. Variation in Arbuscularsunflower root collected from marginal soil and of 29% Mycorrhizal fungi and Phosphatase Activitysample collected from fertile soil was observed [23]. associated with Sida cardifolia in Karnataka. World.The results obtained in this study coincides with the J. Agric. Sci., 4(6): 770-774.previous reports [24], who examined the seasonal 5. Selvaraj, T., P. Chellappan, Y.J. Jeong and H. Kim,dynamics of several soil variables (soil pH, temperature, 2005. Occurrence and Quantification of Vesicularmoisture) with specific interest to determine the rate of Arbuscular Mycorrhizal (VAM) fungi in Industrialarbuscular mycorrhizal root colonization, vesicles and Polluted Soils, Journal of Microbiol. Biotechnol.,arbuscles formation in the root and AM fungal spore 15(1): 147-154.population in the rhizosphere of five medicinal plants and 6. Daniels, B.A., 1984. Ecology of VAM fungi,reported that the season and edaphic conditions are In: VA Mycorrhiza, Eds. C.L. Ipowell andcrucial for the development of AM fungi. D.J. Bagyaraj. CRC Press, Boca Raton, Florida,
REFERENCES 7. Phillips, J.M. and D.S. Haymann, 1970. Improved
1. Liu, R.J. and Y.L. Chen, 2007. Mycorrhizology, for rapid assessment of infections. Trans. Brit,Beijing: Science Press. Mycol. Soc., 55: 158-161.
pp: 205-222.
procedure for clearing roots and Staining VAM fungi

Am-Euras. J. Agric. & Environ. Sci., 13 (7): 982-987, 2013
987
8. Koske, R.E. and J.N. Gemma, 1989. A modified 17. Zhan Dandan and Zhao Zhiwei, 2007. Biodiversity ofprocedure for staining roots to detect VA mycorrhiza. arbuscular mycorrhizal fungi in the hot –dry valley ofMycol. Res., 4: 486-488. the Jinsha River, southwest China. Appl. Soil. Ecol.,
9. Gerdemann, J.W. and T.H. Nicolson, 1963. Spores of (37): 118-128.mycorrhizal Endogyne species extracted from soil by 18. Muhammad Ali Akond, Sanzida Mubassara,wet sieving and decanding. Trans. Br, Mycol. Soc., M. Motiur Rahman, Saidul Alam and Zahed, 2008.46: 235-244. Khan UM. Status of Vesicular Arbuscular (VA)
10. Scheneck, N.C. and Y. Perez, 1987. Manual of the Mycorrhizae in Vegetable Crop Plants of Bangladesh.identification of VAM Fungi, Univ. Florida Wrold. J . Agicr. Sci., 4(6): 704-708.Gainesville. Fl., pp: 1-245. 19. Karthikeyan, C. and T. Selvaraj, 2009. Diversity of
11. Simpson, E.H., 1949. Measurment of diversity. Arbuscular Mycorrhizal Fungi (AMF) on the coastalNature, 163: 688. saline soil of the west coast of Kerala, South India.
12. Frannke –Synder, M., D.D. Douds Jr, L. Galvez, World. J. Agric. Sci., 5(S): 803-809.J.G. Phillips, P. Wagoner, L. Drinkwater and 20. Naveen Krishna Srivastava, Deepak KumarJ.B. Morton, 2001. Divesity of communities of Srivastava and Poonam Singh, 2012. A Preliminaryarbuscular mycorrhizal (AM) fungi present in Survey of the Vesicular Arbuscular Mycorrrhizalconventional versus low –input agricultural sites Status of Vegetable and Fruit Yielding Plants inin estern Pennsylavania. USA. Appl. Soil. Ecol., Eastern U.P. Indian J. L. Sci., 1(2): 79-82.16: 35-48. 21. Ahulu, M.E., A. Gollotte, V. Gianinazzi–Pearson and
13. Zhang, Y., L.D. Guo and R.J. Lui, 2004. Survey of M. Nonaka, 2006. Cooccurring plants forming distinctArbuscular mycorrhizal fungi in deforested and arbuscular mycorrhizal morphologies harbor similarnatural forest land in the subtropical region of AM fungal species. Mycorrhiza., 17: 37-49.Dujiangyan, Southwest China. Plant Soil., 22. Rajkumar, H.G., H.S. Seema and C.P. Sunil Kumar,261: 257-263. 2012. Diversity of arbuscular mycorrhizal fungi
14. Supriya Gaur and Purshotam Kaushik, 2011. Analysis associated with some medicinal plants in Westernof Vesicular Arbuscular Mycorrhiza Associated with Ghats of Karnataka region, India. Woldr. J. Scie. andMedicinal Plants in Uttarakhand State of India. Tech., 2(1): 13-20.World. Appl. Sci. J., 14(4): 645-653. 23. Sharif, M. and A.M. Moawad, 2006. Arbuscular
15. Sharma, S., V. Parkash, S. Kaushish and A. Aggarwal, Mycorrhizal Incidence and Infectivity of Crops in2008. A monograph of Glomus spp. (Glomaceae) in North West Frontier Province of Pakistan. World. J.the Sunflower Rhizosphere of Haryana, India. Agric. Sci., 2(2): 123-132.HELIA., 31. Nr 39,13-18. 24. Aditya Kumar, 2010. Chhavi Mangala, Ashok
16. Sharma, S., V. Parkash, S. Kaushish and Aggarwal and Vipin Parkash, Arbuscular MycorrhizalA.A. Aggarwal, 2009. Monograph of Acaulospora Fungal Dynamics in the Rhizospheric Soil of Fivespp.(VAMFungi) in Sunflower Rhizosphere in Medicinal Plant Species. Middle –East Journal ofHaryana, India. HELIA., 32.Nr(50): 69-76. Scientific Research, 6(3): 281-288.
VOL. 8, NO. 7, JULY 2013 ISSN 1990-6145
ARPN Journal of Agricultural and Biological Science
©2006-2013 Asian Research Publishing Network (ARPN). All rights reserved.
www.arpnjournals.com
571
EXPLOITING THE BIOCONTROL ACTIVITY OF Tricoderma SPP AGAINST ROOT ROT CAUSING PHYTOPATHOGENS
T. Kavitha1 and R. Nelson2
1Department of Microbiology, J. J. College of Arts and Science Pudukkottai, Tamil Nadu, India 2PG and Research Department of Botany, Government Arts College, Ariyalur, Tamil Nadu, India
E-Mail: [email protected] ABSTRACT
The main aim of this investigation was to determine the antagonistic activity of Tricoderma spp isolated from rhizosphere soil of sunflower. Two species namely Trichoderma viride and Trichoderma koningii were isolated. In dual culture method Trichoderma viride showed maximum growth inhibition of 72.20% against Fusarium oxysporum whereas,Trichoderma koningii effectively inhibited Pythium debarianum (57.42%). The result of volatile assay revealed Pythium debarianum was effectively inhibited by both antagonists and in non volatile assay Pythium debarianum was greatly inhibited followed by Fusarium oxysporum, Fusarium javanicum, Macrophomina phaseolina. The Trichoderma viride and Trichoderma koningii were recorded for their maximum cellulolytic and chitinolytic activity (3.6U/ml and 0.37IU/ml, 2.75 IU/ml and0.29IU/ml), respectively. Keywords: Tricoderma spp, phytopathogens, biocontrol, chitinase, cellulase. INTRODUCTION
Fungal Phytopathogens are the cause of many plant diseases and much loss of crop yields, especially in subtropical and tropical regions [1]. Macrophomina phaseolina (Tassi) Goid, a soil borne fungus causes charcoal rot over 500 plant species and has a wide geographic distribution [2]. Chemical fungicides are extensively used in contemporary agriculture. However these products may cause problems such as environmental pollution and have adverse effects on human health. Microorganisms as bio control agents have high potential to control plant pathogens and have no negative effect on the environment (or) other non target organisms.Tricoderma spp are used as effective biocontrol agents against several soil borne fungal plant pathogens including Macrophomina phaseolina, Fusarium spp, pythium spp [3]. The bio control exercised by Tricoderma can occur by several antagonistic mechanisms such as nutrient competition, antibiotic production and mycoparasitism. Mycoparasitism has been reported as the major antagonistic mechanism displayed by Tricoderma spp. After host recognition, Tricoderma spp attaches to the host hyphae via coiling and penetrate the cell wall by secreting cell wall degrading enzymes which allow them to bore holes into the fungal host and extracts nutrients for their own growth. Most phytopathogenic fungi have cell wall that contain chitin as a structural backbone arranged in an regularly ordered layers and , 1-3 glucan as a filling material arranged in an amorphic manner. Chitinases and
, 1-3 glucanases have been directly involved the mycoparasitism interaction between Tricoderma spp and its host [4]. MATERIALS AND METHODS Isolation of antagonist
The fungal antagonists were isolated from the rhizosphere soil of sunflower; using serial dilution and
pour plate technique on potato dextrose agar medium (PDA). The antagonist were purified and identified based on morphological and miroscopical characters. The isolates were maintained on PDA slants at 40C through out the study. Isolation of phytopathogens
Diseased plant tissues were washed under running tap water to remove surface soil and other contaminant. Infected tissues were cut into small pieces and placed in 1% sodium hypochloride for five minutes, placed on PDA plates and incubated at 280C. The cultures were purified by hyphal tip method [5] and maintained on PDA slants by storing it under refrigeration (40C). Phytopathogens isolated from infected tissues were identified based on morphological and microscopical charters. Growth inhibition assay by dual culture method
Interaction between antagonistic fungi and pathogenic fungi were determined by the method of Dennis and Webster [6]. A 5 mm diameter mycelial disc from the margin of the Trichoderma one week-old culture and the pathogens M. phaseolina, Fusarium javanicum, F. oxysporum, Pythium debarianum were placed on the opposite side of the plate at equal distance from the periphery. In control plates (without Trichoderma), a sterile agar disc was placed at opposite side of the pathogen M. phaseolina inoculated disc. The plates were incubated at 28 ± 2°C and observed after 7 days. Assay for volatile metabolites of Trichoderma spp
Productions of volatile metabolites by Trichoderma spp were assayed as described by Dennis and Webster [6] and Goyal et al., [7] with slight modifications. The Trichoderma isolates were centrally inoculated by placing 3mm disc taken from three days old cultures on the PDA plates and incubated at 28 ± 2° C for three days.

VOL. 8, NO. 7, JULY 2013 ISSN 1990-6145
ARPN Journal of Agricultural and Biological Science
©2006-2013 Asian Research Publishing Network (ARPN). All rights reserved.
www.arpnjournals.com
572
The top of each petridish was replaced with bottom of PDA plate inoculated centrally with the pathogen. Petridish with PDA medium without Trichoderma spp at the lower lid and the upper lid with pathogens was maintained as control. The pair of each petridishes were sealed together with paraffin tape and incubated for 4-6 days. After incubation the inhibition of mycilial growth was calculated. Assay for non volatile metabolites of Trichoderma spp
The effects of non volatile metabolites produced by the Trichoderma spp were determined by following the methods of Dennis and Webster [6]. The isolates of Trichoderma spp were inoculated in 100ml sterile potato dextrose broth in 250ml conical flasks and incubated at 28 ± 2°C for 15 days. After incubation the cultures were filtered through Millipore filter and culture filtrates were added to molten PDA medium (400C) to obtain a final concentration of 10% (v/v). The medium was poured into petriplates and after solidification 3mm disc of the pathogens were placed centrally and incubated at 28 ± 2° C. Control plates were maintained without amending the culture filtrate. The percent of growth inhibition in all the above experiments were calculated by the formula I = C - T x 100 C Where I = Percentage of inhibition C = Growth of mycelium in control T = Growth of mycelium in treatment Assay for enzyme activity
For assay of enzyme activity, Trichoderma species were grown on minimal synthetic medium (MSM) containing the following components (in grams per liter): MgSO4.7H2O, 0.2; K2HPO4, 0.9; KCl, 0.2; NH4NO3, 1.0; FeSO4.7H2O, 0.002; MnSO4, 0.002 and ZnSO4, 0.002. The medium was supplemented with the appropriate carbon source for cellulose and chinase assay (commercially available Carboxy methyl cellulose, Chitin). The pH was set to 6.3 with 50mM phosphate buffer and autoclaved at 15 lps for 20 min. The medium was inoculated with a spore suspension to give a final concentration of ~5 ×10⁶ conidia per milliliter and placed on a rotary shaker at 150 rpm at 250C for different time intervals. The cultures were harvested at 24, 48, 72 hour of incubation and were filtered through Whatman No. 44 filter paper and finally centrifuged at 12000 rpm for 10 min at 40C to get cell-free culture filtrate which were then used as enzyme source. Assay for cellulase activity
Cellulase activity was assayed following the method of Miller [8]. The assay mixture contained 1 ml of 0.5% pure cellulose (Sigma Co.) suspended in 50 mM phosphate buffer (pH 5.0) and 1 ml of culture filtrates of different Trichoderma strains. The reaction mixture was incubated for 30 min at 50°C. The blanks were made in
the same way using distilled water in place of culture filtrate. The absorbance was measured at 540nm and the amount of reducing sugar released was calculated from the standard curve of glucose. One unit of cellulose activity is defined as the amount of enzyme that catalyzed 1.0 µ mol of glucose per minute during the hydrolysis reaction. Assay for chitinase activity
It was measured using colloidal chitin as substrate [9]. Enzyme solution (0.5 ml) was added to 0.5 ml of substrate solution, which contained 1% colloidal chitin in phosphate buffer (0.05 M, pH 5.2) and 1 ml distilled water. The mixture was then incubated in shaking water bath at 50°C for 10 min, thereafter 3 ml of 3; 5-dinitrosalicyclic acid reagent was added. The mixture was then placed in a boiling water bath for 5 min, after cooling, the developed color, as indication to the quantity of released N -acetylglucosamine (NAGA), was measured spectrophotometrically at 575 nm. The amount of NAGA was calculated from standard curve of NAGA. RESULTS AND DISCUSSIONS
Table-1. Percent of inhibition by Trichoderma isolates after 7 days of inoculation in dual culture.
Pathogens Antagonists
T. viride T. koningi Pythium debarianum 66.24 57.42
Fusarium oxysporum 72.20 52.75
Fusarium javanicum 64.43 44.54 Macrophomina phaseolina
42.36 47.24
Table-2. Percent of inhibition by Trichoderma isolates
in volatile assay method.
Pathogens Antagonists
T. viride T. koningi Pythium debarianum 73.33 60.17
Fusarium oxysporum 60.28 54.20
Fusarium javanicum 68.2 59.4 Macrophomina phaseolina
49.10 40.9
Table-3. Percent of inhibition by Trichoderma isolates
in non volatile (culture filtrates) assay method.
Pathogens Antagonists
T. viride T. koningi Pythium debarianum 76.66 60.21
Fusarium oxysporum 62.10 57.21
Fusarium javanicum 66.76 54.43 Macrophomina phaseolina
39.67 37.67

VOL. 8, NO. 7, JULY 2013 ISSN 1990-6145
ARPN Journal of Agricultural and Biological Science
©2006-2013 Asian Research Publishing Network (ARPN). All rights reserved.
www.arpnjournals.com
573
Figure-1. Cellulase enzyme activity of T. viride and T. koningii.
Figure-2. Chitinase enzyme activity of T. virid andT. koningii.
Growth inhibition assay by dual culture method
The antimicrobial metabolites produced by Trichoderma spp are effective against wide range of phytopathogens eg. Fusarium moniliform, F. oxysporum,Rhizoctonia solani, and Colletotrichum capsici, Alternaria alternate, F. solani, Macrophomina phaseolina,Sclerotium rolfsii, Pythium specieses [10-13]. In the present investigation two species of Trichodema were isolated and tested for their antagonistic activity against four different plant pathogens. The results of dual culture assay revealed that the maximum inhibitory activity of Trichodema viride was 72.20% against Fusarium oxysporum and minimum inhibition was 42.36% against M. phaseolina. T. koningi showed maximum inhibition against Pythium debarianum (57.42%) and minimum inhibition against Fusarium javanicum (44.54%) (Table-1). Similar result has been observed [14]. In their studies T. viride and T. koningii showed highest inhibition of 74.3%, 55.5% against M. phaseolina respectively (Figure-1). Assay for volatile and non volatile metabolites of Trichoderma spp
In volatile assay it was observed that the isolates of T. viride and T. koningi effectively inhibited the Growth of Pythium debarianum (73.33%, 60.17%, respectively). Trichoderma produces several volatile compound such as Ethylene, Hydrogen cyanine, Aldehydes and Ketones
which play an important role in controlling the plant pathogens [15]. The study non volatile assay revealed that both the antagonist effectively inhibited the mycelial growth of phytopathogen in the following order Pythiumdebarianum > Fusarium javanicum >, Fusarium oxysporum >, Macrophomina phaseolina. The volatile and non volatile copound from Trichoderma effectively inhibited the growth of Colletotrichum capsici [16]. Muthukumar et al., [17] and Christy Jeyaseelan et al., [18]
recorded maximum growth inhibition of T .viride against Pythium aphanidermatum through more production of volatile and non volatile compounds. Assay for cell wall degrading enzyme activity
Chitinolytic and glucanolytic (fungal cell wall-degrading enzymes) have been suggested to be the primary determinants of biocontrol by Trichoderma spp [19]. The highest cellulase activity of the isolate of T. viride and T. koningii observed were 3.15IU/ml and 2.75 IU/ml, respectively after 72 hours incubation. Vinit Kumar Mishra, [20] observed that the T. viride exhibited highest cellulase activity of 3.6U/ml and it was found to be suppress the mycelial growth of Pythium aphanidermatum. In this investigation the maximum chitinase enyme was 0.37IU/ml in the case of T. viride, whereas T. koningii exhibited 0.29IU/ml activity. Eman Faith Sharaf et al., [21] reported the maximum production of chitinase enzyme (23.8U/ml) by a most potent T. viride isolate using colloidal chitin prepared from Shrimp shell waste as sole carbone source. Sevugaperumal Ganesan and Rajagobal Sekar [22] explored the antagonistic activity of nine species of Trichoderma against Rhizactonia solani, and reported that the chitinolytic activity of the antagonists ranged from 5.51IU/ml to 0.12 IU/ml. T. harizianum culture filtrates, possessing chitinase and glucanase activities, were capable of hydrolyzing dried or fresh mycelium of the phytopathogenic fungus Sclerotium rolfsii. Growth of Sclerotium rolfsii was significantly inhibited by the enzyme preparations from T. harizianum [23]. Agrawal and Kotasthane [24] evaluated the production of chitinase enzyme by Trichoderma spp using colloidal chitin which was derived from the cell wall of plant pathogen Rhizactonia and commercial chitin. REFERENCES [1] Brimner T. A. and G.J. Bolannd. 2003. A review of
the non-target effects of fungi used to biologically control plant diseases. Agr. Ecosyst. Environ. 100(1): 3-16.
[2] Srinivastava A.K., T. Singh, T. K. Jana and D. K. Arora. 2001. Induced resistance and control of charcoal rot in Cicer arietinuns (Chickpea) by Pseudomonas fluorescens. Can. J. Bot. 79: 787-795.
[3] Howell C.R. 2003. Mechanisms employed by Trichoderma Species in the biological control of plant diseases. Plant diseases. (87): 4-10.

VOL. 8, NO. 7, JULY 2013 ISSN 1990-6145
ARPN Journal of Agricultural and Biological Science
©2006-2013 Asian Research Publishing Network (ARPN). All rights reserved.
www.arpnjournals.com
574
[4] Kubickek C.P., R.L Mach, C.K Peterbaur and M. Lorito. 2001. Trichoderma: from genes to biocontrol. J. Plant Pathol. 83: 11-24.
[5] Sinclair J.B. and O.D. Dhingra. 1985. Basic Plant Pathology Method. CRC Press, Inc. Corporate Blud, MW Boca Rotam, Florida, USA.
[6] Dennis C. and J. Webster. 1971. Antagonistic properties of Species group of Trichoderma II. Production of non-volatile antibiotics. Trans. Br. Mycol. Soc. 57: 41-48.
[7] Goyal S.P., Jandaik C.L. and Sharma V.P. 1994. Effect of weed fungi metabolites on the mycelial growth of A. bisporus (Lang.). Imbach. Mushroom Research. 3: 69-74.
[8] Miller G.L. 1959. Use of dinitrosalicylic acid reagent for determination of reducing sugar. Analytical chem. 31: 426-428.
[9] Bindo P., T. Puztahelyi, V. Nagar, C. Sandhya, G. Szakacs, I. Pocsi and A. Podey. 2005. Production and purification of extracellular chitinases from Pennicillium aculeatum NRRL2129 under solid state fermentation. Enz. Microbiol. Technol. 36: 880-887.
[10] Rajappan K. and B. Ramaraj. 1999. Evaluation of fungal and bacterial antagonist against Fusarium moniliforme causing wilt of Cauliflower. Annals of Plant Protection Society. 7(2): 205-207.
[11] Choudhary Sharfuddin and Reena Mohanka. 2012. Invitro antagonism of indigenous Trichoderma isolates against phytopathogen causing wilt of Lentil. Int. J. Lifesci. Pharma Res. 2: 195-202.
[12] Mishra B. K., Rohitkumar Mishra, R.C. Mishra, Amit Kumar Tiwari, Ramesh Singh yadav and Anupam Dikshit. 2011. Biocontrol efficacy of Trichoderma viride isolates against fungal plant pathogens causing disease in Vigna radiata L. Arch. Appl. Sci. Res. 3(2): 361-369.
[13] Anita Patil, Aarti Laddha, Ashwin Lunge, Hariprasad Paikrao and Shubhada Mahure. 2012. In vitro antagonistic properties of Trichoderma species against Tomato root rot causing Pythium Species. Int. J. Sci, Environ. Technol. 1(4): 302-305.
[14] Gajera H.P., R.P. Bamharolia, S.V. Patel, T.J. Khatrani and B.A. Goalkiya. 2012. Antagonism of Ttrichoterma spp against Macrophomina phaseolina, Evaluation of coiling and cell wall degrading enzymatic activities. J. plant pathol Microb. 3: 149.
[15] Vey A., R. E. Hoagland and T.M. Butt. 2001. Toxic metabolites of fungal biocontrol agents. Fungi as
biocontrol agents: Progress, Problems and Potential. Butt TM, Jackson C, N (Eds). 311-346 CAB international, Bristol.
[16] Ajith P.S. and N. Lakshmidevi. 2010. Effect of
volatile and non volatile compounds from Trichoderma spp against Colletotrichum capsici incitant of Anthracnose on Bell peppers. Nature and science. 8(9): 265-269.
[17] Muthukumar A., A. Eswaran and K. Sanjeevkumar. 2011. Exploitation of Trichoderma spp on the growth of Pythium aphanidermatum in chilli. Braz. J. Microbiology. 42: 1598-1607.
[18] Christy Jeyaseelan E., S. Tharmmila and K. Niranjan. 2012. Antagonistic activity of Trichoderma spp and Bacillus spp against Pythium aphanidermatum isolated from tomato damping off. Arc. Appl. Sci. Res. 14(4): 1623-1627.
[19] Donzelli B. G. and G.E. Harman. 2001. Interaction of ammonium, glucose, and chitin regulates the expression of cell wall-degrading enzymes in Trichoderma atroviride strain P1. Appl. Environ. Microbiol. 67(12): 5643-5647.
[20] Vinit Kumar Mishra. 2010. In vitro antagonism of Trichoderma species against Pythium aphanidermatum. Journal. Phytol. 2(9): 28-35.
[21] Eman Fathi Sharaf, Abd El-Aziz qablan El- Sarrany and Mai El- Deeb. 2012. Biorecycling of Shrimp Shell by Trichoderma viride for production of antifungal chitinase. Afr. J. Microbiol. Res. 6(21): 4538-4545.
[22] Sevugaperumal Ganesan and Rajagobal Sekar. 2011. Screening of Biocontrol Agents against Rhizoctonia solani Causing Web Blight Disease of Groundnut (Arachis hypogaea L.). In: Pesticides in the Modern World -Pests Control and Pesticides Exposure and Toxicity Assessment. Margarita Stoytcheva (Ed). In Tech. pp. 128-140.
[23] Katatny M.H., W. Somitsch, K.H. Robra, M.S. Katatny and G.M. Gijbitz. 2000. Production of chitinase and -1, 3 glucanase by Trichoderma harzianum for control of the phytopatogenic Fungus Sclerotium rolfsii. Food Technol. Biotechnol. 38(3): 173-180.
[24] Toshy Agarwal and Anil S Kotasthane. 2012. Chitinolytic assay of indigenous Trichoderma isolates collected from different geographical location of Chhattisgarh in central India. htt: // www.Springer plus.com.


![Untitled-1 [cmloboconstructions.com]cmloboconstructions.com/CMLOBO-E-Brochure.pdf · Candolim - 10.7 kms, Sinquerim - 13.1 kms, Ashvem - 12.8 kms, Mandrem - 16.4 kms, Arambol - 17.7](https://img.pdfslide.net/doc/110x75/5f584fca76ae4700743850b3/untitled-1-candolim-107-kms-sinquerim-131-kms-ashvem-128-kms-mandrem.jpg)


![Untitled-1 [img.staticmb.com] · 2020-01-08 · Dholeshwar Temple - 0.3 kms proposed Riverfront 0.3 kms Indroda park I kms BAPS School I kms Swaminarayan Dham - I kms n Info city-IT](https://img.pdfslide.net/doc/110x75/5f8b75175802ac46cf710363/untitled-1-img-2020-01-08-dholeshwar-temple-03-kms-proposed-riverfront.jpg)