Embed Size (px)
Citation preview
PAPI and Hardware Performance Analysis Tools
Philip Mucci, Research ConsultantInnovative Computing Laboratory/UTK
Performance Evaluation Research Center/[email protected]
Center for Parallel Computers, Royal Institute of Technology
Performance Workshop, May 26th, 2003
May 27th, 2003 1
The PAPI Interface
PAPI provides two standardized APIs to access the underlying performance counter hardware
• A low level interface designed for tool developers and expert users.
• The high level interface is for application engineers.
May 27th, 2003 1
Overview
• PAPI– Quick Overview– 3.0 Feature Outline
• Performance Analysis Tools• Trends
May 27th, 2003 1
PAPI Goal
• To understand why the application performs as it does.– Optimize the application's performance.– Evaluate the algorithms efficiency.– Generate an application signature.– Develop a performance model.
• Data is NOT PORTABLE, but the interface is...
May 27th, 2003 1
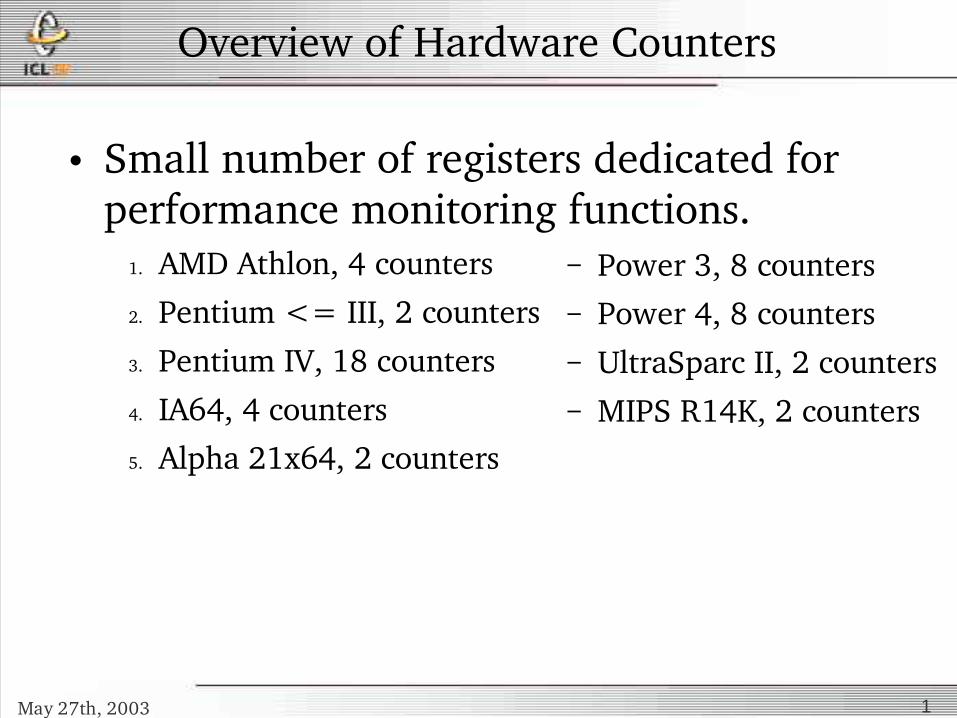
Overview of Hardware Counters
• Small number of registers dedicated for performance monitoring functions.
1. AMD Athlon, 4 counters
2. Pentium <= III, 2 counters
3. Pentium IV, 18 counters
4. IA64, 4 counters
5. Alpha 21x64, 2 counters
– Power 3, 8 counters– Power 4, 8 counters– UltraSparc II, 2 counters– MIPS R14K, 2 counters
May 27th, 2003 1
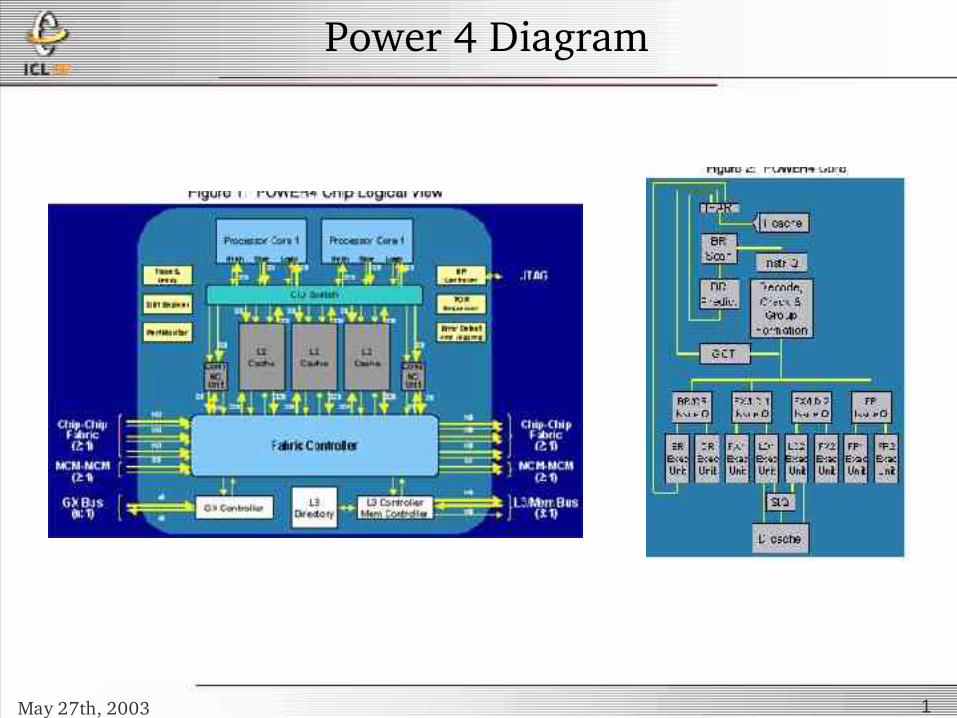
Power 4 Diagram

May 27th, 2003 1
Itanium 1 Block Diagram
May 27th, 2003 1
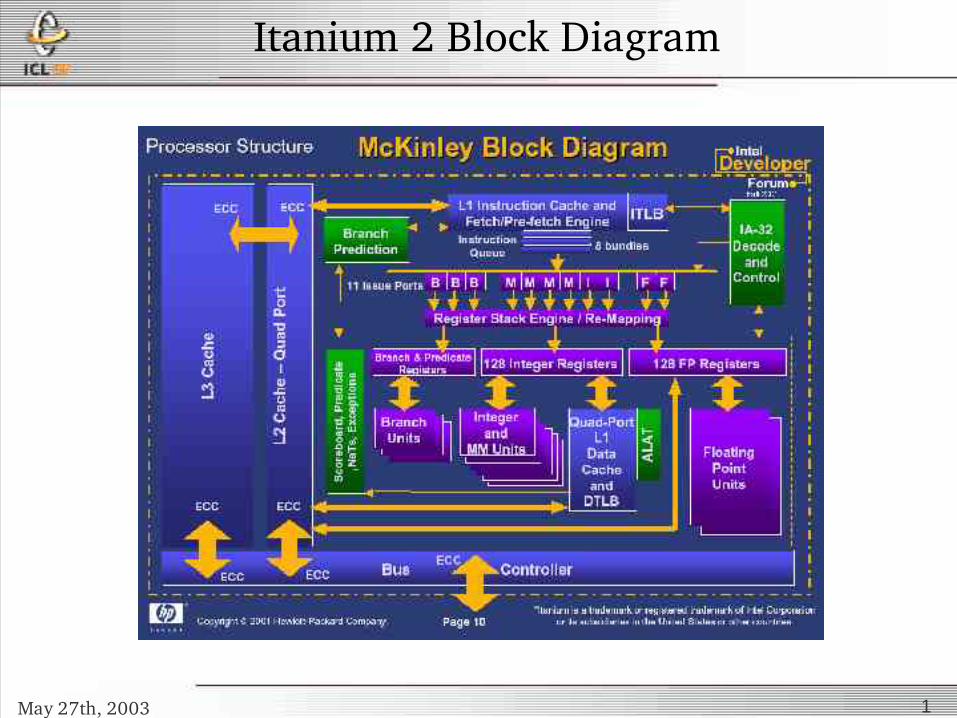
Itanium 2 Block Diagram
May 27th, 2003 1
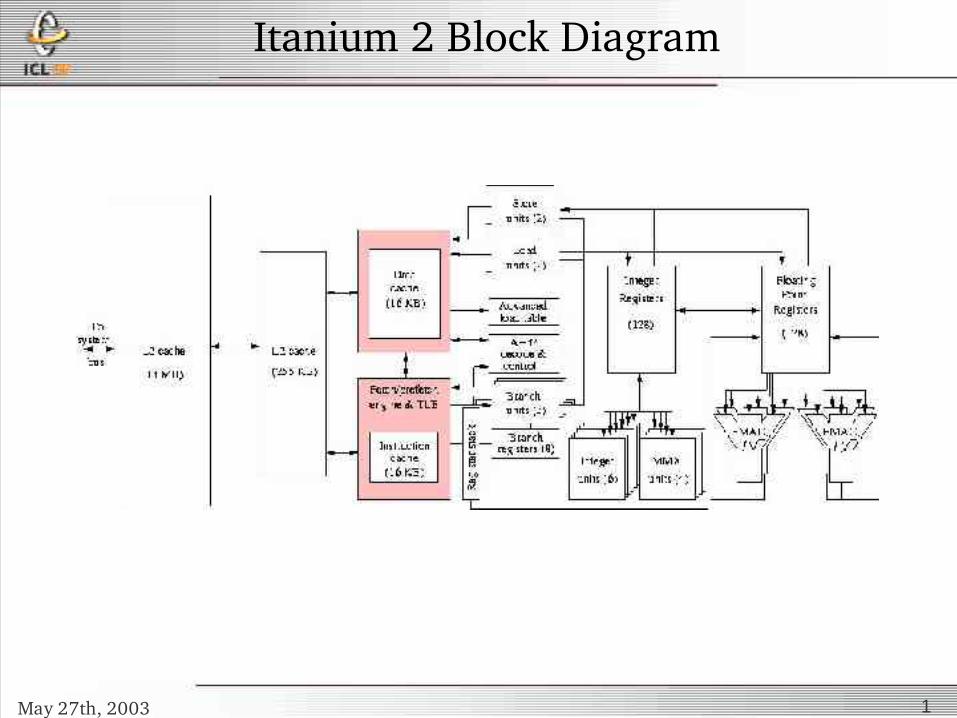
Itanium 2 Block Diagram

May 27th, 2003 1
PDC Itanium 2 System Architecture
May 27th, 2003 1
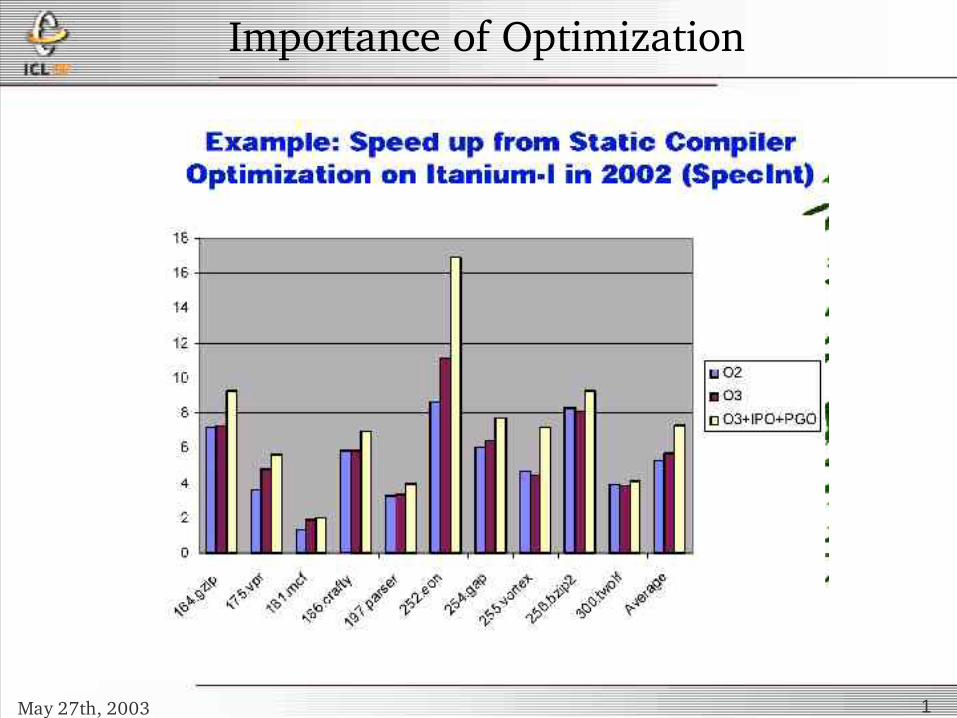
Importance of Optimization

May 27th, 2003 1
PAPI Implementation
Tools
PAPI Low LevelPAPI High Level
Hardware Performance Counters
Operating System
Kernel Extension
PAPI Machine Dependent SubstrateMachine SpecificLayer
PortableLayer

May 27th, 2003 1
Preset Events
• Proposed standard set of event names deemed most relevant for application performance tuning
• No standardization of the actual definition
• Mapped to native events on a given platform

May 27th, 2003 1
Preset Events 2
• PAPI supports approximately 100 preset events.– Preset events are mappings from symbolic
names to machine specific definitions for a particular hardware event.
• Example: PAPI_TOT_CYC
– PAPI also supports presets that may be derived from the underlying hardware metrics
• Example: PAPI_L1_DCM
May 27th, 2003 1
Sample Preset Listing
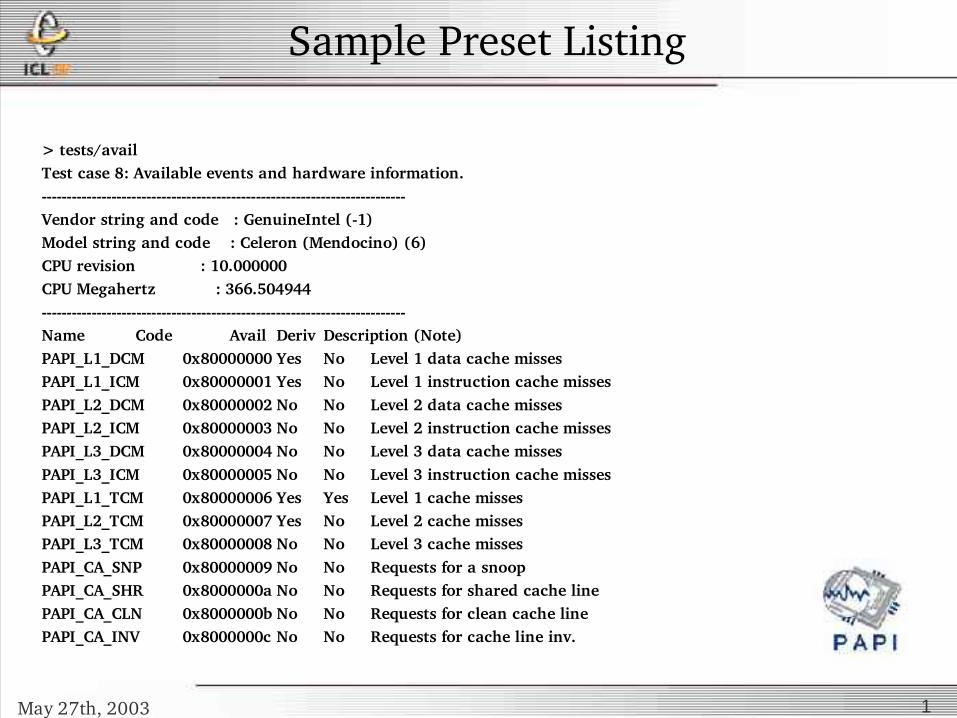
> tests/availTest case 8: Available events and hardware information.Vendor string and code : GenuineIntel (1)Model string and code : Celeron (Mendocino) (6)CPU revision : 10.000000CPU Megahertz : 366.504944Name Code Avail Deriv Description (Note)PAPI_L1_DCM 0x80000000 Yes No Level 1 data cache missesPAPI_L1_ICM 0x80000001 Yes No Level 1 instruction cache missesPAPI_L2_DCM 0x80000002 No No Level 2 data cache missesPAPI_L2_ICM 0x80000003 No No Level 2 instruction cache missesPAPI_L3_DCM 0x80000004 No No Level 3 data cache missesPAPI_L3_ICM 0x80000005 No No Level 3 instruction cache missesPAPI_L1_TCM 0x80000006 Yes Yes Level 1 cache misses PAPI_L2_TCM 0x80000007 Yes No Level 2 cache misses PAPI_L3_TCM 0x80000008 No No Level 3 cache misses PAPI_CA_SNP 0x80000009 No No Requests for a snoop PAPI_CA_SHR 0x8000000a No No Requests for shared cache linePAPI_CA_CLN 0x8000000b No No Requests for clean cache linePAPI_CA_INV 0x8000000c No No Requests for cache line inv.

May 27th, 2003 1
Native Events
• PAPI supports native events:– An event countable by the CPU can be
counted even if there is no matching preset PAPI event.
– The developer uses the same API as when setting up a preset event, but a CPUspecific bit pattern is used instead of the PAPI event definition
May 27th, 2003 1
Highlevel Interface
• Meant for application programmers wanting coarsegrained measurements
• As easy to use as IRIX calls• Requires no setup code• Restrictions:
– Allows only PAPI presets
– Not thread safe
– Only aggregate counters

May 27th, 2003 1
Lowlevel Interface
• Increased efficiency and functionality over the high level PAPI interface
• Approximately 60 functions (http://icl.cs.utk.edu/projects/papi/files/html_man/papi.html#4)
• Threadsafe (SMP, OpenMP, Pthreads)• Supports both presets and native events
May 27th, 2003 1
Lowlevel Functionality
• API Calls for:– Counter multiplexing– Callbacks on user defined overflow value– SVR4 compatible profiling– Processor information– Address space information– Static and dynamic memory information– Accurate and low latency timing functions– Hardware event inquiry functions– Eventset management functions– Simple locking operations
May 27th, 2003 1
PAPI and Multiplexing
• Multiplexing allows simultaneous use of more counters than are supported by the hardware.– This is accomplished through timesharing the
counter hardware and extrapolating the results.
• Users can enable multiplexing with one API call and then use PAPI normally.
May 27th, 2003 1
Interrupts on Counter Overflow
• PAPI provides the ability to call userdefined handlers when a specified event exceeds a specified threshold.
• For systems that do not support counter overflow at the hardware level, PAPI emulates this in software at the user level.– Code must run a reasonable length of time.
May 27th, 2003 1
Hardware Profiling
• On overflow of hardware counter, dispatch a signal/interrupt.
• Get the address at which the code was interrupted.
• Store counts of interrupts for each address.
• Vendor/GNU prof and gprof (pg and –p compiler options) use interval timers.

May 27th, 2003 1
Results of Statistical Profiling
• The result: A probabilistic distribution of where the code spent its time and why.
Program Text Addresses
EventCount
May 27th, 2003 1
For More Information
• http://icl.cs.utk.edu/projects/papi/– Software and documentation
– Reference materials
– Papers and presentations
– Thirdparty tools
– Mailing lists
May 27th, 2003 1
PAPI 2.3.4 Release
• Additional Platforms– IBM PPC604, 604e, Power 3– Intel x86– Sun UltraSparc I/II/III– SGI MIPS R10K/R12K/R14K– Compaq Alpha
21164/21264 with DADD/DCPI
– Itanium– Itanium 2– Power 4– AIX 5, Power 3, 4
• Enhancements– Static/dynamic
memory info– Multiplexing
improvements– Lots of bug fixes
May 27th, 2003 1
PAPI 3.0
• Using lessons learned from years earlier– Substrate code: 90% used only 10% of the
time
• I Want to formalize the API during this visit!
• Redesign for:– Robustness– Feature Set– Elegance– Portability
May 27th, 2003 1
Some PAPI 3.0 Features
• Multiway multiplexing– Use all available counter registers instead of
one per time slice. • Superb performance
– Example: On Pentium 4, a PAPI_read() costs 230 cycles, while register access alone costs 100 cycles.
• Full native and programmable event support– Thresholding– Instruction matching– Per event counting domains
May 27th, 2003 1
PAPI 3.0 Features 2
• Thirdparty interface– Allows PAPI to control counters in
other processes• Internal timer/signal/thread
abstractions– Support signal forwarding
• Additional internal layered API to support robust extensions
May 27th, 2003 1
PAPI 3.0 Features 3
• Advanced profiling interface
– Support profiling on multiple counters
– Support hardware or operating system assisted profiling
• New sampling interface
– P4, IA64 provide Event Address Registers of BTB misses, Cache misses, TLB misses, etc...
• Revised memory API
– Process footprint
May 27th, 2003 1
PAPI 3.0 Features 4
• Systemwide and process wide counting implementation
• High level API made thread safe• New language bindings
– Java
– Lisp
– Matlab

May 27th, 2003 1
PAPI 3.0 Release Targets
• First release expected Summer, 2003• Additional platforms
– Cray X1
– AMD Opteron/K8
– Nec SX6
– Blue Gene (BG/L)
May 27th, 2003 1
PAPI Tools
May 27th, 2003 1
Paradyn from U. Wisconsin
• From Barton Miller’s Group • DynInst based dynamic discovery of
bottlenecks• Different visualization plugins• Supports all forms of parallelism• New version will do discovery based on
hardware metrics– Memory stall time
– Cache misses
May 27th, 2003 1
Tuning and Analysis Utilities
• From Allen Maloney’s Group at U. Oregon
• Source or binary based• Different visualization plugins• Supports all forms of parallelism• Integration with Vampir

TAU Performance System Architecture
EPILOG
Paraver
May 27th, 2003 1
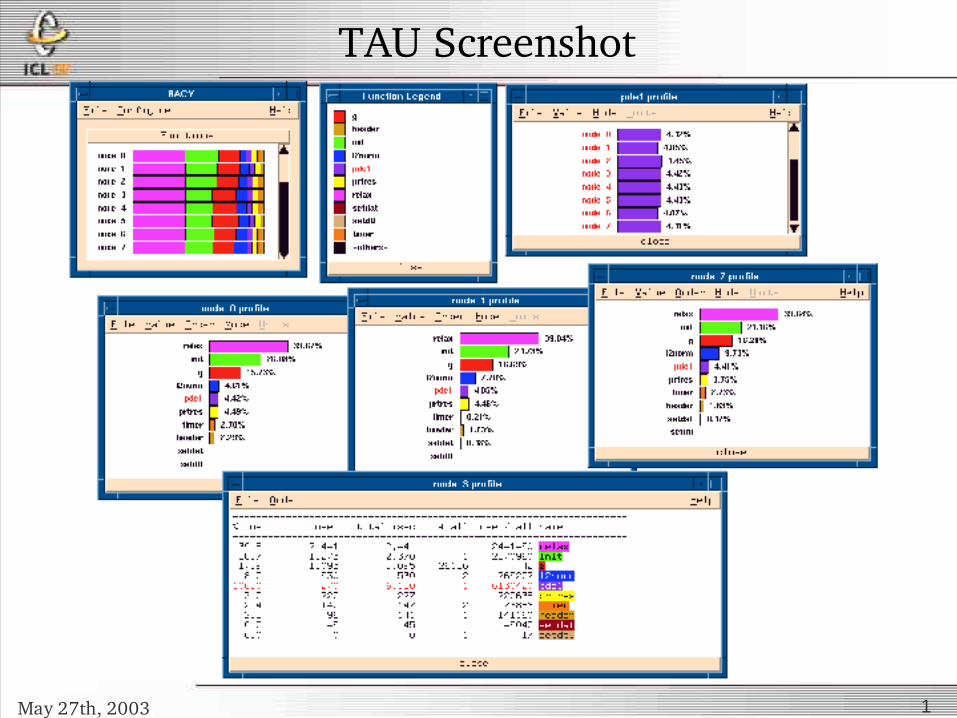
TAU Screenshot
May 27th, 2003 1
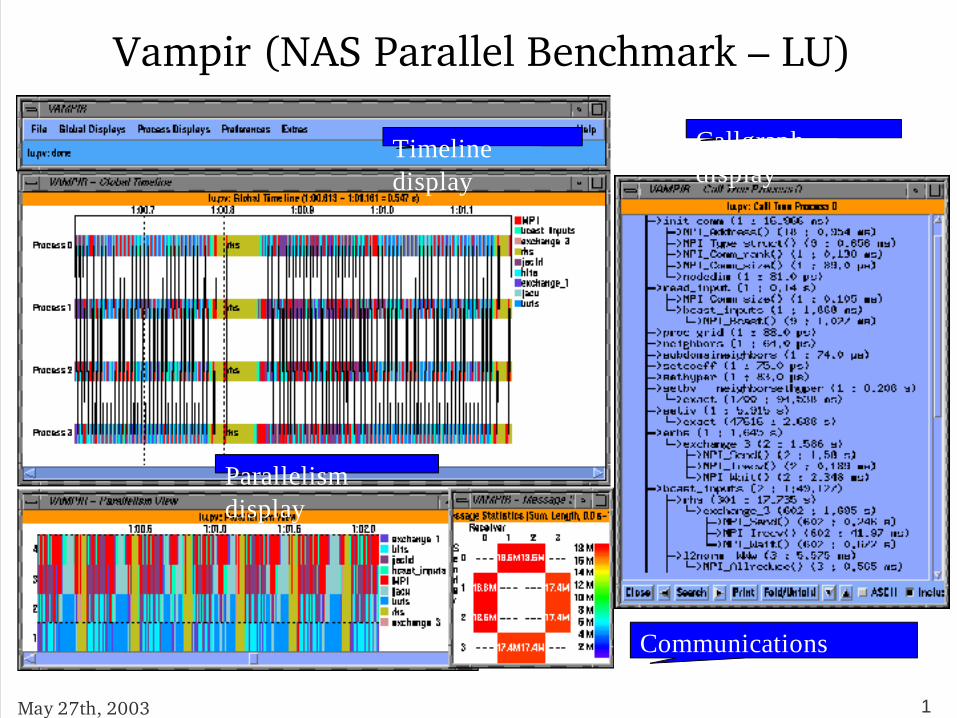
Vampir (NAS Parallel Benchmark – LU)
Timeline display
Callgraph display
Communications display
Parallelism display
May 27th, 2003 1
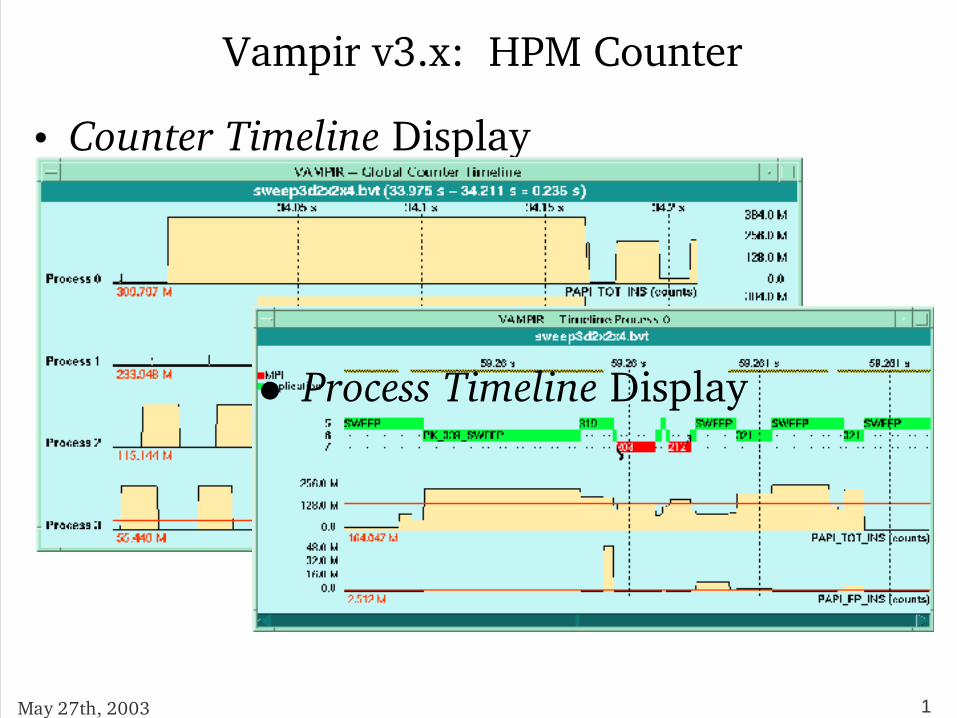
Vampir v3.x: HPM Counter
• Counter Timeline Display
• Process Timeline Display

May 27th, 2003 1
SvPablo from UIUC
• Source based instrumentation of loops and function calls
• Supports serial and MPI jobs
• Freely available
• Rough F90 parser

May 27th, 2003 1
Vprof from Sandia National Laboratory
• Based on statistical sampling of the hardware counters
• Must instrument the source
• Ported to other architectures for generalized use
• Parallel codes with some modification
• Not actively supported
http://aros.ca.sandia.gov/~cljanss/perf/vprof

May 27th, 2003 1
HPCToolkit from Rice University
• Tools for:– Collecting raw statistical profiles
– Conversion of profiles into platform independent XML
– Synthesizing browsable representations that correlate metrics with source code
• http://www.hipersoft.rice.edu/hpctoolkit

May 27th, 2003 1
HPCToolkit Tools
• Collection: papirun/hvprof, equivalent to SGI's “ssrun”
• Loop/CFG recovery from binary: bloop• Data formatting: papiprof• Data display and exploration: hpcview• Call stack profiles: csprof• Data is aggregated into an XML database• HPCView is a Java applet that generates
dynamic HTML

May 27th, 2003 1
HPCView Screenshot
May 27th, 2003 1
Trapper in PAPI Tools Tree
• Tool that allows the user to write functions that get executed at:– Process Creation/Deletion– Thread Creation/Deletion
• Actually, any function can be “preempted”.• The object code of the application isn’t
modified.• Works by “preloading” special shared libraries
and overloading function calls in cooperation with the runtime linker.
May 27th, 2003 1
PerfSuite from NCSA
• Libraries and tools for machine information, memory information, aggregate counts, derived metrics and statistical profiles
• Targeted for x86 and IA64 systems• http://perfsuite.ncsa.uiuc.edu
May 27th, 2003 1
PerfSuite Tools
• psinv: Gather information on a processor and the PAPI events it supports
• psrun: Collection of aggregate/derived counts or statistical profiles of unmodified binaries
• psprocess: Formatting and output of psrun data into text or HTML
May 27th, 2003 1
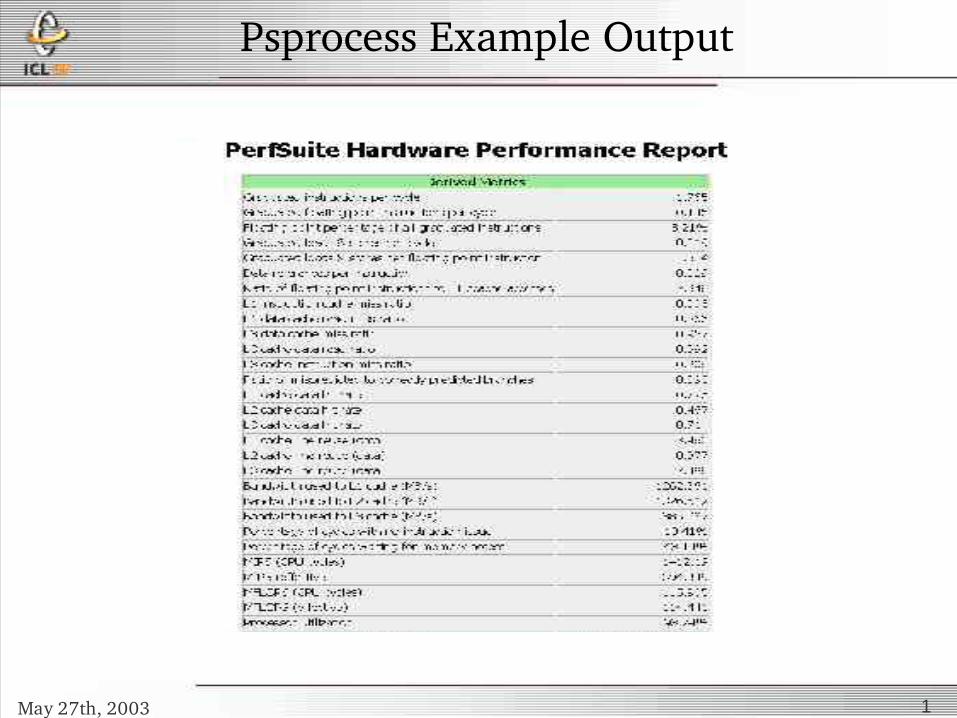
Psprocess Example Output

May 27th, 2003 1
Psrun Statistical Profile Example Output
Function Summary Samples Self % Total % Function
1839543 35.01% 35.01% inl3130 541829 10.31% 45.32% ns5_core 389741 7.42% 52.74% inl0100 355349 6.76% 59.51% spread_q_bsplines 213172 4.06% 63.56% gather_f_bsplines 200546 3.82% 67.38% do_longrange 182691 3.48% 70.86% make_bsplines 149924 2.85% 73.71% ewald_LRcorrection 112883 2.15% 75.86% inl3100 105317 2.00% 77.86% solve_pme 92257 1.76% 79.62% flincs

May 27th, 2003 1
PerfSuite Libraries
• libperfsuite: Provides simple wrappers for machine information, process memory usage and highprecision timing
• libpshwpc: Provides simple wrappers that are used to collect hardware performance data
May 27th, 2003 1
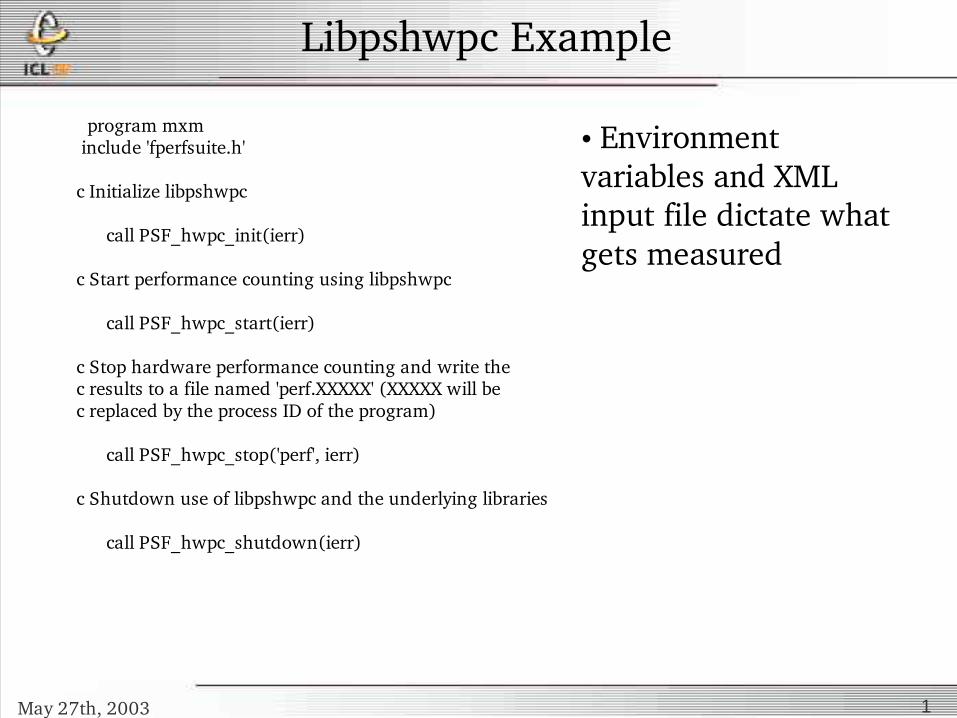
Libpshwpc Example
program mxm include 'fperfsuite.h' c Initialize libpshwpc call PSF_hwpc_init(ierr) c Start performance counting using libpshwpc call PSF_hwpc_start(ierr)
c Stop hardware performance counting and write thec results to a file named 'perf.XXXXX' (XXXXX will bec replaced by the process ID of the program) call PSF_hwpc_stop('perf', ierr)
c Shutdown use of libpshwpc and the underlying libraries call PSF_hwpc_shutdown(ierr)
• Environment variables and XML input file dictate what gets measured
May 27th, 2003 1
HPMToolkit from IBM ACTC
• Command line utility to gather aggregate counts.– PAPI version has been tested on IA32 & IA64
– User can manually instrument code for more specific information
– Reports derived metrics like SGI’s perfex
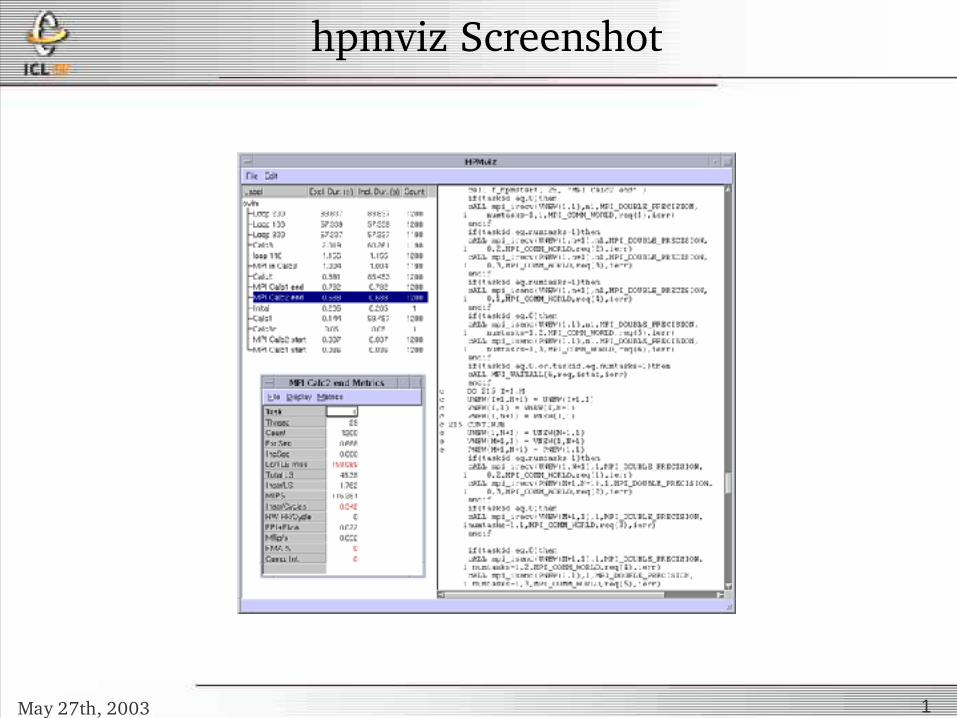
• Libhpm for manual instrumentation• Hpmviz is a GUI to view resulting datahttp://www.ncsa.uiuc.edu/UserInfo/Resources/Software/Tools/HPMToolkit
May 27th, 2003 1
hpmviz Screenshot
May 27th, 2003 1
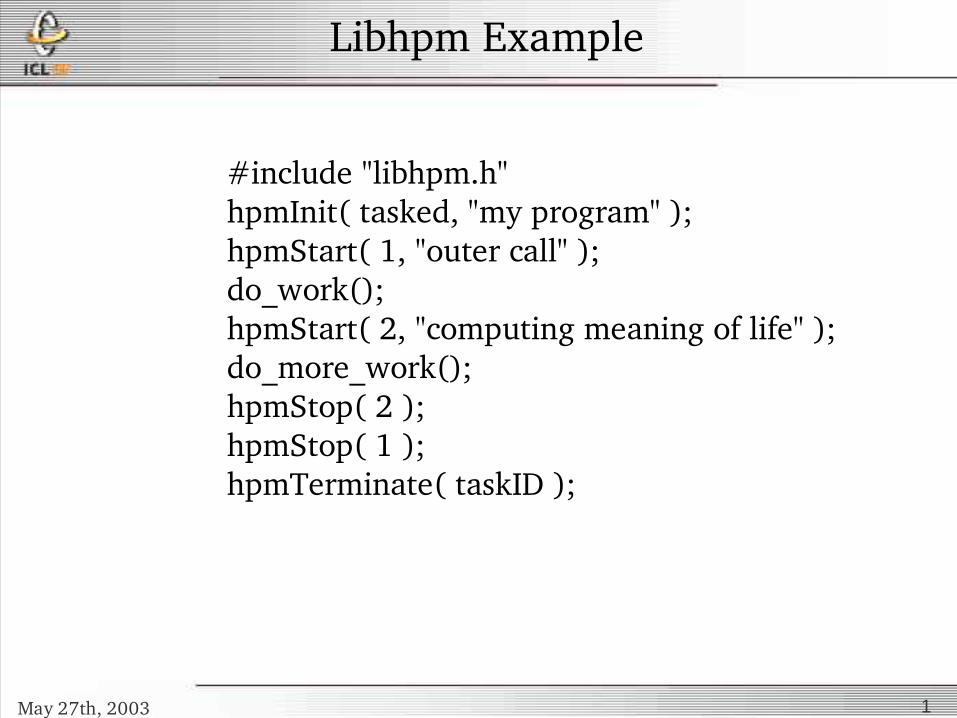
Libhpm Example
#include "libhpm.h" hpmInit( tasked, "my program" ); hpmStart( 1, "outer call" ); do_work(); hpmStart( 2, "computing meaning of life" ); do_more_work(); hpmStop( 2 ); hpmStop( 1 ); hpmTerminate( taskID );
May 27th, 2003 1
ToolGear Overview
• Dynamic instrumentation and analysis suite from LLNL
• Based on DPCL from IBM– Tested only on AIX
• Qt Front end can theoretically accept data from any source
• GUI displays instrumentable points• Instrumented points update display with data
in real time• http://www.llnl.gov/CASC/tool_gear
May 27th, 2003 1
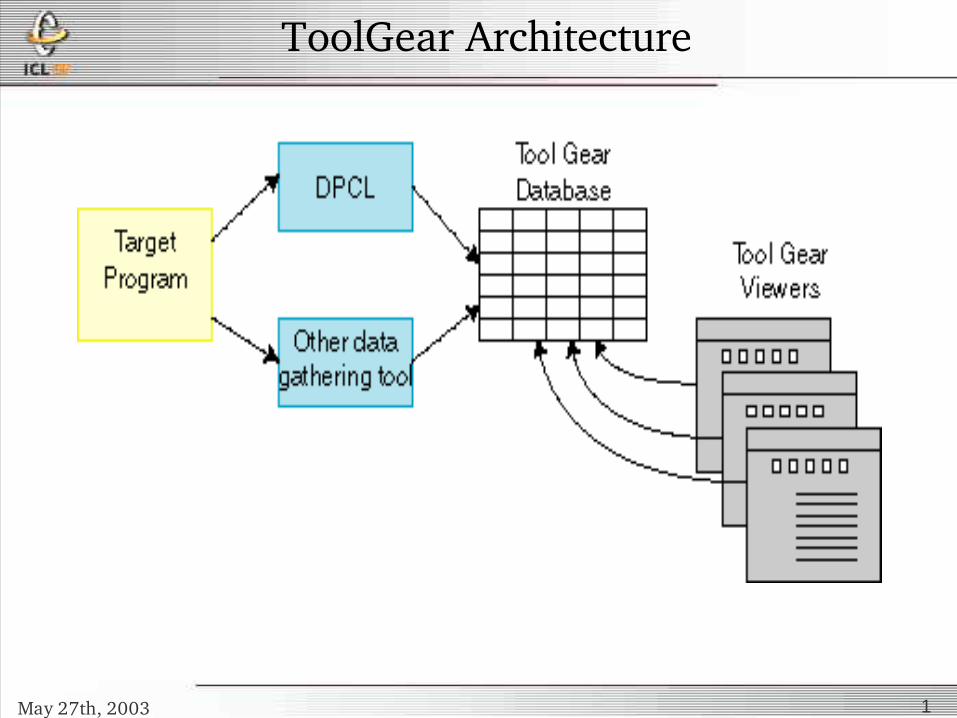
ToolGear Architecture

May 27th, 2003 1
ToolGear Screenshot: Instrumentation

May 27th, 2003 1
ToolGear Screenshot 2: Tree View
May 27th, 2003 1
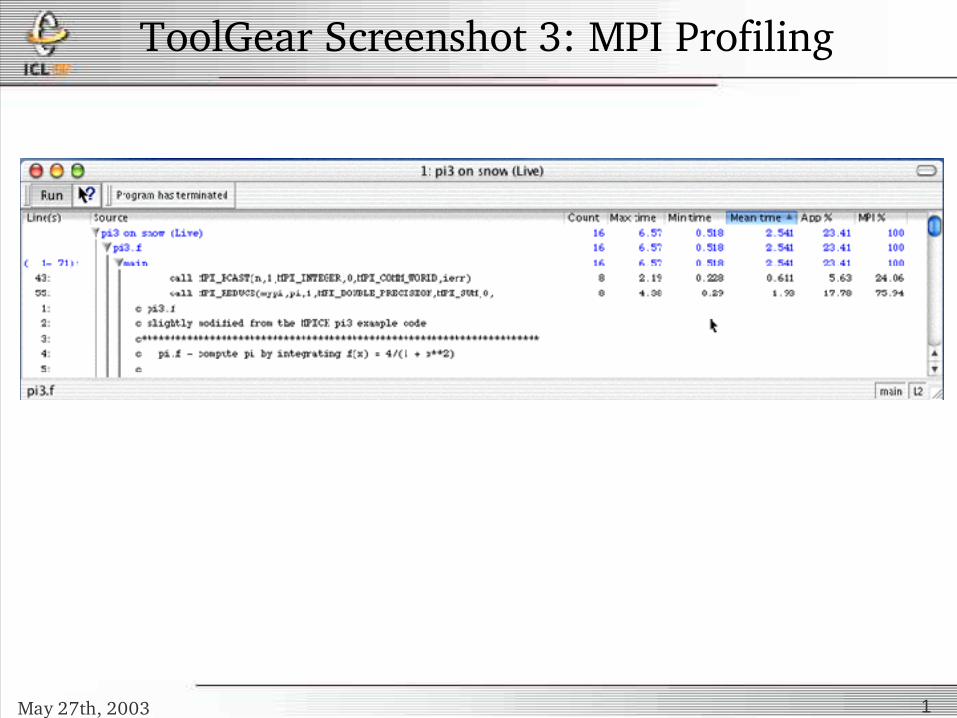
ToolGear Screenshot 3: MPI Profiling

May 27th, 2003 1
• A portable tool to dynamically instrument serial and parallel programs for the purpose of performance analysis.
• Simple and intuitive command line interface like GDB.
• Java/Swing GUI.• Instrumentation is done through the runtime
insertion of function calls to specially developed performance probes.
DynaProf
May 27th, 2003 1
Why the “Dyna” in DynaProf?
• Instrumentation:– Functions are contained in shared libraries.– Calls to those functions are generated at runtime.– Those calls are dynamically inserted into the
program’s address space.
• Built on DynInst and DPCL• Can choose the mode of instrumentation,
currently:– Function Entry/Exit– Call site Entry/Exit– Oneshot
May 27th, 2003 1
DPCL vs. DynInst
• Parallel framework based on DynInst
• Asynch./Sync. operation
• Functions for getting data back to tool
• Integrated with POE
• Available on all HPC platforms (and
Windows)
• Breakpoints
• Arbitrary ins. points
• Full Loop, CFG and Basic Block decoding
May 27th, 2003 1
• Popularized by James Larus with EEL: An Executable Editor Library at U. Wisc.– http://www.cs.wisc.edu/~larus/eel.html
• Technology matured by Dr. Bart Miller and (now Dr.) Jeff Hollingsworth at U. Wisc. – DynInst Project at U. Maryland
• http://www.dyninst.org/
– IBM’s DPCL: A Distributed DynInst• http://oss.software.ibm.com/dpcl/
A Brief History of Dynamic Instrumentation
May 27th, 2003 1
• Make collection of runtime performance data easy by:– Avoiding instrumentation and recompilation
– Avoiding perturbation of compiler optimizations
– Providing complete language independence
– Allowing multiple insert/remove instrumentation cycles
DynaProf Goals
May 27th, 2003 1
– Using the same tool with different probes
– Providing useful and meaningful probe data
– Providing different kinds of probes
– Allowing custom probe development Make collection of runtime performance data easy by:
DynaProf Goals 2

May 27th, 2003 1
Dynaprof Probes
• perfometerprobe– Visualize hardware event rates in “realtime”
• papiprobe– Measure any combination of PAPI presets and
native events
• wallclockprobe– Highly accurate elapsed wallclock time in
microseconds.
• The latter 2 probes report:– Inclusive– Exclusive– 1 Level Call Tree
May 27th, 2003 1
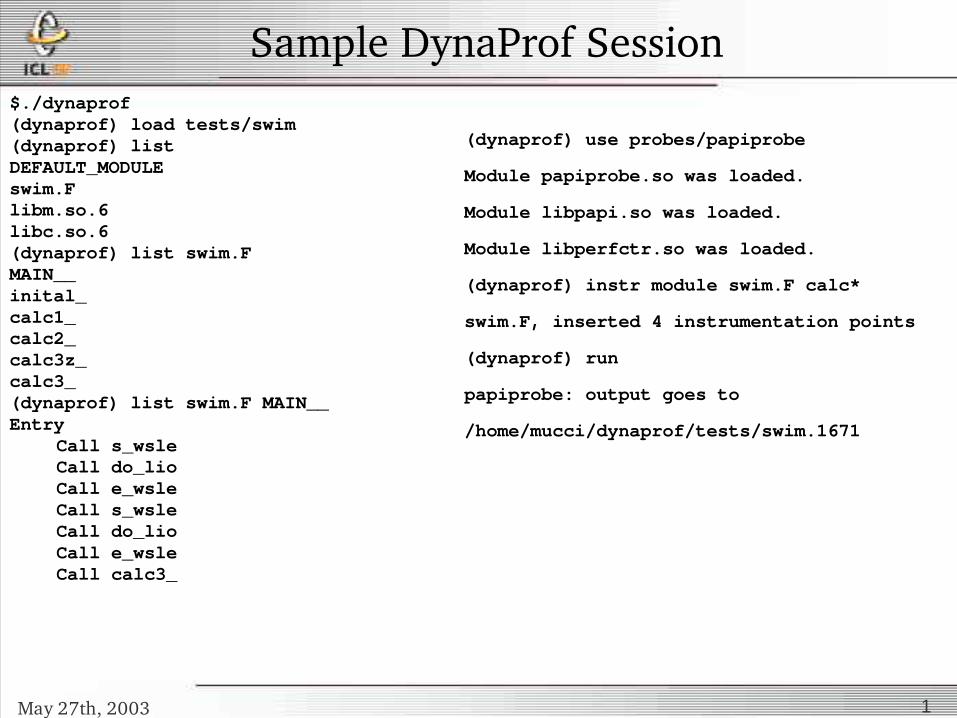
Sample DynaProf Session$./dynaprof(dynaprof) load tests/swim(dynaprof) listDEFAULT_MODULEswim.Flibm.so.6libc.so.6(dynaprof) list swim.FMAIN__inital_calc1_calc2_calc3z_calc3_(dynaprof) list swim.F MAIN__Entry
Call s_wsleCall do_lioCall e_wsleCall s_wsleCall do_lioCall e_wsleCall calc3_
(dynaprof) use probes/papiprobe
Module papiprobe.so was loaded.
Module libpapi.so was loaded.
Module libperfctr.so was loaded.
(dynaprof) instr module swim.F calc*
swim.F, inserted 4 instrumentation points
(dynaprof) run
papiprobe: output goes to
/home/mucci/dynaprof/tests/swim.1671
May 27th, 2003 1
DynaProf Probe Design
• Probes export a few functions with loosely standardized interfaces.
• Easy to roll your own.– If you can code a timer, you can write a
probe.
• DynaProf detects thread model.• Probes dictate how the data is recorded
and visualized.

May 27th, 2003 1
Threads and Dynaprof Probes
• For threaded code, use the same probe!• Dynaprof detects threads and loads a
special version of the probe library.• Each probe specifies what to do when a
new thread is discovered.• Each thread gets the same
instrumentation.
May 27th, 2003 1
PAPI Probe
• Can count any PAPI preset or Native event accessible through PAPI
• Can count multiple events• Supports PAPI multiplexing• Supports multithreading
– AIX: SMP, OpenMP, Pthreads
– Linux: SMP, OpenMP, Pthreads
May 27th, 2003 1
Wallclock Probe
• Counts microseconds using RTC• Supports multithreading
– AIX: SMP, OpenMP, Pthreads
– Linux: SMP, OpenMP, Pthreads

May 27th, 2003 1
Reporting Probe Data
• The wallclock and PAPI probes produce very similar data.
• Both use a parsing script written in Perl.
– wallclockrpt <file>
– papiproberpt <file>
• Produce 3 profiles– Inclusive: Tfunction = Tself + Tchildren
– Exclusive: Tfunction = Tself
– 1Level Call Tree: Tchild= Inclusive Tfunction
May 27th, 2003 1
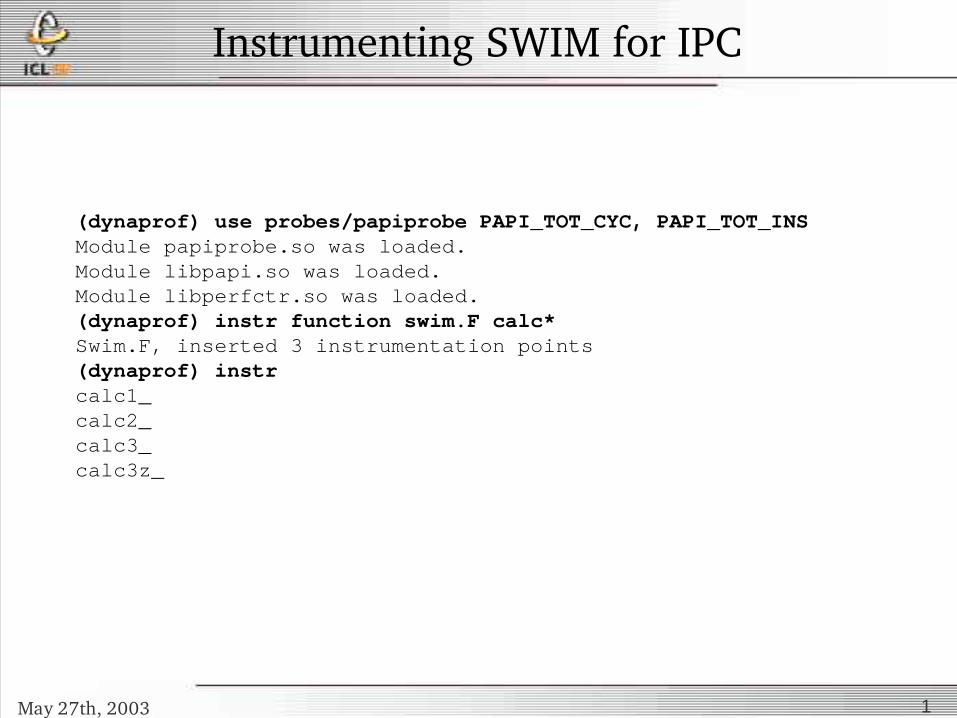
Instrumenting SWIM for IPC
(dynaprof) use probes/papiprobe PAPI_TOT_CYC, PAPI_TOT_INSModule papiprobe.so was loaded.Module libpapi.so was loaded.Module libperfctr.so was loaded.(dynaprof) instr function swim.F calc*Swim.F, inserted 3 instrumentation points(dynaprof) instrcalc1_calc2_calc3_calc3z_
May 27th, 2003 1
Swim Benchmark: Cycles & Instructions
May 27th, 2003 1
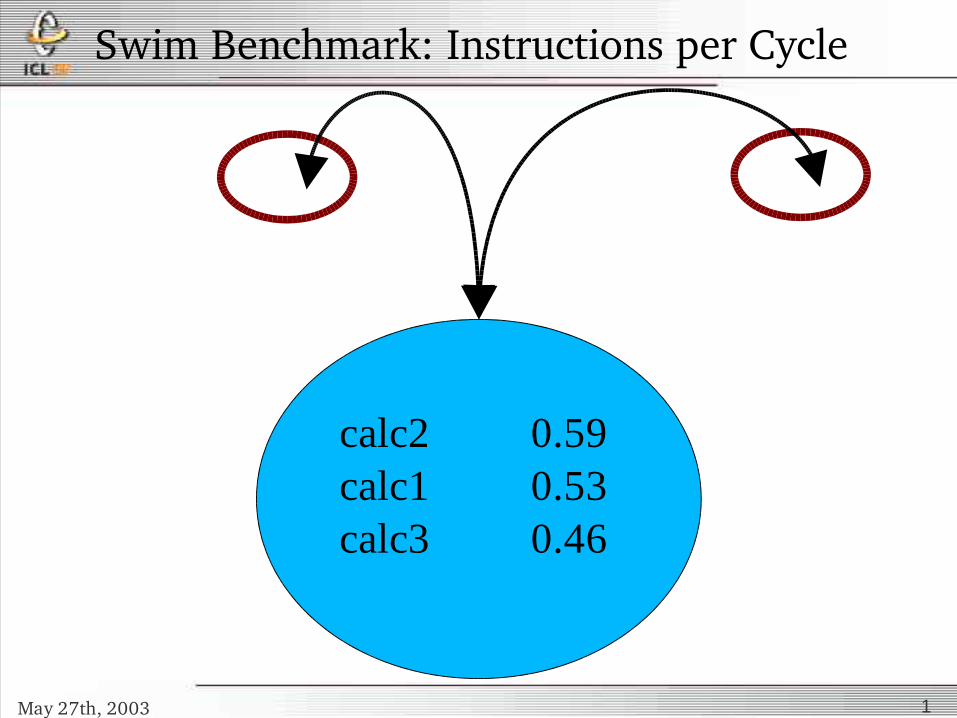
Swim Benchmark: Instructions per Cycle
calc2 0.59calc1 0.53calc3 0.46

May 27th, 2003 1
DynaProf GUI
• Displays module tree for instrumentation
• Simple selection of probes and instrumentation points
• Singleclick execution of common DynaProf commands
• Coupling of probes and visualizers (e.g. Perfometer)
• Does not work well!

May 27th, 2003 1
DynaProf GUI Screenshot
May 27th, 2003 1
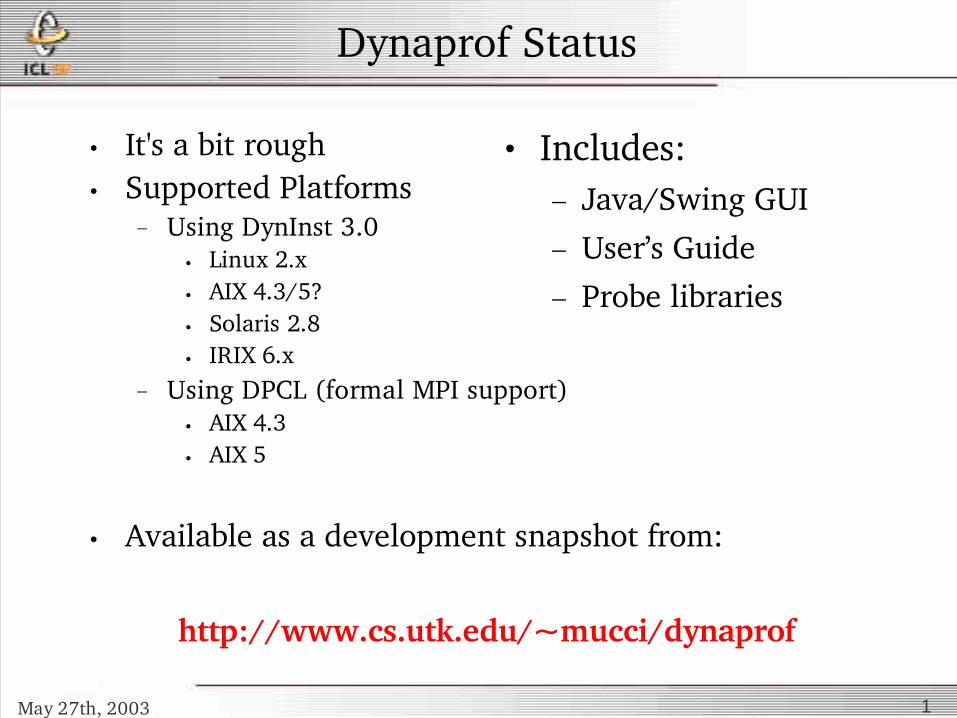
Dynaprof Status
• It's a bit rough• Supported Platforms
– Using DynInst 3.0• Linux 2.x• AIX 4.3/5?• Solaris 2.8• IRIX 6.x
– Using DPCL (formal MPI support)• AIX 4.3• AIX 5
• Available as a development snapshot from:
http://www.cs.utk.edu/~mucci/dynaprof
• Includes:– Java/Swing GUI– User’s Guide– Probe libraries
May 27th, 2003 1
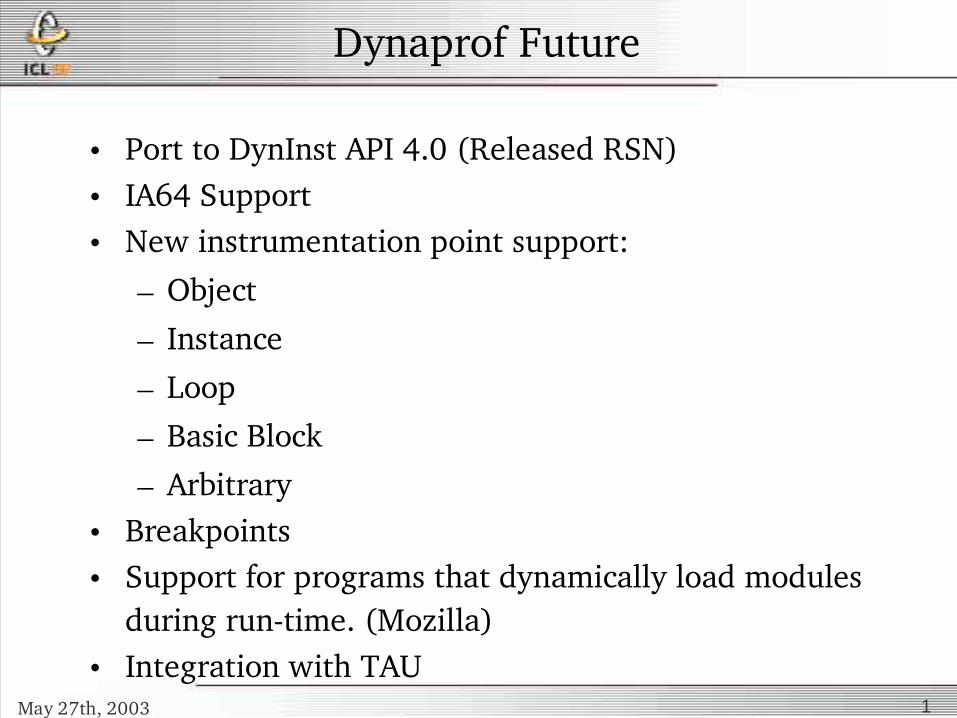
Dynaprof Future
• Port to DynInst API 4.0 (Released RSN)• IA64 Support• New instrumentation point support:
– Object
– Instance
– Loop
– Basic Block
– Arbitrary• Breakpoints• Support for programs that dynamically load modules
during runtime. (Mozilla)• Integration with TAU
May 27th, 2003 1
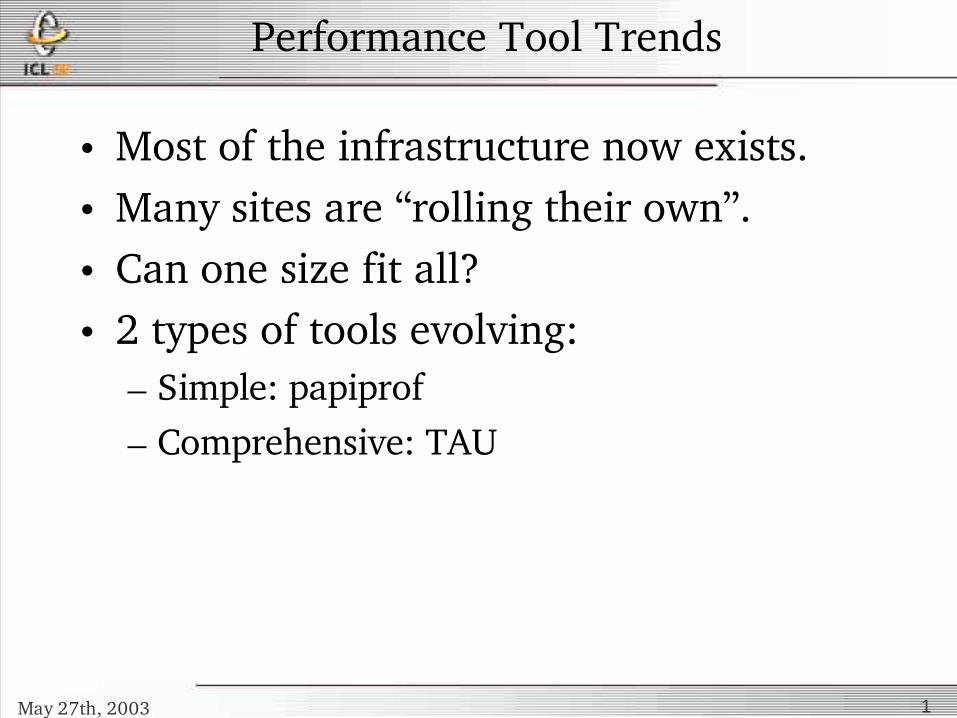
Performance Tool Trends
• Most of the infrastructure now exists.• Many sites are “rolling their own”.• Can one size fit all?• 2 types of tools evolving:
– Simple: papiprof
– Comprehensive: TAU
May 27th, 2003 1
Performance Database
• Database of all relevant information regarding the performance of a code.– Source code structure– Transformations performed during optimization– Static and dynamic memory allocation information– Derived data types, etc…
• Examples:– TAU PDT: Program Database Toolkit– HPC Tools: XML Database– ToolGear
• This data can be quite large! Remember MPI traces?
May 27th, 2003 1
Some problems to be solved
• How do we get the data out of the threads/processors/nodes/application and back to the user? Maybe...
– Tool Daemon Protocol: U. Wisc
– DPCL for all DynInst: LANL and me
• How do we correlate performance data from optimized code to the source?
• We want to understand all aspects of a program’s performance. What about behaviour over time?

May 27th, 2003 1
Phase Profiling
• Statistical profiling is often static– Gprof, Quantify, Speedshop, Workshop, Tprof,
etc…• Applications vs. kernels have distinct phases.
– Initialization– Data input
• Compute• Communicate• Repeat
– Data output– Finalization

May 27th, 2003 1
Phase Profiling 2
• Workloads on the hardware are most often periodic.
• More open questions:– How do we process, visualize and
understand this data in a scalable fashion?
– Can we use this data to optimize an application in the temporal domain?
– Can we parameterize this data against (t) for performance models?