Embed Size (px)
Citation preview
"PARADIGMS OF PROCESS CONTROL"
by
A.S. MUKHERJEE*and
JAIKUMAR**
93/76/TM
* Visiting Assistant Professor of Technology Management, at INSEAD, Boulevard deConstance, 77305 Fontainebleau, Cedex, France.
** Professor at, Harvard Business School.
A working paper in the INSEAD Working Paper Series is intended as a means whereby afaculty researcher's thoughts and findings may be communicated to interested readers. Thepaper should be considered preliminary in nature and may require revision.
Printed at INSEAD, Fontainebleau, France
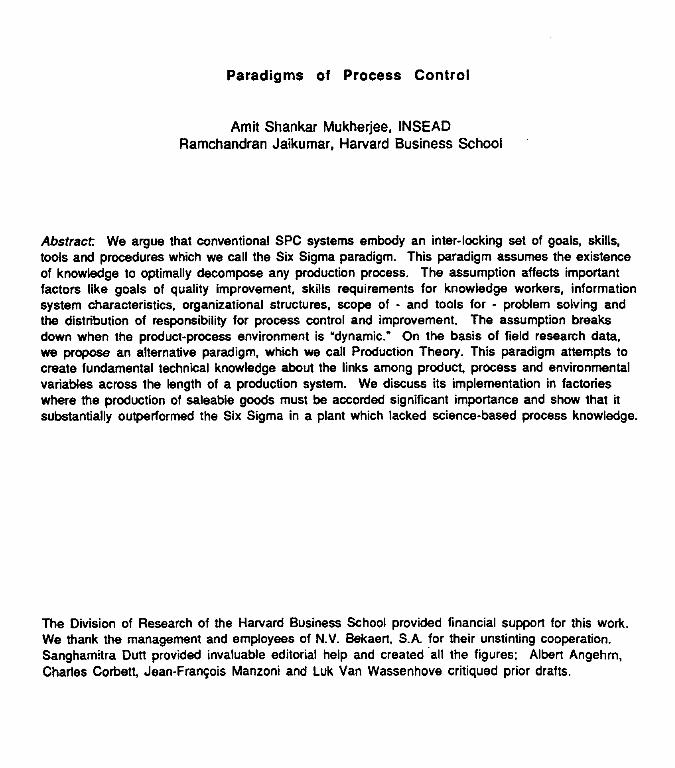
Paradigms of Process Control
Amit Shankar Mukherjee, INSEADRamchandran Jaikumar, Harvard Business School
Abstract We argue that conventional SPC systems embody an inter-locking set of goals, skills,tools and procedures which we call the Six Sigma paradigm. This paradigm assumes the existenceof knowledge to optimally decompose any production process. The assumption affects importantfactors like goals of quality improvement, skills requirements for knowledge workers, informationsystem characteristics, organizational structures, scope of - and tools for - problem solving andthe distribution of responsibility for process control and improvement. The assumption breaksdown when the product-process environment is "dynamic." On the basis of field research data,we propose an alternative paradigm, which we call Production Theory. This paradigm attempts tocreate fundamental technical knowledge about the links among product, process and environmentalvariables across the length of a production system. We discuss its implementation in factorieswhere the production of saleable goods must be accorded significant importance and show that itsubstantially outperformed the Six Sigma in a plant which lacked science-based process knowledge.
The Division of Research of the Harvard Business School provided financial support for this work.We thank the management and employees of N.V. Bekaert, S.A. for their unstinting cooperation.Sanghamitra Dutt provided invaluable editorial help and created all the figures; Albert Angehrn,Charles Corbett, Jean-Francois Manzoni and Luk Van Wassenhove critiqued prior drafts.
1. IntroductionIn recent years, the importance of statistical process control (SPC) for assuring the efficient useof a factory's resources and the quality of its output has been accepted without dispute. Virtuallyall the academic and managerial literature endorses its use and its absence is routinely taken toimply ineffective managerial practices. Interestingly, however, today, most discussions of thebenefits of SPC are couched within discussions of Total Quality Control (TOC) and its attendantelements of cultural change, communication with employees and the like.
In this paper, we adopt a similar broad perspective and focus on the concept of process control perse - the science, technology and art of ensuring that a production system produces the desiredoutput. We suggest that conventional implementation of SPC programs implicitly embody aninternally consistent set of goals, tools and procedures which we call the Six Sigma paradigm andpropose an alternative package of internally consistent goals, skills, tools and procedures forprocess control, which we call the Production Theory paradigm. The process control paradigmchosen by a plant influences the nature of the knowledge and information that it possesses/seeks,the infrastructural systems it creates, the skills that its personnel need, the goals for qualityimprovement and the distribution of manufacturing tasks.
The importance of the Production Theory paradigm stems from our empirical observation that theassumptions and implications of the Six Sigma paradigm make it inappropriate for manufacturingenvironments in which cause-effect relations are not firmly rooted in science/engineeringknowledge. Such environments appear, for example, when technologies are new or very high levelsof control are required. We analyze a matched pair of process control projects conducted by onefirm to show that in such environments, the Production Theory paradigm can be substantially moreeffective for improving quality and productivity (13 other projects which support our conclusionsare discussed in Mukherjee, 1992). However, we wish to emphasize that we do not intend todisparage the Six Sigma paradigm, but to explicitly discuss its assumptions and implications anddefine its domain of applicability.
The rest of the paper is organized as follows. In § 2, we introduce the two paradigms. In § 3, wedescribe the setting in which we developed of the Production Theory paradigm. In § 4, we use ourfield research data to define the differences between the two paradigms; the collective magnitudeof the differences is so large enough to justify our use of the term 'paradigm.' In § 5, we discussthe generalization of our findings and the scope for future research.
2. The Paradigms of Process ControlIn most firms, applications of the Six Sigma paradigm are rooted in attempts to institutionalizepervasive respect for quality. To this end, firms adopt policies/tools which presumably improvequality (Juran & Gyrna, 1980; Deming, 1982; Schonberger, 1982; Ishikawa & Lu, 1985).
In factories, ambitious goals are set for conformance quality; a widely adopted target is "sixsigma capability,* which seeks to reduce defect rates at every production stage to 3.4 per million.Such goals ensure that each stage treats the subsequent one as an 'internal customer.' To achievethem, managers must first identify and correct plant-wide problems. They organize 'breakthroughprojects' which are guided by multi-function, multi-department steering committees. Specialistengineers oversee 'process characterization,' (i) decomposing processes in their jurisdictions intoelemental tasks; (ii) selecting (on the basis of existing expertise) key variables; (iii) performingcontrolled experiments to determine optimal settings for these variables; and (iv) imposing SPCcontrol on them. Subsequently, line operators, typically members of quality control circles (QCC),rectify out-of-control situations in local work areas. Their effectiveness may be enhanced by theuse of the so-called Seven Statistical Tools: Ishikawa diagrams, Pareto analyses, flow charts,scatter diagrams, histograms, check-sheets and control charts. Powerful cross-functionalsteering committees coordinate actions across departments (Juran & Gyrna, 1980; Deming,1982; Hall, 1983; Ishikawa & Lu, 1985; Imai, 1986; Gupta, et al., 1987).
1
Firms at the cutting edge of the quality revolution also improve product design. To do so, theyrequire detailed knowledge of product attributes, cause-and-effect relations which govern theirproducts and processes and sources of noise which impair performance. Such knowledge isessential for applying highly recommended design quality improvement tools like Quality FunctionDeployment (OFD) and the Taguchi method (Kackar, 1985; Hauser & Clausing, 1988).
A hitherto unanswered question is whether the Six Sigma Paradigm is appropriate for productionenvironments which are 'dynamic" (Jaikumar & Bohn, 1992). Some plants often deal with new orpoorly understood technologies, incompletely specified or imprecisely executed procedures,environmental disruptions and conflicting goals. Such conditions create environments characterizedby ambiguity, uncertainty and complexity in which contingencies - unexpected events which disruptproduction - occur routinely. These plants are not necessarily poorly managed. Their `dynamic"environment is often attributable to the lack of basic scientific or engineering knowledge or tools orthe inability of R&D to provide detailed understanding of product or process technology (Sahal,1981; Abernathy, Clark & Kantrow, 1983; Jaikumar, 1991).
Many contingencies are idiosyncratic, i.e., their occurrence is inextricably intertwined with theirenvironment. They can only be studied in situ in the factory. Attempts to transfer them from theirnormal environment fail because their unknown and ill-understood causes do not survive passage tonew settings (Sahal, 1981, discusses the related problem of scaling-up technology). Processcontrol in such environments requires the simultaneous creation of new knowledge (about products,processes and contingencies) and its incorporation into control strategies. This Production Theoryparadigm requires plant personnel to identify the inter-locking set of product, process andenvironmental variables which govern their product-process system. With help from R&D, theyhave to link product attributes at different process stages; product attributes and processparameters; and process parameters at the different stages, so that they can:
• Decide which variables to control. If variation did not adversely affect the productive unit orlearning efforts, they could choose not to actively control it.
• Understand the potential impact of the variables which were not under control. This knowledgecould not only help them identify strategies for tackling these variables, but in the interveningperiod, could also suggest how their effect could be counteracted.
• Determine economically optimal control strategies. Rather than focus on key, but expensive tocontrol attributes, plant personnel could seek to change the levels of other related variables.
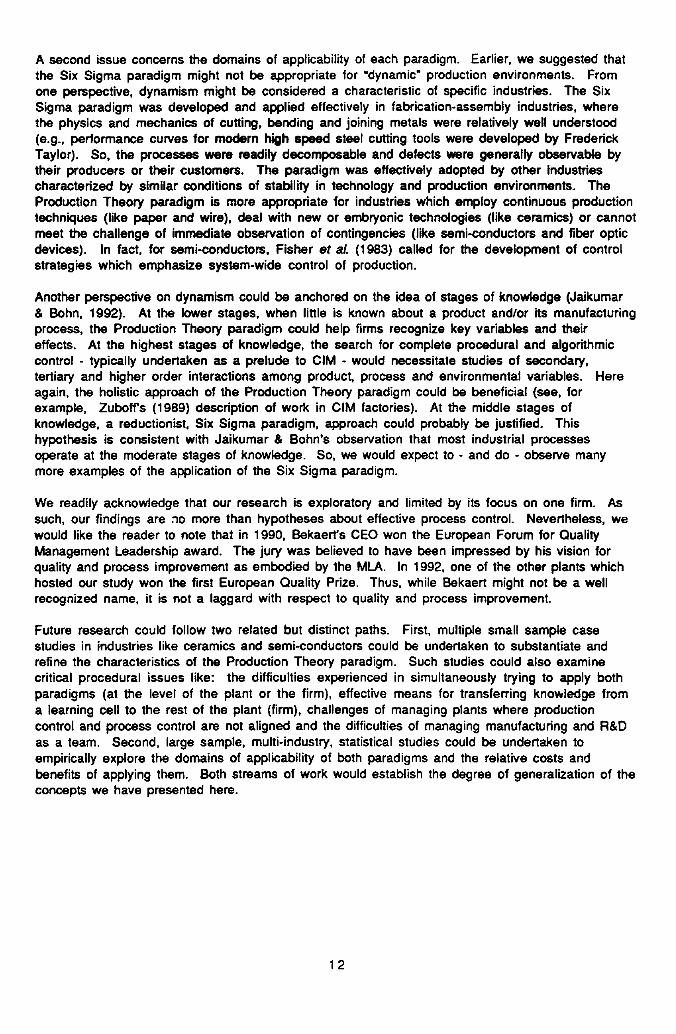
Key elements of the two paradigms are summarized in Table 1. In subsequent sections, we definethe Production Theory paradigm in greater detail, discussing issues like necessary systems andtools. As an aside, note that the paradigms present alternative packages of knowledge forsupporting TQC. This is because products are embodiments of information (Allen, 1977). SinceTQC creates organizational conditions which enable tris delivery of high quality products, itimplicitly manages the quality of organizational knowledge.
Table 1 About Here
3. Source of Empirical DataIn mid-1988, we began studying how organizations learn to improve their understanding of processcontrol. Since this was a question of procedural rationality, we adopted the case researchmethodology (Bonoma, 1985). Our subject necessitated our acquiring deep knowledge about thehost firms' technology, organizational structure and information systems. So, the problem ofassuring the confidentiality of proprietary information loomed large and we limited our study to onefirm, N.V. Bekaert, S.A., with which one of us had an on-going advisory relationship.
2
Three of Bekaert's European factories, which primarily produced tire cord (i.e., wire used to makesteel belted radial tires), participated in the study. Over a period of 2.5 years, we investigatedthe execution of 15 process engineering projects. We collected archival data and conducted over200 hours of formal, semi-structured interviews with managers, engineers and technicians whohad worked on them. We also accumulated 2000 hours of additional contact with company officials.
In this paper, we will only discuss two projects undertaken by one plant, Aalter. These projectsdealt with similar problems at roughly the same point in time. Thus, they were undertaken underidentical general management policies, used virtually identical raw materials, produced virtuallyidentical products and served the same market (often the same customer). Consequently, it isrelatively simple to make the claim that the one area of substantive difference between them wasthe philosophies of process control that they adopted. We emphasize, however, that the otherprojects in our database shared the characteristics we report here. Eight conformed to the SixSigma paradigm, 5 to the Production Theory paradigm and 2 adopted both paradigms at differentpoints in time (see Mukherjee, 1992 for details).
3.t Production Process: Steel mills supply Aalter huge coils of thick steel wire (called 'rod')which had been created during one heating of a furnace. These coils have uniform, but not identical,properties. Aalter pickles the rod, i.e., dips them successively in acid and borax baths and driesthem in ovens. The acid cleans the rod and the borax facilitates lubrication during the next stage.
Plant personnel load the coils on dry drawing machines. A coating of dry soap smoothens thepassage of the rod through a set of dies (Figure 1). Next, in a process called patenting, the spoolsof wire are chemically treated and heat treated to improve attributes like ductility. A second stageof dry drawing reduces the diameter of the wire to 1.7 mm. At both drawing stages, the shape ofdie and the quality of lubrication determine the shape of the wire, critical physical properties andsome types of wire fractures. Hence, plant personnel closely monitor the number of dies whichwear out during the production of one metric ton of wire. The quality of lubrication significantlyaffects this measure, called drawability.
Figure 1 About Here
Many spools are then treated with chemicals and heat side-by-side on 'ISC' lines. This processimparts strength, ductifity, luster and a thin brass coating to the wire. Despite the use of advancedcontrols, even wires which are treated simultaneously do net have identical properties.
The wires are next drawn on wet wire drawing (WWD) machines. They pass through series of diesimmersed in a soap solution and are progressively reduced to diameters less than 0.5 mm. Thesoap solution comes from two or three 'soap circuits' possessed by each plant. Each circuit hastwo swimming pool-sized soap pits. Several kilometers of outlet pipes from the pits lead to pumpswhich control the flow of soap, heat exchangers which control temperature and between 50 and150 WWD machines. Outflow pipes from the machines lead back to the soap pits. The condition ofthe soap has long been believed to be important for assuring good drawability.
Next, bunching machines twist two or more filaments about each other and create tire cord. Manytypes of cord can be created by changing the diameters and properties of the filaments and thenumber of filaments combined. Some of these types are spiral wrapped for added strength. About5% of all cord also have to be rewound from one spool to another when the original spool showsrepairable defects. Finally, samples of the cord are tested prior to packing and shipping.
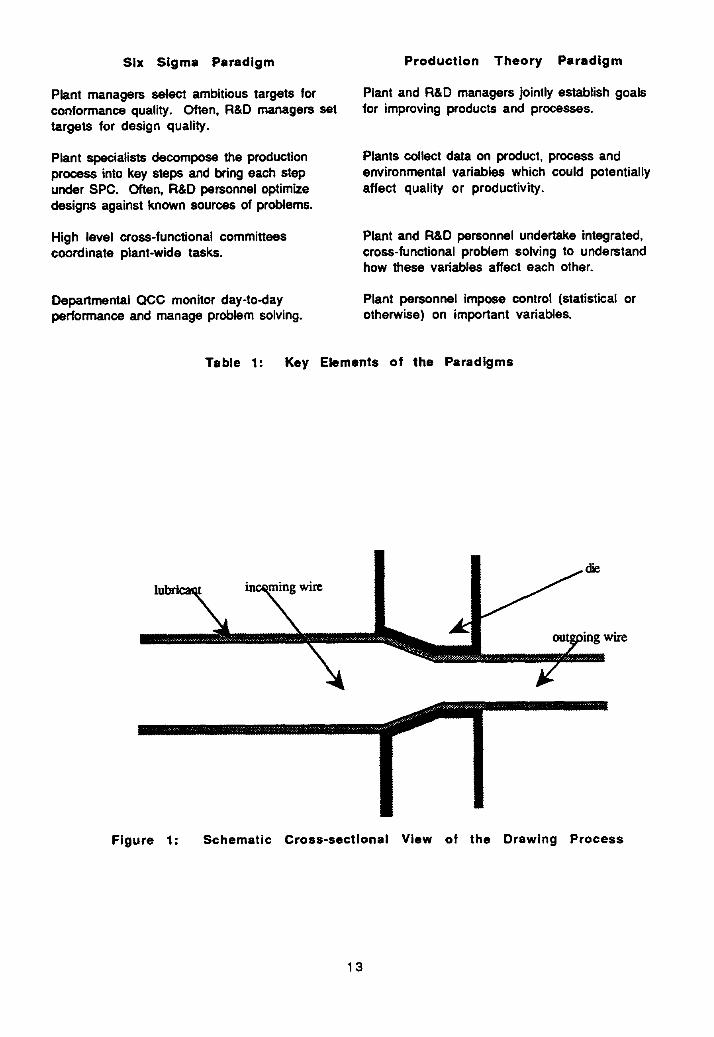
A process flow diagram appears in Figure 2. The variation in the number of machines used at thedifferent production stages adds to the complexity of the plant. This fact, coupled with thepresence of the soap circuits, precludes the adoption of conventional cellular manufacturing.
Figure 2 About Here
3
In the 1980s, the management of the soap circuits received considerable attention, Bekaertpersonnel subscribed to the industry-wide belief that 'soap steering' affected key processparameters (like drawability) and product properties. The state of a soap circuit at any point intime was specified by its 'fatty acid' concentration, temperature, pH value, composition of the'ether soluble phase', phosphate ion concentration and the levels of several other ions andchemicals. Target values and control limits for these parameters differed for every soap circuit;tire manufacturers specified some and the plants set the others at levels at which, in the past, theyexperienced good drawability. The key technical problem was that with use, the chemicalcomposition of the soap changed (in part because the wire deposits zinc, copper and iron ions).Unfortunately, no one understood this process of 'aging' very well. Thus, achieving the targetsfor, say, phosphate ions, did not necessarily assure good drawability and in fact, settings whichgave good drawability on one occasion could give poor drawability on another. To deal with thisproblem, every plant employed a chemist as a 'soap specialist.' This person's ability to interpretdata on soap was critical for making decisions like the amount of fresh soap (and other chemicals)to add and the amount of old soap to remove.
3.9 Plant Organizational Structure and the Flow of Technical Information Aalter, one of Bekaert'slargest plants, had a traditional functional structure, with two minor exceptions: both dry drawingstages, pickling and patenting formed one meta-department - Half Products - and bunching andspiral winding formed another (Figure 3). All the production departments reported to a productionmanager who, in turn, reported to the plant manager. The department managers were supported bysupervisors who, in turn, relied upon foremen to actually oversee production. In addition, the planthad a Technical department, which reported directly to the plant manager and had plant-wideresponsibilities for Quality Assurance, SPC and improvement projects. Support departmentsincluded production planning, maintenance and electronic data processing (EDP); the last namedcollected and processed production and accounting data.
Figure 3 About Here
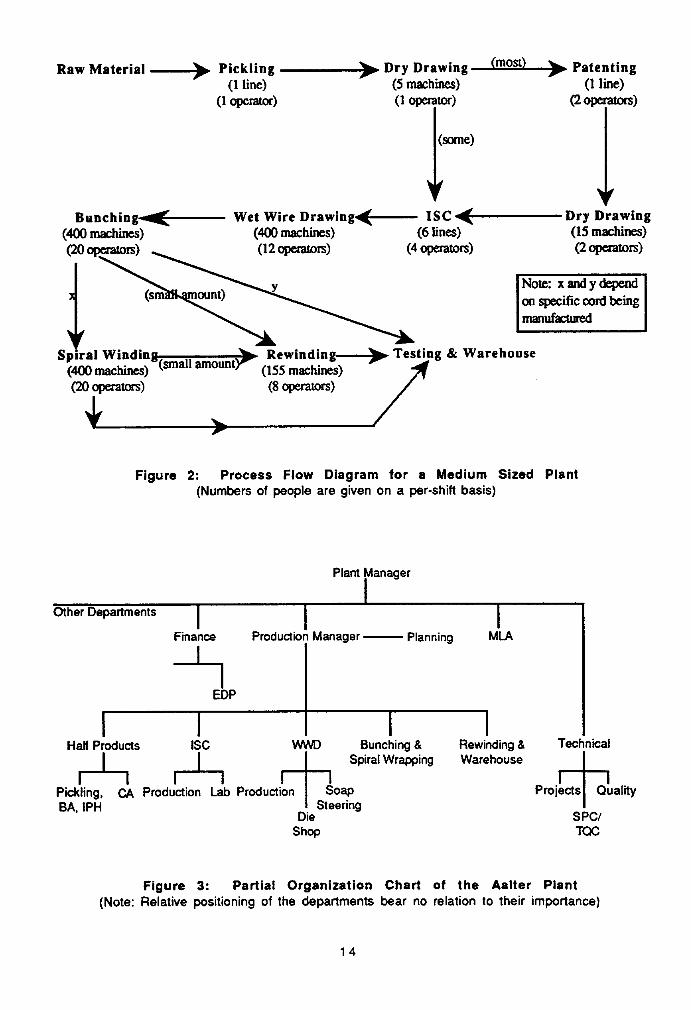
?taller personnel routinely collected two types of process control data. First, at the end of thefirst dry drawing stage (when spools were first created), they attached to each spool a paper tagwhich accumulated basic information about its subsequent processing. Second, they collected SPCdata at all production stages. Both types of data were processed overnight into departmentalperformance reports which included statistics such as fractures per ton of wire produced, scraprates, CPK values (Kane, 1986), volume of production and machine utilization. In all, the reportscovered about 50 product properties and over 200 process parameters and performance measures.
Knowledge workers and machine operators used different aspects of these information. The SPCdata were regularly fed back to operators. Each department displayed on large boards comparativedata on goals and current and past performance on parameters for which it was responsible. First-line managers also used SPC data to identify operators who needed additional training. Knowledgeworkers received daily reports about events that occurred in their departments the prior day.They also received monthly plant-wide summaries of these data, as well as data about individualmachines and products, standard costs and variances, Pareto analyses of major defects, inventorylevels and sales, targets and average performance levels for prior periods and for other Bekaertplants. These 'Activity Reports' presented information in numerical and graphical forms. Typicalstructures of data on three departments are given in Figure 4.
Figure 4 About Here
3.3 The Six Sigma Paradiam at Bekaert: Aalter's Soap Steering & Drawabilitv Project Aalteradopted a Six Sigma paradigm based SPC policy in 1981. Plant managers created an environment inwhich SPC/TOC would flourish, investing resources and managerial time in training, emphasizingthe importance of internal customers, upgrading communications with workers, forming SPC
4
training cells, appointing TOC facilitators and improving information systems. Functional areasalso characterized their processes and defined standard operating procedures (SOP).
However, SPC for soap steering was adopted late in the decade. Maurice, a chemist who hadmanaged the chemical baths of ISC, became the soap specialist in 1987. Like his counterparts atother plants, he created flow-charts which codified his beliefs and specified appropriate actions fordifferent conditions in the soap circuits (the charts did not refer to a key parameter - fatty acidconcentration - since Miter lacked a gas chromatograph necessary for its analysis). Once a week,he studied the drawability levels in WWD, the quantity of filament that WWD had produced and theexpected production level for the upcoming week. He used four "correction factors" specified byR&D to ensure that the soap was neither too fresh nor too old. During periods of good drawability,he disliked taking any action for fear of affecting drawability adversely. At these times, he reliedon input from his boss Mel who, since 1981, had been the manager of the WWD department.
In March 1989, when Miter experienced a period of poor drawability, plant management decided tointroduce SPC-based soap steering. A team - consisting of Maurice, Noel, Andre (SPC/TOCmanager) and a Technical department engineer - tackled the task in a fashion similar to thatdescribed in § 2. It adopted a CPK of 1.33 as an initial target. Since Aalter had just obtained a gaschromatograph, it created a new flow chart which incorporated this parameter. It chose targetsand control limits based on the plant's recent experience of a 30 week stretch of good drawability.Finally, it developed control charts, checklists for data collection and a system for follow-up andmonitoring. It did not analyze any wire-related variables, believing that (i) obtaining the necessarydata from ISC would be difficult and (ii) by stabilizing the soap, SPC would improve drawability.
Over time, in response to new information from R&D activities, the project team changed its SPC-based policy several times. For example, at an R&D organized inter-plant conference late in 1989,Maurice learnt about a strikingly simple flow chart being used with great effectiveness at anotherplant. So, he eliminated several steps from the Aalter flow-chart. In May 1990, in response tocriticism from an R&D soap expert that Aalters daily steering actions did not allow the soapcircuits to reach chemical iaquilibria, the project team modified the steering procedure.
Nevertheless, process characterization helped Maurice and Andre rectify significant operatingproblems. In December 1989, Pareto analyses of data collected enabled them to identify majordeficiencies in the soap circuit pumps and led to the modification of the plant's preventivemaintenance policies. During 1990, seeming inaccuracies in the fatty acid analyses led to R&Dassisted changes in the analytical procedures for the gas chromatograph. Late in 1990, theytightened control over the maintenance and operation of the heat exchangers in the soap circuits.
Despite these efforts, the overall operation of soap circuits did not improve significantly during thetwenty-one months for which we have data. Variability was hard to reduce and accuracy was hardto achieve except on the circuit (G3) equipped with the most sophisticated controls. However, theplant - through Maurice - learnt a lot about soap and improved the CPK for some parameters. InDecember 1990, Maurice believed that given the types of controls he had on G3, he could achieveany reasonable CPK value for any soap parameter - if he did not have to worry about production!However, neither he nor Andrd were sanguine about their ability to use SPC to steer soap well. Infact, Andit believed that the theory and practice of soap steering were a long way apart. He hadbegun to doubt the utility of applying SPC in an area where the plant lacked fundamental knowledge.
3.4 The Production Them Paradigm at Rekaert: The MI A Drawabilitv Praject In May 1988,Bekaert set up at Aalter an integrated line dedicated to the application of what we call theProduction Theory paradigm. It named the line Model Line/Aalter (MLA) and appointed a seniorR&D engineer, Paul, as its manager. Paul came from a highly functional unit - characteristic offirms which compete on the basis of product performance (Wheelwright & Clark, 1992), but had
5
atypically accumulated cross-functional experience. He was told to improve Bekaert's knowledgeof its products and processes without sacrificing the production of saleable cord.
Bekaert formed the MLA very simply. First, Aalter nominally transferred operational control overspecific equipment machines to Paul, allowing him to make decisions on issues ranging from rodsupplies to preventive maintenance. ConSequent*, the operators who worked these machines nowhad to report to both their functional supervisors and the MLA engineers. Second, Bekaert gave theMLA adequate engineering resources - another engineer, two technicians, a few personalcomputers, a budget for experimentation, sensors and automatic data capture equipment andpriority access to the laboratories which analyzed product and process samples. Third, in twostages (mid-88 and early 1990), Aalter transferred responsibility for the manufacture of asimple, but increasingly important, tire cord to the MLA.
Paul modified material flow patterns and data collection practices on the MLA, enabling it toroutinely collect and process a vast and ever increasing base of process control related data,including about 500 process parameters and environmental variables. Data were collected throughsensors, laboratory analyses and operator inputs. Daily audits of the MLA provided inputs on'unusual events' normally ignored by the formal information system.
All the data were stored in the raw form. Thus, for each production batch, regardless of the dateof manufacture, each element of data could be correlated with every other element. Besides, themonthly Activity Reports not only presented information similar to that reported by Aalter, butalso what the MLA personnel knew (or did not know) about the data and what experiments they hadplanned or performed. Finally, the data and the experiments were discussed with Aalter personnel,visitors from other plants and R&D scientists during monthly 'State-of-the-Art' meetings.
In early 1990, the MLA attempted to improve WWD drawability by an order-of-magnitude. Paulinitiated the effort, pulling together fragmentary knowledge created by unrelated experimentsconducted over the prior 15 years by different R&D units. For example, an experiment with a soapsimilar to that used at Aalter had produced excellent drawability if the wire were drawn at lowspeed. Another experiment had shown that increased agitation of the soap reduced drawability.From these, Paul concluded that the duration of contact between the wire and the soap facilitateddrawing and agitation impeded the formation of chemical compounds which were crucial for highdrawability. He combined these hypotheses into a formal chemical model in which soap affecteddrawability only because its constituent chemicals reacted with the metals of the wire being drawn.
To this core, the MLA personnel added several factors (the geometry and heat transfer propertiesof dies; roughness of the wire and the quality of its heat treatment; the breaking load of thefilaments produced; and the rod supplier) unrelated to soap or wire. Prior production experienceand simple regressions on natural data had pointed to the relevance of these variables. The powerof this expanded model lay in its seeming ability to explain why the soap specialists felt the need tomonitor temperature, fatty acids and pH.
In March 1990, the MLA personnel designed a simple experiment to test the effects of temperatureand the duration of the contact between soap and wire. They split 18.5 tons of ISC wire into twobatches, dipped one in a tank of warmed soap solution and under essentially identical conditions,processed both batches on WWD machines. The pre-dipped wire showed a 73% improvement indrawability and a 65% decline in fractures. Buoyed by these results, they obtained a capital budgetto conduct a larger scale test. During a scheduled preventive maintenance in May, they modified anISC installation to include a pre-dip system. After one false start and subsequent re-engineering ofthe system, by September, they established the efficacy of the pre-dip.
In May, 1990, the MLA personnel validated their model with natural experiments based on datafrom 240 batches of cord. They then investigated the effects of various combinations of the soap,wire and die parameters on drawability. These experiments generated grossly contradictory
6
results and stimulated heated discussion at the State-of-the-Art meetings. However, after fourmonths of concerted effort, the MLA personnel concluded that none of the soap parameters had anystatistically discemable effect on drawability, but several ISC and dry drawing related factors -wire roughness, composition of the brass coating and filament breaking load - did.
Since soap steering did not affect drawability, the MLA personnel decided to make the steeringprocess as simple as possible. In June 1990, they convinced Maurice to (i) limit intervention in theG3 circuit (which supplied the MLA) to once every three weeks and (ii) spread the steering actionsover several days. During the first several weeks of trials, the new policy failed to stabilize thesoap. Late in the year, the MLA personnel reviewed every step of the steering procedure andattributed the problem to the manner in which soap samples were being collected and the manner inwhich soap was transferred across the two pits in a circuit. In consultation with Maurice andAndre, they developed new operating procedures for these tasks.
Our formal data collection about the MLA effort came to an end in December 1990. At that time,most people seemed satisfied with the progress made, though no one could guarantee the long termsuccess of the new policy. Through our subsequent contact with Bekaert executives, we found that(i) the MLA did sustain the sharply improved drawability performance and continued its efforts tounderstand and control the wire-soap interactions and (ii) Aalter adopted most of its counsel.
4. Comparison of the Process Control ParadigmsThe Aalter and MLA projects suggest that both the Production Theory and the Six Sigma paradigmspossess cohesive, inter-locking sets of characteristics which distinguish them from each other.
4.1 Reductionism Versus Holism Reductionism is the belief that "... a whole can be understoodcompletely if you understand its parts, and the nature of their 'sum – and holism assumes that "...the whole is greater than the sum of its parts" (Hofstadter, 1981, pp. 162). The Six Sigmaparadigm is anchored on the former and the Production Theory paradigm, on the latter. Thisdifference in perspectives lies at the root of all the differences between the two paradigms.
The Six Sigma paradigm makes the strong assumption that a firm can disaggregate the making of itsproducts into relatively (if not completely) self-contained task units. This Tayloristic assumptionitself relies on the belief that the firm's knowledge of its production task is relatively complete inthe sense that all major tasks that have to be performed are known. There is no uncertainty orambiguity about the means for producing good output; uncertainty only shrouds the optimumperformance levels for the tasks. Thus, the planning of producVprocess control can be decoupledfrom the execution of control and improvement. The key managerial tasks are decomposing theprocess and ensuring that efforts to reduce uncertainty are undertaken.
In product development, the assumptions of complete knowledge/reductionism are embodied in toolslike the Taguchi method and QFD. For example, the former requires knowledge of key sources ofnoise, the range of their intensity and the nature of their interaction with product and processattributes. Without such knowledge, parameter design experiments could not be conducted. Webelieve that this is probably a key reason why a field study of US firms employing QFD indicatedthat the method offered most benefits for simple products and incremental changes (Griffin, 1992).
In manufacturing, decomposition is effected during process characterization, when plant personnelidentify tasks which might benefit from increasingly tighter control. Subsequently, they focus onreducing the variability (i.e., uncertainty) of known product attributes and process measures. TheSeven Statistical Tools (Imai, 1986) are very well suited for this purpose: six of the tools providethe means for decomposing any problem into its constituent elements, while the seventh - controlcharts - provides the means for separately controlling each of the critical constituent elements.
7
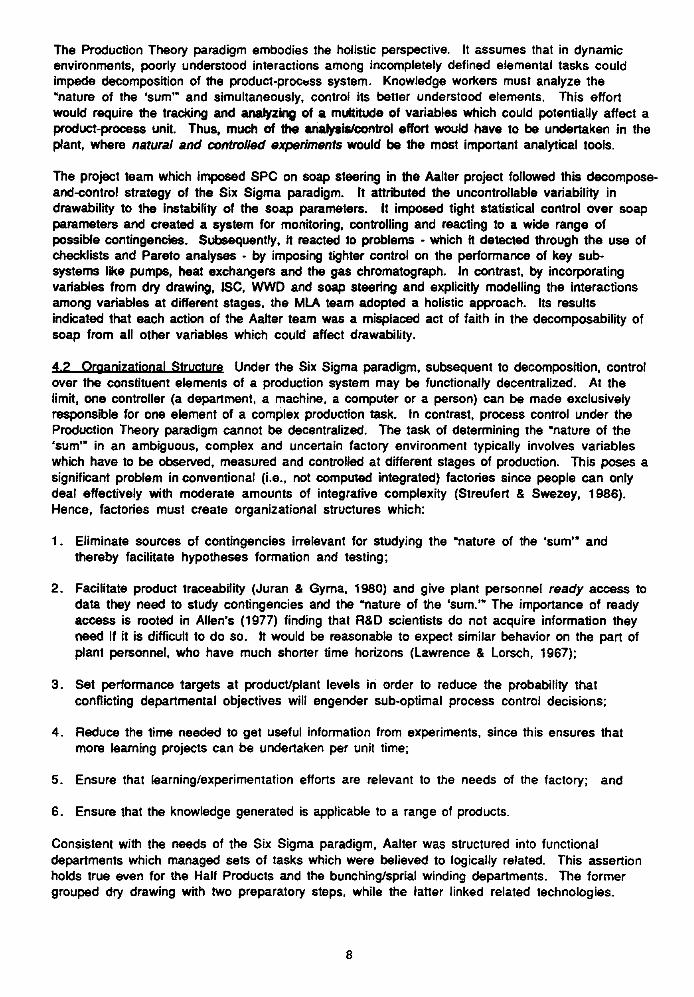
The Production Theory paradigm embodies the holistic perspective. It assumes that in dynamicenvironments, poorly understood interactions among incompletely defined elemental tasks couldimpede decomposition of the product-process system. Knowledge workers must analyze the"nature of the 'sum'" and simultaneously, control its better understood elements. This effortwould require the tracking and analyzing of a multitude of variables which could potentially affect aproduct-process unit. Thus, much of the analysis/control effort would have to be undertaken in theplant, where natural and controlled experiments would be the most important analytical tools.
The project team which imposed SPC on soap steering in the Aalter project followed this decompose-and-control strategy of the Six Sigma paradigm. It attributed the uncontrollable variability indrawability to the instability of the soap parameters. It imposed tight statistical control over soapparameters and created a system for monitoring, controlling and reacting to a wide range ofpossible contingencies. Subsequently, it reacted to problems - which it detected through the use ofchecklists and Pareto analyses - by imposing tighter control on the performance of key sub-systems like pumps, heat exchangers and the gas chromatograph. In contrast, by incorporatingvariables from dry drawing, ISC, WWD and soap steering and explicitly modelling the interactionsamong variables at different stages, the MLA team adopted a holistic approach. Its resultsindicated that each action of the Aalter team was a misplaced act of faith in the decomposability ofsoap from all other variables which could affect drawability.
4.2 Organizational Structure Under the Six Sigma paradigm, subsequent to decomposition, controlover the constituent elements of a production system may be functionally decentralized. At thelimit, one controller (a department, a machine, a computer or a person) can be made exclusivelyresponsible for one element of a complex production task. In contrast, process control under theProduction Theory paradigm cannot be decentralized. The task of determining the "nature of the'sum'" in an ambiguous, complex and uncertain factory environment typically involves variableswhich have to be observed, measured and controlled at different stages of production. This poses asignificant problem in conventional (i.e., not computed integrated) factories since people can onlydeal effectively with moderate amounts of integrative complexity (Streufert & Swezey, 1986).Hence, factories must create organizational structures which:
1. Eliminate sources of contingencies irrelevant for studying the 'nature of the 'sum'" andthereby facilitate hypotheses formation and testing;
2. Facilitate product traceability (Juran & Gyma, 1980) and give plant personnel ready access todata they need to study contingencies and the "nature of the 'sum.'" The importance of readyaccess is rooted in Allen's (1977) finding that R&D scientists do not acquire information theyneed if it is difficult to do so. It would be reasonable to expect similar behavior on the part ofplant personnel, who have much shorter time horizons (Lawrence & Lorsch, 1967);
3. Set performance targets at producVplant levels in order to reduce the probability thatconflicting departmental objectives will engender sub-optimal process control decisions;
4. Reduce the time needed to get useful information from experiments, since this ensures thatmore learning projects can be undertaken per unit time;
5. Ensure that learning/experimentation efforts are relevant to the needs of the factory; and
6. Ensure that the knowledge generated is applicable to a range of products.
Consistent with the needs of the Six Sigma paradigm, Aalter was structured into functionaldepartments which managed sets of tasks which were believed to logically related. This assertionholds true even for the Half Products and the bunching/sprial winding departments. The formergrouped dry drawing with two preparatory steps, while the latter linked related technologies.
8
Consistent with the needs of the Production Theory paradigm, Bekaert gave the MLA (i) a unifiedmanagement structure which held one person responsible for both learning and production; (ii) asingle important and representative product; (iii) every production stage necessary for makingthat product; (iv) at every manufacturing stage, the capability to track and correlate a wide rangeof product, process and environmental variables; and (v) access to excellent data processing,analytical and testing capabilities. Characteristic (i) supported goals (3) and (5); characteristic(ii), goals (1), (2) and (6); characteristics (iii) and (iv), goals (2) and (3); and characteristic (v),goal (4) and the ease of effort element of goal (2).
While it is conceivable that plants in other industries might create other organizational structuresto achieve the goals listed above, we believe that the MLA, which we call a 'Learning Cell,' is agood model for implementing the Production Theory paradigm in conventional factories. (Shirley &Jaikumar, 1988, discuss related ideas about computer integrated manufacturing - CIM - plants.)
•1 i• ∎ = ∎ •1 ••11•1 P- t•• - IL*
I• By requiring each production stageto treat the next one as its customer, the Six Sigma paradigm makes the strong assumption thateach stage (or its customer) can observe the contingencies it creates. If this assumption is notmet, no production stage can determine or correct the quality of its output. Hence, the literatureon quality emphasizes the importance of "easy to see quality" (Schonberger, 1982; Hall, 1983).
An important corollary is that each stage does not require detailed information about its supplier orcustomer stages. All it needs are clear definitions of the inputs it will receive and the outputs itmust produce. To these data, it must itself add detailed, specialized, local data on the productattributes, process parameters and contingencies it needs to control. Availability of summaryperformance statistics on other stages allow departmental personnel to keep abreast of key events.
A plant's information system (IS) can meet these needs since most production stages use the sametools for analysis and control (e.g., Pareto analysis and control charts). So, it can (i) process thedata uniformly; (ii) reduce the amount of data it must store; (iii) provide feedback quickly; and(iv) reduce the amount of information that plant personnel have to review.
The Production Theory paradigm considers the "treat the next step as a customer" a desirable butnot necessarily tenable ideal. It assumes that the lack of knowledge of all relevant variables meansthat data/information needs will routinely cross the boundaries of production stages. This impliesthat the IS system must routinely support the creation or acquisition of new and different datawhich could conceivably bring to light hitherto unknown facets of the process control problem. So,the IS must be flexible with regard to what data is acquired, in what form and how it is processed.
Consistent with these descriptions, Aalter's routine reports presented aggregated data and itsproject team collected and analyzed detailed, local and specialized data. Despite Maurice's (thesoap specialist) background in ISC, the team could not obtain data from that department. Incontrast, from the beginning, the MLA personnel routinely maintained raw, cross-functional andintegrated product-process data on a very wide range of variables. During their drawabilityproject, they had ready access to this database, which was fundamentally different from thatreadily available through the Aalter IS. Hence, they could readily test their model/hypothesesabout the interaction of soap and wire variables.
4 4 Work Teams and the Scope of Problem Solving: The Six Sigma paradigm requires specialistengineers to conduct process characterization exercises and define the performance goals at eachproduction stage. While doing so, they keep in mind the input/output specifications which link eachdepartment to its supplier and customer departments. Subsequently, departmental OCC correct thefailures of their processes to meet output specifications. Cross-functional coordination is usuallyachieved through hierarchies of MC or more commonly, steering committees (Juran & Gyrna,1980; Schonberger, 1982; Hall, 1983; Ishikawa & Lu, 1985; Shea, 1986; Gupta, et al., 1987).
9
The Production Theory paradigm relies on generalist engineers who have thorough knowledge of theoverall process control task, but possibly lack deep, specialized knowledge about individualproduction stages. These process engineers head cross-functional problem solving teams whichcreate and establish control policies after investigating their potential system-wide implications.
Since Bekaert formally introduced OCC in 1989, our evidence about the Six Sigma paradigm comesfrom the experience of quality leaders like Motorola (Gupta, et al., 1987). However, the Aalterproject did highlight the importance of the specialist: Without Maurice's knowledge, the projectwould have fallen apart at the process characterization stage. Subsequently, he and his team ofoperators also solved all soap-circuit related problems. In contrast, the manager of MLA, Paul,served as a process engineer in charge of the entire line. During the course of the Drawabilityproject, he provided day-to-day technical leadership to his cross-functional group of engineers andtechnicians. (Mukherjee, 1992, presents evidence that other engineers associated with the MLAwere expected to build similar cross-functional skills.)
4.5 The Distribution of Tasks in Plants In any plant, departmental personnel have two relatedtasks. First, they must create products and in order to do so, they must manage process controlrelated activities. Second, they must sequence production and manage the flow of materialsthrough their areas. We call this set of tasks 'production control.' The two paradigms distributethese tasks differently and thus, pose different challenges of coordinating work.
The reductionist perspective of the Six Sigma paradigm ensures that the process control knowledgeit creates needs to be possessed first hand only by the people who created it. These people canensure that there is minimal conflict between the process control and the production control tasksexecuted within their functional areas. In other words, the two sets of tasks are well aligned.Plant managers have to oversee a system which is best represented as a tree.
The holistic perspective of the Production Theory paradigm is capable of creating knowledge whichmust be distributed to and acted on by personnel in many departments. Process parameters criticalfor the effective functioning of any production stage might be controlled by the personnel at otherstages. Thus, even in ideal conditions, the degree of alignment between process and productioncontrol tasks executed in any department might be low. Thus, plant managers have to oversee asystem which is best represented as a network. The degree of difficulty experienced in managingsuch a network might rise exponentially with an increase in the number of nodes.
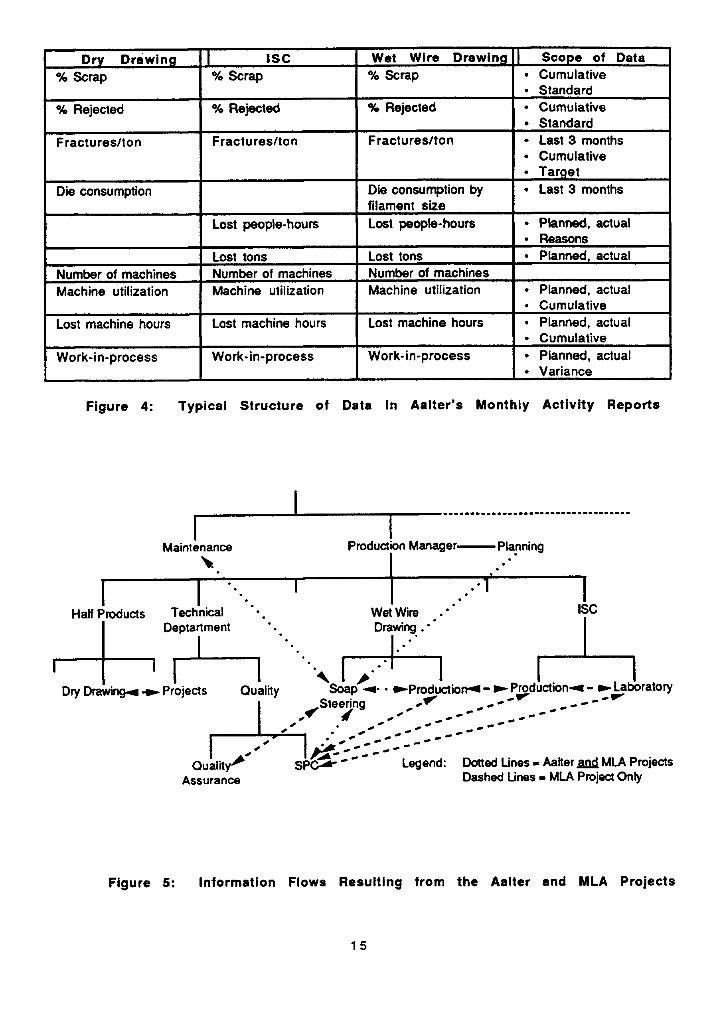
Figure 5 describes the situation fostered by the two paradigms at Bekaert. The dotted lines markthe information flows associated with the Aalter project. The soap specialist interacts with SPC,the production section of WWD, maintenance and the planning departments. SPC helps establishcontrols and procedures, maintenance looks after the soap circuits, WWD provides input ondrawability and planning provides estimates of actual and expected production levels. Only the soapspecialist possesses fundamental knowledge of soap steering. He acquires information from theothers and processes and acts on these.
Figure 5 About Here
The MLA project fostered information flows indicated by the dashed and the dotted lines in Figure 5.Dry drawing and the Technical department had to discuss process changes; SPC, ISC and WWD hadto develop controls for soap pre-dip, heat treatment and brass coating; and Half Products andQuality Assurance had to monitor rod quality. While our research did not formally document theseflows, our on-going contact with Bekaert managers indicates that the need to achieve suchcoordinated action among these players required significant effort, particularly as the results ofthis and other projects were diffused throughout Aalter.
4.6 Goals of Process Improvement Within the factory, the Six Sigma paradigm seeks to improveconformance quality. This implies that the Six Sigma paradigm accepts the design quality as the
1 0
ceiling for the level of quality achievable in the factory. This assumption directs process controlefforts at minimizing problems that prevent the firm from delivering the product as envisioned byR&D. Thus, interactions beZween R&D and plants are dominated by the former. R&D decides whatmust be done, while the plants turn to it for help in dealing with producibility concerns andproblems which fall beyond their competence.
Since it recognizes the idiosyncratic nature of contingencies, the Production Theory paradigmassumes that plants have to deal with situations which are not even apparent in the controlledenvironment of development laboratories (Sahal, 1981; Bohn, 1987). Thus, plants can createknowledge about issues which are not apparent to development engineers. This implies that designquality cannot define a performance ceiling. As such, R&D and plant personnel must interact witheach other routinely, jointly defining improvement goals, generating and testing hypotheses anddeveloping more effective process control strategies.
In the Aalter project, R&D directed the plants' management of soap circuits (e.g., by suggesting'correction factors' and modifying analytical procedures). These inputs were largely based ontheoretical analyses and laboratory-scale experiments. They were undoubtedly influenced by, butdid not formally incorporate, production experience, since the plants lacked information systemswhich could provide necessary data. Had these infrastructural impediments not existed, R&D andthe plants could have jointly improved soap steering if - and only if - R&D personnel actuallyacknowledged that plant personnel could contribute fundamental insights. In many firms, this keystep might be a difficult cultural barrier.
In contrast, the manager of the MLA, Paul, was an ex-R&D engineer. He created an infrastructuralsystems which supported formal tests of hypotheses and organized monthly State-of-the-Artmeetings which attracted scientists from R&D (and others). At the project level, by testing andapplying knowledge created by R&D under conditions of full-scale manufacturing, the MLA avoidedthe problems associated with scaling-up experiments. Moreover, it formally incorporated into theproject insights garnered from full-scale manufacturing experience. The interaction of these twobases of knowledge, a key concept of the Production Theory paradigm, enabled the MLA to point upserious short-comings in the received wisdom.
5. Concluding CommentsA summary of the differences between the two paradigms appears in Table 2. While the distinctionon any one dimension, however profound, could be explained away as a tactical managerial choice,the use of the term 'paradigms" is warranted by (i) combined magnitude of all the differences and(ii) inter-locking, internally consistent and mutually supportive nature of the goals, procedures andsystems embodied by the two approaches. For example, generalist engineers can head truly cross-functional process improvement teams only if they have direct access to multiple stages (i.e., theorganization is cellular) and can obtain cross-functional data. Under the circumstances, theirproposed solutions might cross traditional departmental boundaries.
Table 2 About Here
However, we are not suggesting that the two paradigms are mutually exclusive. Indeed, a plantwhich embodied either of the paradigms would occasionally have to adopt pages out of the other'sbook. However, the experience of 2 of the 15 projects in our database suggests that the adoptionof the Production Theory characteristics by a Six Sigma plant can be sustained only at the cost ofdisrupting normal production/process control activities. It would seem that Production Theoryplants could adopt Six Sigma characteristics much more easily, but we wonder whether repeatedadoptions would not endanger their base system. While we believe that the differences between thetwo paradigms are significant enough to make their simultaneous adoption in any plant (and indeed,any firm) a very difficult exercise, only empirical evidence can resolve this issue for certain.
11
A second issue concerns the domains of applicability of each paradigm. Earlier, we suggested thatthe Six Sigma paradigm might not be appropriate for "dynamic" production environments. Fromone perspective, dynamism might be considered a characteristic of specific industries. The SixSigma paradigm was developed and applied effectively in fabrication-assembly industries, wherethe physics and mechanics of cutting, bending and joining metals were relatively well understood(e.g., performance curves for modern high speed steel cutting tools were developed by FrederickTaylor). So, the processes were readily decomposable and defects were generally observable bytheir producers or their customers. The paradigm was effectively adopted by other industriescharacterized by similar conditions of stability in technology and production environments. TheProduction Theory paradigm is more appropriate for industries which employ continuous productiontechniques (like paper and wire), deal with new or embryonic technologies (like ceramics) or cannotmeet the challenge of immediate observation of contingencies (like semi-conductors and fiber opticdevices). In fact, for semi-conductors, Fisher et al. (1983) called for the development of controlstrategies which emphasize system-wide control of production.
Another perspective on dynamism could be anchored on the idea of stages of knowledge (Jaikumar& Bohn, 1992). At the lower stages, when little is known about a product and/or its manufacturingprocess, the Production Theory paradigm could help firms recognize key variables and theireffects. At the highest stages of knowledge, the search for complete procedural and algorithmiccontrol - typically undertaken as a prelude to CIM - would necessitate studies of secondary,tertiary and higher order interactions among product, process and environmental variables. Hereagain, the holistic approach of the Production Theory paradigm could be beneficial (see, forexample, Zuboff's (1989) description of work in CIM factories). At the middle stages ofknowledge, a reductionist, Six Sigma paradigm, approach could probably be justified. Thishypothesis is consistent with Jaikumar & Bohn's observation that most industrial processesoperate at the moderate stages of knowledge. So, we would expect to - and do - observe manymore examples of the application of the Six Sigma paradigm.
We readily acknowledge that our research is exploratory and limited by its focus on one firm. Assuch, our findings are no more than hypotheses about effective process control. Nevertheless, wewould like the reader to note that in 1990, Bekaert's CEO won the European Forum for QualityManagement Leadership award. The jury was believed to have been impressed by his vision forquality and process improvement as embodied by the MLA. In 1992, one of the other plants whichhosted our study won the first European Quality Prize. Thus, while Bekaert might not be a wellrecognized name, it is not a laggard with respect to quality and process improvement.
Future research could follow two related but distinct paths. First, multiple small sample casestudies in industries like ceramics and semi-conductors could be undertaken to substantiate andrefine the characteristics of the Production Theory paradigm. Such studies could also examinecritical procedural issues like: the difficulties experienced in simultaneously trying to apply bothparadigms (at the level of the plant or the firm), effective means for transferring knowledge froma learning cell to the rest of the plant (firm), challenges of managing plants where productioncontrol and process control are not aligned and the difficulties of managing manufacturing and R&Das a team. Second, large sample, multi-industry, statistical studies could be undertaken toempirically explore the domains of applicability of both paradigms and the relative costs andbenefits of applying them. Both streams of work would establish the degree of generalization of theconcepts we have presented here.
12
Six Sigma Paradigm Production Theory Paradigm
Plant managers select ambitious targets forconformance quality. Often, R&D managers settargets for design quality.
Plant specialists decompose the productionprocess into key steps and bring each stepunder SPC. Often, R&D personnel optimizedesigns against known sources of problems.
High level cross-functional committeescoordinate plant-wide tasks.
Departmental OCC monitor day-to-dayperformance and manage problem solving.
Plant and R&D managers jointly establish goalsfor improving products and processes.
Plants collect data on product, process andenvironmental variables which could potentiallyaffect quality or productivity.
Plant and R&D personnel undertake integrated,cross-functional problem solving to understandhow these variables affect each other.
Plant personnel impose control (statistical orotherwise) on important variables.
Table 1: Key Elements of the Paradigms
Figure 1: Schematic Cross-sectional View of the Drawing Process
13
Raw Material Pickling Dry Drawing(1 line) (5 machines)
(1 operator) (1 operator)
(most) )0.. Patenting(1 line)
(2 operators)
(some)
Bunching-Nalr--- Wet Wire Drawing-4— ISC Dry Drawing(400 machines) (400 machines) (6 lines) (15 machines)(20 operators) (12 operators) (4 operators) (2 operators)
Note: x and y dependon specific cord beingmanufactured
Am, Rewinding—* Testing & WarehouseSpiral Winding(small amountr(400 machines) (155 machines)(20 operators) (8 operators)
Figure 2: Process Flow Diagram for a Medium Sized Plant(Numbers of people are given on a per-shift basis)
Plant Manager
I I IFinance Production Manager Planning MLA
—11EDP
I I I I1_1_1 rinISC
I I
BunchingWrapping
& Rewinding & TechnicalSpiral Warehouse
I
Hall Products
Pickling, CA Production Lab Production Soap Projects QualityBA, IPH SteeringDie SPC/
Shop TOC
Figure 3: Partial Organization Chart of the Aalter Plant(Note: Relative positioning of the departments bear no relation to their importance)
Other Departments
14
Dry Drawing I ISC Wet Wire Drawing I Scope of Data% Scrap % Scrap % Scrap • Cumulative
• Standard% Rejected % Rejected % Rejected • Cumulative
• StandardFractures/ton Fractures/ton Fractures/ton • Last 3 months
• Cumulative• Target
Die consumption Die consumption byfilament size
• Last 3 months
Lost people-hours Lost people-hours • Planned, actual• Reasons
Lost tons Lost tons • Planned, actualNumber of machines Number of machines Number of machinesMachine utilization Machine utilization Machine utilization • Planned, actual
• CumulativeLost machine hours Lost machine hours Lost machine hours • Planned, actual
• CumulativeWork-in-process Work-in-process Work-in-process • Planned, actual
• Variance
Figure 4: Typical Structure of Data In Aalter's Monthly Activity Reports
I I 1
Maintenance Production Manager PlanningNt • •
I II . •
Half Products Technical .• Wet Wire .* ISC
1 .•
•I I1
Drawing . •Deptartment .
I ■IA 1 1 I
Dry Drawing.. -a.- Projects Quality Soap -NIP • a-Production-NI- to- Production -4 - ea- Laboratory1 ,..Steei;ing ............Y.
... - ... - - ▪
_ ▪ ...... -.° -
I . . .... ...- ... ... -...
I .• ' - 1 _ ,,.. ..... .. ice/I Pia- -... - - ... - - - ..- -
Quality-dill' SPCC' - Legend: Dotted Lines . Aatter lad MLA ProjectsAssurance Dashed Lines - MLA Project Only
Figure 5: Information Flows Resulting from the Aalter and MLA Projects
15
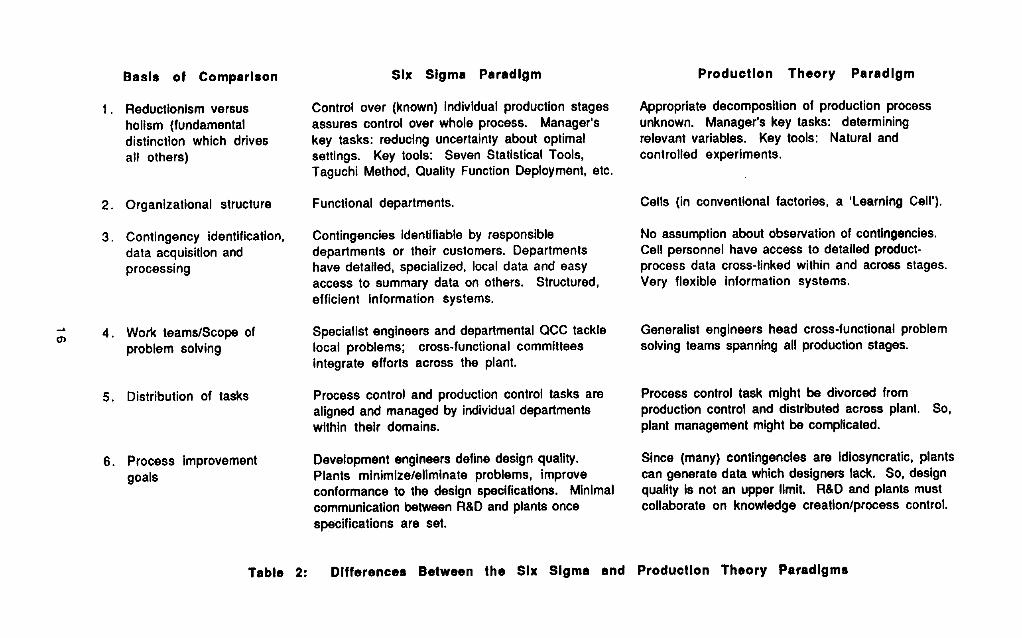
8. Work teams/Scope ofproblem solving
9. Distribution of tasks
10. Process improvementgoals
Six Sigma Paradigm
Control over (known) Individual production stagesassures control over whole process. Manager'skey tasks: reducing uncertainty about optimalsettings. Key tools: Seven Statistical Tools,Taguchi Method, Quality Function Deployment, etc.
Functional departments.
Contingencies Identifiable by responsibledepartments or their customers. Departmentshave detailed, specialized, local data and easyaccess to summary data on others. Structured,efficient information systems.
Specialist engineers and departmental ()CC tacklelocal problems; cross-functional committeesintegrate efforts across the plant.
Process control and production control tasks arealigned and managed by individual departmentswithin their domains.
Development engineers define design quality.Plants minimize/eliminate problems, improveconformance to the design specifications. Minimalcommunication between R&D and plants oncespecifications are set.
Production Theory Paradigm
Appropriate decomposition of production processunknown. Manager's key tasks: determiningrelevant variables. Key tools: Natural andcontrolled experiments.
Cells (in conventional factories, a 'Learning Cell').
No assumption about observation of contingencies.Cell personnel have access to detailed product-process data cross-linked within and across stages.Very flexible Information systems.
Generalist engineers head cross-functional problemsolving teams spanning all production stages.
Process control task might be divorced fromproduction control and distributed across plant. So,plant management might be complicated.
Since (many) contingencies are idiosyncratic, plantscan generate data which designers lack. So, designquality is not an upper limit. R&D and plants mustcollaborate on knowledge creation/process control.
Basis of Comparison
1. Reductionism versusholism (fundamentaldistinction which drivesall others)
2. Organizational structure
3. Contingency identification,data acquisition andprocessing
Table 2: Differences Between the Six Sigma and Production Theory Paradigms
References
Abernathy, W.J., K.B. Clark & A. Kantrow, Industrial Renaissance, Basic Books, New York, 1983.
Allen, T.J., Managing the Flow of Technology, MIT Press, Cambridge, 1977.
Bohn, R., Learning by Experimentation in Manufacturing, HBS Working Paper 88-001, 1987.
Bonoma, T.V., Case Research in Marketing: Opportunities, Problems, and a Process Journal ofMarketing Research May 1985.
Deming, W.E., Quality, Productivity, and Competitive Position, MIT Center for AdvancedEngineering Study, Cambridge, 1982.
Fisher, R., et aL, International Competition in Electronics, Office of Technology Assessment ReportOTA-ISC-200, November 1983.
Griffin, A., Evaluating QFD's Use in US Firms as a Process for Developing Products Journal ofProduct Innovation Management, September 1992.
Gupta, P., et. at, A Systematic Approach to SPC implementation, Quality Progress April 1987.
Hall, R.W., Zero Inventories, Dow-Jones Irwin, Homewood, 1983.
Hauser, J. & D. Clausing, The House of Quality, Harvard Business Review, May-June, 1988.
Hofstadter, D., Prelude ... Ant Fugue, in The Mind's I: Fantasies and Reflections on Self and Soul,composed and arranged by Douglas Hofstadter and Daniel Dennett, Bantam Books, New York, 1981.
Imai, M., Kaizen, the Key to Japan's Competitive Success, Random House, Nevi York, 1986.
Ishikawa, K. & D.J. Lu, What is Total Quality Control? Prentice-Hall, Englewood Cliffs, 1985.
Jaikumar, R., Intelligent Manufacturing Control, in The Competitive Fdge • Research Priorities forU S Manufacturing, National Research Council, National Academy Press, 1991.
Jaikumar, R. & R. Bohn, A Dynamic Approach to Operations Management An Alternative to StaticOptimization, international Journal of Production Fconomics. May 1992.
Juran, J.M., & F.M. Gyrna, Quality Planning and Analysis, 2nd. ed., McGraw-Hill, New York, 1980.
Kackar, R., Off-Line Quality Control, Parameter Design, and the Taguchi Method, Journal of QualityTechnology, October 1985.
Kane, V.E., Process Capability indices, Journal of Quality Technology January 1986.
Lawrence, P.R. & J.W. Lorsch, Organization and Environment, HBS Press, Boston, 1967.
Mukherjee, A.S., The Effective Management of Organizational Learning and Process Control in theFactory, Unpublished Doctoral Dissertation, Harvard Business School, Boston, 1992.
Sahal, D., Patterns of Technological Change, Addison-Wesley, Reading, 1981.
Schonberger, R., Japanese Manufacturing Techniques: Nine Hidden Lessons in Simplicity, The FreePress, New York, 1982.
17
Shea, G.P., Quality Circles: The Danger of Bottled Change, Sloan Management Review, Spring1986.
Shirley, G.V. & R. Jaikumar, Turing Machines and Gutenberg Technologies, Manufacturing Review,March 1988.
Streufert, S. & R.B. Swezey, Complexity, Managers, and Organizations, Academic Press, Orlando,1986.
Wheelwright, S. & K.B. Clark, Revolutionizing Product Development, Free Press, New York, 1992.
Zuboff, S., In the Age of the Smart Machine, Basic, New York, 1989.
18