Embed Size (px)
Citation preview
Parallel Computing 47 (2015) 51–69
Contents lists available at ScienceDirect
Parallel Computing
journal homepage: www.elsevier .com/ locate/parco
Parallel color-coding
http://dx.doi.org/10.1016/j.parco.2015.02.0040167-8191/� 2015 Elsevier B.V. All rights reserved.
⇑ Corresponding author.E-mail addresses: [email protected] (G.M. Slota), [email protected] (K. Madduri).
George M. Slota, Kamesh Madduri ⇑Department of Computer Science and Engineering, The Pennsylvania State University, United States
a r t i c l e i n f o
Article history:Available online 28 February 2015
Keywords:Color-codingParallelizationProtein interaction networksMotifsSubgraph countingPathways
a b s t r a c t
We present new parallelization and memory-reducing strategies for the graph-theoreticcolor-coding approximation technique, with applications to biological network analysis.Color-coding is a technique that gives fixed parameter tractable algorithms for severalwell-known NP-hard optimization problems. In this work, by efficiently parallelizing stepsin color-coding, we create two new biological protein interaction network analysis tools:FASCIA for subgraph counting and motif finding and FASTPATH for signaling pathway detec-tion. We demonstrate considerable speedup over prior work, and the optimizations intro-duced in this paper can also be used for other problems where color-coding is applicable.
� 2015 Elsevier B.V. All rights reserved.
1. Introduction
The color-coding method is a simple and elegant graph-theoretic strategy that gives fixed parameter tractable algorithmsfor several NP-hard optimization problems. Color-coding was first proposed by Alon et al. [1]. In this paper, we present effi-cient shared- and distributed-memory parallelizations of this strategy, using new data structures and optimizations toreduce peak memory utilization and inter-processor communication. We also create two new software tools, FASCIA andFASTPATH, that use parallel color-coding to solve bioinformatics problems.
The problem of counting the number of occurrences of a template or subgraph within a large graph is commonly termedsubgraph counting. This problem is very similar to the classical subgraph isomorphism problem. Related problems, such assubgraph enumeration, tree isomorphism, motif finding, frequent subgraph identification, etc. are all fundamental graphanalysis methods to identify latent structure in complex data sets. They have applications in bioinformatics [2–4], chemoin-formatics [5], online social network analysis [6], network traffic analysis, and many other areas.
Subgraph counting and enumeration are compute-intensive problems. A naïve algorithm, which exhaustively enumeratesall vertices reachable in k hops from a vertex, runs in OðnkÞ time, where n is the number of vertices in the network and k is thenumber of vertices in the subgraph. For large networks, this running time complexity puts a constraint of the size of the sub-graph (value of k). If k is larger than 2 or 3, exact counting becomes prohibitively expensive. Thus, there has been a lot ofrecent work on approximation algorithms. Approaches are generally based on sampling or on exploiting network topology.Sampling-based methods analyze a subset of the network and extrapolate counts based on the observed occurrences andnetwork properties. Some tools based on sampling are MFINDER [7], FANMOD [8], and GRAFT [9]. The other class of methodsimpose some constraint on the network or transform the network so that the possible search space is restricted. Examples oftools imposing constraints on the network are NEMO [10] and SAHAD [11]. Tools based on the color-coding method belongto the second category, and this forms the basis of our current work.
52 G.M. Slota, K. Madduri / Parallel Computing 47 (2015) 51–69
The color-coding method for this problem uses a dynamic programming scheme to generate an approximate count of a
given non-induced tree-structured subgraph/template (also referred to as a treelet) in Oðm � 2kÞ time, where m is the number ofedges in the network. The algorithm can be informally stated as follows: every node in a network is randomly colored withone of at least k possible colors. The number of colorful embeddings of a given input template is then counted, where colorfulin this context means that each node in the template embedding has a distinct color. The total embedding count is thenscaled by the probability that the template is colorful, in order to generate an approximation for the total number of possibleembeddings. This colorful embedding counting scheme avoids the prohibitive OðnkÞ bound seen in exhaustive search.
Color-coding can also be applied in an entirely different context. Consider the NP-hard optimization problem [12] of find-ing the minimum-weight simple path of path length k in a weighted graph with positive edge weights. This problem is of con-siderable interest in bioinformatics, specifically in the analysis of paths in protein interaction networks. With anappropriately-defined edge weight scheme, paths with the minimum weight, or in general close to the minimum weight,often have vertices that belong to biologically-significant subgraphs such as signaling networks and metabolic pathways[13,14]. As in the case of subgraph counting, color-coding can only offer an approximate solution to this NP-hard problem.With some confidence and error bounds, it is guaranteed to return simple paths with weight close to the minimum pathweight. The low-weight paths returned through color-coding are shown to be good candidates for signaling pathways[12]. We present a shared-memory parallelization of the approximate low-weight path enumeration strategy.
Color-coding can be in general applied to finding any subgraphs with a bounded tree-width in polynomial time, by exe-cuting the color-coding algorithm with the tree decomposition of the subgraph [1]. However, in this work, we only considerfinding treelets, which are subgraphs with a tree-width of 1. Another application of color-coding that is not included in thiswork is for finding cycles of length k. We also note that all algorithms using color-coding can be derandomized by usingfamilies of perfect hash functions. However, we observe in practice that an optimal, or near-optimal solution, can usuallybe found much quicker with only the randomized approach.
1.1. Summary of contributions
We present several new optimizations that may be applicable to approximation algorithms that are based on color-cod-ing. We give general methodologies for shared-memory and distributed-memory parallelization. We discuss strategies toreduce overhead in the inner loops of the algorithm, present a combinatorial numbering system to represent unique color-ings, and a simple template partitioning method for subgraph counting. We also give a compressed data structure represen-tation to reduce communication and memory costs when analyzing large-scale networks in a distributed environment.
Through these optimizations, we offer orders-of-magnitude speedup relative to prior software tools for subgraph count-ing and path enumeration [15,11,4]. Additionally, our implementations allow
� Approximate subgraph counts for templates of size up to 7 vertices in 100 million-edge networks, in a few seconds(through shared-memory parallelism and optimizations).� Approximate subgraph counts for templates of size up to 9 vertices in billion-edge networks, in a few minutes (through
additional distributed-memory parallelism and optimizations).� Low-weight path enumeration for paths of length 9 in protein-interaction networks, in a few seconds.
We provide open-source versions of both our shared-memory approximate subgraph counting (FASCIA [16]) and path enu-meration (FASTPATH [17]) tools.
2. Related work
There is considerable prior work on improvements and extensions to color-coding, and applying it to solve various graph-theoretic problems. We focus on the problems of counting tree-structured subgraphs and enumerating low-weight paths inthis paper. Color-coding can also be used to count and enumerate cycles, cliques, and bounded treewidth subgraphs [1].
2.1. Subgraph counting
Subgraph counting has recently emerged as a widely-used graph analytic in various domains, especially the biologicaland social sciences. Przulj has demonstrated that graphlets— all 2–5 vertex induced undirected subgraphs — are a useful ana-lytic for biological network comparisons [3]. Przulj and Milenkovic et al. have extended this work to several other subgraph-based comparative metrics [18–20]. Bordino et al. used counts of both small undirected and directed subgraphs, similar tographlets, to cluster networks of various types (e.g. citation networks, road networks, etc.) [21].
Alon et al. implemented color-coding subgraph counting to demonstrate its applicability for finding large tree-structuredmotifs in biological networks [4]. Zhao et al. implemented distributed color-coding subgraph counting for large graphs viaboth MPI and MapReduce, with applications in social network analysis [15,11]. We recently designed FASCIA, and show that itachieves considerable speedups relative to prior work in both shared and distributed-memory environments. We also useFASCIA to demonstrate the applicability of treelets for a number of subgraph counting-based analytics [22,23].
G.M. Slota, K. Madduri / Parallel Computing 47 (2015) 51–69 53
2.2. Minimum-weight paths and related problems
Given a graph with positive edge weights and a path length k, finding the minimum-weighted simple paths (or paths)among all possible paths of length k is a useful graph analytic, particularly in bioinformatics [13,14]. Scott et al. were the firstto use the color-coding technique to find low-weight paths, with the use case of detecting signaling pathways in protein inter-action networks [12]. Vertices in these networks are proteins, and edge weights are the negative log of the probability that thetwo proteins interact. Thus, simple paths with low weights correspond to chains of protein that would interact with high con-fidence. Hüffner et al. expanded on this initial work by offering several optimizations to the baseline algorithm to improverunning times, including choosing an appropriate number of colors to decrease iteration counts and implementing a pruningstrategy [24] that complements coloring. More recently, Gabr et al. further decreases the number of iterations required for agiven confidence bound through per-iteration examination of graph colorings [25]. Color-coding has also been used for query-ing linear pathways in protein interaction networks by Shlomi et al. [26]. This work was expanded for more complex boundedtree-width queries by Dost et al. [27]. Similar to the aforementioned Gabr et al. work, Gülsoy et al. speed up pathway and smallbounded tree-width querying by reducing the number of iterations required for a given confidence bound [28,29].
3. Our color-coding implementations
3.1. Subgraph counting with FASCIA
We first present the algorithmic details of applying the color-coding method for tree-structured subgraph counting [22].As shown in Algorithm 1, there are three main phases in the algorithm: template partitioning, random coloring, and thedynamic programming count phase. The pseudocode for the dynamic programming phase is described in Algorithm 2.The coloring and dynamic programming steps are repeated for multiple iterations to estimate the subgraph count. Alonet al. [1] prove that to guarantee a count bound of Cð1� �Þ with probability 1� 2d (C being the exact count), we would needto run at most Niter iterations, as defined in Algorithm 1. Using a topology-aware coloring scheme [29,28,25], prior work hasshown that a tighter upper bound can be obtained. We observe that the number of iterations necessary to produce accurateglobal counts on large networks is far lower in practice [22,11], and we will also demonstrate this in Section 4.
Algorithm 1. Subgraph counting using color-coding
1: Partition input template T (k vertices) into subtemplates using single edge cuts.
2: Determine Niter � ek log 1=d�2 , the number of iterations to execute. d and � are input parameters that control
approximation quality.3: for all it ¼ 1 to Niter do . Outer loop parallelism4: Randomly assign to each v 2 G a color between 0 and k� 1.5: Use a dynamic programming scheme to count colorful occurrences of T.6: Take average count of all Niter counts to be final count.
In the input template partitioning phase, a single vertex is first specified to be the root of the template. A single edge adja-cent to the root is cut, creating two children subtemplates. The child subtemplate containing the original root vertex is calledthe active child, with its root specified again as the original root vertex. The other child will be termed as the passive child,with its root as the vertex that was connected to the original root vertex through the edge that was cut. We now havetwo rooted subtemplates. We recursively continue to cut these subtemplates down to single vertices, keeping track of thepartitioning tree, where each subtemplate greater than one vertex in size has both an active and passive child subtemplate.Every subtemplate has a parent. This tree can be traced from the bottom up to the original template, which is how we willperform the dynamic programming phase of the color coding algorithm. We also sort them in the order in which the sub-templates are accessed, in order to reduce memory usage.
The graph G is next randomly colored. For every vertex v, we assign a color between 0 and k� 1, where k is the maximumnumber of colors. k needs to be greater than or equal to the number of vertices in T. We will consider k equal to the size of Tnow for simplicity. It has been demonstrated that higher values of k can decrease the required iterations for a given errorbound [24]. However, note that this considerably increases memory requirements as well.
Consider first a naïve table structure. We need to be able to store non-zero counts for every vertex and for all possible colorsets. For a given subtemplate Si of size h, a color set can be considered to be the mapping of h unique color values to each vertexin Si. We create a three dimensional tabular structure and initialize all values to zero. We can then proceed to the inner loops,which contain the dynamic programming-based counting step of the algorithm.
Algorithm 2 details the inner nested loops that we have for the algorithm. The outermost loop will perform, in order, thebottom-up count for each subtemplate, tracing along the partition tree that we previously created. For every subtemplate,we will then consider every vertex v 2 G. If our subtemplate is of size 1, we know that its count at v is 0 for all possible kcolor sets of a single vertex, except for the color set that consists of the color equal to the color randomly assigned to v,where it is 1.
54 G.M. Slota, K. Madduri / Parallel Computing 47 (2015) 51–69
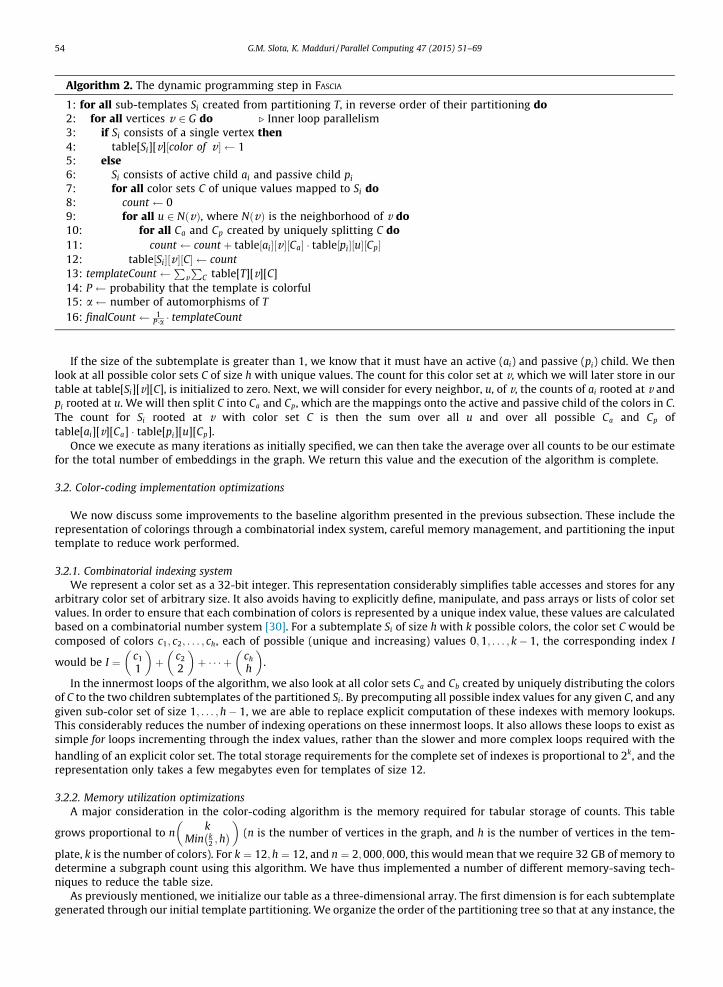
Algorithm 2. The dynamic programming step in FASCIA
1: for all sub-templates Si created from partitioning T, in reverse order of their partitioning do2: for all vertices v 2 G do . Inner loop parallelism3: if Si consists of a single vertex then4: table[Si][v]½color of v � 15: else6: Si consists of active child ai and passive child pi
7: for all color sets C of unique values mapped to Si do8: count 09: for all u 2 NðvÞ, where NðvÞ is the neighborhood of v do10: for all Ca and Cp created by uniquely splitting C do11: count count þ table½ai�½v �½Ca� � table½pi�½u�½Cp�12: table½Si�½v �½C� count13: templateCount
PvP
C table[T][v][C]14: P probability that the template is colorful15: a number of automorphisms of T16: finalCount 1
P�a � templateCount
If the size of the subtemplate is greater than 1, we know that it must have an active (ai) and passive (pi) child. We thenlook at all possible color sets C of size h with unique values. The count for this color set at v, which we will later store in ourtable at table[Si][v][C], is initialized to zero. Next, we will consider for every neighbor, u, of v, the counts of ai rooted at v andpi rooted at u. We will then split C into Ca and Cp, which are the mappings onto the active and passive child of the colors in C.The count for Si rooted at v with color set C is then the sum over all u and over all possible Ca and Cp oftable[ai][v][Ca] � table[pi][u][Cp].
Once we execute as many iterations as initially specified, we can then take the average over all counts to be our estimatefor the total number of embeddings in the graph. We return this value and the execution of the algorithm is complete.
3.2. Color-coding implementation optimizations
We now discuss some improvements to the baseline algorithm presented in the previous subsection. These include therepresentation of colorings through a combinatorial index system, careful memory management, and partitioning the inputtemplate to reduce work performed.
3.2.1. Combinatorial indexing systemWe represent a color set as a 32-bit integer. This representation considerably simplifies table accesses and stores for any
arbitrary color set of arbitrary size. It also avoids having to explicitly define, manipulate, and pass arrays or lists of color setvalues. In order to ensure that each combination of colors is represented by a unique index value, these values are calculatedbased on a combinatorial number system [30]. For a subtemplate Si of size h with k possible colors, the color set C would becomposed of colors c1; c2; . . . ; ch, each of possible (unique and increasing) values 0;1; . . . ; k� 1, the corresponding index I
would be I ¼ c1
1
� �þ c2
2
� �þ � � � þ ch
h
� �.
In the innermost loops of the algorithm, we also look at all color sets Ca and Cb created by uniquely distributing the colorsof C to the two children subtemplates of the partitioned Si. By precomputing all possible index values for any given C, and anygiven sub-color set of size 1; . . . ;h� 1, we are able to replace explicit computation of these indexes with memory lookups.This considerably reduces the number of indexing operations on these innermost loops. It also allows these loops to exist assimple for loops incrementing through the index values, rather than the slower and more complex loops required with the
handling of an explicit color set. The total storage requirements for the complete set of indexes is proportional to 2k, and therepresentation only takes a few megabytes even for templates of size 12.
3.2.2. Memory utilization optimizationsA major consideration in the color-coding algorithm is the memory required for tabular storage of counts. This table
grows proportional to nk
Min k2 ;h� �� �
(n is the number of vertices in the graph, and h is the number of vertices in the tem-
plate, k is the number of colors). For k ¼ 12;h ¼ 12, and n ¼ 2;000; 000, this would mean that we require 32 GB of memory todetermine a subgraph count using this algorithm. We have thus implemented a number of different memory-saving tech-niques to reduce the table size.
As previously mentioned, we initialize our table as a three-dimensional array. The first dimension is for each subtemplategenerated through our initial template partitioning. We organize the order of the partitioning tree so that at any instance, the
G.M. Slota, K. Madduri / Parallel Computing 47 (2015) 51–69 55
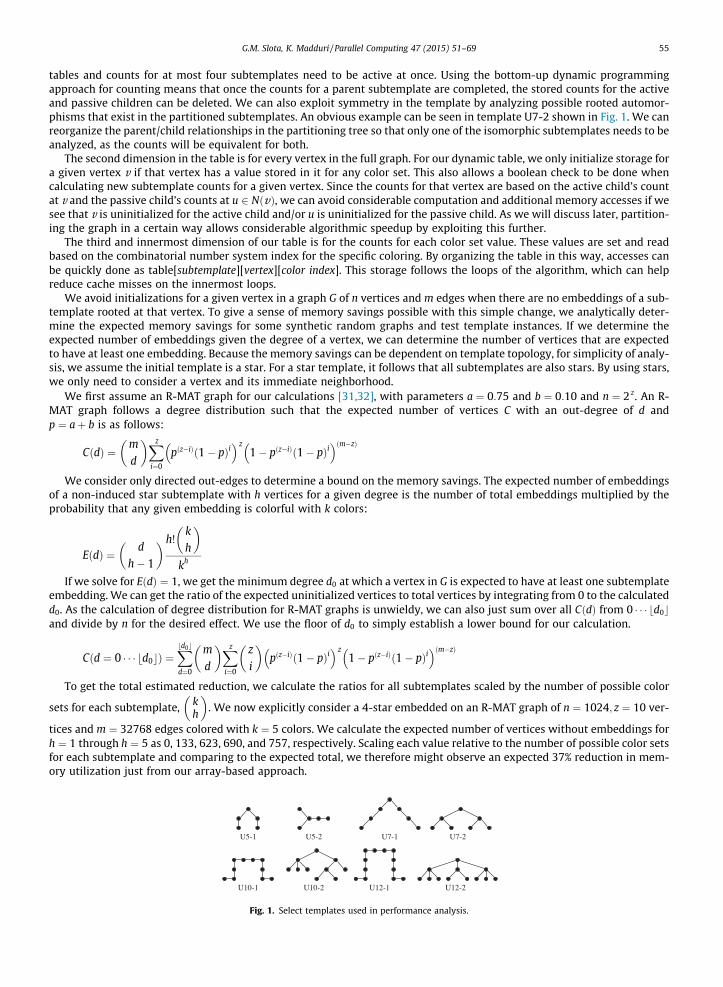
tables and counts for at most four subtemplates need to be active at once. Using the bottom-up dynamic programmingapproach for counting means that once the counts for a parent subtemplate are completed, the stored counts for the activeand passive children can be deleted. We can also exploit symmetry in the template by analyzing possible rooted automor-phisms that exist in the partitioned subtemplates. An obvious example can be seen in template U7-2 shown in Fig. 1. We canreorganize the parent/child relationships in the partitioning tree so that only one of the isomorphic subtemplates needs to beanalyzed, as the counts will be equivalent for both.
The second dimension in the table is for every vertex in the full graph. For our dynamic table, we only initialize storage fora given vertex v if that vertex has a value stored in it for any color set. This also allows a boolean check to be done whencalculating new subtemplate counts for a given vertex. Since the counts for that vertex are based on the active child’s countat v and the passive child’s counts at u 2 NðvÞ, we can avoid considerable computation and additional memory accesses if wesee that v is uninitialized for the active child and/or u is uninitialized for the passive child. As we will discuss later, partition-ing the graph in a certain way allows considerable algorithmic speedup by exploiting this further.
The third and innermost dimension of our table is for the counts for each color set value. These values are set and readbased on the combinatorial number system index for the specific coloring. By organizing the table in this way, accesses canbe quickly done as table[subtemplate][vertex][color index]. This storage follows the loops of the algorithm, which can helpreduce cache misses on the innermost loops.
We avoid initializations for a given vertex in a graph G of n vertices and m edges when there are no embeddings of a sub-template rooted at that vertex. To give a sense of memory savings possible with this simple change, we analytically deter-mine the expected memory savings for some synthetic random graphs and test template instances. If we determine theexpected number of embeddings given the degree of a vertex, we can determine the number of vertices that are expectedto have at least one embedding. Because the memory savings can be dependent on template topology, for simplicity of analy-sis, we assume the initial template is a star. For a star template, it follows that all subtemplates are also stars. By using stars,we only need to consider a vertex and its immediate neighborhood.
We first assume an R-MAT graph for our calculations [31,32], with parameters a ¼ 0:75 and b ¼ 0:10 and n ¼ 2 z. An R-MAT graph follows a degree distribution such that the expected number of vertices C with an out-degree of d andp ¼ aþ b is as follows:
CðdÞ ¼m
d
� �Xz
i¼0
pðz�iÞð1� pÞi� � z
1� pðz�iÞð1� pÞi� �ðm�zÞ
We consider only directed out-edges to determine a bound on the memory savings. The expected number of embeddingsof a non-induced star subtemplate with h vertices for a given degree is the number of total embeddings multiplied by theprobability that any given embedding is colorful with k colors:
EðdÞ ¼d
h� 1
� �h!k
h
� �kh
If we solve for EðdÞ ¼ 1, we get the minimum degree d0 at which a vertex in G is expected to have at least one subtemplateembedding. We can get the ratio of the expected uninitialized vertices to total vertices by integrating from 0 to the calculatedd0. As the calculation of degree distribution for R-MAT graphs is unwieldy, we can also just sum over all CðdÞ from 0 � � � d0b cand divide by n for the desired effect. We use the floor of d0 to simply establish a lower bound for our calculation.
Cðd ¼ 0 � � � d0b cÞ ¼Xd0b c
d¼0
m
d
� �Xz
i¼0
z
i
� �pðz�iÞð1� pÞi� � z
1� pðz�iÞð1� pÞi� �ðm�zÞ
To get the total estimated reduction, we calculate the ratios for all subtemplates scaled by the number of possible color
sets for each subtemplate, kh
� �. We now explicitly consider a 4-star embedded on an R-MAT graph of n ¼ 1024; z ¼ 10 ver-
tices and m ¼ 32768 edges colored with k ¼ 5 colors. We calculate the expected number of vertices without embeddings forh ¼ 1 through h ¼ 5 as 0, 133, 623, 690, and 757, respectively. Scaling each value relative to the number of possible color setsfor each subtemplate and comparing to the expected total, we therefore might observe an expected 37% reduction in mem-ory utilization just from our array-based approach.
U5-1 U5-2 U7-1 U7-2
U10-1 U10-2 U12-1 U12-2
Fig. 1. Select templates used in performance analysis.
56 G.M. Slota, K. Madduri / Parallel Computing 47 (2015) 51–69
Similarly, we can calculate the expected memory savings for a Gðn; pÞ random graph. Using the same d0, we can get theestimated reduction ratios by taking the integral over the degree distribution from 0 � � � d0:
Z d0
0
n� 1d
� �mn2
� �d1� m
n2
� �ðn�1�dÞdx
With the same parameters of n and m, we observe less than a 1% reduction for memory utilization. This is due to the rela-tively even degree distribution centered around an average degree much higher than what is needed to embed a 4-star.
For high-selectivity templates, we have also developed a hashing scheme that can be used in the place of a three-dimen-sional array. The key values used are calculated for vertex v and color set C as follows, where v id is the numeric identifier ofthe vertex, I is the color set’s combinatorial index, and Nc is the total number of color set combinations for the current sub-template: key ¼ v id � Nc þ I. Calculating the key in this way ensures unique values for all combinations of vertices and colorsets. Additionally, if we initialize and resize the hash table to simply be a factor of n � Nc , where n is the number of vertices inG, we can use a very simple hash function of ðkeymodnÞ. This gives a relatively uniform distribution across all possible hashindexes based on the initial random coloring of G.
The memory requirements for the hashing approach is dependent on the number of total embeddings rather than thenumber of vertices with at least one embedding. As such, this hashing scheme will generally save memory over the simplerarray-based scheme when a template occurs with high regularity rooted at certain vertices within G, but with low regularityrelative to the number of possible color sets. As we will demonstrate in our results, this approach is quite effective with regu-lar templates on regular graphs (such as road networks).
3.2.3. Template partitioningWe also explore various template partitioning strategies. When possible, we employ a one-at-a-time approach, where we
partition a given subtemplate so that either the active or passive child is a single vertex. There are two reasons why we do
this. The running time of the two innermost loops of the algorithm are dependent on khi
� �� hi
ai
� �, where k is the number of
colors, hi is the number of vertices in the subtemplate we are getting the count for, and ai is the number of vertices in the
active child of that subtemplate (note that hi
ai
� �¼ hi
pi
� �, where pi is the number of vertices in the passive child). The run-
ning time of the algorithm grows as the sum over all khi
� �� hi
ai
� �, for every pair of hi and ai, at each step in the partitioning
tree. A one-at-a-time approach can minimize this sum for larger templates (except when exploiting rooted symmetry), as thelarger multiplicative factors tend to dominate with a more even partitioning.
However, we observe faster performance with a one-at-a-time partitioning approach over the symmetry-based templatepartitioning. This is due to the fact that by setting the active child as the single partitioned vertex at each step when possible,we can reduce the total number of color sets at each vertex v by a factor of k�1
k . The count at each v is dependent on the countfor the active child with a given color set, and only one color set for a single vertex subtemplate exists that has a non-zerocount: the coloring of v.
Also, note that the root selection can impact how the template can be partitioned using the one-at-a-time approach. Ourstrategy is to randomly select a leaf vertex as the initial root. After the first cut, we continue to greedily prune leaf verticeswhenever possible. We have not yet explored other ways of determining the root. This might make for interesting future work.
3.3. Shared-memory parallelism
We support shared-memory parallelism in FASCIA using the OpenMP programming model and have two modes of multi-threaded parallelism. The choice is left to the user and is dependent on graph and template size. For large graphs, we par-allelize the loop that calculates counts for all vertices v 2 G. Each thread is assigned a unique set of vertices, for which itcalculates and stores the next level of counts. Because vertices are partitioned among threads, and given the tabular layoutof the counts table, there is no concurrent writes to shared locations.
However, for small graphs and small templates, the ratio of available parallel work to the necessary serial computationalportion is low, and multithreaded performance suffers. Therefore, for this instance, we perform multiple outer loop iterationsconcurrently, where each thread independently computes the full counts for a subset of the total number of iterations. Eachthread necessarily has its own dynamic table. The counts are then collected and averaged after the specified number of itera-tions is completed. Due to the fact that each thread initializes its own table, the memory requirements increase linearly as afunction of the number of threads. However, for smaller graphs where this outer loop parallelization works better, the vertexcounts are small enough that this is unlikely an issue, even while running on a system with limited memory.
While both inner and outer loop parallelism offer speedups over serial code, the choice is dependent on graph and sub-graph topology as well as the runtime system. A hybrid strategy that combines both levels of parallelism is additionally pos-sible. A dynamic scheduler that determines the optimal parallel strategy for a given input would make for interesting futurework, but our current version of FASCIA leaves the choice as an input parameter to be given by the user.
G.M. Slota, K. Madduri / Parallel Computing 47 (2015) 51–69 57
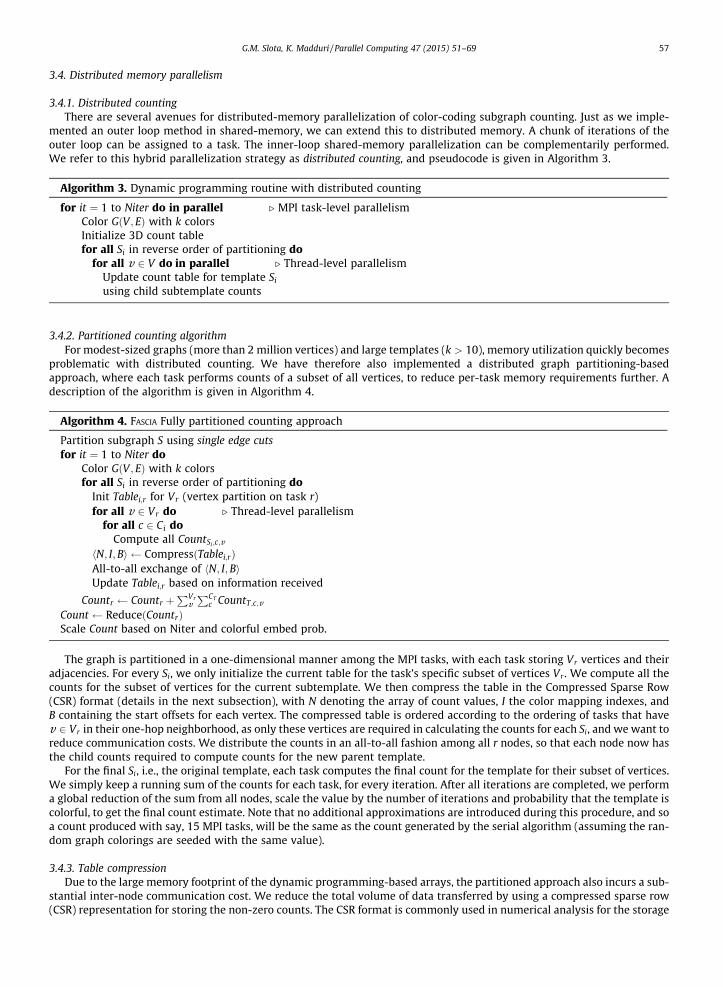
3.4. Distributed memory parallelism
3.4.1. Distributed countingThere are several avenues for distributed-memory parallelization of color-coding subgraph counting. Just as we imple-
mented an outer loop method in shared-memory, we can extend this to distributed memory. A chunk of iterations of theouter loop can be assigned to a task. The inner-loop shared-memory parallelization can be complementarily performed.We refer to this hybrid parallelization strategy as distributed counting, and pseudocode is given in Algorithm 3.
Algorithm 3. Dynamic programming routine with distributed counting
for it ¼ 1 to Niter do in parallel . MPI task-level parallelismColor GðV ; EÞ with k colorsInitialize 3D count tablefor all Si in reverse order of partitioning do
for all v 2 V do in parallel . Thread-level parallelismUpdate count table for template Si
using child subtemplate counts
3.4.2. Partitioned counting algorithmFor modest-sized graphs (more than 2 million vertices) and large templates (k > 10), memory utilization quickly becomes
problematic with distributed counting. We have therefore also implemented a distributed graph partitioning-basedapproach, where each task performs counts of a subset of all vertices, to reduce per-task memory requirements further. Adescription of the algorithm is given in Algorithm 4.
Algorithm 4. FASCIA Fully partitioned counting approach
Partition subgraph S using single edge cutsfor it ¼ 1 to Niter do
Color GðV ; EÞ with k colorsfor all Si in reverse order of partitioning do
Init Tablei;r for Vr (vertex partition on task r)for all v 2 Vr do . Thread-level parallelism
for all c 2 Ci doCompute all CountSi ;c;v
hN; I;Bi CompressðTablei;rÞAll-to-all exchange of hN; I;BiUpdate Tablei;r based on information received
Countr Countr þPVr
vPCT
c CountT;c;v
Count ReduceðCountrÞScale Count based on Niter and colorful embed prob.
The graph is partitioned in a one-dimensional manner among the MPI tasks, with each task storing Vr vertices and theiradjacencies. For every Si, we only initialize the current table for the task’s specific subset of vertices Vr . We compute all thecounts for the subset of vertices for the current subtemplate. We then compress the table in the Compressed Sparse Row(CSR) format (details in the next subsection), with N denoting the array of count values, I the color mapping indexes, andB containing the start offsets for each vertex. The compressed table is ordered according to the ordering of tasks that havev 2 Vr in their one-hop neighborhood, as only these vertices are required in calculating the counts for each Si, and we want toreduce communication costs. We distribute the counts in an all-to-all fashion among all r nodes, so that each node now hasthe child counts required to compute counts for the new parent template.
For the final Si, i.e., the original template, each task computes the final count for the template for their subset of vertices.We simply keep a running sum of the counts for each task, for every iteration. After all iterations are completed, we performa global reduction of the sum from all nodes, scale the value by the number of iterations and probability that the template iscolorful, to get the final count estimate. Note that no additional approximations are introduced during this procedure, and soa count produced with say, 15 MPI tasks, will be the same as the count generated by the serial algorithm (assuming the ran-dom graph colorings are seeded with the same value).
3.4.3. Table compressionDue to the large memory footprint of the dynamic programming-based arrays, the partitioned approach also incurs a sub-
stantial inter-node communication cost. We reduce the total volume of data transferred by using a compressed sparse row(CSR) representation for storing the non-zero counts. The CSR format is commonly used in numerical analysis for the storage
58 G.M. Slota, K. Madduri / Parallel Computing 47 (2015) 51–69
of sparse matrices. Storage using this format consists of three arrays. One array stores all values held in the matrix in row-major ordering. This array would be organized as ½ðrow1Þðrow2Þ � � � ðrownÞ�, where ðrowiÞ is a list of all nonzero values in thatrow. A second array of the same length as this first array is used to hold the column indexes at each of the nonzero valuesstored in the first array. The final array is of length n, or the number of rows, and it holds indexes to the start of the sequenceof values for each row.
By considering a table for each discrete subtemplate Si as a matrix of size n� ci, where n is the number of vertices in G andci is the number of possible color sets for Si, we can apply the CSR format to our table, in order to compress it for faster trans-fer across tasks running on our cluster. The first array N stores all non-zero counts for all vertices and color mappings. Thesecond array I is the color mapping indexes for each count value, as computed using the combinatorial number systemapproach. The final array B denotes the indexes for the start of count values for each vertex.
Due to the large graph and template sizes considered in our study, the overall per-vertex and per-color set count magni-tudes can be quite massive in scale. This requires the N array to be of type 64-bit double to avoid overflow. Similarly,because the N array length can exceed the limits provided by 32-bit unsigned int for array indexing, the B array is of type64-bit unsigned long. We use a 16-bit integer to store the color set index array I, which will allow unique indexes up totemplates of 18 vertices in size. Because the lookup for any specific ðx; yÞ index can be slow using this format and the color-coding approach requires a significant number of such lookups, we ideally want to re-expand the compressed values.However, in order to further reduce memory footprint, we only re-expand for each vertex when they are needed to computethe count of the new parent subtemplate. The overhead for this decompression step is minimal in practice.
As with the hash table, the memory savings for the CSR compression is greatest when there is a low number of totalcounts stored in the table, regardless of counts stored per-vertex. As we will show in the results, even on network with ahigh rate of per-vertex template embeddings, the CSR format will still reduce memory usage relative to the improved tableby up to three quarters.
3.5. Enumerating low-weight simple paths with FASTPATH
We now present a color-coding based scheme to enumerate simple paths of length L in a graph with positive edgeweights. Finding the minimum-weight path is an NP-hard problem, but color-coding gives us an approximation algorithmwhose cost is linear in the number of edges in the graph, but exponential in the value L. The main idea is the same as thesubgraph counting case: instead of enumerating all paths of length L and looking for a simple path with the minimumweight, we instead only search for colorful paths by randomly coloring vertices. There are prior approaches and tools thatimplement this strategy. But prior work has primarily focused on reducing running time by limiting the required numberof iterations for a given confidence bound [25,12], with the exception of the approach of Hüffner et al. [24]. Here, we willonly consider minimizing per-iteration costs through the previously-described optimizations (combinatorial table indexing,memory-reducing optimizations, partitioning, multithreading). Our approach can be combined with the graph topology-aware coloring methods [25,12] to further reduce end-to-end running time.
Algorithm 5. FASTPATH: Enumerating low-weight simple paths using color-coding
Initialize all entries of a min heap H of size nL to 1for it ¼ 1 to Niter do . Outer loop parallelism
Color GðV ; EÞ with k colorsInitialize all Weights [1] ½v 2 V1�½1 � � � c1� 1for i ¼ 2 to Lþ 1 do
for all v 2 Vi . Inner loop parallelismfor all color sets C do
minw 1for all Ca;Cp 2 C do
for all u 2 NðvÞ dowa GetEdgeWeight(u;v)wp Weights[i� 1][u][Cp]if wa þwp 6 minw then
minw wa þwp
if minw < H:max then . Critical sectionif i ¼ Lþ 1 then
insert minw into Helse
Weights[i][v][C] minw
Return H as output.
G.M. Slota, K. Madduri / Parallel Computing 47 (2015) 51–69 59
Algorithm 5 gives an overview of the general approach for finding low-weight simple paths. The algorithm is similar tothe general color-coding template for subgraph counting. Since this implementation only considers simple paths (which canbe considered a tree template) rather than a more complex template, we can simplify the partitioning phase. We avoidpartitioning completely by assuming that we already performed a one-at-a-time partitioning, and have set the active childas the single cut vertex at each step in the partitioning tree.
To simplify the description of the algorithm, we only show weights of the nL least-weight colorful paths being stored inAlgorithm 5. In our actual implementation, we also store the corresponding vertices in the low-weight path as an array ofintegers. In prior work, paths were stored using compressed representations [12,24]. We use a min heap of size nL to storethe best weights and the corresponding paths.
Algorithm 5 has L inner loop iterations. At each step, we are attempting to find over all v 2 Vi the least-weight colorfulpath that ends at v, for every possible color set C. Initially, weights for all vertices and color sets are set to 1 for a singlevertex path. For succeeding steps, we look at the sum of weights of all previously discovered paths ending on neighbors uof v, while considering adding the weight of the edge between u and v. For each color set C, we take the minimum and storethe summed weight of the path in Weight[i][v][C].
We can also compare the weights found during each step to the current highest value in the min heap, and store the pathonly if it is one the current nL lowest-weight paths. These paths are inserted into the heap in the final step of the inner loopði ¼ Lþ 1Þ. We update the heap over subsequent iterations, storing better paths if we find them. This decreases memoryrequirements for subsequent iterations by avoiding unnecessary storage of heavy paths in the Weights array.
There are FASTPATH-specific issues to note with regards to memory utilization. Storing the actual paths for all color sets forall vertices can increase memory costs considerably. However, the biological networks and path lengths examined are usu-ally both small enough that memory is not a concern. Additionally, there is usually a predefined directivity in the input paths(e.g. finding a path between membrane proteins and transcription factors), and this allows us to restrict the size of the tablefor each step i by only placing a subset of possible vertices into Vi with per-vertex initializations. Using a min heap with asmall nL value will also substantially decrease memory requirements after the first few iterations.
Finally, note that we implement both inner-loop and outer-loop parallelism here, similar to FASCIA. For the size of biologi-cal networks commonly considered for the minimum-weight path problem, outer loop parallelism performs considerablybetter. If every outer loop thread maintains its own min heap, we can avoid the synchronized heap insertions that inner loopparallelism requires. After all iterations are complete, we can simply examine all heaps and return the nL-best unique paths.
4. Results and analysis
4.1. Experimental setup
Experiments were performed on various parallel platforms and interactive systems, including Stampede at the TexasAdvanced Computing Center, and the Hammer and Cyberstar systems at Penn State University. For experiments whereexecution times are reported, we used the Compton system at Sandia National Laboratories. Each Compton node has 2Intel Xeon E5-2670 (Sandy Bridge) processors with 64 GB DDR3 memory running RHEL 6.1. We use up to 16 nodes forour experiments. The MPI libraries used were from Intel (version 4.1) and we used OpenMP for shared-memory parallelism.Code was compiled with icc using the -O3 optimization flag, and KMP_AFFINITY was used to control thread to corepinning.
We evaluate performance of our implementations on a collection of several large-scale low diameter graphs, listed inTable 1. Orkut and Twitter (follower network) are crawls of online social networks obtained from the SNAP Database andthe Max Planck Institute for Software Systems [34,38,37]. Also from the SNAP database is the Pennsylvania Road network
Table 1Network sizes and average and maximum degrees and approximate diameter for all networks used in our analysis.
Network n m davg dmax eD Source
Enron email 34 K 180 K 11 1.4 K 9 [33,34]PA roads 1.1 M 1.5 M 2.8 9 430 [35,34]Portland 1.6 M 31 M 39 275 16 [36]Orkut 3.1 M 117 M 76 33 K 9 [37,34]Twitter 44 M 2.0 B 37 750 K 36 [38]sk-2005 44 M 1.6 B 73 15 M 308 [39,40]
H. pylori 710 1.4 K 4.0 54 10 [41]S. cerevisiae 5.1 K 22 K 8.7 290 11 [41]H. sapiens 9.1 K 41 K 9.0 250 10 [42]
Human 9.0 K 22 K 5.0 322 14 [43]Caenorhabditis 3.2 K 5.5 K 3.4 186 14 [43]Drosophila 7.2 K 21 K 5.9 176 12 [43]Mammalia 8.8 K 19 K 4.4 323 18 [43]
T7-1 T7-2 T7-3 T7-4 T7-5 T7-6
T7-7 T7-8 T7-9 T7-10 T7-11
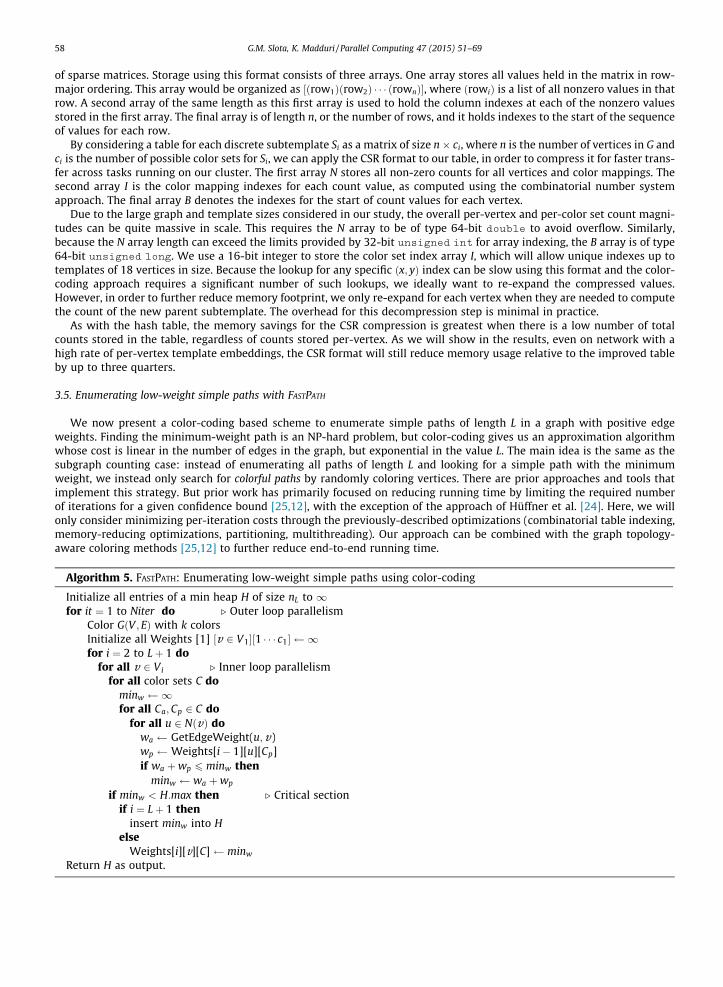
Fig. 2. All possible 7 vertex undirected tree-structured templates.
60 G.M. Slota, K. Madduri / Parallel Computing 47 (2015) 51–69
[35] and the Enron Email Corpus [33]. sk-2005 is a crawl of the Slovakian (.sk) domain performed in 2005 using UbiCrawlerand downloaded from the University of Florida Sparse Matrix Collection [39,40]. Portland is a large synthetic social contactnetwork modeled after the city of Portland, from the Virginia Tech Network Dynamics and Simulations Science Laboratory(NDSSL) [36]. The Helicobacter pylori (intestinal bacteria) and Saccharomyces cerevisiae (yeast) networks where obtained fromthe Database of Interacting Proteins [41], and the Homo sapiens (human) network is from Radivojac et al. [42]. For analyzingour weighted pathways algorithm, we considered the weighted Human, Caenorhabditis (Caenorhabditis elegans genus),Drosophila (fruit flies), and Mammalia protein interaction networks from the Molecular INTeraction database [43].
All the networks considered are undirected. The originally-directed Twitter and sk-2005 graphs were preprocessed toignore edge directivity, remove multiple edges and self loops, and extract only the largest connected component. Table 1 liststhe properties of the graphs after this preprocessing.
While analyzing execution times and scaling on the larger networks, we considered two different templates with 5, 7, 10,and 12 vertices. For each size, one template is a simple path and the other one is a more complex structure. The path-basedtemplates are labeled as U5-1, U7-1, U10-1, and U12-1. These templates and their labels are shown in Fig. 1. Other templatesare used in the analysis that are not listed follow the same naming convention, with UX-1 implying a simple path and UX-2being a more complex tree. For motif finding, we looked at all possible treelets of size 7, 10, and 12. k ¼ 7;10, and 12 wouldimply 11, 106, and 551 possible tree topologies, respectively. The treelets for k ¼ 7 are given in Fig. 2.
4.2. Single-node performance
To assess single node FASCIA performance, we will examine running times of a single iteration on moderate-sized networksacross varying template sizes, running times for several iterations across all motifs on smaller PPI networks, parallel scaling,memory utilization with the various strategies, as well as an analysis of approximation error.
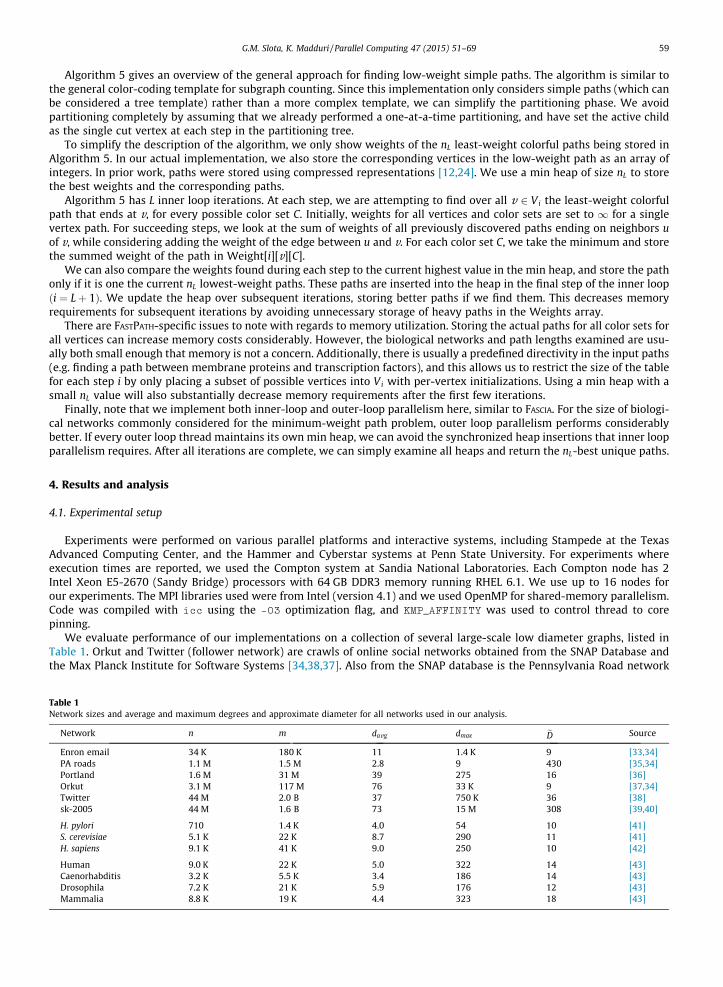
4.2.1. Running times vs. template sizeFig. 3 gives the absolute single-node running times for all templates listed in Fig. 1 on the Portland and Orkut networks.
These results are from running the inner loop-parallel version on 16 cores. We observe minimal to no performance improve-ment when using hyperthreading, qnd so most tests were performed with only a single thread per core despite two hard-ware thread contexts.
As can be observed on Fig. 3, the single-iteration time for smaller templates is extremely low, making it feasible to obtainrealtime count estimates for 7 vertex templates on both networks. Even for the largest template, the total running time wasstill less than 20 min on both networks. The U12-2 template took the longest time as expected. This template was explicitlydesigned to stress subtemplate partitioning and therefore gives a practical upper bound for our running times across all tem-plate of size 12 and smaller. Another observation was that the running time was fairly independent of the template structure,particularly for the smaller templates. Even for the larger 12-vertex templates, there is just a 3� variation in running time.
Portland Orkut
0
50
100
0
300
600
900
U5−1 U5−2 U7−1 U7−2 U10−1 U10−2 U12−1 U12−2 U5−1 U5−2 U7−1 U7−2 U10−1 U10−2 U12−1 U12−2Template
Sing
le It
erat
ion
Exec
utio
n Ti
me
(s)
Fig. 3. FASCIA running times on templates of size 5, 7, 10, and 12 vertices, on the Portland and Orkut networks, for a single iteration, with inner loopparallelism.
H.pylori S.cerevisiae H.sapiens
1
10
100
1000
5 7 10 12 5 7 10 12 5 7 10 12
Motif Sizes
100
Itera
tion
Exec
utio
n Ti
me
(s)
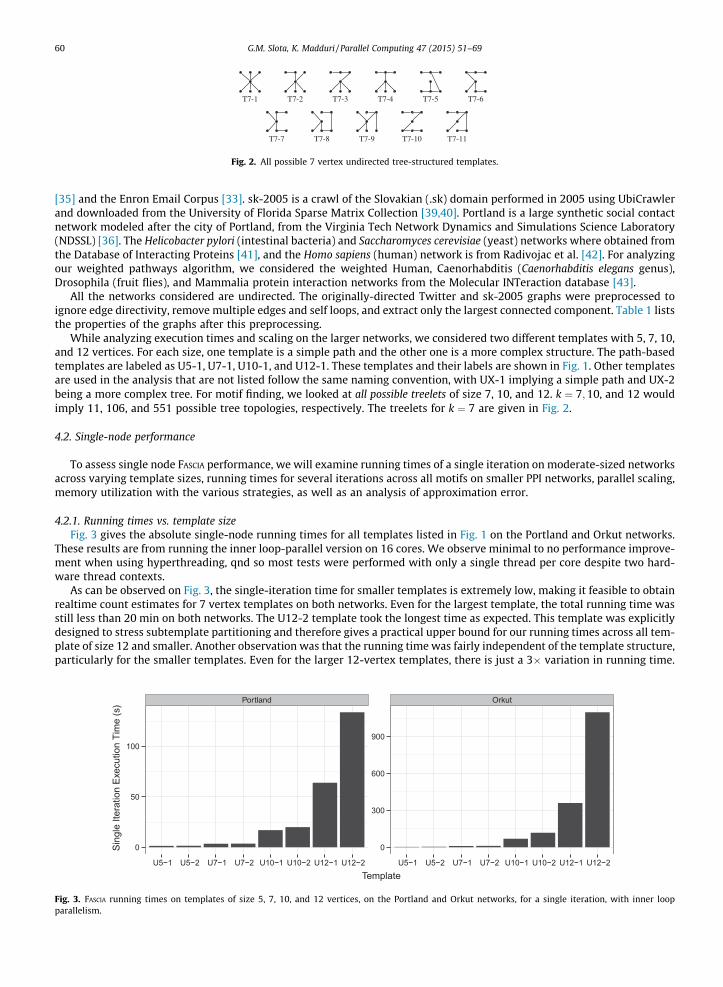
Fig. 4. FASCIA running times on templates of size 5, 7, 10, and 12 on the H. pylori, S. cerevisiae, and H. sapiens PPI networks for 100 iterations with outer loopparallelism.
5
10
15
1 2 4 8 16Cores
Para
llel S
peed
up
5
10
1 2 4 8 16Cores
Para
llel S
peed
up
Parallelization Inner Outer
Fig. 5. Parallel scaling from 1 to 16 cores of the U12-2 template on the Portland network for a single iteration with inner-loop parallelism (left) and parallelscaling for 100 iterations of all 10 vertex templates on the H. pylori network with both inner and outer scaling (right).
G.M. Slota, K. Madduri / Parallel Computing 47 (2015) 51–69 61
Fig. 4 gives the running times for 100 iterations across all possible 5, 7, 10, and 12-vertex templates on the H. pylori, S.cerevisiae, and H. sapiens protein interaction networks. For these tests, we use outer loop parallelism. It demonstrates super-ior running times on smaller networks with larger iteration counts, as there is less parallel overhead on a per-iteration basis.Note the log scale in Fig. 4. Both the running time of FASCIA and the total number of possible templates increase exponentiallywith increasing network size. This demonstrates the importance of implementing fast serial algorithms for subgraph count-ing when analyzing motifs of larger sizes.
4.2.2. Parallel scalingWe now observe how our approaches scale when increasing the number of processing cores. Fig. 5 gives the parallel
speedups for 1–16 cores on the Portland network with inner-loop parallelism, as well as the H. pylori network with bothouter loop and inner loop parallelism. As was mentioned previously, we observe better speedups with outer loop parallelismon the smaller networks, as the per-iteration parallelization overhead is reduced. However, on larger networks, we stillobserve very good speedups and near-linear scaling with the inner-loop parallelism, since the computational requirementsovershadow the parallel overheads for these instance. Overall, our implementation scales quite well, demonstrating about15� and 14� speedups on the larger Portland and smaller H. pylori networks, respectively.
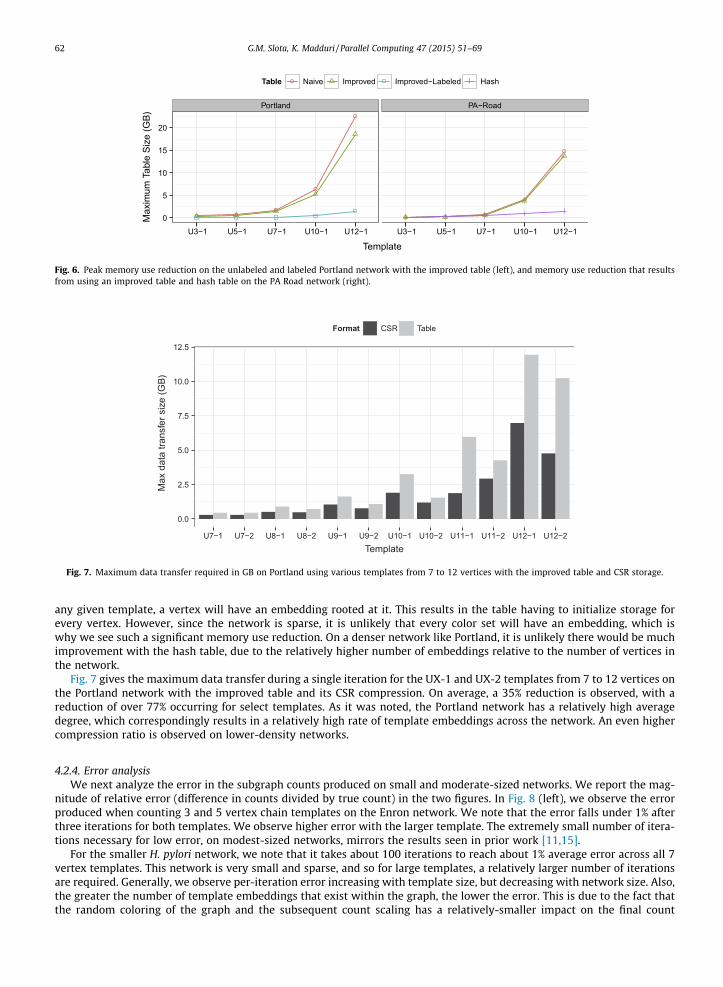
4.2.3. Reduction in memory useFig. 6 demonstrates impact of the memory-reducing optimizations over the baseline naïve approach. The peak memory
footprint is given in both the networks for various template sizes. For the Portland network, we see a 20% savings over base-line with the improved dynamic programming table representation. Further, if we consider the case of per-vertex labels inthe graph (all vertices randomly initialized with one of 8 labels), the memory requirements drop considerably, due to themuch higher selectivity that the label restriction imposes.
In Fig. 6, we also see how a hash table representation can improve memory usage dramatically over using the three-di-mensional table, on certain networks. The PA road network is quite regular and nearly planar, and so it is expected that for
● ●●
●
●
● ● ●
●
●
Portland PA−Road
0
5
10
15
20
U3−1 U5−1 U7−1 U10−1 U12−1 U3−1 U5−1 U7−1 U10−1 U12−1
Template
Max
imum
Tab
le S
ize
(GB)
Table ● Naive Improved Improved−Labeled Hash
Fig. 6. Peak memory use reduction on the unlabeled and labeled Portland network with the improved table (left), and memory use reduction that resultsfrom using an improved table and hash table on the PA Road network (right).
0.0
2.5
5.0
7.5
10.0
12.5
U7−1 U7−2 U8−1 U8−2 U9−1 U9−2 U10−1 U10−2 U11−1 U11−2 U12−1 U12−2Template
Max
dat
a tra
nsfe
r siz
e (G
B)
Format CSR Table
Fig. 7. Maximum data transfer required in GB on Portland using various templates from 7 to 12 vertices with the improved table and CSR storage.
62 G.M. Slota, K. Madduri / Parallel Computing 47 (2015) 51–69
any given template, a vertex will have an embedding rooted at it. This results in the table having to initialize storage forevery vertex. However, since the network is sparse, it is unlikely that every color set will have an embedding, which iswhy we see such a significant memory use reduction. On a denser network like Portland, it is unlikely there would be muchimprovement with the hash table, due to the relatively higher number of embeddings relative to the number of vertices inthe network.
Fig. 7 gives the maximum data transfer during a single iteration for the UX-1 and UX-2 templates from 7 to 12 vertices onthe Portland network with the improved table and its CSR compression. On average, a 35% reduction is observed, with areduction of over 77% occurring for select templates. As it was noted, the Portland network has a relatively high averagedegree, which correspondingly results in a relatively high rate of template embeddings across the network. An even highercompression ratio is observed on lower-density networks.
4.2.4. Error analysisWe next analyze the error in the subgraph counts produced on small and moderate-sized networks. We report the mag-
nitude of relative error (difference in counts divided by true count) in the two figures. In Fig. 8 (left), we observe the errorproduced when counting 3 and 5 vertex chain templates on the Enron network. We note that the error falls under 1% afterthree iterations for both templates. We observe higher error with the larger template. The extremely small number of itera-tions necessary for low error, on modest-sized networks, mirrors the results seen in prior work [11,15].
For the smaller H. pylori network, we note that it takes about 100 iterations to reach about 1% average error across all 7vertex templates. This network is very small and sparse, and so for large templates, a relatively larger number of iterationsare required. Generally, we observe per-iteration error increasing with template size, but decreasing with network size. Also,the greater the number of template embeddings that exist within the graph, the lower the error. This is due to the fact thatthe random coloring of the graph and the subsequent count scaling has a relatively-smaller impact on the final count
0.000
0.005
0.010
0.015
0.020
1 2 3 4 5 6 7 8 9 10Iterations
Erro
r
Template U3−1 U5−1
0.000
0.025
0.050
0.075
1 10 100 1000 10000Iterations
Erro
r
Fig. 8. Error obtained with the 3 and 5 vertex path templates on the Enron network after a small number of iterations (left) and the average error over allpossible 7 vertex templates on the H. pylori network after 1–10 K iterations (right).
G.M. Slota, K. Madduri / Parallel Computing 47 (2015) 51–69 63
estimate. We observe low inter-iteration variation between produced counts on large scale networks. A dynamic stoppingcriteria based on the variance of produced per-iteration counts is left for future work.
Note that Alon et al. [1] proved that to ensure a computed count is within Cð1� �Þwith probability ð1� 2dÞ, where C is the
true count, at most ek log 1=d�2 iterations of the dynamic programming scheme are required. However, this upper bound is very
loose in practice, as it ignores network size and topology. For example, we require only 100 iterations to compute countswith an error less than 1% for a 7 vertex template on H. pylori (� ¼ 0:01).
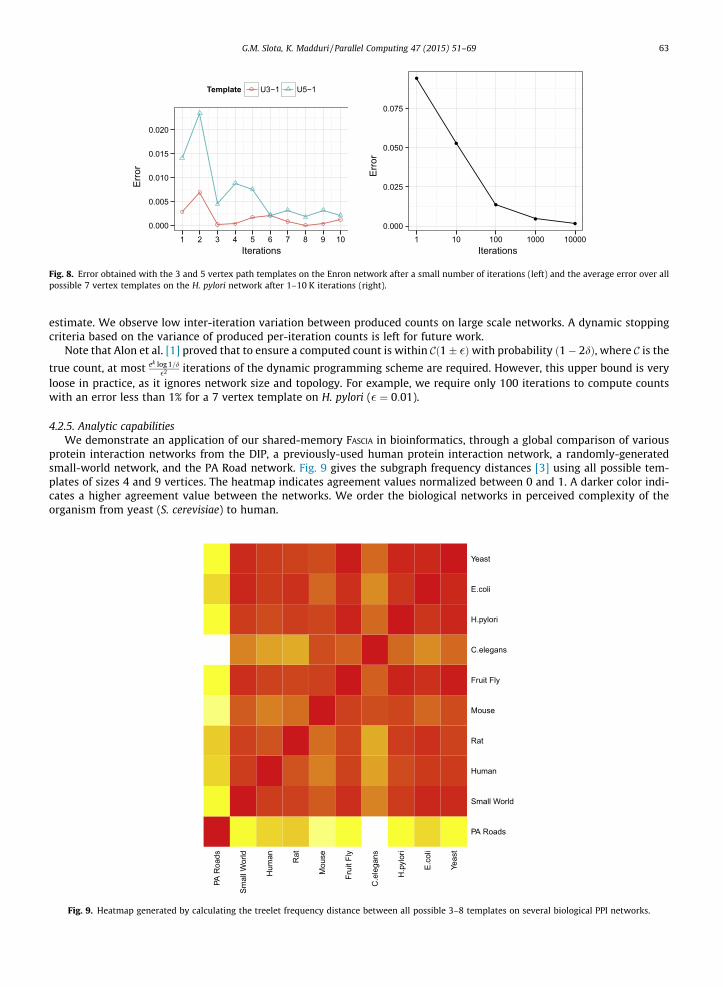
4.2.5. Analytic capabilitiesWe demonstrate an application of our shared-memory FASCIA in bioinformatics, through a global comparison of various
protein interaction networks from the DIP, a previously-used human protein interaction network, a randomly-generatedsmall-world network, and the PA Road network. Fig. 9 gives the subgraph frequency distances [3] using all possible tem-plates of sizes 4 and 9 vertices. The heatmap indicates agreement values normalized between 0 and 1. A darker color indi-cates a higher agreement value between the networks. We order the biological networks in perceived complexity of theorganism from yeast (S. cerevisiae) to human.
PA R
oads
Smal
l Wor
ld
Hum
an Rat
Mou
se
Frui
t Fly
C.e
lega
ns
H.p
ylor
i
E.co
li
Yeas
t
PA Roads
Small World
Human
Rat
Mouse
Fruit Fly
C.elegans
H.pylori
E.coli
Yeast
Fig. 9. Heatmap generated by calculating the treelet frequency distance between all possible 3–8 templates on several biological PPI networks.
64 G.M. Slota, K. Madduri / Parallel Computing 47 (2015) 51–69
We observe high agreement between the three unicellular organisms, Yeast, Escherichia coli, and H. pylori. We alsoobserve that the small-world network demonstrates a good fit for this relatively-simple comparative metric. The regu-larly-structured, high-diameter, and near-planar PA Road network shows obvious and strong dissimilarity with the othernetworks, as would be expected.
4.3. Multi-node performance
For the distributed-memory FASCIA implementation, we again analyze performance with regards to running times and par-allel scaling. We also demonstrate the inter-node communication reduction with CSR table compression, which also trans-lates to memory savings during the subsequent dynamic programming step. For these experiments, we employ a labelpropagation-based graph partitioning [44] with random intra-partition vertex reordering to balance overall computationand communication costs.
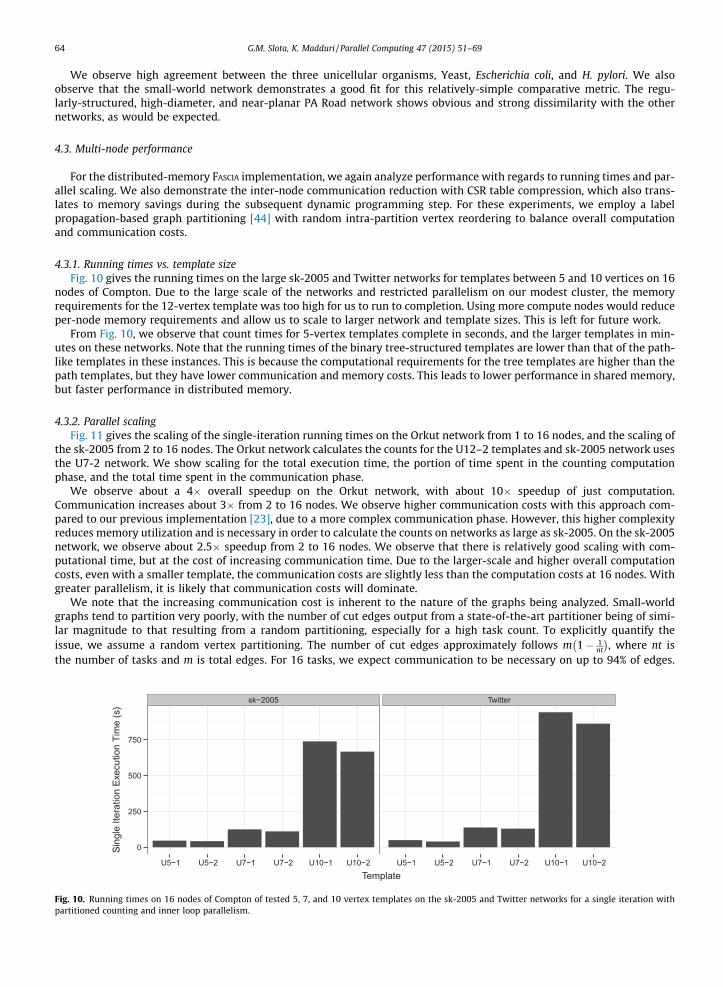
4.3.1. Running times vs. template sizeFig. 10 gives the running times on the large sk-2005 and Twitter networks for templates between 5 and 10 vertices on 16
nodes of Compton. Due to the large scale of the networks and restricted parallelism on our modest cluster, the memoryrequirements for the 12-vertex template was too high for us to run to completion. Using more compute nodes would reduceper-node memory requirements and allow us to scale to larger network and template sizes. This is left for future work.
From Fig. 10, we observe that count times for 5-vertex templates complete in seconds, and the larger templates in min-utes on these networks. Note that the running times of the binary tree-structured templates are lower than that of the path-like templates in these instances. This is because the computational requirements for the tree templates are higher than thepath templates, but they have lower communication and memory costs. This leads to lower performance in shared memory,but faster performance in distributed memory.
4.3.2. Parallel scalingFig. 11 gives the scaling of the single-iteration running times on the Orkut network from 1 to 16 nodes, and the scaling of
the sk-2005 from 2 to 16 nodes. The Orkut network calculates the counts for the U12–2 templates and sk-2005 network usesthe U7-2 network. We show scaling for the total execution time, the portion of time spent in the counting computationphase, and the total time spent in the communication phase.
We observe about a 4� overall speedup on the Orkut network, with about 10� speedup of just computation.Communication increases about 3� from 2 to 16 nodes. We observe higher communication costs with this approach com-pared to our previous implementation [23], due to a more complex communication phase. However, this higher complexityreduces memory utilization and is necessary in order to calculate the counts on networks as large as sk-2005. On the sk-2005network, we observe about 2.5� speedup from 2 to 16 nodes. We observe that there is relatively good scaling with com-putational time, but at the cost of increasing communication time. Due to the larger-scale and higher overall computationcosts, even with a smaller template, the communication costs are slightly less than the computation costs at 16 nodes. Withgreater parallelism, it is likely that communication costs will dominate.
We note that the increasing communication cost is inherent to the nature of the graphs being analyzed. Small-worldgraphs tend to partition very poorly, with the number of cut edges output from a state-of-the-art partitioner being of simi-lar magnitude to that resulting from a random partitioning, especially for a high task count. To explicitly quantify theissue, we assume a random vertex partitioning. The number of cut edges approximately follows m 1� 1
nt
� �, where nt is
the number of tasks and m is total edges. For 16 tasks, we expect communication to be necessary on up to 94% of edges.
sk−2005 Twitter
0
250
500
750
U5−1 U5−2 U7−1 U7−2 U10−1 U10−2 U5−1 U5−2 U7−1 U7−2 U10−1 U10−2Template
Sing
le It
erat
ion
Exec
utio
n Ti
me
(s)
Fig. 10. Running times on 16 nodes of Compton of tested 5, 7, and 10 vertex templates on the sk-2005 and Twitter networks for a single iteration withpartitioned counting and inner loop parallelism.
Orkut sk−2005
0
300
600
900
100
200
1 2 4 8 16 1 2 4 8 16NodesSi
ngle
Iter
atio
n Ex
ecut
ion
Tim
e (s
)
Part Communication Computation Total
Fig. 11. Parallel scaling from 1 to 16 nodes of the U12-2 template on Orkut network and the U7-2 template on the sk-2005 network for a single iterationwith partitioned counting and inner loop parallelism.
G.M. Slota, K. Madduri / Parallel Computing 47 (2015) 51–69 65
A specific vertex v needs to communicate its counts table information to all tasks containing its neighbors. If v is of high oreven moderate degree (greater than the number of tasks), this could result in communication of v’s data to all other tasks.Essentially, as communication costs are proportional to the number of inter-task (cut) edges, we expect the plot of com-munication times to follow a similar curve proportional to 1� 1
nt
� �. From Fig. 11, this is what we observe. In future work,
we will attempt to optimize the All-to-all exchange in order to minimize these costs for larger networks, and achieve bet-ter parallel scaling.
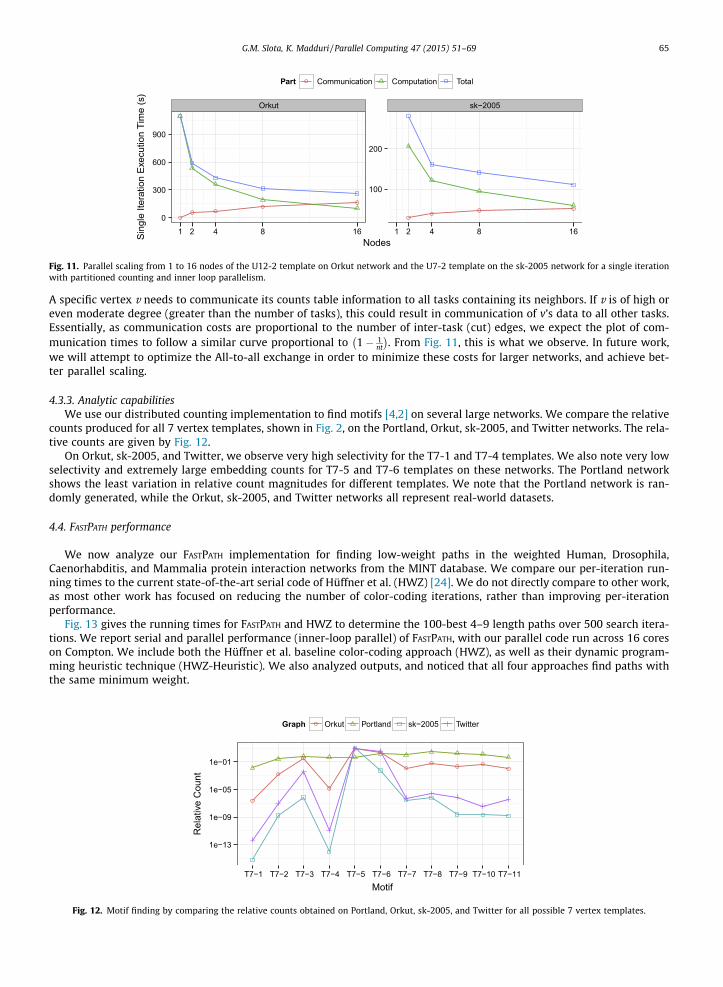
4.3.3. Analytic capabilitiesWe use our distributed counting implementation to find motifs [4,2] on several large networks. We compare the relative
counts produced for all 7 vertex templates, shown in Fig. 2, on the Portland, Orkut, sk-2005, and Twitter networks. The rela-tive counts are given by Fig. 12.
On Orkut, sk-2005, and Twitter, we observe very high selectivity for the T7-1 and T7-4 templates. We also note very lowselectivity and extremely large embedding counts for T7-5 and T7-6 templates on these networks. The Portland networkshows the least variation in relative count magnitudes for different templates. We note that the Portland network is ran-domly generated, while the Orkut, sk-2005, and Twitter networks all represent real-world datasets.
4.4. FASTPATH performance
We now analyze our FASTPATH implementation for finding low-weight paths in the weighted Human, Drosophila,Caenorhabditis, and Mammalia protein interaction networks from the MINT database. We compare our per-iteration run-ning times to the current state-of-the-art serial code of Hüffner et al. (HWZ) [24]. We do not directly compare to other work,as most other work has focused on reducing the number of color-coding iterations, rather than improving per-iterationperformance.
Fig. 13 gives the running times for FASTPATH and HWZ to determine the 100-best 4–9 length paths over 500 search itera-tions. We report serial and parallel performance (inner-loop parallel) of FASTPATH, with our parallel code run across 16 coreson Compton. We include both the Hüffner et al. baseline color-coding approach (HWZ), as well as their dynamic program-ming heuristic technique (HWZ-Heuristic). We also analyzed outputs, and noticed that all four approaches find paths withthe same minimum weight.
1e−13
1e−09
1e−05
1e−01
T7−1 T7−2 T7−3 T7−4 T7−5 T7−6 T7−7 T7−8 T7−9 T7−10 T7−11Motif
Rel
ativ
e C
ount
Graph Orkut Portland sk−2005 Twitter
Fig. 12. Motif finding by comparing the relative counts obtained on Portland, Orkut, sk-2005, and Twitter for all possible 7 vertex templates.
Human Caenorhabditis Drosophila Mammalia
0
50
100
150
200
4 5 6 7 8 9 4 5 6 7 8 9 4 5 6 7 8 9 4 5 6 7 8 9Path Length50
0 Ite
ratio
n Ex
ecut
ion
Tim
e (s
)
Program HWZ HWZ−Heuristic FastPath FastPath−Parallel
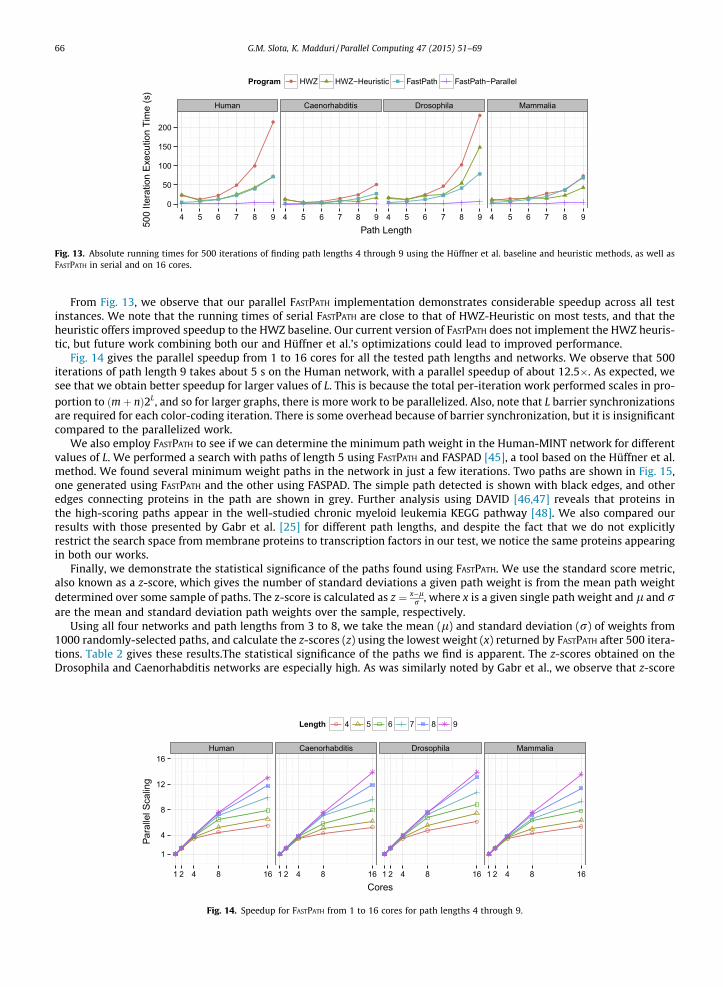
Fig. 13. Absolute running times for 500 iterations of finding path lengths 4 through 9 using the Hüffner et al. baseline and heuristic methods, as well asFASTPATH in serial and on 16 cores.
66 G.M. Slota, K. Madduri / Parallel Computing 47 (2015) 51–69
From Fig. 13, we observe that our parallel FASTPATH implementation demonstrates considerable speedup across all testinstances. We note that the running times of serial FASTPATH are close to that of HWZ-Heuristic on most tests, and that theheuristic offers improved speedup to the HWZ baseline. Our current version of FASTPATH does not implement the HWZ heuris-tic, but future work combining both our and Hüffner et al.’s optimizations could lead to improved performance.
Fig. 14 gives the parallel speedup from 1 to 16 cores for all the tested path lengths and networks. We observe that 500iterations of path length 9 takes about 5 s on the Human network, with a parallel speedup of about 12.5�. As expected, wesee that we obtain better speedup for larger values of L. This is because the total per-iteration work performed scales in pro-portion to ðmþ nÞ2L, and so for larger graphs, there is more work to be parallelized. Also, note that L barrier synchronizationsare required for each color-coding iteration. There is some overhead because of barrier synchronization, but it is insignificantcompared to the parallelized work.
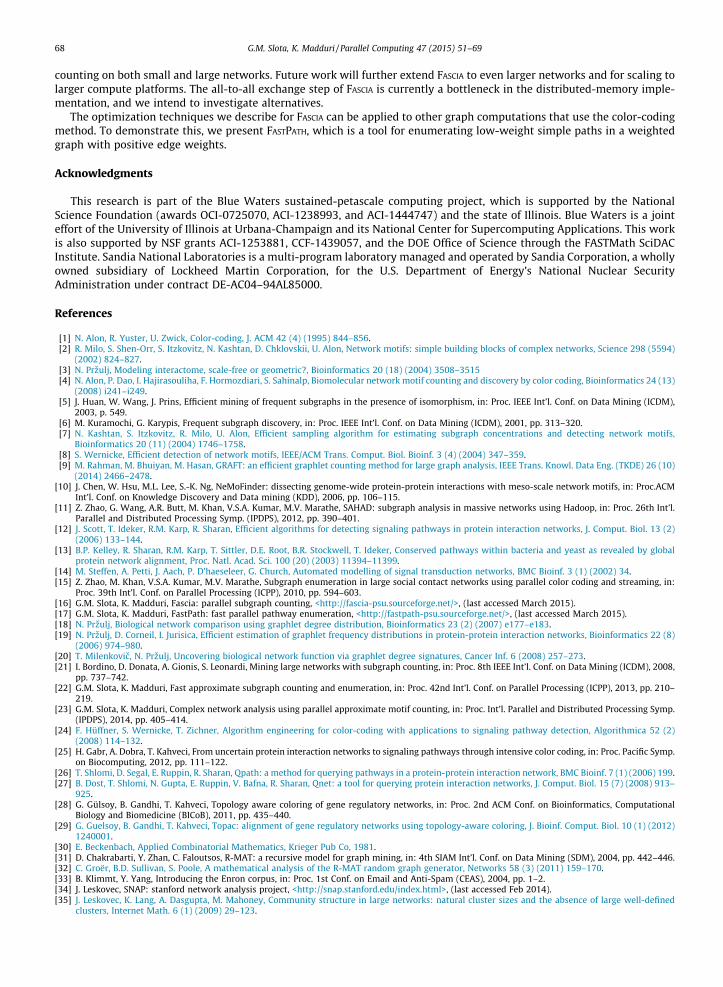
We also employ FASTPATH to see if we can determine the minimum path weight in the Human-MINT network for differentvalues of L. We performed a search with paths of length 5 using FASTPATH and FASPAD [45], a tool based on the Hüffner et al.method. We found several minimum weight paths in the network in just a few iterations. Two paths are shown in Fig. 15,one generated using FASTPATH and the other using FASPAD. The simple path detected is shown with black edges, and otheredges connecting proteins in the path are shown in grey. Further analysis using DAVID [46,47] reveals that proteins inthe high-scoring paths appear in the well-studied chronic myeloid leukemia KEGG pathway [48]. We also compared ourresults with those presented by Gabr et al. [25] for different path lengths, and despite the fact that we do not explicitlyrestrict the search space from membrane proteins to transcription factors in our test, we notice the same proteins appearingin both our works.
Finally, we demonstrate the statistical significance of the paths found using FASTPATH. We use the standard score metric,also known as a z-score, which gives the number of standard deviations a given path weight is from the mean path weightdetermined over some sample of paths. The z-score is calculated as z ¼ x�l
r , where x is a given single path weight and l and rare the mean and standard deviation path weights over the sample, respectively.
Using all four networks and path lengths from 3 to 8, we take the mean (l) and standard deviation (r) of weights from1000 randomly-selected paths, and calculate the z-scores (z) using the lowest weight (x) returned by FASTPATH after 500 itera-tions. Table 2 gives these results.The statistical significance of the paths we find is apparent. The z-scores obtained on theDrosophila and Caenorhabditis networks are especially high. As was similarly noted by Gabr et al., we observe that z-score
Human Caenorhabditis Drosophila Mammalia
1
4
8
12
16
1 2 4 8 16 1 2 4 8 16 1 2 4 8 16 1 2 4 8 16Cores
Para
llel S
calin
g
Length 4 5 6 7 8 9
Fig. 14. Speedup for FASTPATH from 1 to 16 cores for path lengths 4 through 9.
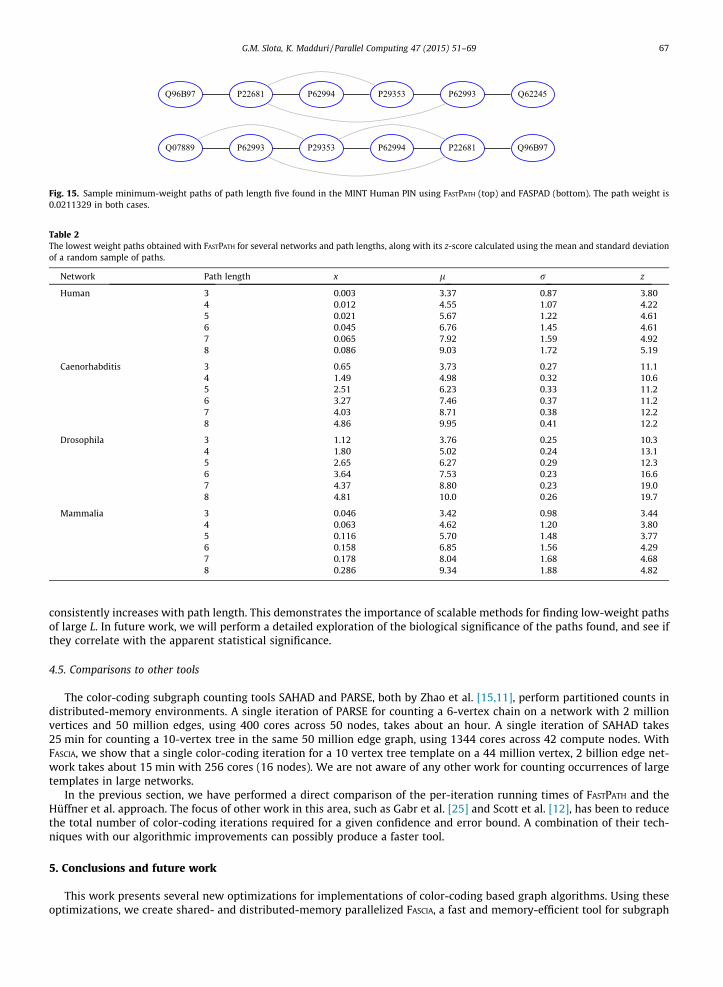
Fig. 15. Sample minimum-weight paths of path length five found in the MINT Human PIN using FASTPATH (top) and FASPAD (bottom). The path weight is0.0211329 in both cases.
Table 2The lowest weight paths obtained with FASTPATH for several networks and path lengths, along with its z-score calculated using the mean and standard deviationof a random sample of paths.
Network Path length x l r z
Human 3 0.003 3.37 0.87 3.804 0.012 4.55 1.07 4.225 0.021 5.67 1.22 4.616 0.045 6.76 1.45 4.617 0.065 7.92 1.59 4.928 0.086 9.03 1.72 5.19
Caenorhabditis 3 0.65 3.73 0.27 11.14 1.49 4.98 0.32 10.65 2.51 6.23 0.33 11.26 3.27 7.46 0.37 11.27 4.03 8.71 0.38 12.28 4.86 9.95 0.41 12.2
Drosophila 3 1.12 3.76 0.25 10.34 1.80 5.02 0.24 13.15 2.65 6.27 0.29 12.36 3.64 7.53 0.23 16.67 4.37 8.80 0.23 19.08 4.81 10.0 0.26 19.7
Mammalia 3 0.046 3.42 0.98 3.444 0.063 4.62 1.20 3.805 0.116 5.70 1.48 3.776 0.158 6.85 1.56 4.297 0.178 8.04 1.68 4.688 0.286 9.34 1.88 4.82
G.M. Slota, K. Madduri / Parallel Computing 47 (2015) 51–69 67
consistently increases with path length. This demonstrates the importance of scalable methods for finding low-weight pathsof large L. In future work, we will perform a detailed exploration of the biological significance of the paths found, and see ifthey correlate with the apparent statistical significance.
4.5. Comparisons to other tools
The color-coding subgraph counting tools SAHAD and PARSE, both by Zhao et al. [15,11], perform partitioned counts indistributed-memory environments. A single iteration of PARSE for counting a 6-vertex chain on a network with 2 millionvertices and 50 million edges, using 400 cores across 50 nodes, takes about an hour. A single iteration of SAHAD takes25 min for counting a 10-vertex tree in the same 50 million edge graph, using 1344 cores across 42 compute nodes. WithFASCIA, we show that a single color-coding iteration for a 10 vertex tree template on a 44 million vertex, 2 billion edge net-work takes about 15 min with 256 cores (16 nodes). We are not aware of any other work for counting occurrences of largetemplates in large networks.
In the previous section, we have performed a direct comparison of the per-iteration running times of FASTPATH and theHüffner et al. approach. The focus of other work in this area, such as Gabr et al. [25] and Scott et al. [12], has been to reducethe total number of color-coding iterations required for a given confidence and error bound. A combination of their tech-niques with our algorithmic improvements can possibly produce a faster tool.
5. Conclusions and future work
This work presents several new optimizations for implementations of color-coding based graph algorithms. Using theseoptimizations, we create shared- and distributed-memory parallelized FASCIA, a fast and memory-efficient tool for subgraph
68 G.M. Slota, K. Madduri / Parallel Computing 47 (2015) 51–69
counting on both small and large networks. Future work will further extend FASCIA to even larger networks and for scaling tolarger compute platforms. The all-to-all exchange step of FASCIA is currently a bottleneck in the distributed-memory imple-mentation, and we intend to investigate alternatives.
The optimization techniques we describe for FASCIA can be applied to other graph computations that use the color-codingmethod. To demonstrate this, we present FASTPATH, which is a tool for enumerating low-weight simple paths in a weightedgraph with positive edge weights.
Acknowledgments
This research is part of the Blue Waters sustained-petascale computing project, which is supported by the NationalScience Foundation (awards OCI-0725070, ACI-1238993, and ACI-1444747) and the state of Illinois. Blue Waters is a jointeffort of the University of Illinois at Urbana-Champaign and its National Center for Supercomputing Applications. This workis also supported by NSF grants ACI-1253881, CCF-1439057, and the DOE Office of Science through the FASTMath SciDACInstitute. Sandia National Laboratories is a multi-program laboratory managed and operated by Sandia Corporation, a whollyowned subsidiary of Lockheed Martin Corporation, for the U.S. Department of Energy’s National Nuclear SecurityAdministration under contract DE-AC04–94AL85000.
References
[1] N. Alon, R. Yuster, U. Zwick, Color-coding, J. ACM 42 (4) (1995) 844–856.[2] R. Milo, S. Shen-Orr, S. Itzkovitz, N. Kashtan, D. Chklovskii, U. Alon, Network motifs: simple building blocks of complex networks, Science 298 (5594)
(2002) 824–827.[3] N. Przulj, Modeling interactome, scale-free or geometric?, Bioinformatics 20 (18) (2004) 3508–3515[4] N. Alon, P. Dao, I. Hajirasouliha, F. Hormozdiari, S. Sahinalp, Biomolecular network motif counting and discovery by color coding, Bioinformatics 24 (13)
(2008) i241–i249.[5] J. Huan, W. Wang, J. Prins, Efficient mining of frequent subgraphs in the presence of isomorphism, in: Proc. IEEE Int’l. Conf. on Data Mining (ICDM),
2003, p. 549.[6] M. Kuramochi, G. Karypis, Frequent subgraph discovery, in: Proc. IEEE Int’l. Conf. on Data Mining (ICDM), 2001, pp. 313–320.[7] N. Kashtan, S. Itzkovitz, R. Milo, U. Alon, Efficient sampling algorithm for estimating subgraph concentrations and detecting network motifs,
Bioinformatics 20 (11) (2004) 1746–1758.[8] S. Wernicke, Efficient detection of network motifs, IEEE/ACM Trans. Comput. Biol. Bioinf. 3 (4) (2004) 347–359.[9] M. Rahman, M. Bhuiyan, M. Hasan, GRAFT: an efficient graphlet counting method for large graph analysis, IEEE Trans. Knowl. Data Eng. (TKDE) 26 (10)
(2014) 2466–2478.[10] J. Chen, W. Hsu, M.L. Lee, S.-K. Ng, NeMoFinder: dissecting genome-wide protein-protein interactions with meso-scale network motifs, in: Proc.ACM
Int’l. Conf. on Knowledge Discovery and Data mining (KDD), 2006, pp. 106–115.[11] Z. Zhao, G. Wang, A.R. Butt, M. Khan, V.S.A. Kumar, M.V. Marathe, SAHAD: subgraph analysis in massive networks using Hadoop, in: Proc. 26th Int’l.
Parallel and Distributed Processing Symp. (IPDPS), 2012, pp. 390–401.[12] J. Scott, T. Ideker, R.M. Karp, R. Sharan, Efficient algorithms for detecting signaling pathways in protein interaction networks, J. Comput. Biol. 13 (2)
(2006) 133–144.[13] B.P. Kelley, R. Sharan, R.M. Karp, T. Sittler, D.E. Root, B.R. Stockwell, T. Ideker, Conserved pathways within bacteria and yeast as revealed by global
protein network alignment, Proc. Natl. Acad. Sci. 100 (20) (2003) 11394–11399.[14] M. Steffen, A. Petti, J. Aach, P. D’haeseleer, G. Church, Automated modelling of signal transduction networks, BMC Bioinf. 3 (1) (2002) 34.[15] Z. Zhao, M. Khan, V.S.A. Kumar, M.V. Marathe, Subgraph enumeration in large social contact networks using parallel color coding and streaming, in:
Proc. 39th Int’l. Conf. on Parallel Processing (ICPP), 2010, pp. 594–603.[16] G.M. Slota, K. Madduri, Fascia: parallel subgraph counting, <http://fascia-psu.sourceforge.net/>, (last accessed March 2015).[17] G.M. Slota, K. Madduri, FastPath: fast parallel pathway enumeration, <http://fastpath-psu.sourceforge.net/>, (last accessed March 2015).[18] N. Przulj, Biological network comparison using graphlet degree distribution, Bioinformatics 23 (2) (2007) e177–e183.[19] N. Przulj, D. Corneil, I. Jurisica, Efficient estimation of graphlet frequency distributions in protein-protein interaction networks, Bioinformatics 22 (8)
(2006) 974–980.[20] T. Milenkovic, N. Przulj, Uncovering biological network function via graphlet degree signatures, Cancer Inf. 6 (2008) 257–273.[21] I. Bordino, D. Donata, A. Gionis, S. Leonardi, Mining large networks with subgraph counting, in: Proc. 8th IEEE Int’l. Conf. on Data Mining (ICDM), 2008,
pp. 737–742.[22] G.M. Slota, K. Madduri, Fast approximate subgraph counting and enumeration, in: Proc. 42nd Int’l. Conf. on Parallel Processing (ICPP), 2013, pp. 210–
219.[23] G.M. Slota, K. Madduri, Complex network analysis using parallel approximate motif counting, in: Proc. Int’l. Parallel and Distributed Processing Symp.
(IPDPS), 2014, pp. 405–414.[24] F. Hüffner, S. Wernicke, T. Zichner, Algorithm engineering for color-coding with applications to signaling pathway detection, Algorithmica 52 (2)
(2008) 114–132.[25] H. Gabr, A. Dobra, T. Kahveci, From uncertain protein interaction networks to signaling pathways through intensive color coding, in: Proc. Pacific Symp.
on Biocomputing, 2012, pp. 111–122.[26] T. Shlomi, D. Segal, E. Ruppin, R. Sharan, Qpath: a method for querying pathways in a protein-protein interaction network, BMC Bioinf. 7 (1) (2006) 199.[27] B. Dost, T. Shlomi, N. Gupta, E. Ruppin, V. Bafna, R. Sharan, Qnet: a tool for querying protein interaction networks, J. Comput. Biol. 15 (7) (2008) 913–
925.[28] G. Gülsoy, B. Gandhi, T. Kahveci, Topology aware coloring of gene regulatory networks, in: Proc. 2nd ACM Conf. on Bioinformatics, Computational
Biology and Biomedicine (BICoB), 2011, pp. 435–440.[29] G. Guelsoy, B. Gandhi, T. Kahveci, Topac: alignment of gene regulatory networks using topology-aware coloring, J. Bioinf. Comput. Biol. 10 (1) (2012)
1240001.[30] E. Beckenbach, Applied Combinatorial Mathematics, Krieger Pub Co, 1981.[31] D. Chakrabarti, Y. Zhan, C. Faloutsos, R-MAT: a recursive model for graph mining, in: 4th SIAM Int’l. Conf. on Data Mining (SDM), 2004, pp. 442–446.[32] C. Groër, B.D. Sullivan, S. Poole, A mathematical analysis of the R-MAT random graph generator, Networks 58 (3) (2011) 159–170.[33] B. Klimmt, Y. Yang, Introducing the Enron corpus, in: Proc. 1st Conf. on Email and Anti-Spam (CEAS), 2004, pp. 1–2.[34] J. Leskovec, SNAP: stanford network analysis project, <http://snap.stanford.edu/index.html>, (last accessed Feb 2014).[35] J. Leskovec, K. Lang, A. Dasgupta, M. Mahoney, Community structure in large networks: natural cluster sizes and the absence of large well-defined
clusters, Internet Math. 6 (1) (2009) 29–123.
G.M. Slota, K. Madduri / Parallel Computing 47 (2015) 51–69 69
[36] Network Dynamics and Simulation and Science Laboratory, Synthetic data products for societal infrastructures and proto-populations: Data set 1.0,Tech. Rep. NDSSL-TR-06-006, Virginia Polytechnic Institute and State University, 2006.
[37] J. Yang, J. Leskovec, Defining and evaluating network communities based on ground-truth, in: Proc. 12th IEEE Int’l. Conf. on Data Mining (ICDMs), 2012,pp. 745–754.
[38] M. Cha, H. Haddadi, F. Benevenuto, K.P. Gummadi, Measuring user influence in Twitter: the million follower fallacy, in: Proc. Int’l. Conf. on Weblogs andSocial Media (ICWSM), 2010, pp. 1–8.
[39] P. Boldi, B. Codenotti, M. Santini, S. Vigna, UbiCrawler: a scalable fully distributed web crawler, Software Pract. Exp. 34 (8) (2004) 711–726.[40] T.A. Davis, Y. Hu, The University of Florida sparse matrix collection, ACM Trans. Math. Software 38 (1) (2011) 1–25.[41] I. Xenarios, L. Salwinski, X.J. Duan, P. Higney, S.M. Kim, D. Eisenberg, DIP, the database of interacting proteins: a research tool for studying cellular
networks of protein interactions, Nucleic Acids Res. 30 (1) (2002) 303–305.[42] P. Radivojac, K. Page, W.T. Clark, B.J. Peters, A. Mohan, S.M. Boyle, S.D. Mooney, An integrated approach to inferring gene-disease associations in
humans, Proteins 72 (3) (2008) 1030–1037.[43] A. Chatr-Aryamontri, A. Ceol, L.M. Palazzi, G. Nardelli, M.V. Schneider, L. Castagnoli, G. Cesareni, Mint: the molecular interaction database, Nucleic
Acids Res. 35 (suppl.1) (2007) D572–D574.[44] G.M. Slota, K. Madduri, S. Rajamanickam, PULP: scalable multi-objective multi-constraint partitioning for small-world networks, in: Proc. IEEE Int’l.
Conference on Big Data (BigData), 2014, pp. 1–10.[45] F. Hüffner, S. Wernicke, T. Zichner, Faspad: fast signaling pathway detection, Bioinformatics 23 (13) (2007) 1708–1709.[46] D.W. Huang, B.T. Sherman, R.A. Lempicki, Systematic and integrative analysis of large gene lists using DAVID bioinformatics resources, Nat. Protoc. 4
(1) (2009) 44–57.[47] D.W. Huang, B.T. Sherman, R.A. Lempicki, Bioinformatics enrichment tools: paths toward the comprehensive functional analysis of large gene lists,
Nucleic Acids Res. 37 (1) (2009) 1–13.[48] M.W.N. Deininger, J.M. Goldman, J.V. Melo, The molecular biology of chronic myeloid leukemia, Blood 96 (10) (2000) 3343–3356.


![Tractable Approximate Robust Geometric Programmingweb.stanford.edu/~boyd/papers/pdf/rgp-full.pdf · Tractable Approximate Robust Geometric Programming ... KC97], power control of](https://img.pdfslide.net/doc/110x75/5c9d5fd088c9939c348cafed/tractable-approximate-robust-geometric-boydpaperspdfrgp-fullpdf-tractable.jpg)

![Efficient and Tractable System Identification through ...ahefny/pubs/7_21_17_berkley.pdfEfficient and Tractable System Identification through Supervised ... PSIM [DAgger] RNN [BPTT]](https://img.pdfslide.net/doc/110x75/5af834ca7f8b9a2d5d8b4a79/efficient-and-tractable-system-identification-through-ahefnypubs72117-and.jpg)