Embed Size (px)
Citation preview
Energy for Sustainable Development 41 (2017) 49–60
Contents lists available at ScienceDirect
Energy for Sustainable Development
Parameter analysis of thermoelectric generator/dc-dc converter systemwith maximum power point tracking
Ssennoga Twaha, Jie Zhu ⁎, Bo Li, Yuying Yan, Kuo HuangFluids & Thermal Engineering Research Group, Faculty of Engineering, University of Nottingham, NG7 2RD, United Kingdom
⁎ Corresponding author.E-mail address: [email protected] (J. Zhu).
http://dx.doi.org/10.1016/j.esd.2017.08.0050973-0826/© 2017 International Energy Initiative. Publish
a b s t r a c t
a r t i c l e i n f oArticle history:Received 16 February 2017Revised 7 August 2017Accepted 11 August 2017Available online 23 August 2017
The power generated from TEG is relatively unstable owing to temperature variations at its hot and cold sideterminals. The dc-dc converters can provide more stable power output thereby improving the overall efficiencyof TEG system. However, to facilitate better performance improvement, maximum power point tracking (MPPT)algorithm can be applied to extract maximum power from TEG system. Therefore, parameter analysis of aTEG/dc-dc converter system in different modes is being carried out. A TEG-dc-dc boost converter modelis analysed in both MPPT and direct pulse width modulation (PWM) modes subjected to a variable load.To further study the capability of dc-dc converters to stabilise the TEG power output, increasing rampand random hot side temperature is applied to the MPPT and direct PWM based modes so that theeffect on output parameters i.e. voltage and power, can be analysed. It is noted that even for the randomtemperature input to the TEG, the output voltage resulting from the converter is almost constant. Thereforedc-dc converters are able to stabilise the power generated from TEG. It is also observed that dc-dc converterwith MPPT based model is able to effectively extract the maximum power without having to adjust anycomponent from the MPPT algorithm as it is the case with direct PWM based model. From the study,it has been established that proper selection of converter components is necessary to reduce converterlosses as well interferences on the load connected to TEG-dc-dc converter system.
© 2017 International Energy Initiative. Published by Elsevier Inc. All rights reserved.
Keywords:TEG devicesRandom temperatureDc-dc converterMPPTDirect PWM
Introduction
Energy-harvesting systems which convert heat into electricity withthe use of thermoelectric energy generation (TEG) devices are beingconstantly developed and manufactured (Liu et al., 2015; Noori et al.,2015).A number of currently available and applicable low-grade wasteheat recovery methods adopt thermoelectric (TE) modules includingplant/district/water heating, direct power generation and others(Ebrahimi et al., 2014). TE modules offer low cost electricity withoutmoving parts or production of environmentally deleterious wastes(Seetawan et al., 2014). TEG devices can also be applied in harvestingheat energy from biomass, especially in tropical countries (Twahaet al., 2016a). This will facilitate the sustainability of scarce energyresources, especially the fossil fuels which are almost near exhaustion.Biomass cooking stoves which are commonly applied in developingcountries with limited access to electricity, can be operated with TEGdevices to generate low level electricity for homeuse, such as formobilephone charging (Najjar and Kseibi, 2017; Yap et al., 2017). In this regard,a TEG based biomass cooking stove was developed and deployed forelectricity generation, in the off grid areas (Mal et al., 2016). Apartfrom clean cooking, the TEG based stove has the ability to provide
ed by Elsevier Inc. All rights reserved
lighting and battery charging (or mobile phone battery charging)based on the user's preference as well as price sensitivity. These TEGapplications are steps forward for energy and sustainable developmentin rural and remote areas, geared towards reducing energy poverty orscarcity in underdeveloped countries. However, the optimal perfor-mance of TEmodules depends on several factors likematerial propertiesand operation strategy (Twaha et al., 2016b).
Various research efforts are underway to improve the performanceof TE conversion system. The integrated thermoelectric devices arealso developed by restructuring them to allow more heat to enter thep–n junctions, thereby producing more power output (Barry et al.,2015). Product development for TEG devices requires solving a coupleof challenges in material and system construction aspects for numerousTEG system applications (Leblanc, 2014).Accuracy of mathematicalmodels used in thermoelectric simulation is assessed with specialreference to thermal influence of insulated air zone and radiation heat(Gao et al., 2015). Heat transfer analysis between TEG cold and hotplates reveals that the developed model is of theoretical significancein guiding TEG design for high-power or large-temperature-differenceapplication. Different TEG structures including rotated and coaxialleg configurations (Erturun and Mossi, 2015), rectangular prism andcylindrical legs (Erturun et al., 2014), have been evaluated with regardsto power output, temperature distribution, conversion efficiency andthermal stresses in the legs. Not forgetting to mention the concentric
.
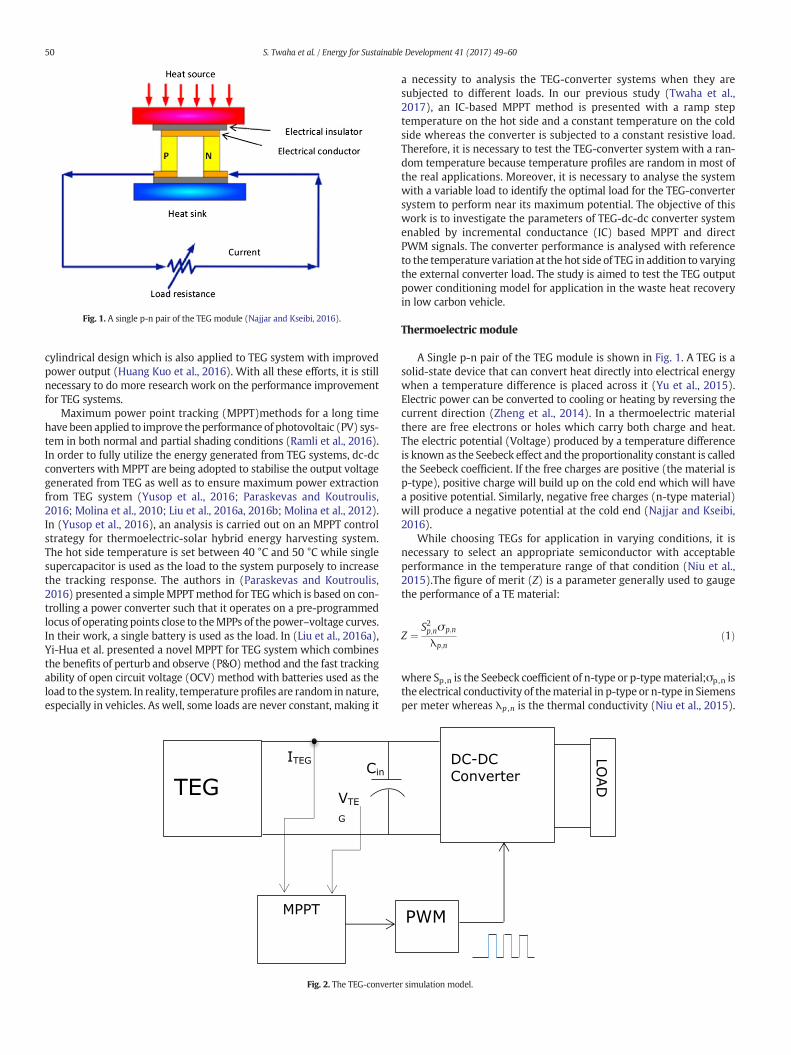
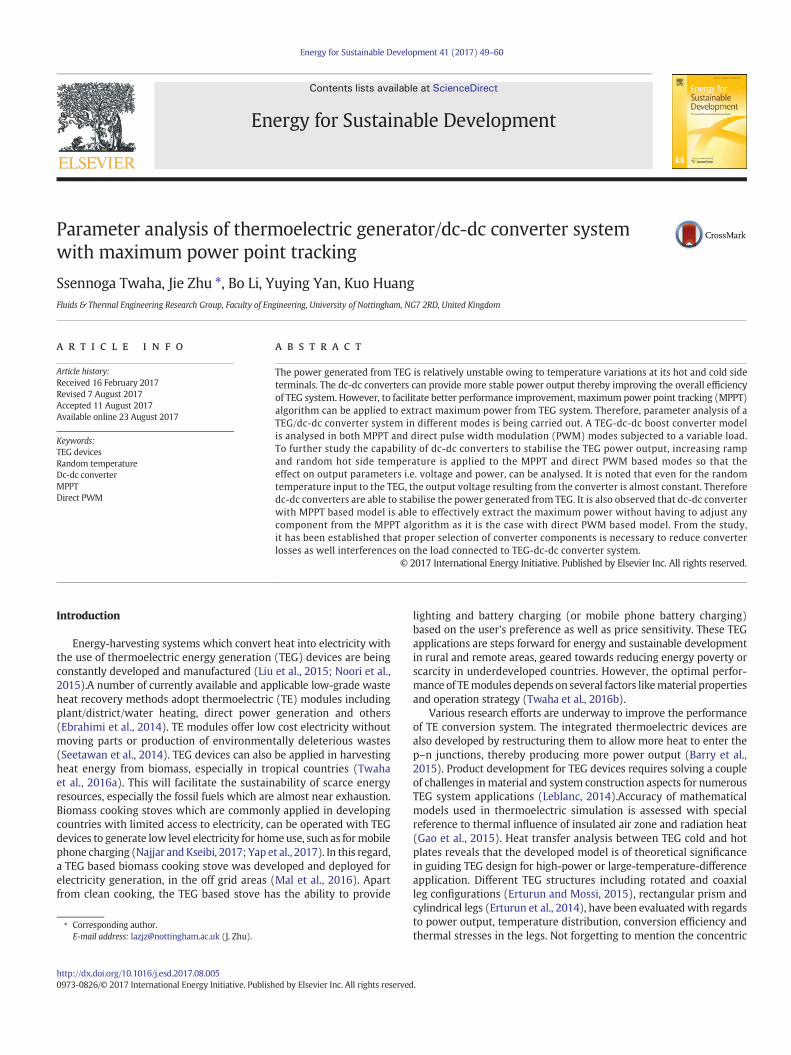
Fig. 1. A single p-n pair of the TEG module (Najjar and Kseibi, 2016).
50 S. Twaha et al. / Energy for Sustainable Development 41 (2017) 49–60
cylindrical design which is also applied to TEG system with improvedpower output (Huang Kuo et al., 2016). With all these efforts, it is stillnecessary to do more research work on the performance improvementfor TEG systems.
Maximum power point tracking (MPPT)methods for a long timehave been applied to improve the performance of photovoltaic (PV) sys-tem in both normal and partial shading conditions (Ramli et al., 2016).In order to fully utilize the energy generated from TEG systems, dc-dcconverters with MPPT are being adopted to stabilise the output voltagegenerated from TEG as well as to ensure maximum power extractionfrom TEG system (Yusop et al., 2016; Paraskevas and Koutroulis,2016; Molina et al., 2010; Liu et al., 2016a, 2016b; Molina et al., 2012).In (Yusop et al., 2016), an analysis is carried out on an MPPT controlstrategy for thermoelectric-solar hybrid energy harvesting system.The hot side temperature is set between 40 °C and 50 °C while singlesupercapacitor is used as the load to the system purposely to increasethe tracking response. The authors in (Paraskevas and Koutroulis,2016) presented a simpleMPPTmethod for TEGwhich is based on con-trolling a power converter such that it operates on a pre-programmedlocus of operating points close to theMPPs of the power–voltage curves.In their work, a single battery is used as the load. In (Liu et al., 2016a),Yi-Hua et al. presented a novel MPPT for TEG system which combinesthe benefits of perturb and observe (P&O)method and the fast trackingability of open circuit voltage (OCV) method with batteries used as theload to the system. In reality, temperature profiles are random in nature,especially in vehicles. As well, some loads are never constant, making it
Fig. 2. The TEG-converte
a necessity to analysis the TEG-converter systems when they aresubjected to different loads. In our previous study (Twaha et al.,2017), an IC-based MPPT method is presented with a ramp steptemperature on the hot side and a constant temperature on the coldside whereas the converter is subjected to a constant resistive load.Therefore, it is necessary to test the TEG-converter system with a ran-dom temperature because temperature profiles are random in most ofthe real applications. Moreover, it is necessary to analyse the systemwith a variable load to identify the optimal load for the TEG-convertersystem to perform near its maximum potential. The objective of thiswork is to investigate the parameters of TEG-dc-dc converter systemenabled by incremental conductance (IC) based MPPT and directPWM signals. The converter performance is analysed with referenceto the temperature variation at the hot side of TEG in addition to varyingthe external converter load. The study is aimed to test the TEG outputpower conditioning model for application in the waste heat recoveryin low carbon vehicle.
Thermoelectric module
A Single p-n pair of the TEG module is shown in Fig. 1. A TEG is asolid-state device that can convert heat directly into electrical energywhen a temperature difference is placed across it (Yu et al., 2015).Electric power can be converted to cooling or heating by reversing thecurrent direction (Zheng et al., 2014). In a thermoelectric materialthere are free electrons or holes which carry both charge and heat.The electric potential (Voltage) produced by a temperature differenceis known as the Seebeck effect and the proportionality constant is calledthe Seebeck coefficient. If the free charges are positive (the material isp-type), positive charge will build up on the cold end which will havea positive potential. Similarly, negative free charges (n-type material)will produce a negative potential at the cold end (Najjar and Kseibi,2016).
While choosing TEGs for application in varying conditions, it isnecessary to select an appropriate semiconductor with acceptableperformance in the temperature range of that condition (Niu et al.,2015).The figure of merit (Z) is a parameter generally used to gaugethe performance of a TE material:
Z ¼ S2p;nσp;n
λp;nð1Þ
where Sp,n is the Seebeck coefficient of n-type or p-typematerial;σp,n isthe electrical conductivity of thematerial in p-type or n-type in Siemensper meter whereas λp ,n is the thermal conductivity (Niu et al., 2015).
r simulation model.
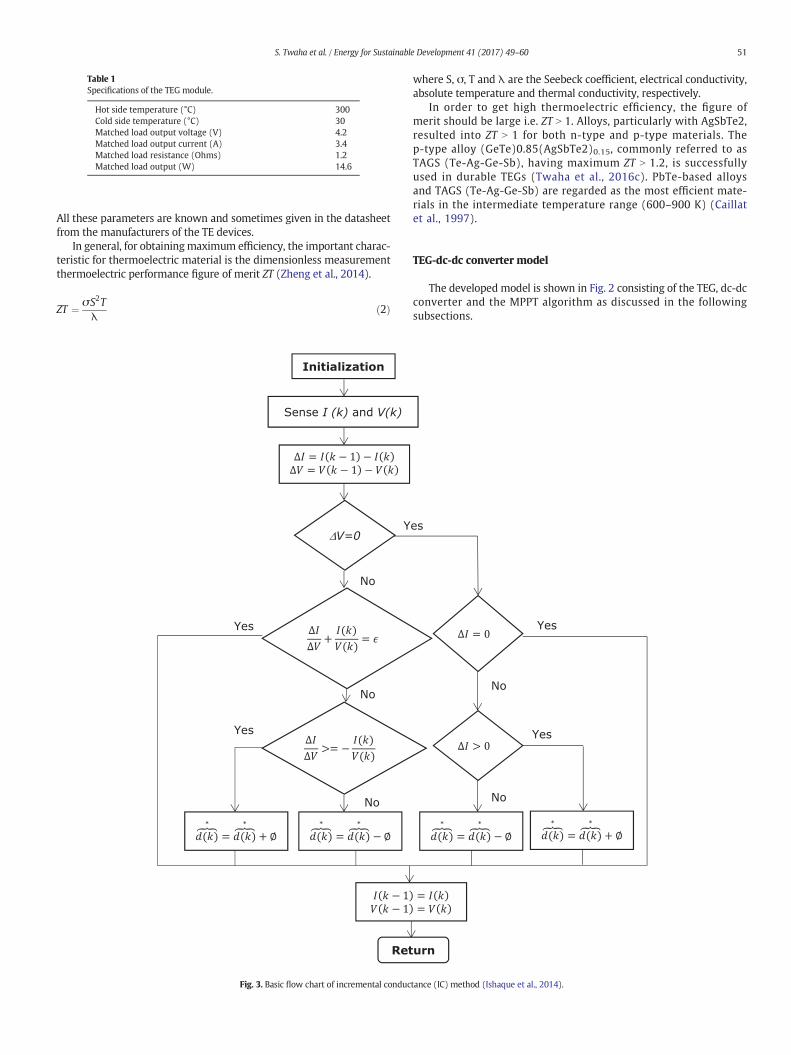
Table 1Specifications of the TEG module.
Hot side temperature (°C) 300Cold side temperature (°C) 30Matched load output voltage (V) 4.2Matched load output current (A) 3.4Matched load resistance (Ohms) 1.2Matched load output (W) 14.6
51S. Twaha et al. / Energy for Sustainable Development 41 (2017) 49–60
All these parameters are known and sometimes given in the datasheetfrom the manufacturers of the TE devices.
In general, for obtainingmaximum efficiency, the important charac-teristic for thermoelectric material is the dimensionless measurementthermoelectric performance figure of merit ZT (Zheng et al., 2014).
ZT ¼ σS2Tλ
ð2Þ
Fig. 3. Basic flow chart of incremental conduc
where S, σ, T and λ are the Seebeck coefficient, electrical conductivity,absolute temperature and thermal conductivity, respectively.
In order to get high thermoelectric efficiency, the figure ofmerit should be large i.e. ZT N 1. Alloys, particularly with AgSbTe2,resulted into ZT N 1 for both n-type and p-type materials. Thep-type alloy (GeTe)0.85(AgSbTe2)0.15, commonly referred to asTAGS (Te-Ag-Ge-Sb), having maximum ZT N 1.2, is successfullyused in durable TEGs (Twaha et al., 2016c). PbTe-based alloysand TAGS (Te-Ag-Ge-Sb) are regarded as the most efficient mate-rials in the intermediate temperature range (600–900 K) (Caillatet al., 1997).
TEG-dc-dc converter model
The developed model is shown in Fig. 2 consisting of the TEG, dc-dcconverter and the MPPT algorithm as discussed in the followingsubsections.
tance (IC) method (Ishaque et al., 2014).
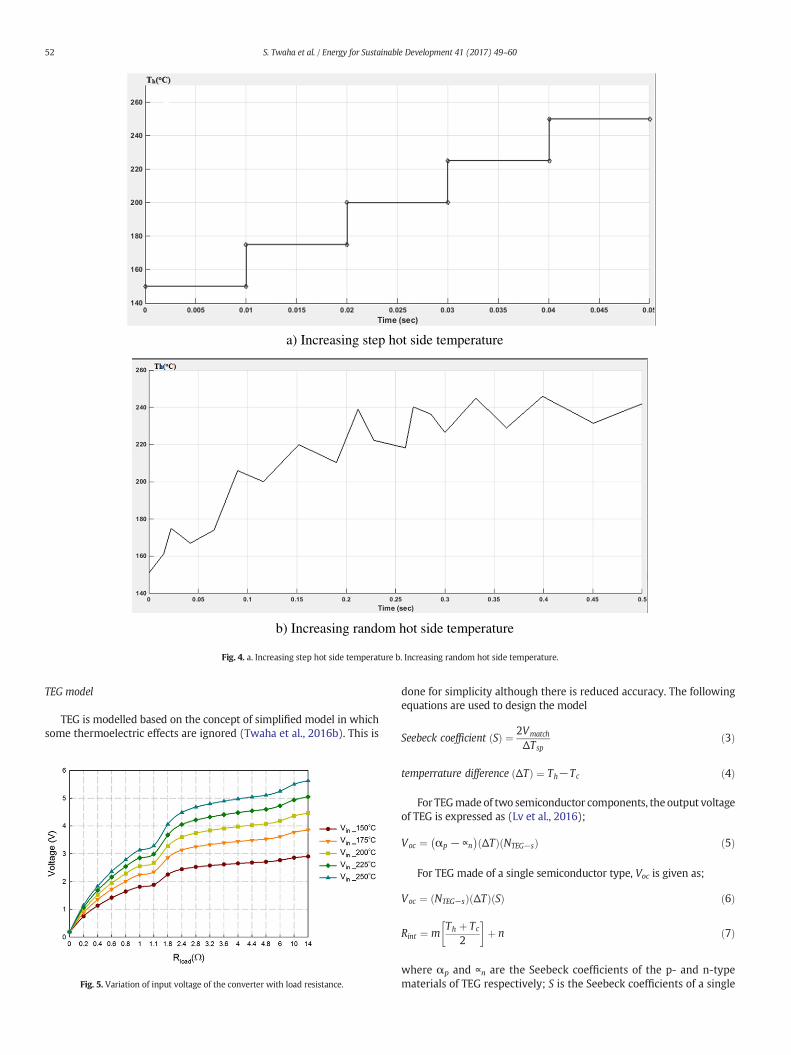
a) Increasing step hot side temperature
b) Increasing random hot side temperature
Fig. 4. a. Increasing step hot side temperature b. Increasing random hot side temperature.
52 S. Twaha et al. / Energy for Sustainable Development 41 (2017) 49–60
TEG model
TEG is modelled based on the concept of simplified model in whichsome thermoelectric effects are ignored (Twaha et al., 2016b). This is
Fig. 5. Variation of input voltage of the converter with load resistance.
done for simplicity although there is reduced accuracy. The followingequations are used to design the model
Seebeck coefficient Sð Þ ¼ 2Vmatch
ΔTspð3Þ
temperrature difference ΔTð Þ ¼ Th−Tc ð4Þ
For TEGmade of two semiconductor components, the output voltageof TEG is expressed as (Lv et al., 2016);
Voc ¼ αp −∝n� �
ΔTð Þ NTEG−sð Þ ð5Þ
For TEG made of a single semiconductor type, Voc is given as;
Voc ¼ NTEG−sð Þ ΔTð Þ Sð Þ ð6Þ
Rint ¼ mTh þ Tc
2
� �þ n ð7Þ
where αp and ∝n are the Seebeck coefficients of the p- and n-typematerials of TEG respectively; S is the Seebeck coefficients of a single
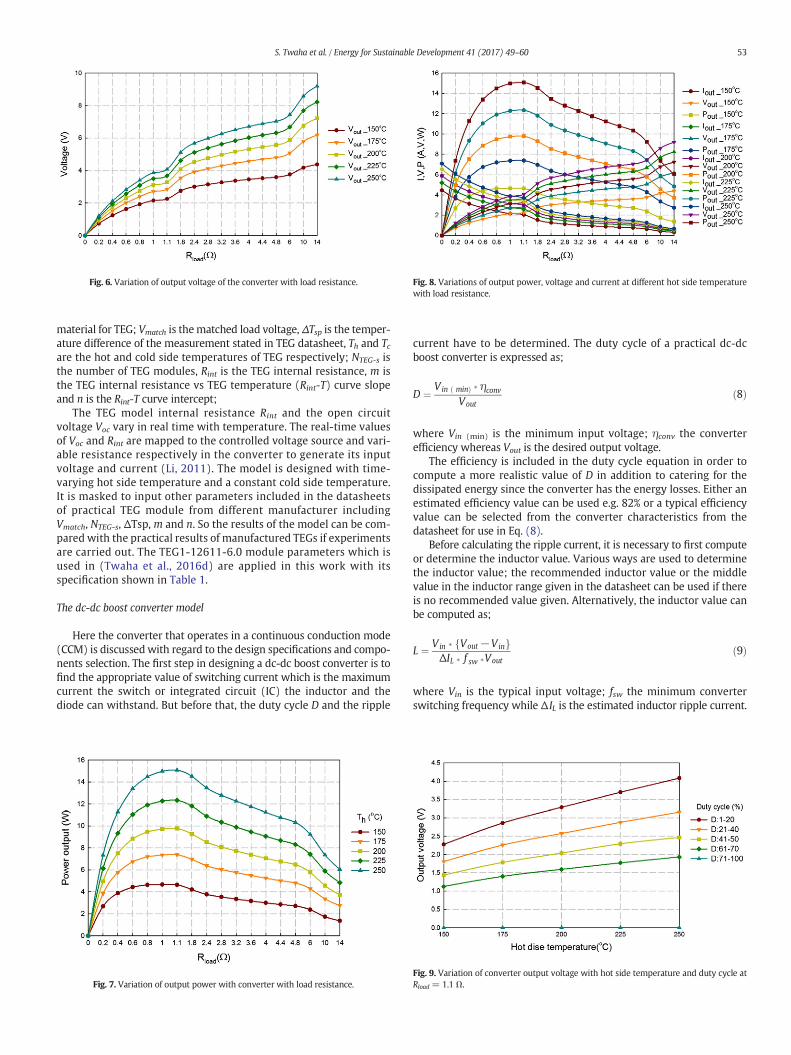
Fig. 8. Variations of output power, voltage and current at different hot side temperaturewith load resistance.
Fig. 6. Variation of output voltage of the converter with load resistance.
53S. Twaha et al. / Energy for Sustainable Development 41 (2017) 49–60
material for TEG; Vmatch is thematched load voltage, ΔTsp is the temper-ature difference of the measurement stated in TEG datasheet, Th and Tcare the hot and cold side temperatures of TEG respectively; NTEG-s isthe number of TEG modules, Rint is the TEG internal resistance, m isthe TEG internal resistance vs TEG temperature (Rint-T) curve slopeand n is the Rint-T curve intercept;
The TEG model internal resistance Rint and the open circuitvoltage Voc vary in real time with temperature. The real-time valuesof Voc and Rint are mapped to the controlled voltage source and vari-able resistance respectively in the converter to generate its inputvoltage and current (Li, 2011). The model is designed with time-varying hot side temperature and a constant cold side temperature.It is masked to input other parameters included in the datasheetsof practical TEG module from different manufacturer includingVmatch, NTEG-s, ΔTsp, m and n. So the results of the model can be com-pared with the practical results of manufactured TEGs if experimentsare carried out. The TEG1-12611-6.0 module parameters which isused in (Twaha et al., 2016d) are applied in this work with itsspecification shown in Table 1.
The dc-dc boost converter model
Here the converter that operates in a continuous conduction mode(CCM) is discussed with regard to the design specifications and compo-nents selection. The first step in designing a dc-dc boost converter is tofind the appropriate value of switching current which is the maximumcurrent the switch or integrated circuit (IC) the inductor and thediode can withstand. But before that, the duty cycle D and the ripple
Fig. 7. Variation of output power with converter with load resistance.
current have to be determined. The duty cycle of a practical dc-dcboost converter is expressed as;
D ¼ Vin minð Þ � ηconvVout
ð8Þ
where Vin (min) is the minimum input voltage; ηconv the converterefficiency whereas Vout is the desired output voltage.
The efficiency is included in the duty cycle equation in order tocompute a more realistic value of D in addition to catering for thedissipated energy since the converter has the energy losses. Either anestimated efficiency value can be used e.g. 82% or a typical efficiencyvalue can be selected from the converter characteristics from thedatasheet for use in Eq. (8).
Before calculating the ripple current, it is necessary to first computeor determine the inductor value. Various ways are used to determinethe inductor value; the recommended inductor value or the middlevalue in the inductor range given in the datasheet can be used if thereis no recommended value given. Alternatively, the inductor value canbe computed as;
L ¼ Vin � Vout−Vinf gΔIL � f sw �Vout
ð9Þ
where Vin is the typical input voltage; fsw the minimum converterswitching frequency while Δ IL is the estimated inductor ripple current.
Fig. 9. Variation of converter output voltage with hot side temperature and duty cycle atRload = 1.1 Ω.
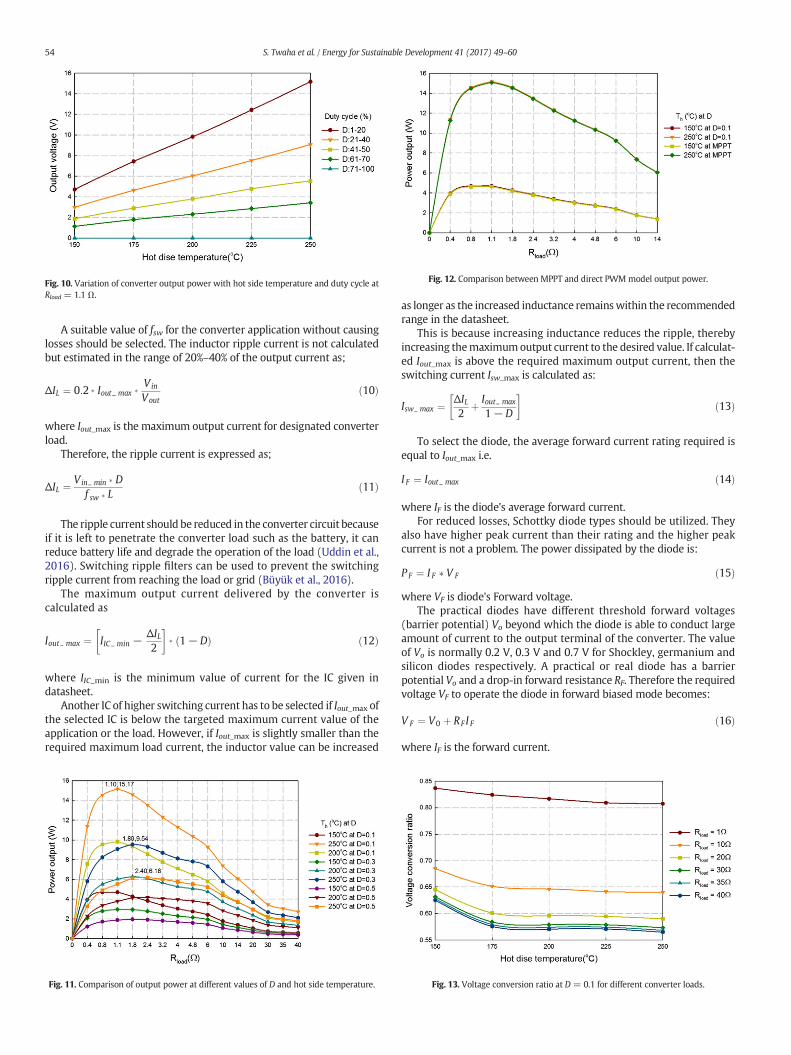
Fig. 12. Comparison between MPPT and direct PWM model output power.Fig. 10. Variation of converter output power with hot side temperature and duty cycle atRload = 1.1 Ω.
54 S. Twaha et al. / Energy for Sustainable Development 41 (2017) 49–60
A suitable value of fsw for the converter application without causinglosses should be selected. The inductor ripple current is not calculatedbut estimated in the range of 20%–40% of the output current as;
ΔIL ¼ 0:2 � Iout max � Vin
Voutð10Þ
where Iout_max is the maximum output current for designated converterload.
Therefore, the ripple current is expressed as;
ΔIL ¼ Vin min � Df sw � L
ð11Þ
The ripple current should be reduced in the converter circuit becauseif it is left to penetrate the converter load such as the battery, it canreduce battery life and degrade the operation of the load (Uddin et al.,2016). Switching ripple filters can be used to prevent the switchingripple current from reaching the load or grid (Büyük et al., 2016).
The maximum output current delivered by the converter iscalculated as
Iout max ¼ IIC min −ΔIL2
� �� 1−Dð Þ ð12Þ
where IIC_min is the minimum value of current for the IC given indatasheet.
Another IC of higher switching current has to be selected if Iout_max ofthe selected IC is below the targeted maximum current value of theapplication or the load. However, if Iout_max is slightly smaller than therequired maximum load current, the inductor value can be increased
Fig. 11. Comparison of output power at different values of D and hot side temperature.
as longer as the increased inductance remainswithin the recommendedrange in the datasheet.
This is because increasing inductance reduces the ripple, therebyincreasing themaximumoutput current to the desired value. If calculat-ed Iout_max is above the required maximum output current, then theswitching current Isw_max is calculated as:
Isw max ¼ ΔIL2
þ Iout max
1−D
� �ð13Þ
To select the diode, the average forward current rating required isequal to Iout_max i.e.
I F ¼ Iout max ð14Þ
where IF is the diode's average forward current.For reduced losses, Schottky diode types should be utilized. They
also have higher peak current than their rating and the higher peakcurrent is not a problem. The power dissipated by the diode is:
P F ¼ I F � V F ð15Þ
where VF is diode's Forward voltage.The practical diodes have different threshold forward voltages
(barrier potential) Vo beyond which the diode is able to conduct largeamount of current to the output terminal of the converter. The valueof Vo is normally 0.2 V, 0.3 V and 0.7 V for Shockley, germanium andsilicon diodes respectively. A practical or real diode has a barrierpotential Vo and a drop-in forward resistance RF. Therefore the requiredvoltage VF to operate the diode in forward biased mode becomes:
V F ¼ V0 þ RF I F ð16Þ
where IF is the forward current.
Fig. 13. Voltage conversion ratio at D = 0.1 for different converter loads.
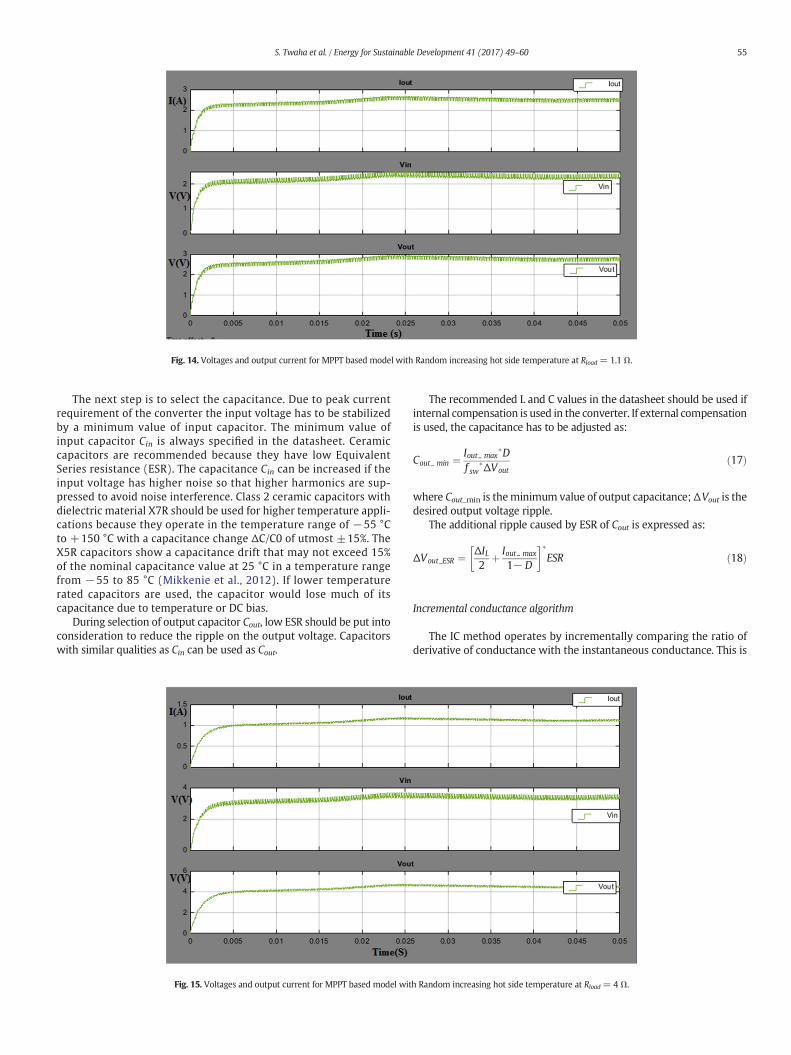
Fig. 14. Voltages and output current for MPPT based model with Random increasing hot side temperature at Rload = 1.1 Ω.
55S. Twaha et al. / Energy for Sustainable Development 41 (2017) 49–60
The next step is to select the capacitance. Due to peak currentrequirement of the converter the input voltage has to be stabilizedby a minimum value of input capacitor. The minimum value ofinput capacitor Cin is always specified in the datasheet. Ceramiccapacitors are recommended because they have low EquivalentSeries resistance (ESR). The capacitance Cin can be increased if theinput voltage has higher noise so that higher harmonics are sup-pressed to avoid noise interference. Class 2 ceramic capacitors withdielectric material X7R should be used for higher temperature appli-cations because they operate in the temperature range of −55 °Cto +150 °C with a capacitance change ΔC/C0 of utmost ±15%. TheX5R capacitors show a capacitance drift that may not exceed 15%of the nominal capacitance value at 25 °C in a temperature rangefrom −55 to 85 °C (Mikkenie et al., 2012). If lower temperaturerated capacitors are used, the capacitor would lose much of itscapacitance due to temperature or DC bias.
During selection of output capacitor Cout, low ESR should be put intoconsideration to reduce the ripple on the output voltage. Capacitorswith similar qualities as Cin can be used as Cout.
Fig. 15. Voltages and output current for MPPT based model wit
The recommended L and C values in the datasheet should be used ifinternal compensation is used in the converter. If external compensationis used, the capacitance has to be adjusted as:
Cout min ¼ Iout max�D
f sw�ΔVout
ð17Þ
where Cout_min is theminimum value of output capacitance;ΔVout is thedesired output voltage ripple.
The additional ripple caused by ESR of Cout is expressed as:
ΔVout ESR ¼ ΔIL2
þ Iout max
1−D
� ��ESR ð18Þ
Incremental conductance algorithm
The IC method operates by incrementally comparing the ratio ofderivative of conductance with the instantaneous conductance. This is
h Random increasing hot side temperature at Rload = 4 Ω.
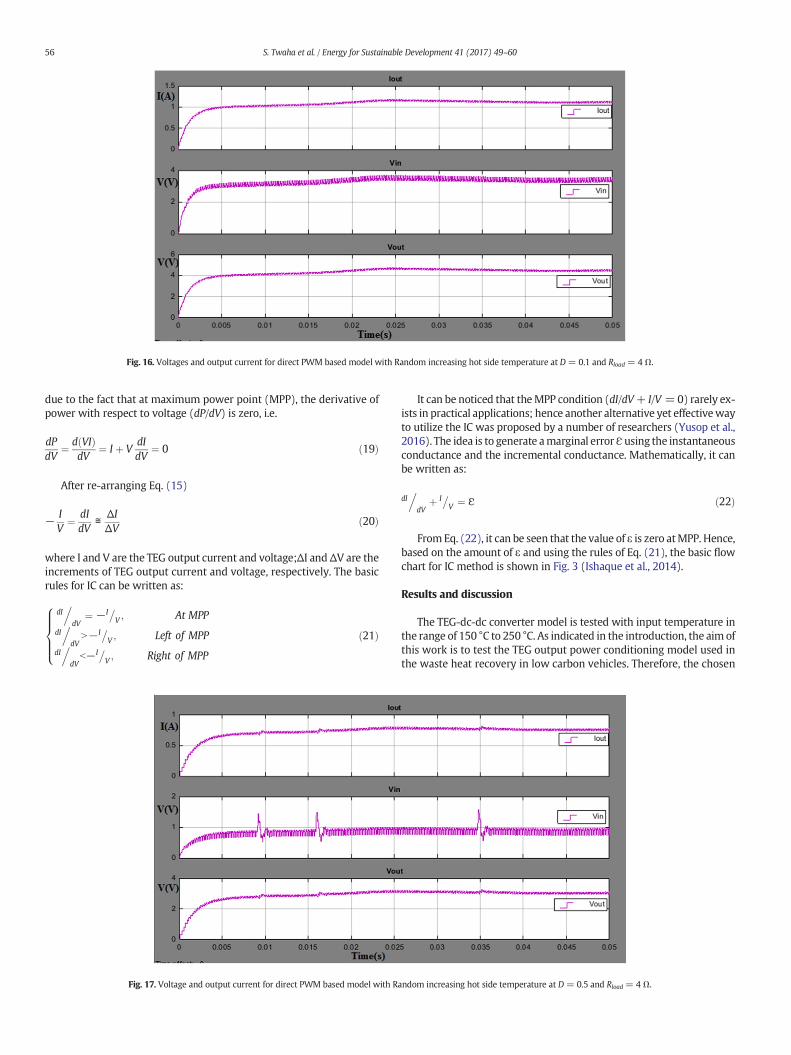
Fig. 16. Voltages and output current for direct PWM based model with Random increasing hot side temperature at D = 0.1 and Rload = 4 Ω.
56 S. Twaha et al. / Energy for Sustainable Development 41 (2017) 49–60
due to the fact that at maximum power point (MPP), the derivative ofpower with respect to voltage (dP/dV) is zero, i.e.
dPdV
¼ d VIð ÞdV
¼ I þ VdIdV
¼ 0 ð19Þ
After re-arranging Eq. (15)
−IV¼ dI
dV≅
ΔIΔV
ð20Þ
where I and V are the TEG output current and voltage;ΔI andΔV are theincrements of TEG output current and voltage, respectively. The basicrules for IC can be written as:
dI.
dV¼ −I�
V ; At MPP
dI.
dVN−I�
V ; Left of MPPdI.
dVb−I�
V ; Right of MPP
8>>><>>>:
ð21Þ
Fig. 17. Voltage and output current for direct PWM based model with R
It can be noticed that theMPP condition (dI/dV+ I/V =0) rarely ex-ists in practical applications; hence another alternative yet effectivewayto utilize the IC was proposed by a number of researchers (Yusop et al.,2016). The idea is to generate amarginal errorƐ using the instantaneousconductance and the incremental conductance. Mathematically, it canbe written as:
dI.
dVþ I�
V ¼ Ɛ ð22Þ
FromEq. (22), it can be seen that the value of ε is zero atMPP. Hence,based on the amount of ε and using the rules of Eq. (21), the basic flowchart for IC method is shown in Fig. 3 (Ishaque et al., 2014).
Results and discussion
The TEG-dc-dc converter model is tested with input temperature inthe range of 150 °C to 250 °C. As indicated in the introduction, the aim ofthis work is to test the TEG output power conditioning model used inthe waste heat recovery in low carbon vehicles. Therefore, the chosen
andom increasing hot side temperature at D = 0.5 and Rload = 4 Ω.
a) Ripple voltage at ESR = 1x10⁻⁹ Ω
b. Ripple voltage at ESR = 1x10⁻⁶ Ω
Fig. 18. a. Ripple voltage at ESR = 1 × 10⁻⁹ Ω b. Ripple voltage at ESR = 1 × 10⁻⁶ Ω.
57S. Twaha et al. / Energy for Sustainable Development 41 (2017) 49–60
maximum temperature is based on the fact that in the gas oil or hybridvehicles, the average temperature of the exhaustmanifold is over 250 °C(Yu and Chau, 2009). The input temperature test scenarios for themodel are shown in Fig. 4a and b for an increasing step and randomsignals respectively at hot side temperature terminal.
Results for the increasing step hot side temperature
The results in this section are based on the temperature input of anincreasing step signal at the hot side temperature terminal of themodelwhereas at the cold side terminal, the temperature is maintainedat a constant value of 30 °C. The model has been operated in bothMPPTand direct PWM switching modes to compare their performances.
Converter parameters with the MPPT modeDuring theMPPTmode themodel is subjected to varying loads in the
range of 0–14 Ω in order to find out the effect of different loads on the
converter parameters including output voltage, current and power.Figs. 5 and 6 show the input and output voltages of the converter atdifferent temperatures. It can be observed from both figures that theinput as well as the output voltage increases with the temperature. Sothe highest voltage is observed at hot side temperature (Th) of 25 °C.This is because as Th increases under a constant cold side temperatureTc, the temperature difference at TEG increases and in turn the Seebeckeffect which is responsible for the generated voltage increases.
It is also clear that as the converter load increases, the input andoutput voltages also rise. However, a sharp increase in the voltage isobserved from zero resistance up to 1.1Ωwhere the rate of rise reduces.The rate of voltage rise again increases after Rload of 1.1Ω onwards untilat the about 10 Ω. The interpretation for this trend is better explainedbased on power curve for TEG shown in Fig. 7. The graph of Rload againstpower output of the converter indicates that at a converter load of 1.1Ω,this is where the maximum power is obtained from the converter. Thisload is referred to as the optimal load atwhich the total resistance of the

a) Ripple voltage at ESR = 1x10⁻⁶Ω when Rload = 1Ω
b) Ripple voltage at ESR = 1Ω when Rload = 1Ω
Fig. 19. a. Ripple voltage at ESR = 1 × 10⁻⁶ Ω when Rload = 1 Ω. b. Ripple voltage at ESR = 1 Ω when Rload = 1 Ω.
58 S. Twaha et al. / Energy for Sustainable Development 41 (2017) 49–60
converter (including the ESR and other parasitic resistance of the com-ponents) is equal to the internal resistance of the TEG, Rint. At this point,the load is said to bematched and it is advisable to operate the converterat this load to harvest maximum power from the TEG-dc-dc convertersystem. The increase in Th results in the corresponding increase in inter-nal resistance of TEG device leading to the rise in the optimum pointsdue to increase in the value of matching load resistance as seen inFig. 7. Given the nature of the variation of the internal resistance ofTEG, it is very hard to archive the load matching point, hence the useof MPPT algorithm.
Fig. 8 shows the I\\V characteristic of the converter plotted withoutput power. It is seen that as the converter load is increased, theoutput current reduces but the output voltage instead increases. Thecurrent and voltage curves meet almost at the maximum power pointi.e. at the load matching point though the point of intersection is notthe same for different hot side temperature. The output current ismaximum at zero load. In ideal circuit, the current is always zero atzero load but in this case the current is maximum since there is someESR resistance in the output capacitor which is parallel to the outputterminal. So, the current through the diode takes the easiest path tothe ground.
Converter parameters with direct PWM signalDuring the direct PWM mode the model is subjected to varying
loads in the range of 0–40 Ω in order to find out the effect of differ-ent loads on the converter parameters at different duty cycle. Fig. 9shows the output voltages of the converter at different temperatureand duty cycle D. As observed, higher output voltage is obtained atD = 10% and the least voltage is obtained at D = 80%. During sim-ulation, it is noticed that different ranges of D gives different output
voltages as indicated in Fig. 9. The maximum voltage is achievedat duty cycle range of 1–20%. Similarly the output power for theconverter is shown in Fig. 10. The only observable differencebetween the output voltage and output power is that the rate ofincrease of output power with Th rises as D increases. Neverthelessin both cases the output voltage and power increase linearly withtemperature. The slopes for lines indicated in Fig. 10 are differentfrom each other whereby the highest slope is obtained at a dutycycle range of 1–20%. Similar trends have been recorded at otherconverter loads.
Fig. 11 shows the output power at different values of D. For clarify,only three Th and duty cycle values have been plotted. It is noted thatfor the same range of duty cycle, the matching load is the same evenfor different temperatures. For example in Fig. 11 the matching load is1.1Ω for Th of 150 °C, 200 °C and 250 °C at a duty cycle of 10%. However,as soon as D is changed, the matching load also changes. For examplethe matching load is 1.1 Ω, 1.8 Ω and 2.4 Ω for duty cycle values of10%, 30% and 50% respectively at the same Th = 250 °C. Therefore, itcan be concluded that in cases where a fixed load is connected to theconverter, it is not suitable to change the duty cycle even at differentvalues of Th.
Fig. 12 shows MPPT and direct PWM model output powers. It hasbeen observed that themaximumpower from the converter is obtainedat the duty cycle of 10%. Also it is clear that the output power fromMPPTbased converter model corresponds to the output power from directPWM mode at D = 10% (as well as D in the range 1–20%). However,at higher values of D, the power output reduces. Therefore, the MPPTcan automatically extract maximum power from the system withouthaving to adjust any component from the MPPT algorithm as it is thecase with direct PWM mode.
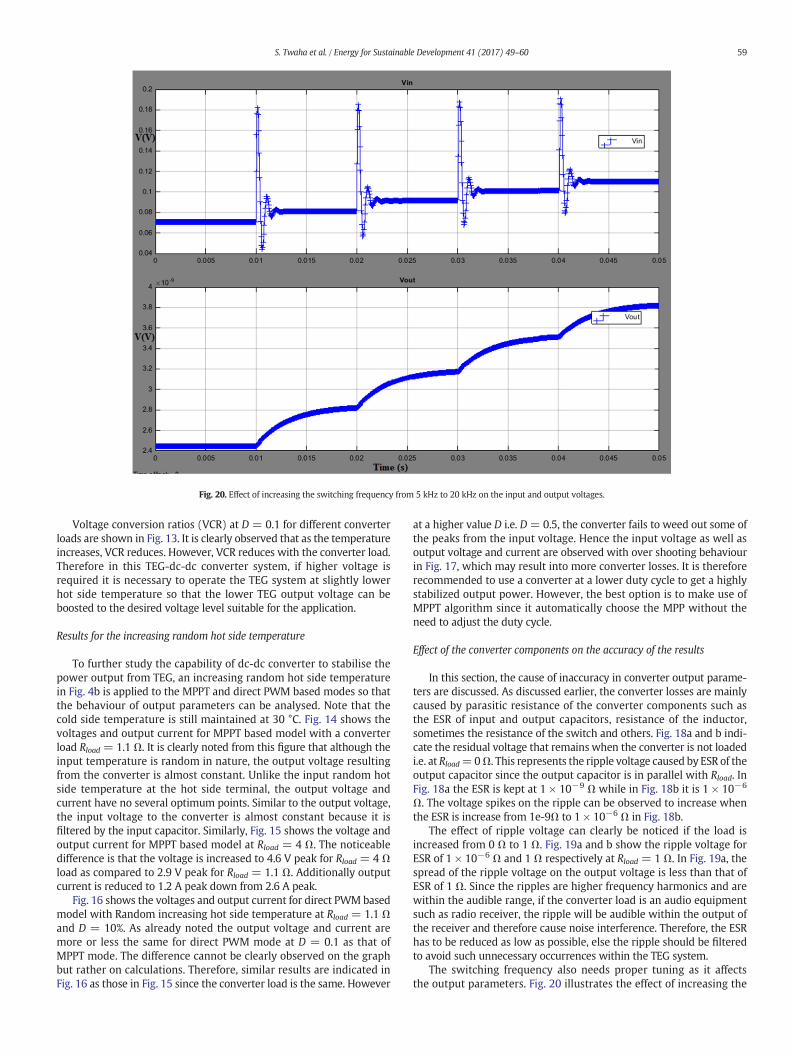
Fig. 20. Effect of increasing the switching frequency from 5 kHz to 20 kHz on the input and output voltages.
59S. Twaha et al. / Energy for Sustainable Development 41 (2017) 49–60
Voltage conversion ratios (VCR) at D = 0.1 for different converterloads are shown in Fig. 13. It is clearly observed that as the temperatureincreases, VCR reduces. However, VCR reduces with the converter load.Therefore in this TEG-dc-dc converter system, if higher voltage isrequired it is necessary to operate the TEG system at slightly lowerhot side temperature so that the lower TEG output voltage can beboosted to the desired voltage level suitable for the application.
Results for the increasing random hot side temperature
To further study the capability of dc-dc converter to stabilise thepower output from TEG, an increasing random hot side temperaturein Fig. 4b is applied to the MPPT and direct PWM based modes so thatthe behaviour of output parameters can be analysed. Note that thecold side temperature is still maintained at 30 °C. Fig. 14 shows thevoltages and output current for MPPT based model with a converterload Rload = 1.1 Ω. It is clearly noted from this figure that although theinput temperature is random in nature, the output voltage resultingfrom the converter is almost constant. Unlike the input random hotside temperature at the hot side terminal, the output voltage andcurrent have no several optimum points. Similar to the output voltage,the input voltage to the converter is almost constant because it isfiltered by the input capacitor. Similarly, Fig. 15 shows the voltage andoutput current for MPPT based model at Rload = 4 Ω. The noticeabledifference is that the voltage is increased to 4.6 V peak for Rload = 4 Ωload as compared to 2.9 V peak for Rload = 1.1 Ω. Additionally outputcurrent is reduced to 1.2 A peak down from 2.6 A peak.
Fig. 16 shows the voltages and output current for direct PWM basedmodel with Random increasing hot side temperature at Rload = 1.1 Ωand D = 10%. As already noted the output voltage and current aremore or less the same for direct PWM mode at D = 0.1 as that ofMPPT mode. The difference cannot be clearly observed on the graphbut rather on calculations. Therefore, similar results are indicated inFig. 16 as those in Fig. 15 since the converter load is the same. However
at a higher value D i.e. D = 0.5, the converter fails to weed out some ofthe peaks from the input voltage. Hence the input voltage as well asoutput voltage and current are observed with over shooting behaviourin Fig. 17, which may result into more converter losses. It is thereforerecommended to use a converter at a lower duty cycle to get a highlystabilized output power. However, the best option is to make use ofMPPT algorithm since it automatically choose the MPP without theneed to adjust the duty cycle.
Effect of the converter components on the accuracy of the results
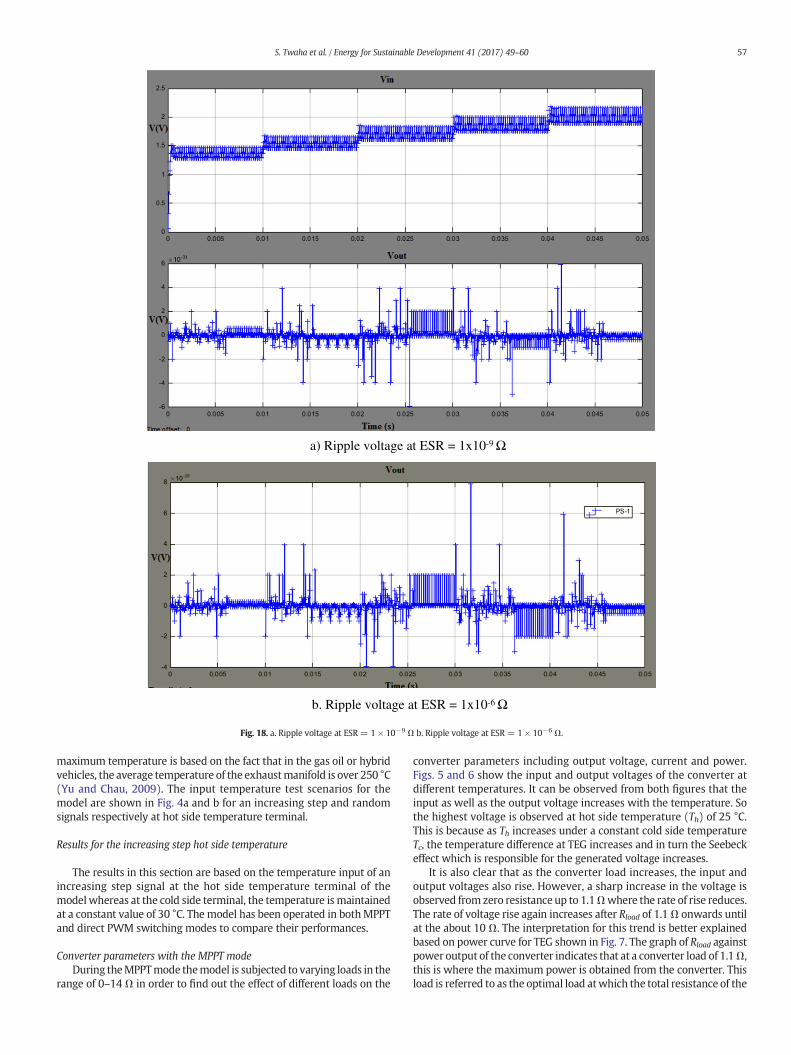
In this section, the cause of inaccuracy in converter output parame-ters are discussed. As discussed earlier, the converter losses are mainlycaused by parasitic resistance of the converter components such asthe ESR of input and output capacitors, resistance of the inductor,sometimes the resistance of the switch and others. Fig. 18a and b indi-cate the residual voltage that remains when the converter is not loadedi.e. at Rload=0Ω. This represents the ripple voltage caused by ESR of theoutput capacitor since the output capacitor is in parallel with Rload. InFig. 18a the ESR is kept at 1 × 10⁻⁹ Ω while in Fig. 18b it is 1 × 10⁻⁶
Ω. The voltage spikes on the ripple can be observed to increase whenthe ESR is increase from 1e-9Ω to 1 × 10⁻⁶ Ω in Fig. 18b.
The effect of ripple voltage can clearly be noticed if the load isincreased from 0 Ω to 1 Ω. Fig. 19a and b show the ripple voltage forESR of 1 × 10⁻⁶ Ω and 1 Ω respectively at Rload = 1 Ω. In Fig. 19a, thespread of the ripple voltage on the output voltage is less than that ofESR of 1 Ω. Since the ripples are higher frequency harmonics and arewithin the audible range, if the converter load is an audio equipmentsuch as radio receiver, the ripple will be audible within the output ofthe receiver and therefore cause noise interference. Therefore, the ESRhas to be reduced as low as possible, else the ripple should be filteredto avoid such unnecessary occurrences within the TEG system.
The switching frequency also needs proper tuning as it affectsthe output parameters. Fig. 20 illustrates the effect of increasing the
60 S. Twaha et al. / Energy for Sustainable Development 41 (2017) 49–60
switching frequency from 5 kHz to 20 kHz on the input and outputvoltages with overshooting. Although increasing Fsw reduces inductorripple current and output ripple voltage, it has the disadvantage ofincreasing the switching losses, hence reducing efficiency.
Conclusion
A dc-dc converter as a power conditioning device can provide amore stable power output and facilitate the extraction of more powerfrom the TEG system. But, for performance improvement, maximumpower point tracking (MPPT) algorithm can be applied to extractthe maximum power from TEG system. Therefore, this work hasanalysed the performance of a TEG/dc-dc converter system andthe parameters that influence the system's performance in differentmodes. A TEG/dc-dc boost converter model has been investigated inbothMPPT and direct pulsewidthmodulation (PWM)modes subjectedto a variable load. To further study the ability of dc-dc converters tostabilise the power output from TEG system, increasing ramp andrandom hot side temperature profiles have been applied to the MPPTand direct PWM based modes so that the effect on output parametersi.e. voltage and power, are analysed. It has been noted that even forthe random temperature input to the TEG, the output voltage resultingfrom the converter is almost constant. Therefore dc-dc converters areable to stabilise the power generated from TEG. It has also beenobserved that dc-dc converter with MPPT based model is able to effec-tively extract maximum power from TEG compared to the direct PWMbased model. It has been established that for maximum power to beachieved easily, an optimum load has to be connected to the system.Besides, proper selection of converter components is necessary toavoid converter losses aswell noise interferences on the load connectedto TEG/dc-dc converter system.
Acknowledgements
The authors acknowledge the PhD scholarship for the first authorfrom Islamic Development Bank (IDB) and University of Nottingham.
References
Barry MM, Agbim KA, Chyu MK. Performance of a thermoelectric device with integrated heatexchangers. J Electron Mater 2015;44(6):1394–401.
Büyük M, Tan A, Tümay M, Bayindir KÇ. Topologies, generalized designs, passive and activedamping methods of switching ripple filters for voltage source inverter: a comprehensivereview. Renew Sustain Energy Rev 2016;62:46–69.
Caillat T, Fleurial J-P, Borshchevsky A. Preparation and thermoelectric properties of semicon-ducting Zn 4 Sb 3. J Phys Chem Solid 1997;58(1997):1119–25.
Ebrahimi K, Jones GF, Fleischer AS. A review of data center cooling technology, operatingconditions and the corresponding low-grade waste heat recovery opportunities. RenewSustain Energy Rev 2014;31:622–38.
Erturun U, Mossi K. Thermoelectric devices with rotated and coaxial leg configurations:numerical analysis of performance. Appl Therm Eng 2015;85:304–12.
Erturun U, Erermis K, Mossi K. Effect of various leg geometries on thermo-mechanical andpower generation performance of thermoelectric devices. Appl Therm Eng 2014;73(1):126–39.
Gao J, Du Q, Chen M, Li B, Zhang D. Assessing the accuracy of mathematical models used inthermoelectric simulation: thermal influence of insulated air zone and radiation heat.Appl Therm Eng 2015;82:162–9.
Huang Kuo YY, Li Bo, Twaha Ssennoga. Comprehensive study on novel concentric cylindricalthermoelectric power generation system. Appl Therm Eng 2016;117:501–10.
Ishaque K, Salam Z, Lauss G. The performance of perturb and observe and incrementalconductance maximum power point tracking method under dynamic weather conditions.Appl Energy 2014;119:228–36.
Leblanc S. Sustainable materials and technologies thermoelectric generators : linking materialproperties and systems engineering for waste heat recovery applications. Sustain MaterTechnol 2014;1–2:26–35.
Li M. Thermoelectric-generator-based DC-DC conversion network for automotive applications.KTH Information and Communication Technology; 2011.
Liu X, Li C, Deng YD, Su CQ. An energy-harvesting system using thermoelectric powergeneration for automotive application. Int J Electr Power Energy Syst 2015;67:510–6.
Liu YH, Chiu YH, Huang JW,Wang SC. A novel maximum power point tracker for thermoelectricgeneration system. Renew Energy 2016a;97:306–18.
Liu YH, Chiu YH, Huang JW, Wang SC, Manikandan S, Kaushik SC, et al. Thermodynamic studiesand maximum power point tracking in thermoelectric generator-thermoelectric coolercombined system. Energy Convers Manag 2016b;97(13):682–92.
Lv S, He W, Wang L, Li G, Ji J, Chen H, et al. Design, fabrication and feasibility analysis of athermo-electric wearable helmet. Appl Therm Eng 2016;109:138–46.
Mal R, Prasad R, Vijay VK. Multi-functionality clean biomass cookstove for off-grid areas. ProcessSaf Environ Prot 2016;104:85–94.
Mikkenie R, Steigelmann O, Groen WA, Ten Elshof JE. A quick method to determine thecapacitance characteristics of thin layer X5R multilayer capacitors. J Eur Ceram Soc 2012;32(1):167–73.
Molina MG, Juanicó LE, Rinalde GF, Taglialavore E, Gortari S. Design of improved controller forthermoelectric generator used in distributed generation. Int J Hydrogen Energy 2010;35(11):5968–73.
MolinaMG, Juanicó LE, Rinalde GF. Design of innovative power conditioning system for the gridintegration of thermoelectric generators. Int J Hydrogen Energy 2012;37(13):10057–63.
Najjar YSH, Kseibi MM. Heat transfer and performance analysis of thermoelectric stoves. ApplTherm Eng 2016;102:1045–58.
Najjar YSH, Kseibi MM. Thermoelectric stoves for poor deprived regions – a review. RenewSustain Energy Rev 2017;80(January 2016):597–602.
Niu Z, Yu S, Diao H, Li Q, Jiao K, Du Q, et al. Elucidating modeling aspects of thermoelectricgenerator. Int J Heat Mass Transf 2015;85:12–32.
Noori M, Gardner S, Tatari O. Electric vehicle cost, emissions, and water footprint in the UnitedStates: development of a regional optimization model. Energy 2015;89:610–25.
Paraskevas A, Koutroulis E. A simple maximum power point tracker for thermoelectricgenerators. Energy Convers Manag 2016;108:355–65.
Ramli MAM, Twaha S, Ishaque K, Al-Turki YA. A review on maximum power point tracking forphotovoltaic systems with and without shading conditions. Renew Sustain Energy Rev2016;67:144–59.
Seetawan T, Singsoog K, Srichai S. Thermoelectric energy conversion of p-Ca3Co4O9/n-CaMnO3 module. The 6th international conference on applied energy – ICAE2014,vol. 0. ; 2014. p. 2–5.
Twaha S, Ramli MAM, Murphy PM, Mukhtiar MU, Nsamba HK. Renewable based distributedgeneration in Uganda: resource potential and status of exploitation. Renew Sustain EnergyRev 2016a;57:786–98.
Twaha S, Zhu J, Yan Y, Li B. A comprehensive review of thermoelectric technology: materials,applications, modelling and performance improvement. Renew Sustain Energy Rev2016b;65:698–726.
Twaha S, Zhu J, Yan Y, Li B. A comprehensive review of thermoelectric technology: materials,applications, modelling and performance improvement. Renew Sustain Energy Rev2016c;65.
Twaha S, Zhu J, Yan Y. Power conditioning of thermoelectric generated power using dc-dc con-verters: A case study of a boost converter. International heat transfer symposium 2016;2016d.
Twaha S, Zhu J, Yan Y, Li B, Huang K. Performance analysis of thermoelectric generator usingdc-dc converter with incremental conductance based maximum power point tracking.Energy Sustain. Dev. 2017;37:86–98.
Uddin K, Moore AD, Barai A, Marco J. The effects of high frequency current ripple on electricvehicle battery performance. Appl Energy 2016;178:142–54.
Yap YZ, Naayagi RT, Woo WL. Thermoelectric energy harvesting for mobile phone chargingapplication. IEEE Reg. 10 Annu. Int. Conf. Proceedings/TENCON; 2017. p. 3241–5.
Yu C, Chau KT. Thermoelectric automotive waste heat energy recovery using maximum powerpoint tracking. Energy Convers Manag 2009;50(6):1506–12.
Yu S, Du Q, Diao H, Shu G, Jiao K. Start-up modes of thermoelectric generator based on vehicleexhaust waste heat recovery. Appl Energy 2015;138:276–90.
Yusop AM,Mohamed R, Mohamed A. Inverse dynamic analysis type of MPPT control strategy ina thermoelectric-solar hybrid energy harvesting system. Renew Energy 2016;86:682–92.
Zheng XF, Liu CX, Yan YY, Wang Q. A review of thermoelectrics research - recent developmentsand potentials for sustainable and renewable energy applications. Renew Sustain EnergyRev 2014;32:486–503.


![Vol. 2, Issue 9, September 2013 DESIGN OF DC-DC BOOST ... · DESIGN OF DC-DC BOOST CONVERTER WITH THERMOELECTRIC POWER SOURCE ... [2-4].In this research, DC-DC boost converter is](https://img.pdfslide.net/doc/110x75/5aec36db7f8b9ae5318ea3af/vol-2-issue-9-september-2013-design-of-dc-dc-boost-of-dc-dc-boost-converter.jpg)