Embed Size (px)
Citation preview

Parametric Studies of Square Solar Sails Using Finite Element Analysis
David W. Sleight* and Danniella M. Muheim† NASA Langley Research Center, Hampton, VA 23681-2199, U.S.A.
Parametric studies are performed on two generic square solar sail designs to identify parameters of interest. The studies are performed on systems-level models of full-scale solar sails, and include geometric nonlinearity and inertia relief, and use a Newton-Raphson scheme to apply sail pre-tensioning and solar pressure. Computational strategies and difficulties encountered during the analyses are also addressed. The purpose of this paper is not to compare the benefits of one sail design over the other. Instead, the results of the parametric studies may be used to identify general response trends, and areas of potential nonlinear structural interactions for future studies. The effects of sail size, sail membrane pre-stress, sail membrane thickness, and boom stiffness on the sail membrane and boom deformations, boom loads, and vibration frequencies are studied. Over the range of parameters studied, the maximum sail deflection and boom deformations are a nonlinear function of the sail properties. In general, the vibration frequencies and modes are closely spaced. For some vibration mode shapes, local deformation patterns that dominate the response are identified. These localized patterns are attributed to the presence of negative stresses in the sail membrane that are artifacts of the assumption of ignoring the effects of wrinkling in the modeling process, and are not believed to be physically meaningful. Over the range of parameters studied, several regions of potential nonlinear modal interaction are identified.
I. Introduction Solar sail concepts are of interest for future space exploration missions1. Solar sails span very large areas to
capture and reflect photons from the Sun and are propelled through space by momentum gained from the photons2,3,4. (See Fig. 1). Because solar sails utilize a cost effective source of propellantless propulsion, they offer potential advantages over traditional, chemical propulsion spacecraft. A square solar sail will be used by the Team Encounter mission5, and is proposed for the National Oceanic and Atmospheric Administration Geostorm Warning mission4,6,7. The Team Encounter solar sail is 76 m per edge, while the Geostorm sail will be 70 m per edge. Future solar sail missions include inner and outer planetary and interstellar missions with sails up to 1,000 m per edge2. The world’s largest thermal vacuum chamber is located at the NASA Glenn Research Center, Plum Brook Station, and is 100 ft. in diameter and 122 ft. high. Clearly, this facility is not large enough to perform ground tests on full-scaled solar sails. In addition, the influence of gravity makes full-scale structural response measurements via ground tests difficult and unrepresentative of the space environment. Therefore, computational methods, models and tools to predict solar sail structural response must be developed, validated, and verified by both test-analysis correlation with sub-scale models and systems-level studies.
Solar sails with ultra-thin membranes and long slender booms present analysis challenges because of their extreme dimensions and geometrically nonlinear behavior. An earlier assessment of a square solar sail using finite element analysis (FEA) with beam, bar and membrane elements was recently published8. Other efforts to predict solar sail structural response include design and closed-formed analytical studies7,9 of solar sails up to 400 m per edge. Greschik and Mikulas9 evaluated several square solar sails
Figure 1: Solar sail.
American Institute of Aeronautics and Astronautics
1
* Aerospace Engineer, Analytical and Computational Methods Branch/Structures and Materials Competency, MS 240, AIAA Member. † Aerospace Engineer, Analytical and Computational Methods Branch/Structures and Materials Competency, MS 240, AIAA Senior Member.

with different sail-to-boom connection systems. Analytical studies using FEA have been performed by Murphy et al.10 for sail sizes up to 300 m per edge with membrane elements and by Taleghani et al.11 for component and system-level solar sails models up to 150 m per edge with shell elements. The work in Ref. 11 focused on methods and models by comparing the results from two commercial FEA programs.
The objectives of this paper are two-fold: to perform parametric studies on generic solar sail designs to identify parameters of interest for future research efforts and to perform system-level analyses of full-scale solar sails. When computational difficulties are encountered, the strategies used to mitigate them are also described. The work reported in Ref. 11 is extended to include parametric studies of system-level solar sail models using ABAQUS v6.4-112. The studies described in this paper may be used to identify the general trends in the structural responses associated with key parameters in the design of solar sails, and areas of potential nonlinear structural interactions for future studies.
II. Solar Sail Model Descriptions Two of the sail design concepts
studied in Ref. 9 will be more closely examined herein. One concept has four separate triangular sail regions attached to the booms by cables at five points as shown in Fig. 2a) and is referred to as the five-point connected sail. The other concept has four separate triangular sail regions attached to the booms by multiple cables along the length of the booms as shown in Fig. 2b) and is referred to as the multiple-point connected sail. The multiple cables approximate a continuously connected sail and boom configuration.
In this study, both solar sail design concepts are adapted from the 150 m per Common to both concepts are four 106 mconcentrated masses, and cables that connrepresenting a 0.58 kg tip plate is located ascience payload mass is located at the endlocated at the central spacecraft bus, which instrumentation, and thermal control devices
The 106 m booms are idealized as thin-baseline thickness of 7.5 µm. The control misotropic material properties in the finite frequency including the 228 kg science pamass at one end of a column with the othefundamental modes of the sail system basedbooms are idealized as a thin-walled tubKevlar™, and have a solid circular cross-sisotropic material properties similar to Kaeffective mass density of 1572 kg/m3 incluThe solar sail properties are included in Tab
Components Materia
Booms CompositCables Kevlar
Control mast IsotropicMembrane Kapton
American I
a) Five-point connected sail b) Multiple-point connected sail
Figure 2: Square solar sail design concepts9.
edge solar sail in Ref. 7, hereby referred to as the 150 m solar sail. booms, four triangular sail membrane regions, a 2 m control mast, ect the sail membrane quadrants to the boom. A concentrated mass t the end of each boom and a concentrated mass representing a 228 kg of the control mast. In addition, a concentrated mass of 54.84 kg is
includes mass contributions from control wheels, gimbals, fittings, parts, . walled tubes, each with a circular cross-section radius of 0.229 m and a
ast is idealized as a thin-walled tube with a circular cross-section and element model. The control mast is sized so that its lowest natural
yload mass is 0.5 Hz based on the closed-form frequency of a lumped r end fixed. The chosen control mast sizing avoids interaction with the on the previous study11. The cables connecting the sail membrane to the e with isotropic material properties with nominal stiffness similar to ection with a radius of 0.78 µm. The solar sail membrane is assigned pton™. The baseline thickness of the sail membrane is 2.50 µm. An des the additional mass of metallic coatings, and reinforcement seams. le 1.
Table 1: Baseline 150 m solar sail properties. l Radius
(m) Thickness
(m) Modulus (N/m2)
Poisson’s Ratio
Density (kg/m3)
e 0.229 7.5x10⁻⁶ 124×109 0.30 1908 0.0005 N/A 62×109 0.36 1440
0.01705 0.005 124×109 0.30 7660 N/A 2.50×10⁻⁶ 2.48×10⁹ 0.34 1572
nstitute of Aeronautics and Astronautics
2
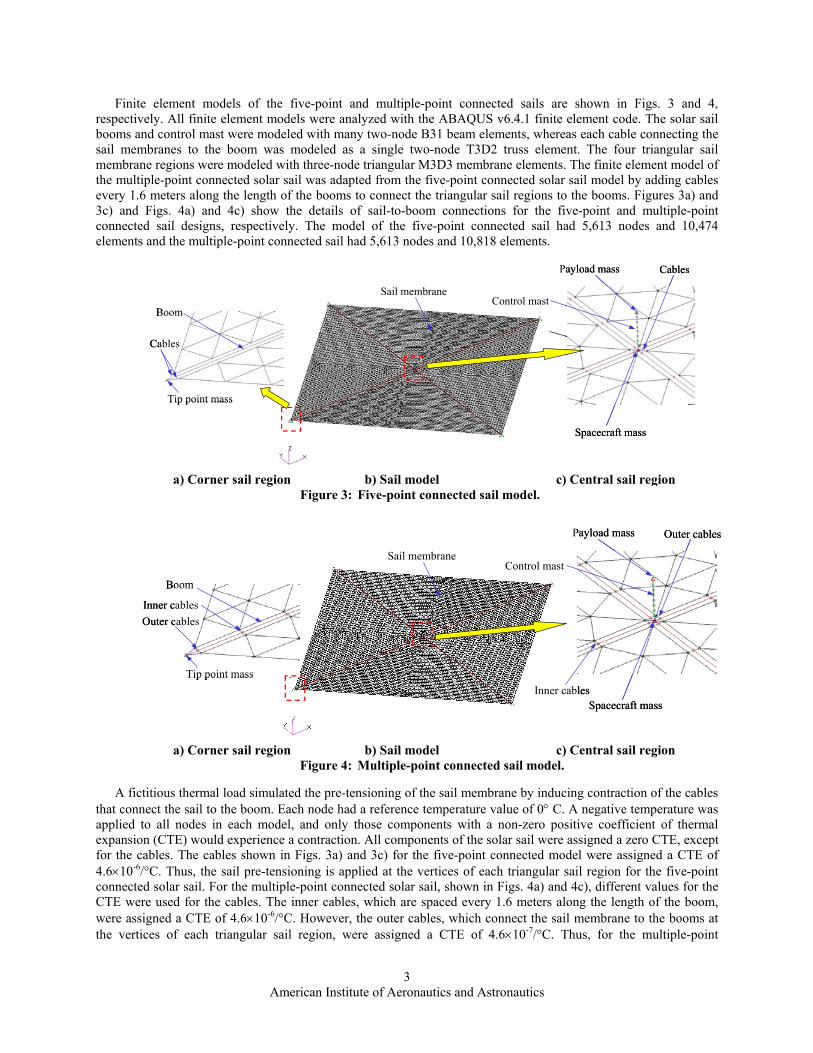
Finite element models of the five-point and multiple-point connected sails are shown in Figs. 3 and 4, respectively. All finite element models were analyzed with the ABAQUS v6.4.1 finite element code. The solar sail booms and control mast were modeled with many two-node B31 beam elements, whereas each cable connecting the sail membranes to the boom was modeled as a single two-node T3D2 truss element. The four triangular sail membrane regions were modeled with three-node triangular M3D3 membrane elements. The finite element model of the multiple-point connected solar sail was adapted from the five-point connected solar sail model by adding cables every 1.6 meters along the length of the booms to connect the triangular sail regions to the booms. Figures 3a) and 3c) and Figs. 4a) and 4c) show the details of sail-to-boom connections for the five-point and multiple-point connected sail designs, respectively. The model of the five-point connected sail had 5,613 nodes and 10,474 elements and the multiple-point connected sail had 5,613 nodes and 10,818 elements.
A fithat conapplied expansifor the 4.6×10-
connectCTE wewere asthe vert
Sail membraneControl mast
Payload mass
Spacecraft mass
Cables
Tip point mass
Cables
Boom
Sail membraneControl mast
Payload mass
Spacecraft mass
Cables
Tip point mass
Cables
Boom
a) Corner sail region b) Sail model c) Central sail region
Figure 3: Five-point connected sail model.
Sail membraneControl mast
Payload mass
Spacecraft mass
Outer cables
Inner cables
Boom
Inner cablesOuter cables
Tip point mass
Sail membraneControl mast
Payload mass
Spacecraft mass
Outer cables
Inner cables
Boom
Inner cablesOuter cables
Tip point mass
a) Corner sail region b) Sail model c) Central sail region Figure 4: Multiple-point connected sail model.
ctitious thermal load simulated the pre-tensioning of the sail membrane by inducing contraction of the cables nect the sail to the boom. Each node had a reference temperature value of 0° C. A negative temperature was to all nodes in each model, and only those components with a non-zero positive coefficient of thermal
on (CTE) would experience a contraction. All components of the solar sail were assigned a zero CTE, except cables. The cables shown in Figs. 3a) and 3c) for the five-point connected model were assigned a CTE of 6/°C. Thus, the sail pre-tensioning is applied at the vertices of each triangular sail region for the five-point ed solar sail. For the multiple-point connected solar sail, shown in Figs. 4a) and 4c), different values for the re used for the cables. The inner cables, which are spaced every 1.6 meters along the length of the boom,
signed a CTE of 4.6×10⁻⁶/°C. However, the outer cables, which connect the sail membrane to the booms at ices of each triangular sail region, were assigned a CTE of 4.6×10⁻⁷/°C. Thus, for the multiple-point
American Institute of Aeronautics and Astronautics
3

connected design, the sail pre-tensioning is mainly applied on the sail edges parallel to the booms of each triangular sail region. Different pre-tensioning schemes were not explored.
Note that in Ref. 11, shell elements were used to model the sail, and beam elements were used to model both the booms and cables. However in the current study, models constructed with the three-node triangular S3 shell element and B31 beam elements experienced convergence problems during an analysis of the multiple-point connected solar sail. Attempts to achieve convergence by reducing the load step size and using the ABAQUS-specific stabilization feature were unsuccessful. Stabilization provides a mechanism for stabilizing unstable quasi-static problems through the addition of volume-proportional damping. This feature was used judiciously in the current study to achieve convergence when the standard quasi-static Newton-Raphson method failed. ABAQUS applies the volume-proportional damping to the model in the form of viscous forces added to the global equilibrium equations12. In order to achieve convergence in the nonlinear analyses, the shell elements were converted to membrane elements, and the beam elements modeling the cables were converted to truss elements upon the recommendation of ABAQUS Support. It was suggested that using the membrane and truss elements avoids element locking due to the extreme dimensions of the solar sails.
A. Mesh Convergence Study Prior to initiating the parametric studies, a mesh convergence study was performed on the five-point connected
150 m solar sail design with three finite element models of increasing mesh fidelity. The 150 m solar sail was chosen for the mesh convergence study because it was expected to have the largest boom tip and sail membrane deflections based on the sail sizes used in the parametric studies. The details of each finite element model are listed in Table 2.
The mesh convergence study focused on the maximum sail deflection and the vibration frequencies and mode shapes of a nonlinear equilibrium state including inertia relief. Inertia relief balances externally applied forces on a free-flying sail with inertial loads developed under steady-state rigid body acceleration. The reference point for the inertia relief was chosen to be at the center of mass of the solar sail, which was very close to the center of the solar sail. First, the sail membrane quadrants were pre-tensioned using a geometrically nonlinear analysis to 6,895 N/m2 (1 psi) at the center of each triangular sail membrane region as shown in Fig. 5 by applying a fictitious thermal load to contract the cables. The baseline solution controls for each nonlinear analysis were a Newton-Raphson scheme with automatic load incrementation with a minimum load increment of 1×10⁻⁶ times the applied loading and a maximum of 100 iterations per load increment. The pre-tension loads are induced by specifying a reduction in temperature from the reference state of the entire model as explained previously. To achieve a stress of 1.0 psi in the center of each triangular sail region, different temperature changes were specified for each model, and these changes are given in Table 2. The initial temperature step applied 5% of the total temperature change.
Table 2: Mesh convergence model summary. Model Elements Nodes DOF’s ∆Temperature (°C) CPU Time (s)
Model 1 2,682 1,529 9,194 -489.9 17.6 Model 2 10,474 5,613 33,678 -533.0 58.7 Model 3 20,758 10,917 65,502 -567.2 182.3
6,895 N/m2 (1 psi)Mises Stress, N/m2
+5.49E+05+1.00E+04+9.71E+03+9.41E+03+9.12E+03+8.82E+03+8.53E+03+8.24E+03+7.94E+03+7.65E+03+7.35E+03+7.06E+03+6.77E+03+6.47E+03
6,895 N/m2 (1 psi)Mises Stress, N/m2
+5.49E+05+1.00E+04+9.71E+03+9.41E+03+9.12E+03+8.82E+03+8.53E+03+8.24E+03+7.94E+03+7.65E+03+7.35E+03+7.06E+03+6.77E+03+6.47E+03
Figure 5: Mises stress distribution after applied pre-tension for five-point connected sail.
Next, a solar pressure load of 9.12×10⁻⁶ N/m2 was applied in the negative z-direction, normal to the pre-stressed sail membrane. This pressure value is representative of the anticipated solar flux at 1 astronomical unit (A.U.). Ten percent of the total pressure load was applied on the initial load step. In the final load case, the vibration frequencies and mode shapes about the nonlinear equilibrium state of the solar sail were computed using the default Lanczos eigensolver for Models 1 and 2. However, the Lanczos eigensolver with its default settings failed to extract the requested frequencies and vibration mode shapes for Model 3. A different eigensolver, the subspace iteration
American Institute of Aeronautics and Astronautics
4

method, proved successful in determining reasonable vibration frequencies and mode shapes for Model 3. The CPU times on a Pentium IV 2.66 GHz processor with 768 MB of RAM are included in Table 2 for each model.
The maximum sail deflection, which occurs at the center of the outer edge of each triangular sail region, and the first five non-rigid-body frequencies of the three models are listed in Table 3. The reported maximum deflections are relative deflections to the center of the solar sail, because the inertia relief analysis includes rigid body translations and rotations about the center node of the model. The differences between the maximum sail deflection and the first five non-rigid-body frequencies of Models 1 and 2 were less than 1.6%, while the differences between Models 2 and 3 were less than 0.6%. As Model 2 appears to be sufficiently accurate and relatively efficient in terms of CPU time, its mesh was used throughout the remainder of the studies. A mesh convergence study was not performed on the multiple-point connected sail.
B. Five-Point Connected SolaThe results from Model 2 o
below. A contour plot of the ouin Fig. 6. The maximum relativminimum principal stress distribgray represent negative stresses past and current literature. TherABAQUS user subroutine to sanalysis. Both methods predict method15 also employs an exteret al.16 include the prediction ofThe wrinkle deformations are inthe order of 10% of the shell thcontinue to be an active area ofpoint connected sail. The mode“drum” mode shape reported in
Model Maximum SaDeflection (m
Model 1 -0.768 Model 2 -0.777 Model 3 -0.779
Table 3: Mesh convergence results summary. il )
1st Frequency (Hz)
2nd Frequency (Hz)
3rd, 4th Frequency (Hz)
5th Frequency (Hz)
0.0104 0.0130 0.0162 0.0167 0.0104 0.0128 0.0160 0.0166 0.0104 0.0127 0.0159 0.0165
r Sail f the mesh convergence study for the five-point connected sail model are presented t-of-plane deflection superimposed on the deformed geometry (scaled 20×) is shown e sail deflection is at the center of the outer edge of each triangular sail region. The ution after the solar pressure load is applied is shown in Fig. 7. The regions in dark where sail wrinkling may occur. Sail-wrinkling research has been an area of focus in e are two schemes implemented in Refs. 13, 14, and 15 that are implemented in an electively adjust the material properties to eliminate negative stress regions in the the regions where wrinkles occur and their orientation; however, the tension field nal algorithm to determine the amplitudes of wrinkles. Additional efforts by Tessler wrinkled regions with their amplitudes and orientations using shell element models. duced through initial geometric imperfections in the mesh with peak amplitudes on ickness. The use of these schemes was beyond the scope of the current study but
study17. The first five non-rigid-body mode shapes are shown in Fig. 8 for the five- shapes were all sail-membrane dominated. The lowest mode shape resembles the Ref. 10.
Maximum sailmembrane deflection
Out-of-planedeflection, m
20×U
+0.11+0.05-0.02-0.08-0.15-0.21-0.28-0.34-0.41-0.47-0.54-0.60-0.67
Maximum sailmembrane deflection
Out-of-planedeflection, m
20×U
+0.11+0.05-0.02-0.08-0.15-0.21-0.28-0.34-0.41-0.47-0.54-0.60-0.67
+0.11+0.05-0.02-0.08-0.15-0.21-0.28-0.34-0.41-0.47-0.54-0.60-0.67
Figure 6: Out-of-plane deflection of five-pointconnected sail.
American Institute of Aerona
5
Region of negative stress
Minimum principalstress, N/m2
+1.23E+05+1.12E+05+1.02E+05+9.19E+04+8.17E+04+7.15E+04+6.13E+04+5.11E+04+4.09E+04+3.06E+04+2.04E+04+1.02E+04+0.00E+00-8.55E+04
Region of negative stress
Minimum principalstress, N/m2
+1.23E+05+1.12E+05+1.02E+05+9.19E+04+8.17E+04+7.15E+04+6.13E+04+5.11E+04+4.09E+04+3.06E+04+2.04E+04+1.02E+04+0.00E+00-8.55E+04
+1.23E+05+1.12E+05+1.02E+05+9.19E+04+8.17E+04+7.15E+04+6.13E+04+5.11E+04+4.09E+04+3.06E+04+2.04E+04+1.02E+04+0.00E+00-8.55E+04
Figure 7: Minimum principal stress distribution offive-point connected sail.
utics and Astronautics

C. Multiple-Point C
The multiple-poanalyzed with the sapoint connected sailwas achieved when tto *STATIC, STABpressure load step. 2.66 GHz processorthe sail membrane qua geometrically nonpsi) at the center oregion as shown inthermal load to cdistribution after thesail membrane is distribution is diffeconnected sail becaudifferent pre-tensionbeyond the scope ofthe deformed geomeedge of each triangulthe same region in thload is applied is sho
a) Mode 1 at 0.0105 Hz b) Mode 2 at 0.0127 Hz
d) Mode 4 at 0.0158 Hz e) Mode 5 at 0.0165 Hz
c) Mode 3 at 0.0158 HzOut-of-planeDeformation
+1.00+0.83+0.67+0.50+0.33+0.17+0.00-0.16-0.33-0.50-0.67-1.00
a) Mode 1 at 0.0105 Hz b) Mode 2 at 0.0127 Hz
d) Mode 4 at 0.0158 Hz e) Mode 5 at 0.0165 Hz
c) Mode 3 at 0.0158 HzOut-of-planeDeformation
+1.00+0.83+0.67+0.50+0.33+0.17+0.00-0.16-0.33-0.50-0.67-1.00
Figure 8: First five non-rigid-body mode shapes of five-pointconnected sail.
onnected Solar Sail int connected sail model was me loading procedure as the five- model, except that convergence he stabilization parameter was set ILIZE=2×10⁻⁴ during the solar
The CPU time on a Pentium IV was 1493.4 CPU seconds. First, adrants were pre-tensioned using
linear analysis to 6,895 N/m2 (1 f each triangular sail membrane Fig. 9 by applying a fictitious ontract the cables. The stress pre-tension load is applied to the shown in Fig. 9. The stress
rent than that of the five-point se the pre-tensioning was mainly applied on the sail edges parallel to the booms. A study of ing schemes and their effect on the stress distribution over the sail membrane was considered the current study. A contour plot of the out-of-plane deflection (scaled 20×) superimposed on try is shown in Fig. 10. The maximum sail deflection is again located at the center of the outer ar sail region. However, the center of the solar sail along the booms has a lower deflection than e five-point connected sail. The minimum principal stress distribution after the solar pressure
wn in Fig. 11.
Region of negative stressMinimum principal
stress, N/m2
+8.65E+04+7.93E+04+7.21E+04+6.49E+04+5.77E+04+5.05E+04+4.32E+04+3.60E+04+2.88E+04+2.16E+04+1.44E+04+7.21E+03+0.00E+00-4.90E+05
Region of negative stressMinimum principal
stress, N/m2
+8.65E+04+7.93E+04+7.21E+04+6.49E+04+5.77E+04+5.05E+04+4.32E+04+3.60E+04+2.88E+04+2.16E+04+1.44E+04+7.21E+03+0.00E+00-4.90E+05
+8.65E+04+7.93E+04+7.21E+04+6.49E+04+5.77E+04+5.05E+04+4.32E+04+3.60E+04+2.88E+04+2.16E+04+1.44E+04+7.21E+03+0.00E+00-4.90E+05
Figure 11: Minimum principal stress distribution of multiple-point connected sail.
Maximum sailmembrane deflection
Out-of-planeDeflection, m
20×U
+0.11+0.05-0.02-0.08-0.15-0.21-0.28-0.34-0.41-0.47-0.54-0.60-0.67
Maximum sailmembrane deflection
Out-of-planeDeflection, m
20×U
+0.11+0.05-0.02-0.08-0.15-0.21-0.28-0.34-0.41-0.47-0.54-0.60-0.67
+0.11+0.05-0.02-0.08-0.15-0.21-0.28-0.34-0.41-0.47-0.54-0.60-0.67
Figure 10: Out-of-plane deflection of multiple-point connected sail.
American Institute of Ae
Mises Stress, N/m2 6,895 N/m2 (1 psi)+5.32E+05+1.00E+04+9.59E+03+9.18E+03+8.77E+03+8.37E+03+7.96E+03+7.55E+03+7.14E+03+6.73E+03+6.32E+03+5.92E+03+5.51E+03+5.10E+03
Mises Stress, N/m2 6,895 N/m2 (1 psi)Mises Stress, N/m2 6,895 N/m2 (1 psi)+5.32E+05+1.00E+04+9.59E+03+9.18E+03+8.77E+03+8.37E+03+7.96E+03+7.55E+03+7.14E+03+6.73E+03+6.32E+03+5.92E+03+5.51E+03+5.10E+03
+5.32E+05+1.00E+04+9.59E+03+9.18E+03+8.77E+03+8.37E+03+7.96E+03+7.55E+03+7.14E+03+6.73E+03+6.32E+03+5.92E+03+5.51E+03+5.10E+03
Figure 9: Mises stress distribution after applied pre-tension for multiple-point connected sail.
ronautics and Astronautics
6

The sail membrane of the multiple-point connected sail has a different stress distribution than the five-point connected sail. The sail membrane of the multiple-point connected sail has a larger area with negative minimum principal stresses. This distribution may be attributed to the scheme by which the sail membrane was pre-tensioned. Other pre-tensioning schemes for the multiple-connected sail to reduce the regions of negative stress were not explored. The maximum sail deflection (relative to the center of the solar sail) and the first five non-rigid-body frequencies of the multiple-point connected sail are listed in Table 4. Again, the first five non-rigid-body mode shapes are sail-membrane dominated as shown in Fig. 12. The lowest mode shape is again the “drum” mode shape. However, local deformations appear in modes 2-5 in Figs. 12b)–12e), which are not believed to be physically meaningful. These local deformations are located in the same regions of the model that exhibited negative principal stresses in Fig. 11. Adler14 indicated that frequencies and mode shapes computed with membrane elements without considering sail membrane wrinkling could possess localized deformations that are artifacts of the negative minimum principal stresses in the sail membrane. Thus, only the first non-rigid-body frequency and corresponding mode shape are presented for the multiple-point connected models throughout the remainder of the studies described herein.
Table 4: Maximum sail deflection and frequencies of multiple-point connected model. Maximum Sail Deflection (m)
1st Frequency (Hz)
2nd Frequency (Hz)
3rd Frequency (Hz)
4th Frequency (Hz)
5th Frequency (Hz)
-0.633 0.0123 0.0140 0.0143 0.0190 0.0191
a) Mode 1 at 0.0123 Hz b) Mode 2 at 0.0140 Hz c) Mode 3 at 0.0143 Hz
d) Mode 4 at 0.0190 Hz e) Mode 5 at 0.0191 Hz
Out-of-planeDeformation
+1.00+0.83+0.67+0.50+0.33+0.17+0.00-0.16-0.33-0.50-0.67-1.00
Out-of-planeDeformation
+1.00+0.83+0.67+0.50+0.33+0.17+0.00-0.16-0.33-0.50-0.67-1.00
a) Mode 1 at 0.0123 Hz b) Mode 2 at 0.0140 Hz c) Mode 3 at 0.0143 Hz
d) Mode 4 at 0.0190 Hz e) Mode 5 at 0.0191 Hz
Out-of-planeDeformation
+1.00+0.83+0.67+0.50+0.33+0.17+0.00-0.16-0.33-0.50-0.67-1.00
Out-of-planeDeformation
+1.00+0.83+0.67+0.50+0.33+0.17+0.00-0.16-0.33-0.50-0.67-1.00
Figure 12: First five non-rigid-body mode shapes of multiple-pointconnected sail.
III. Solar Sail Parametric Studies Parametric studies on the two square solar sail design concepts will be used to investigate the effects of sail size,
sail membrane pre-stress, sail membrane thickness, and boom stiffness on the structural responses of the sail. Baseline parameters for the parametric studies are a 150 m solar sail with a 2.5 µm sail membrane thickness pre-tensioned to 6,895 N/m2 (1 psi) in the center of the sail membrane quadrant. The baseline thickness for the solar sail booms was 7.5 µm. All other properties and masses were assumed to be constant and were listed previously. Response quantities of interest include sail and boom deformations, boom compressive loads, and vibration frequencies.
A. Boom Stiffness Studies Parametric studies were performed on the 150 m five-point connected design where the boom thickness was
adjusted to affect a change in the boom stiffness for a constant diameter boom. The boom thickness was varied from 4.0 µm to 41.0 µm, while all other material properties and dimensions were held constant. The largest thickness is the same value as in Ref 11. A parametric study was not performed on the multiple-point connected solar sail design, but is planned for future work.
American Institute of Aeronautics and Astronautics
7

As the boom thickness was varied, the mass of the solar sail varied from 383.64 kg to 426.63 kg, and the effective bending stiffness, EI, also varied from 37.2×10³ to 382×103 N-m2. We can define a factor of safety as the buckling load for a fixed-free boundary condition normalized by the maximum load in the boom after the sail solar pressure is applied. For the thinnest, or least stiff, boom where the boom thickness is 4.0 µm, the factor of safety as defined above was 3.2. For the baseline boom thickness of 7.5 µm, the factor of safety was 15, and for the thickness boom with a thickness of 41.0 µm, the factor of safety was 83. The thickest boom was used in the Ref. 11 study and is anticipated to be too stiff to be of interest. However, additional load conditions and analyses are required to establish whether a given boom’s stiffness is sufficient to provide an acceptable safety margin.
A nonlinear analysis was performed including inertia relief, and the values selected for the boom thickness were 4.0, 4.5, 5.0, 6.0, 7.5, 10.0, 25.0 and 41.0 µm. The applied temperature change to pre-tension the sail was modified to achieve a 6,895 N/m2 stress in the center of each triangular sail region for each boom thickness value. A successful solution is achieved and frequencies and mode shapes are calculated with the ABAQUS solution inputs described in the Mesh Convergence Study section when the boom thickness is above 4.5 µm. When the boom thickness was 4.5 µm, however, the frequencies and mode shapes were not calculated with the Lanczos eigensolver until the maximum number of iterations was increased from its default value to 100 and a shift point of 0.0001 Hz2 was specified. The Lanczos solver required additional computational guidance and more time to distinguish amongst the rigid and non-rigid-body frequencies and mode shapes during an analysis including inertia relief. When the boundary conditions were changed from a free-flight to a fixed central node boundary condition, the frequencies and mode shapes were successfully generated with the default Lanczos eigensolver inputs. As the boom thickness was further reduced to 4.0 µm, the analysis exhibited convergence difficulties as the solar pressure load was applied using the solution controls listed in the Mesh Convergence Study. Convergence was achieved when the stabilization parameter was set to *STATIC, STABILIZE=1×10⁻⁸ during the solar pressure load step. The frequencies and mode shapes were successfully extracted using the modified Lanczos solutions controls listed above.
The results indicate that the boom thickness has a strong impact on the static response of the solar sail. The maximum sail and boom tip deflections are shown in Fig. 13 as a function of the boom thickness. Both the boom and sail deflections increase rapidly as the boom thickness is reduced below the baseline value of 7.5 µm. The boom compression loads after applying the sail pre-tensioning and solar pressure loads are shown in Fig. 14 as a function of the boom thickness. The plots indicate that the boom loads are smaller after the sail pre-tensioning than after the solar pressure load. As the boom thickness is decreased, the difference in the boom loads is reduced.
thfrthas
-1.6
-1.4
-1.2
-1.0
-0.8
-0.6
-0.4
-0.2
0.00 10 20 30 40 5
Boom thickness, µm
Max
imum
def
lect
ion,
m
0
Sail
Boom
-1.6
-1.4
-1.2
-1.0
-0.8
-0.6
-0.4
-0.2
0.00 10 20 30 40 5
Boom thickness, µm
Max
imum
def
lect
ion,
m
0
-1.6
-1.4
-1.2
-1.0
-0.8
-0.6
-0.4
-0.2
0.00 10 20 30 40 5
Boom thickness, µm
Max
imum
def
lect
ion,
m
0
Sail
Boom
Figure 13: Sail and boom tip deflections for boomthickness study.
Not surprisingly, the results also indicate that the boom stie solar sail. The first five non-rigid body frequencies are shequencies and mode shapes are identified by their order froickness of 7.5 µm shown in Fig. 8. Note that the third andsociated with the first four frequencies are invariant as
American Institute of Aerona
8
-4.5
-4.0
-3.5
-3.0
-2.5
-2.0
-1.5
-1.0
-0.5
0.00 10 20 30 40
Boom thickness, µm
Max
imum
boo
m c
ompr
essi
on lo
ad, N
50
After solar pressure load
After sail pre-tensioning
-4.5
-4.0
-3.5
-3.0
-2.5
-2.0
-1.5
-1.0
-0.5
0.00 10 20 30 40
Boom thickness, µm
Max
imum
boo
m c
ompr
essi
on lo
ad, N
50
After solar pressure load
After sail pre-tensioning
Figure 14: Boom compression load for boomthickness study.
ffness has a strong impact on the dynamic response of own in Fig. 15 as a function of boom thickness. The m the analysis of the baseline solar sail model with a fourth frequencies are coincident. The mode shapes
the boom thickness is varied from 4.0 to 41.0 µm.
utics and Astronautics

However, the fifth mode shape of the baseline solar sail model (See Fig. 8e)) is associated with higher frequencies as the boom thickness is varied. For example, this mode shape is associated with the seventh, eighth, and ninth frequencies for boom thicknesses of 10.0, 41.0, and 25.0 µm, respectively. Three regions are seen in the figure where the frequencies coalesce or nearly coalesce: at boom thicknesses below 5.0 µm, at 10.0 µm, and at 41.0 µm. Regions where frequencies coalesce and where modes may also cross or veer are of interest dynamically since the 1:1 frequency relationship can enable nonlinear coupling of the underlying vibration modes in the presence of disturbances. Note that other commensurate frequency relationships, e.g. 1:2, can also enable modal coupling. Mode crossing is observed as the fifth vibration frequency (and corresponding mode shape) crosses the third/fourth frequency (and mode shape) as the boom thickness is decreased below 5.0 µm. Mode veering also is observed as the second frequency (and mode shape) veers from a near 1:1 relationship with the first frequency at 10.0 µm to a near 1:1 relationship with the third/fourth frequency (and mode shape) at 41.0 µm. Also note that the region of mode crossing below a boom thickness of 5.0 µm is where the solution controls required adjustments to obtain solutions, which is indicative of the computational challenges manifested by the solar sail geometric parameters. A study of the dynamic response of the solar sail designs to investigate modal coupling in the presence of disturbances was beyond the scope of the current work.
0.000
0.004
0.008
0.012
0.016
0.020
0 10 20 30 40
Boom thickness, µm
Sail
freq
uenc
ies,
Hz
1st2nd
5th 3rd, 4th
0.000
0.004
0.008
0.012
0.016
0.020
0 10 20 30 40
Boom thickness, µm
Sail
freq
uenc
ies,
Hz
1st1st2nd2nd
5th5th 3rd, 4th3rd, 4th
Figure 15: Sail frequencies for boom thicknessstudy.
B. Sail Size Studies Parametric studies were performed on both square solar sail designs by scaling the in-plane dimensions of the
150 m finite element models to achieve sail sizes from 20 to 150 m per edge. The length of the control mast was kept constant at 2 m in length for all analyses, as were all material properties and concentrated masses, including the spacecraft and payload masses. As the sail size was reduced, the mass of the solar sail also decreased. The mass of the solar sails varied from 295 kg for the 20 m solar sail to 388 kg for the 150 m solar sail.
Nonlinear analyses were performed using inertia relief for both sail designs for sail sizes of 20, 40, 70, 100, 125, and 150 m per edge. The applied temperature change to the cables for pre-tensioning the sail was modified to achieve a 6,895 N/m2 stress level at the center of each triangular sail membrane region. The stabilization feature in ABAQUS was required to achieve convergence with the multiple-point connected models. Whenever the stabilize parameter was used, the smallest stabilization value that achieved convergence was specified. This value ranged from a minimum of 2×10⁻⁴ for the 125 and 150 m sails to a maximum of 3×10⁻⁴ for the 20, 40, 70, and 100 m sails.
-1.0-0.9-0.8-0.7-0.6-0.5-0.4-0.3-0.2-0.10.0
0 50 100Sail size, m
Def
lect
ion,
m
150
-1.0-0.9-0.8-0.7-0.6-0.5-0.4-0.3-0.2-0.10.0
0 50 100Sail size, m
Def
lect
ion,
m
150
Figure 16: Sail membrane and boom tipdeflections for sail size study.
The maximum sail and boom tip deflection are shown in Fig. 16 as a function of sail size. As the sail size is increased for each sail design, both the sail and boom tip deflections increase nonlinearly as expected. The analyses predicted that the sail and boom tip deflections for the five-point connected sail design (black curves in figure) are larger than the multiple connected sail design (red curves in figure). The maximum boom compressive loads for both sail designs also were computed (not shown) and the boom loads increased linearly as the sail size was increased. The boom compressive loads of the multiple-point connected solar sail were slightly lower than the five-point connected sail design.
American Institute of Aeronautics and Astronautics
9

The first five non-rigid-body frequencies are shown in Fig. 17 as a function of sail size for the five-point connected sail. The results indicate that the first four frequencies separate as the sail size is increased; however, they are closely spaced for all sail sizes. The frequencies decrease as the sail size is increased. The frequencies and mode shapes are identified by their order from the analysis of the baseline solar sail model of 150 m shown in Fig. 8. For all sail sizes, the third and fourth frequencies are coincident and the first four mode shapes are similar. However, the fifth mode shape of the baseline solar sail model (See Fig. 8e)) is associated with higher frequencies as the sail size is decreased. For example, this mode shape is associated with the seventh frequency of the 125 m sail and the ninth frequency for sail sizes of 100 m or less. Only the first vibration frequency and mode shape was determined for the multi-point connected solar sail as discussed previously. A comparison of the first non-rigid-body frequency for both sail designs is shown in Fig. 18. The results indicate that the first sail frequencies in both sail designs are very close to each other. The frequency of the five-point connected sail is slightly lower for sail sizes of 40 m and larger.
Sail size, m
Firs
t sai
l fre
quen
cy, H
z
0.00
0.01
0.02
0.03
0.04
0.05
0.06
0.07
0.08
0.09
0 50 100 150
Sail size, m
Firs
t sai
l fre
quen
cy, H
z
Sail size, m
Firs
t sai
l fre
quen
cy, H
z
0.00
0.01
0.02
0.03
0.04
0.05
0.06
0.07
0.08
0.09
0 50 100 1500.00
0.01
0.02
0.03
0.04
0.05
0.06
0.07
0.08
0.09
0 50 100 150
Figure 18: Comparison of first sail frequency of both sail designs for sail size study.
0.00
0.02
0.04
0.06
0.08
0.10
0.12
0.14
0 50 100 150Sail size, m
Sail
freq
uenc
ies,
Hz
5th
3rd, 4th
2nd1st
0.00
0.02
0.04
0.06
0.08
0.10
0.12
0.14
0 50 100 150Sail size, m
Sail
freq
uenc
ies,
Hz
5th
3rd, 4th
2nd1st
Figure 17: Frequencies of five-point connectedsail for sail size study.
C. Sail Membrane Thickness Studies Parametric studies were performed on both solar sail
designs by varying the sail membrane thickness from 0.5 to 10 µm. All other properties, dimensions, and masses were kept constant. As the sail membrane thickness is increased, the mass of the solar sail also increased, ranging from 318 kg for a sail membrane thickness of 0.5 µm to 648 kg for a sail membrane thickness of 10 µm.
Again, the applied temperature to the cables for pre-tensioning the sail had to be modified for each analysis to obtain the 6,895 N/m2 stress level in the center of each triangular sail membrane region. The stabilization feature in ABAQUS was used to achieve convergence for the multiple-point connected models. This value ranged from a minimum value of 2×10⁻⁴ for the 2.5 µm sail membrane thickness model to a maximum value of 8×10⁻⁴ for the 0.5 µm sail membrane thickness model.
The maximum sail and boom tip deflection is shown in Fig. 19 as a function of sail membrane thickness. Again, the analyses predicted that the sail and boom tip deflections were larger in the five-point connected sail
American Institute of Aeronautics and Astronautics
10
-1.4
-1.2
-1.0
-0.8
-0.6
-0.4
-0.2
0.00 2 4 6 8 10
Sail membrane thickness, µm
Def
lect
ion,
m
-1.4
-1.2
-1.0
-0.8
-0.6
-0.4
-0.2
0.00 2 4 6 8 10
Sail membrane thickness, µm
Def
lect
ion,
m
Figure 19: Sail membrane and boom tipdeflections for sail membrane thickness study.

design. However, in the five-point connected sail design, the sail and boom tip deflections initially decrease as the sail membrane thickness is increased, but then increase as the sail membrane thickness is increased from 7.5 to 10 µm. This behavior may be attributable to inertia relief. As the sail membrane thickness is increased, the mass of the solar sail also increases, and therefore a larger acceleration load is balanced at the inertia relief reference point.
The maximum boom compressive loads for both sail designs also were computed, and the boom loads increased linearly as the sail sizes increased. The boom compressive loads of the multiple-point connected solar sail were slightly lower than the five-point connected design.
The first five non-rigid-body frequencies are shown in Fig. 20 as a function of sail size for the five-point connected sail design. The results indicate that the frequencies decrease as the sail size is increased. For all sail membrane thicknesses, the third and fourth vibration frequencies are repeated. The frequencies and mode shapes are identified by their order from the analysis of the baseline solar sail model with a sail membrane thickness of 2.5 µm shown in Fig 8. For membrane thicknesses above 2.5 µm, the fifth frequency crosses the third and fourth mode frequencies. Again, the second vibration frequency veers from being near the first frequency to the fifth frequency as the thickness is varied from 1 µm to 10 µm. Again, only the first vibration frequency and mode shape were reported for the multiple-point connected design.
A comparison of the first non-rigid-body frequency for both sail designs is shown in Fig. 21. The results indicate that the first sail frequency is lower for the five-point connected sail design. However, as the sail membrane thickness is increased, the first sail frequencies of the two designs approach each other.
0.000
0.005
0.010
0.015
0.020
0.025
0.030
0.035
0 2 4 6 8 10
Sail membrane thickness, µm
Sail
freq
uenc
ies,
Hz
3rd,4th
1st
2nd
5th
0.000
0.005
0.010
0.015
0.020
0.025
0.030
0.035
0 2 4 6 8 10
Sail membrane thickness, µm
Sail
freq
uenc
ies,
Hz
3rd,4th3rd,4th
1st1st
2nd2nd
5th5th
Figure 20: Frequencies of five-point connected sail for sail membrane thickness study.
0.000
0.005
0.010
0.015
0.020
0.025
0 2 4 6 8 10Sail membrane thickness, µm
Firs
t sai
l fre
quen
cy, H
z
0.000
0.005
0.010
0.015
0.020
0.025
0 2 4 6 8 100.000
0.005
0.010
0.015
0.020
0.025
0 2 4 6 8 10Sail membrane thickness, µm
Firs
t sai
l fre
quen
cy, H
z
Sail membrane thickness, µm
Firs
t sai
l fre
quen
cy, H
z
Figure 21: Comparison of first sail frequency of both sail designs for sail membrane thickness study.
D. Sail Membrane Pre-stress Studies Parametric studies were performed on the 150 m five-point connected design where the sail pre-stress level at the
center of each triangular sail membrane was varied from 0.1 to 5 psi. All other properties, dimensions, and masses were kept constant. A parametric study was not performed on the multiple-point connected solar sail design, but is planned for future work.
A nonlinear analysis was performed including inertia relief as the sail membrane was pre-stressed to values of 0.1, 1, 2, 3, and 5 psi. The temperatures applied to the cables were modified to achieve the desired pre-stress level at the center of each triangular sail membrane. The maximum number of iterations for the Lanczos eigensolver was increased from a default value of 20 to 100, and a shift point of 0.0001 Hz2 was specified for all pre-stress levels other than 1 psi. These solution parameters were specified a priori based on lessons learned during the boom thickness study. No other adjustments in the solution control parameters were made.
The results indicate that the sail pre-stress level has a strong impact on the response of the solar sail. The maximum sail and boom tip deflections are shown in Fig. 22 as a function of the pre-stress level. The sail deflections indicate an inflection point as the pre-stress level increases from 1 to 3 psi, while the boom deflections continue to increase and approach the sail deflection as the pre-stress reaches 5 psi. The boom compression levels increased linearly as the pre-stress levels increased (not shown). The first five non-rigid-body frequencies are shown
American Institute of Aeronautics and Astronautics
11

in Fig. 23 as a function of the sail pre-stress level. The frequencies and mode shapes are identified by their order from the analysis of the baseline solar sail model pre-stressed to 1 psi shown in Fig. 8. At a pre-stress of 1.0 psi, the third and fourth frequencies are repeated. As the pre-stress level is increased to 5 psi, the third and fourth vibration frequencies cross the fifth vibration frequency, and the second frequency value begins to veer toward the value of the third and fourth frequencies. For membrane pre-stress levels above 1.0 psi, the fifth frequency crosses the third and fourth frequencies. The first five mode shapes are similar for all pre-stress levels studied.
IV. ConcludParametric studies using high fidelity computationa
system-level solar sail design concepts. Computational diand strategies to mitigate them also were identified. The stthe ABAQUS finite element software to achieve convereigensolver inputs to determine the vibration frequencinonlinearity and inertia relief to simulate a free-flying satensioning and solar pressure. The purpose of this paper wother. Instead, the parametric studies described in this passociated with key parameters in the design of solar sailsfuture studies.
Parametric studies were performed on two solar sail membrane pre-stress, sail membrane thickness, and boomboom compressive load, and vibration frequencies and triangular sails attached to the booms by cables at five attached to the booms by cables at multiple attachment parameters studied, all parameters were shown to have a stip deflections. It was found that the multiple-point concomparison to the five-point connected sail for a given debody vibration frequencies and modes were closely spacmode veering as well as repeated or nearly coincident mophenomena indicated regions of potential nonlinear modfrequency and mode shape were presented for the multipllowest frequency, local deformation patterns that dominawere attributed to the presence of negative stresses in thignoring the effects of wrinkling in the modeling process,
American Institute of Aer1
0.000
0.005
0.010
0.015
0.020
0.025
0.030
0 1 2 3 4 5 6
Sail pre-stress, psi
Sail
freq
uenc
ies,
Hz
1st
2nd
5th
3rd, 4th
0.000
0.005
0.010
0.015
0.020
0.025
0.030
0 1 2 3 4 5 6
Sail pre-stress, psi
Sail
freq
uenc
ies,
Hz
1st1st
2nd2nd
5th5th
3rd, 4th3rd, 4th
Figure 23: Sail frequencies for sail pre-stressstudy.
Sail
Boom
-1.2
-1.0
-0.8
-0.6
-0.4
-0.2
0.00 1 2 3 4 5 6
Sail pre-stress, psi
Def
lect
ion,
m
Sail
Boom
-1.2
-1.0
-0.8
-0.6
-0.4
-0.2
0.00 1 2 3 4 5 6
Sail pre-stress, psi
Def
lect
ion,
m
Figure 22: Sail and boom tip deflections for sailpre-stress study.
ing Remarks l methods and models were performed on two generic fficulties encountered during the analyses were identified rategies included the use of the stabilization feature within gence in the nonlinear analyses and the use of modified es and mode shapes. The analyses included geometric il, and used a Newton-Raphson scheme to apply sail pre-as not to compare the benefits of one sail design over the
aper may be used to identify the general response trends , and areas of potential nonlinear structural interactions for
design concepts to investigate the effects of sail size, sail stiffness on the sail membrane and boom deformations, mode shapes. One solar sail concept had four separate points, while the other had four separate triangular sails points along the length of the booms. Over the range of ignificant nonlinear effect on the sail membrane and boom nected sail had smaller sail and boom deformations in sign. For both solar sail concepts, the first five non-rigid-ed and below 0.15 Hz. Regions of mode crossing and/or de shapes were identified for nearly all parameters. These al interaction. Only the lowest non-rigid-body vibration e-point connected sail design. For mode shapes above the te the response were identified. These localized patterns e sail membrane that were artifacts of the assumption of and were not believed to be physically meaningful.
onautics and Astronautics
2

Acknowledgments The authors acknowledge contributions to this paper in the area of modal coupling made by Dr. Suzanne Weaver
Smith of the Department of Mechanical Engineering, University of Kentucky.
References
1Salama, M., McInnes, C. R., and Mulligan, P., “Gossamer Spacecraft Technology,” Gossamer Spacecraft: Membrane and Inflatable Structures Technology for Space Applications, Edited by C.H.M. Jenkins, Progress in Astronautics and Aeronautics, Vol. 191, AIAA, Reston, VA, 2001.
2Wright, J., Space Sailing, Taylor and Francis Publishers, 1992. 3McInnes, C. R., Solar Sailing: Technology, Dynamics, and Mission Applications, Springer-Praxis Series in Space Science
and Technology, 1999. 4Chmielewski, A. B., “Advanced Concepts,” Gossamer Spacecraft: Membrane and Inflatable Structures Technology for
Space Applications, Edited by C.H.M. Jenkins, Progress in Astronautics and Aeronautics, Vol. 191, AIAA, Reston, VA, 2001. 5Internet reference: http://www.teamencounter.com [cited 12 March 2004]. 6Internet reference: http://solarsails.jpl.nasa.gov [cited 12 March 2004]. 7West, J. L. and Derbes, B., “Solar Sail Vehicle System Design for the Geostorm Warning Mission,” 41st AIAA structures,
Structural Dynamics and Materials Conference and Adaptive Structures Forum, AIAA-2000-5326, 2000. 8Genta, G., Brusa, E., C. Delprete, “Second approximation structural assessment of the Aurora solar sail spacecraft,” Acta
Astronautica, 54, pp. 115-125, 2003. 9Greschik, G. and Mikulas, M. M., “Design Study of a Square Solar Sail Architecture,” 42nd AIAA/ ASME/ASCE/AHS/ASC
Structures, Structural Dynamics, and Materials Conference and Exhibit, Seattle, WA, AIAA-2001-1259, 2001. 10Murphy, D. M., Murphey, T. W., and Gierow, P. A., “Scalable Solar Sail Subsystem Design Considerations,” 43rd
AIAA/ASME/ASCE/AHS/ASC Structures, Structural Dynamics, and Materials Conference and Exhibit, Denver, CO, AIAA-2002-1703, 2002.
11 Taleghani, B. K., Sleight, D. W., Muheim, D. M., Belvin, W. K., and Wang, J. T., “Assessment of Analysis Approaches for Solar Sail Structural Response,” 39th AIAA/ASME/SAE/ASEE Joint Propulsion Conference and Exhibit, Huntsville, AL, AIAA-2003-4796, 2003.
12ABAQUS/Standard User's Manual, Version 6.4.1, Hibbitt, Karlsson, and Sorensen, Inc., Pawtucket, RI, 2003. 13Adler, A. L., Mikulas, M. M., and Hedgepeth, J. M, “Static and Dynamic Analysis of Partially Wrinkled Membrane
Structures,” 41st AIAA/ASME/ASCE/AHS/ASC Structures, Structures Dynamics, and Material Conference, Atlanta, GA, AIAA-2000-1810, 2000.
14Adler, A. L., “Finite Element Approaches for Static and Dynamic Analysis of Partially Wrinkled Membrane Structures,” Ph.D. Dissertation, Aerospace Engineering Department, University of Colorado, Boulder, CO, December 2000.
15Liu, X., Jenkins, C.H., and Schur, W.W., “Fine Scale Analysis of Wrinkled Membranes,” International Journal of. Computational Engineering Science, Vol. 1, No. 2, pp. 281-298, 2000.
16Tessler, A., Sleight, D. W., and Wang, J. T., “Nonlinear Shell Modeling of Thin Membranes with Emphasis on Structural Wrinkling,” 44th AIAA/ASME/ASCE/AHS/ASC Structures, Structural Dynamics, and Materials Conference and Exhibit, Norfolk, VA, AIAA-2003-1931, 2003.
17Tessler, A., Sleight, D. W., “Toward Effective Shell Modeling Of Wrinkled Thin-Film Membranes Exhibiting Stress Concentrations,” 45th AIAA/ASME/ASCE/AHS/ASC Structures, Structural Dynamics, and Materials Conference and Exhibit, Palm Springs, CA, AIAA-2004-1739, 2004.
American Institute of Aeronautics and Astronautics
13