Embed Size (px)
Citation preview
Journal of Chemical Technology and Biotechnology J Chem Technol Biotechnol 81:636–647 (2006)DOI: 10.1002/jctb.1452
Parametric study of the factors influencingsimultaneous denitrification and enhancedbiological phosphorus removalAjay Patel, Alpesh Gohil and George Nakhla∗Department of Chemical and Biochemical Engineering, University of Western Ontario, London, Ontario, Canada N6A 5B9
Abstract: In this study, the effect of various factors such as C:N ratio, carbon source, percentage P contentin the sludge influencing the simultaneous denitrification and enhanced biological phosphorus removalwas investigated in batch tests on bean and tomato waste sludge from an upflow anaerobic sludgeblanket reactor–anoxic/aerobic system and municipal sludge from a circulating fluidized bed bioreactor.A correlation between the change in redox potential and rate of P release was developed. Interestingly,maximum P release was observed at positive redox potential in some of the batch tests. Simultaneousdenitrification and P release under anoxic conditions was observed during all the batch tests. Sludgeacclimatization improved the efficiency of the sludge and proved independency of maximum specificdenitrification rate and P content of sludges. The contribution of denitrifying PAOs to anoxic P uptakewas determined through the denitrification control test at an initial level of PO4-P of 100–120 mg dm−3. 2006 Society of Chemical Industry
Keywords: simultaneous denitrification and bio-P; redox potential; denitrifying PAOs; maximum specificdenitrification rate (SDNRmax)
INTRODUCTIONIt has been hypothesized from the literature1–5 that thephosphorus-accumulating organisms (PAOs) respon-sible for enhanced biological phosphorus removal(EBPR) can be divided into two groups: one group iscapable of utilizing only oxygen as an electron acceptor(PAOs) and the other is capable of utilizing both oxy-gen and nitrate as an electron acceptor (denitrifyingphosphorus-accumulating organisms, DPAOs). Theability of PAOs to denitrify is interesting because ofits potential benefits, i.e. savings of organic substrateand energy as well as reduction of sludge productionin biological nutrient removal processes.6–8
The effect of chemical oxygen demand (COD)NO3-N−1 ratio on simultaneous denitrification andP release has been studied9–10 and it was con-cluded that increasing initial nitrate concentrationdecreased net P release, whereas increasing initialsubstrate concentration increased net P release withsimultaneous denitrification. Conflicting reports con-cerning the fate of nitrate in EBPR systems existin the literature. Malnou et al.11 reported that Prelease was initiated only after complete denitrifica-tion (NO3-N < 1 mg dm−3), whereas Chuang et al.12
and Gerber et al.13,14 observed higher denitrificationactivity than P release under anoxic conditions withrespect to the sequestering of readily biodegradable
COD (RBCOD). Ng et al.15 reported that the exter-nal carbon source would benefit denitrification butnot dephosphatation. Some researchers11,16 reportedthat P release is directly dependent on the presenceof acetate and not necessarily anaerobic conditions,which only stimulate fermentation of substrates toacetate and other volatile fatty acids (VFAs).
Monitoring of pH and redox potential can beimplemented17 as a real-time control to enhance theperformance of biological phosphorus and nitrogenremoval processes. pH and redox potential can beused18 to identify the specific control points fordenitrification, anoxic P release and aerobic P uptake.However, it has been already found that maximumP release occurs with the drop in redox potential(−ve) during anoxic conditions and aerobic P uptakeoccurs at increased redox potential3 (+ve) value withthe addition of air; the effect of changes in redoxpotential on anoxic P release has not been quantifiedin the literature. It is also concluded from theliterature that EBPR rates have been predominantlyinvestigated at different C:N ratios for anoxic Prelease and aerobic/anoxic P uptake on sludges fromthe same source, albeit with the monitoring ofpH and redox potential in very few experiments.Furthermore, the impact of P content of sludges andtheir source has not been thoroughly researched in
∗ Correspondence to: George Nakhla, Department of Chemical and Biochemical Engineering, University of Western Ontario, London,Ontario, Canada N6A 5B9E-mail: [email protected](Received 09 June 2005; revised version received 14 August 2005; accepted 09 September 2005)Published online 10 January 2006
2006 Society of Chemical Industry. J Chem Technol Biotechnol 0268–2575/2006/$30.00 636
Simultaneous denitrification and enhanced biological phosphorus removal
the literature. Thus, the primary focus of this paperis on assessing the impact of different parameters,including C:N, percentage P content and sludgesource on simultaneous denitrification and EBPR.Additionally, the paper establishes a mathematicalcorrelation between P release and redox potential.
MATERIALS AND METHODSOrigin of different sludgesThree different sludges from the treatment of bean,tomato and municipal wastewaters were experimentedwith in this study. The bean and tomato sludges werecollected from a bench-scale upflow anaerobic sludgeblanket reactor–anoxic/aerobic (UASB-A/O) systemtreating high-strength bean and tomato-processingwastewater and the municipal sludge was collectedfrom a bench-scale circulating fluidized bed bioreactor(CFBBR) treating grit chamber effluent from a localmunicipal wastewater plant (London, Ontario). Allthree sludges have been demonstrated19,20 to affectEBPR.
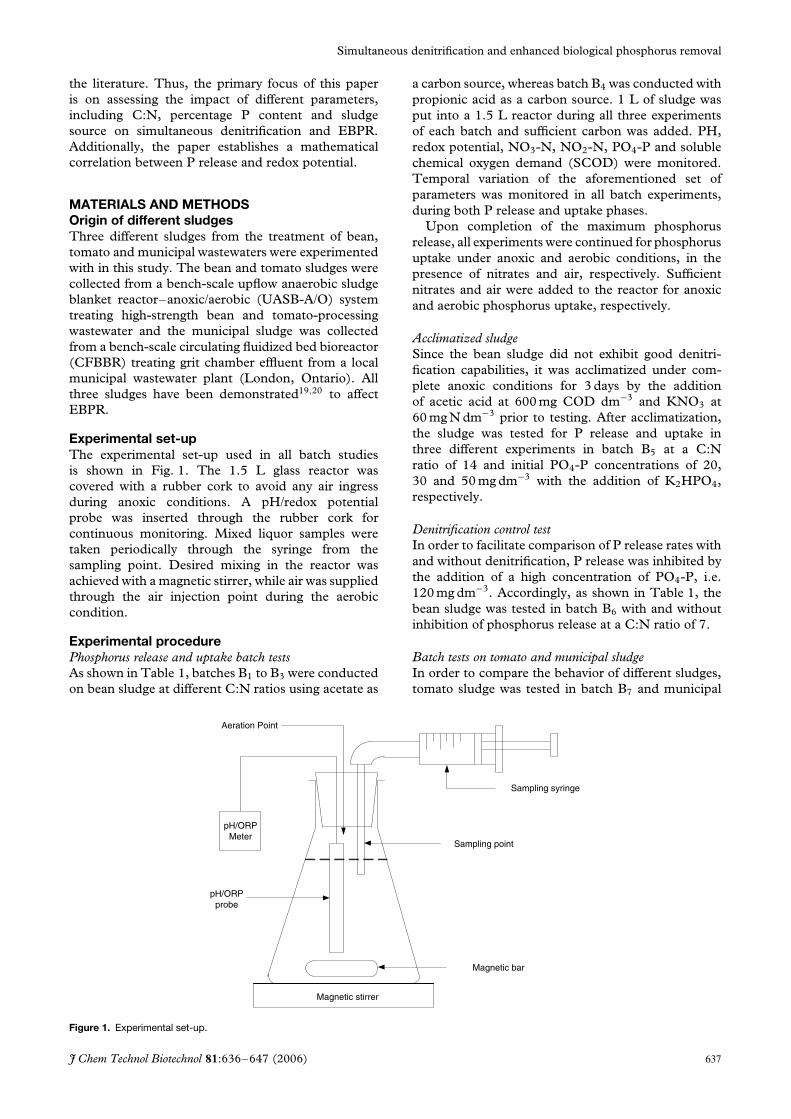
Experimental set-upThe experimental set-up used in all batch studiesis shown in Fig. 1. The 1.5 L glass reactor wascovered with a rubber cork to avoid any air ingressduring anoxic conditions. A pH/redox potentialprobe was inserted through the rubber cork forcontinuous monitoring. Mixed liquor samples weretaken periodically through the syringe from thesampling point. Desired mixing in the reactor wasachieved with a magnetic stirrer, while air was suppliedthrough the air injection point during the aerobiccondition.
Experimental procedurePhosphorus release and uptake batch testsAs shown in Table 1, batches B1 to B3 were conductedon bean sludge at different C:N ratios using acetate as
a carbon source, whereas batch B4 was conducted withpropionic acid as a carbon source. 1 L of sludge wasput into a 1.5 L reactor during all three experimentsof each batch and sufficient carbon was added. PH,redox potential, NO3-N, NO2-N, PO4-P and solublechemical oxygen demand (SCOD) were monitored.Temporal variation of the aforementioned set ofparameters was monitored in all batch experiments,during both P release and uptake phases.
Upon completion of the maximum phosphorusrelease, all experiments were continued for phosphorusuptake under anoxic and aerobic conditions, in thepresence of nitrates and air, respectively. Sufficientnitrates and air were added to the reactor for anoxicand aerobic phosphorus uptake, respectively.
Acclimatized sludgeSince the bean sludge did not exhibit good denitri-fication capabilities, it was acclimatized under com-plete anoxic conditions for 3 days by the additionof acetic acid at 600 mg COD dm−3 and KNO3 at60 mg N dm−3 prior to testing. After acclimatization,the sludge was tested for P release and uptake inthree different experiments in batch B5 at a C:Nratio of 14 and initial PO4-P concentrations of 20,30 and 50 mg dm−3 with the addition of K2HPO4,respectively.
Denitrification control testIn order to facilitate comparison of P release rates withand without denitrification, P release was inhibited bythe addition of a high concentration of PO4-P, i.e.120 mg dm−3. Accordingly, as shown in Table 1, thebean sludge was tested in batch B6 with and withoutinhibition of phosphorus release at a C:N ratio of 7.
Batch tests on tomato and municipal sludgeIn order to compare the behavior of different sludges,tomato sludge was tested in batch B7 and municipal
pH/ORPMeter
pH/ORPprobe
Magnetic bar
Magnetic stirrer
Sampling point
Aeration Point
Sampling syringe
Figure 1. Experimental set-up.
J Chem Technol Biotechnol 81:636–647 (2006) 637
A Patel, A Gohil, G Nakhla
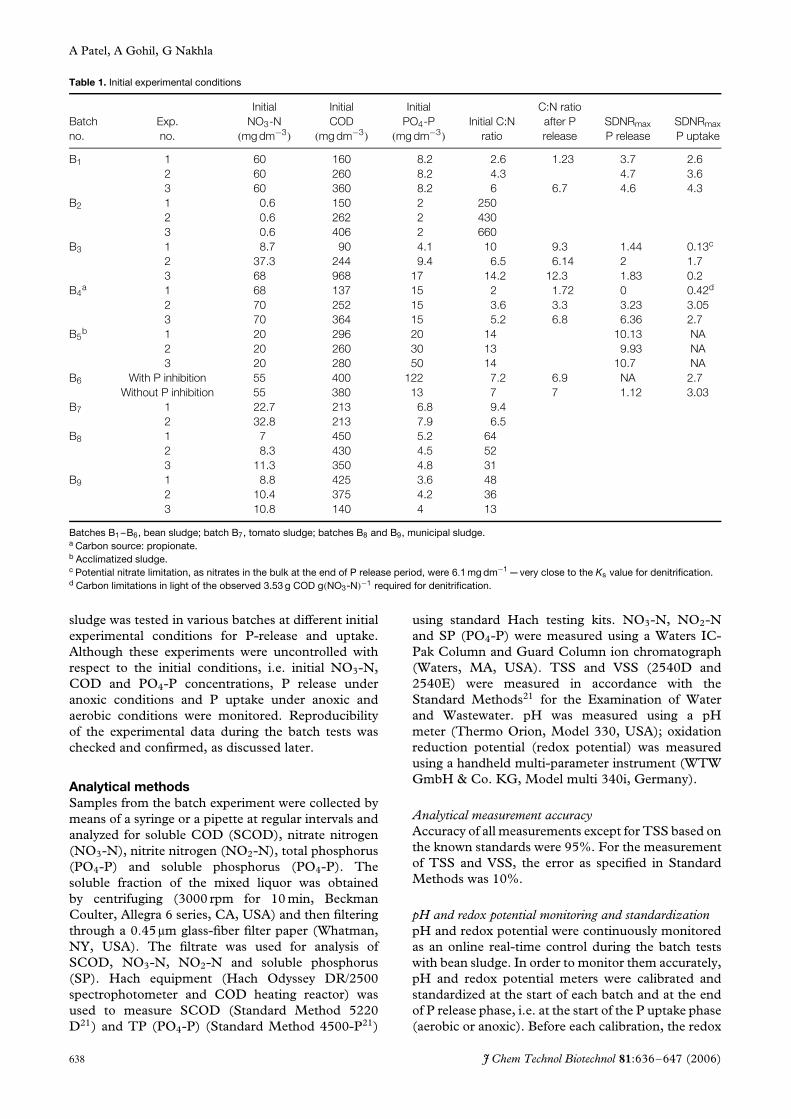
Table 1. Initial experimental conditions
Batchno.
Exp.no.
InitialNO3-N
(mg dm−3)
InitialCOD
(mg dm−3)
InitialPO4-P
(mg dm−3)
Initial C:Nratio
C:N ratioafter Prelease
SDNRmax
P releaseSDNRmax
P uptake
B1 1 60 160 8.2 2.6 1.23 3.7 2.62 60 260 8.2 4.3 4.7 3.63 60 360 8.2 6 6.7 4.6 4.3
B2 1 0.6 150 2 2502 0.6 262 2 4303 0.6 406 2 660
B3 1 8.7 90 4.1 10 9.3 1.44 0.13c
2 37.3 244 9.4 6.5 6.14 2 1.73 68 968 17 14.2 12.3 1.83 0.2
B4a 1 68 137 15 2 1.72 0 0.42d
2 70 252 15 3.6 3.3 3.23 3.053 70 364 15 5.2 6.8 6.36 2.7
B5b 1 20 296 20 14 10.13 NA
2 20 260 30 13 9.93 NA3 20 280 50 14 10.7 NA
B6 With P inhibition 55 400 122 7.2 6.9 NA 2.7Without P inhibition 55 380 13 7 7 1.12 3.03
B7 1 22.7 213 6.8 9.42 32.8 213 7.9 6.5
B8 1 7 450 5.2 642 8.3 430 4.5 523 11.3 350 4.8 31
B9 1 8.8 425 3.6 482 10.4 375 4.2 363 10.8 140 4 13
Batches B1 –B6, bean sludge; batch B7, tomato sludge; batches B8 and B9, municipal sludge.a Carbon source: propionate.b Acclimatized sludge.c Potential nitrate limitation, as nitrates in the bulk at the end of P release period, were 6.1 mg dm−1 —very close to the Ks value for denitrification.d Carbon limitations in light of the observed 3.53 g COD g(NO3-N)−1 required for denitrification.
sludge was tested in various batches at different initialexperimental conditions for P-release and uptake.Although these experiments were uncontrolled withrespect to the initial conditions, i.e. initial NO3-N,COD and PO4-P concentrations, P release underanoxic conditions and P uptake under anoxic andaerobic conditions were monitored. Reproducibilityof the experimental data during the batch tests waschecked and confirmed, as discussed later.
Analytical methodsSamples from the batch experiment were collected bymeans of a syringe or a pipette at regular intervals andanalyzed for soluble COD (SCOD), nitrate nitrogen(NO3-N), nitrite nitrogen (NO2-N), total phosphorus(PO4-P) and soluble phosphorus (PO4-P). Thesoluble fraction of the mixed liquor was obtainedby centrifuging (3000 rpm for 10 min, BeckmanCoulter, Allegra 6 series, CA, USA) and then filteringthrough a 0.45 µm glass-fiber filter paper (Whatman,NY, USA). The filtrate was used for analysis ofSCOD, NO3-N, NO2-N and soluble phosphorus(SP). Hach equipment (Hach Odyssey DR/2500spectrophotometer and COD heating reactor) wasused to measure SCOD (Standard Method 5220D21) and TP (PO4-P) (Standard Method 4500-P21)
using standard Hach testing kits. NO3-N, NO2-Nand SP (PO4-P) were measured using a Waters IC-Pak Column and Guard Column ion chromatograph(Waters, MA, USA). TSS and VSS (2540D and2540E) were measured in accordance with theStandard Methods21 for the Examination of Waterand Wastewater. pH was measured using a pHmeter (Thermo Orion, Model 330, USA); oxidationreduction potential (redox potential) was measuredusing a handheld multi-parameter instrument (WTWGmbH & Co. KG, Model multi 340i, Germany).
Analytical measurement accuracyAccuracy of all measurements except for TSS based onthe known standards were 95%. For the measurementof TSS and VSS, the error as specified in StandardMethods was 10%.
pH and redox potential monitoring and standardizationpH and redox potential were continuously monitoredas an online real-time control during the batch testswith bean sludge. In order to monitor them accurately,pH and redox potential meters were calibrated andstandardized at the start of each batch and at the endof P release phase, i.e. at the start of the P uptake phase(aerobic or anoxic). Before each calibration, the redox
638 J Chem Technol Biotechnol 81:636–647 (2006)
Simultaneous denitrification and enhanced biological phosphorus removal
potential electrodes were cleaned in 0.1 N HCl for10 min followed by soaking in alcohol for 5 min, andrinsing with distilled water. A two-point calibrationwas performed to calibrate and standardize the pH andredox potential meter using two solutions of knownredox potential within the range of the experimentalvalues to be monitored. The slope calculated by themeter was almost 90–95% accurate. The pH meterwas calibrated with standard buffer solutions of pH 4,7 and 10 with an accuracy level of 95%.
RESULTS AND DISCUSSIONSludge characteristicsSludges from the UASB-A/O process treating high-strength bean and tomato wastes from the food-processing industry, CFBBR treating real municipalwaste27 and acclimatized bean waste sludge weretested in various batch experiment to investigate theEBPR rates. The characteristics of these sludges withrespect to biomass concentration, phosphorus contentin the biomass (% P by weight of volatile suspendedsolids, VSS) and sludge volume index (SVI) aredescribed in Table 2. It is inferred from Table 2 thatthe characteristics of all the sludges were different,depending on the source of the waste and the type ofthe process. These different characteristics of varioussludges had a profound effect on the bio-P processrates during batch studies.
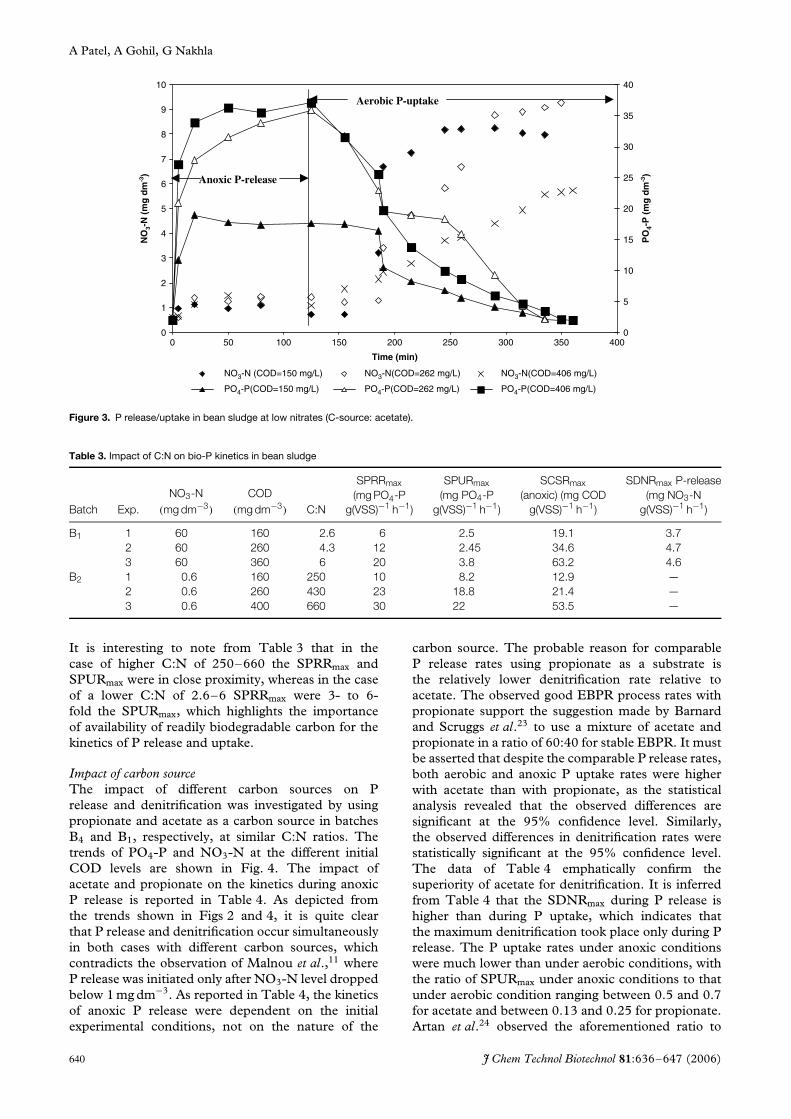
Batch experimentsBean sludge—anoxic P release—impact of C:N ratio onkineticsAs shown in Table 1, bean sludge from the UASB-A/O system was tested in two batches −B1 andB2− at initial NO3-N levels of 60 and 0.6 mg dm−3,
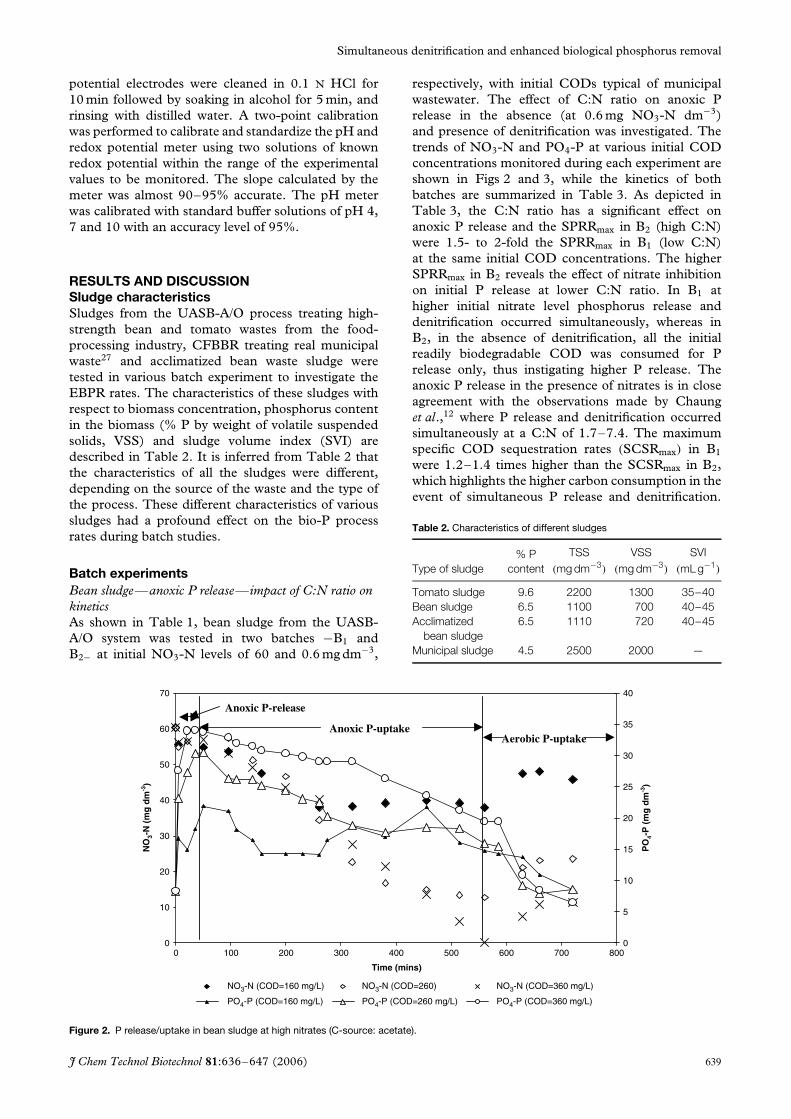
respectively, with initial CODs typical of municipalwastewater. The effect of C:N ratio on anoxic Prelease in the absence (at 0.6 mg NO3-N dm−3)and presence of denitrification was investigated. Thetrends of NO3-N and PO4-P at various initial CODconcentrations monitored during each experiment areshown in Figs 2 and 3, while the kinetics of bothbatches are summarized in Table 3. As depicted inTable 3, the C:N ratio has a significant effect onanoxic P release and the SPRRmax in B2 (high C:N)were 1.5- to 2-fold the SPRRmax in B1 (low C:N)at the same initial COD concentrations. The higherSPRRmax in B2 reveals the effect of nitrate inhibitionon initial P release at lower C:N ratio. In B1 athigher initial nitrate level phosphorus release anddenitrification occurred simultaneously, whereas inB2, in the absence of denitrification, all the initialreadily biodegradable COD was consumed for Prelease only, thus instigating higher P release. Theanoxic P release in the presence of nitrates is in closeagreement with the observations made by Chaunget al.,12 where P release and denitrification occurredsimultaneously at a C:N of 1.7–7.4. The maximumspecific COD sequestration rates (SCSRmax) in B1
were 1.2–1.4 times higher than the SCSRmax in B2,which highlights the higher carbon consumption in theevent of simultaneous P release and denitrification.
Table 2. Characteristics of different sludges
Type of sludge% P
contentTSS
(mg dm−3)
VSS(mg dm−3)
SVI(mL g−1)
Tomato sludge 9.6 2200 1300 35–40Bean sludge 6.5 1100 700 40–45Acclimatized
bean sludge6.5 1110 720 40–45
Municipal sludge 4.5 2500 2000 —
0
10
20
30
40
50
60
70
0 100 200 300 400 500 600 700 800
Time (mins)
NO
3-N
(m
g d
m-3
)
0
5
10
15
20
25
30
35
40
PO
4-P
(m
g d
m-3
)
NO3-N (COD=160 mg/L) NO3-N (COD=260) NO3-N (COD=360 mg/L)
PO4-P (COD=160 mg/L) PO4-P (COD=260 mg/L) PO4-P (COD=360 mg/L)
Anoxic P-release
Anoxic P-uptakeAerobic P-uptake
Figure 2. P release/uptake in bean sludge at high nitrates (C-source: acetate).
J Chem Technol Biotechnol 81:636–647 (2006) 639
A Patel, A Gohil, G Nakhla
0
1
2
3
4
5
6
7
8
9
10
0 50 100 150 200 250 300 350 400
Time (min)
NO
3-N
(m
g d
m-3
)
0
5
10
15
20
25
30
35
40
PO
4-P
(m
g d
m-3
)
NO3-N (COD=150 mg/L) NO3-N(COD=262 mg/L) NO3-N(COD=406 mg/L)
PO4-P(COD=150 mg/L) PO4-P(COD=262 mg/L) PO4-P(COD=406 mg/L)
Anoxic P-release
Aerobic P-uptake
Figure 3. P release/uptake in bean sludge at low nitrates (C-source: acetate).
Table 3. Impact of C:N on bio-P kinetics in bean sludge
Batch Exp.NO3-N
(mg dm−3)
COD(mg dm−3) C:N
SPRRmax
(mg PO4-Pg(VSS)−1 h−1)
SPURmax
(mg PO4-Pg(VSS)−1 h−1)
SCSRmax
(anoxic) (mg CODg(VSS)−1 h−1)
SDNRmax P-release(mg NO3-N
g(VSS)−1 h−1)
B1 1 60 160 2.6 6 2.5 19.1 3.72 60 260 4.3 12 2.45 34.6 4.73 60 360 6 20 3.8 63.2 4.6
B2 1 0.6 160 250 10 8.2 12.9 —2 0.6 260 430 23 18.8 21.4 —3 0.6 400 660 30 22 53.5 —
It is interesting to note from Table 3 that in thecase of higher C:N of 250–660 the SPRRmax andSPURmax were in close proximity, whereas in the caseof a lower C:N of 2.6–6 SPRRmax were 3- to 6-fold the SPURmax, which highlights the importanceof availability of readily biodegradable carbon for thekinetics of P release and uptake.
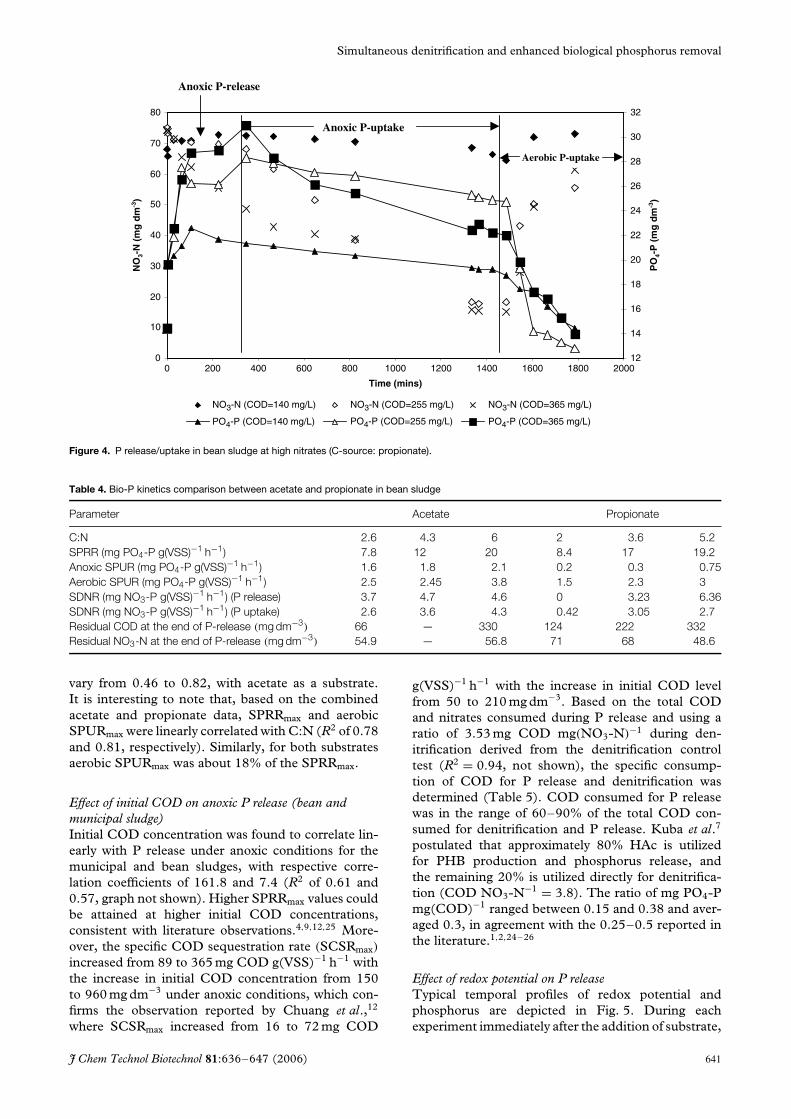
Impact of carbon sourceThe impact of different carbon sources on Prelease and denitrification was investigated by usingpropionate and acetate as a carbon source in batchesB4 and B1, respectively, at similar C:N ratios. Thetrends of PO4-P and NO3-N at the different initialCOD levels are shown in Fig. 4. The impact ofacetate and propionate on the kinetics during anoxicP release is reported in Table 4. As depicted fromthe trends shown in Figs 2 and 4, it is quite clearthat P release and denitrification occur simultaneouslyin both cases with different carbon sources, whichcontradicts the observation of Malnou et al.,11 whereP release was initiated only after NO3-N level droppedbelow 1 mg dm−3. As reported in Table 4, the kineticsof anoxic P release were dependent on the initialexperimental conditions, not on the nature of the
carbon source. The probable reason for comparableP release rates using propionate as a substrate isthe relatively lower denitrification rate relative toacetate. The observed good EBPR process rates withpropionate support the suggestion made by Barnardand Scruggs et al.23 to use a mixture of acetate andpropionate in a ratio of 60:40 for stable EBPR. It mustbe asserted that despite the comparable P release rates,both aerobic and anoxic P uptake rates were higherwith acetate than with propionate, as the statisticalanalysis revealed that the observed differences aresignificant at the 95% confidence level. Similarly,the observed differences in denitrification rates werestatistically significant at the 95% confidence level.The data of Table 4 emphatically confirm thesuperiority of acetate for denitrification. It is inferredfrom Table 4 that the SDNRmax during P release ishigher than during P uptake, which indicates thatthe maximum denitrification took place only during Prelease. The P uptake rates under anoxic conditionswere much lower than under aerobic conditions, withthe ratio of SPURmax under anoxic conditions to thatunder aerobic condition ranging between 0.5 and 0.7for acetate and between 0.13 and 0.25 for propionate.Artan et al.24 observed the aforementioned ratio to
640 J Chem Technol Biotechnol 81:636–647 (2006)
Simultaneous denitrification and enhanced biological phosphorus removal
0
10
20
30
40
50
60
70
80
0 200 400 600 800 1000 1200 1400 1600 1800 2000
Time (mins)
NO
3-N
(m
g d
m-3
)
12
14
16
18
20
22
24
26
28
30
32
PO
4-P
(m
g d
m-3
)
NO3-N (COD=140 mg/L) NO3-N (COD=255 mg/L) NO3-N (COD=365 mg/L)
PO4-P (COD=140 mg/L) PO4-P (COD=255 mg/L) PO4-P (COD=365 mg/L)
Anoxic P-release
Anoxic P-uptake
Aerobic P-uptake
Figure 4. P release/uptake in bean sludge at high nitrates (C-source: propionate).
Table 4. Bio-P kinetics comparison between acetate and propionate in bean sludge
Parameter Acetate Propionate
C:N 2.6 4.3 6 2 3.6 5.2SPRR (mg PO4-P g(VSS)−1 h−1) 7.8 12 20 8.4 17 19.2Anoxic SPUR (mg PO4-P g(VSS)−1 h−1) 1.6 1.8 2.1 0.2 0.3 0.75Aerobic SPUR (mg PO4-P g(VSS)−1 h−1) 2.5 2.45 3.8 1.5 2.3 3SDNR (mg NO3-P g(VSS)−1 h−1) (P release) 3.7 4.7 4.6 0 3.23 6.36SDNR (mg NO3-P g(VSS)−1 h−1) (P uptake) 2.6 3.6 4.3 0.42 3.05 2.7Residual COD at the end of P-release (mg dm−3) 66 — 330 124 222 332Residual NO3-N at the end of P-release (mg dm−3) 54.9 — 56.8 71 68 48.6
vary from 0.46 to 0.82, with acetate as a substrate.It is interesting to note that, based on the combinedacetate and propionate data, SPRRmax and aerobicSPURmax were linearly correlated with C:N (R2 of 0.78and 0.81, respectively). Similarly, for both substratesaerobic SPURmax was about 18% of the SPRRmax.
Effect of initial COD on anoxic P release (bean andmunicipal sludge)Initial COD concentration was found to correlate lin-early with P release under anoxic conditions for themunicipal and bean sludges, with respective corre-lation coefficients of 161.8 and 7.4 (R2 of 0.61 and0.57, graph not shown). Higher SPRRmax values couldbe attained at higher initial COD concentrations,consistent with literature observations.4,9,12,25 More-over, the specific COD sequestration rate (SCSRmax)
increased from 89 to 365 mg COD g(VSS)−1 h−1 withthe increase in initial COD concentration from 150to 960 mg dm−3 under anoxic conditions, which con-firms the observation reported by Chuang et al.,12
where SCSRmax increased from 16 to 72 mg COD
g(VSS)−1 h−1 with the increase in initial COD levelfrom 50 to 210 mg dm−3. Based on the total CODand nitrates consumed during P release and using aratio of 3.53 mg COD mg(NO3-N)−1 during den-itrification derived from the denitrification controltest (R2 = 0.94, not shown), the specific consump-tion of COD for P release and denitrification wasdetermined (Table 5). COD consumed for P releasewas in the range of 60–90% of the total COD con-sumed for denitrification and P release. Kuba et al.7
postulated that approximately 80% HAc is utilizedfor PHB production and phosphorus release, andthe remaining 20% is utilized directly for denitrifica-tion (COD NO3-N−1 = 3.8). The ratio of mg PO4-Pmg(COD)−1 ranged between 0.15 and 0.38 and aver-aged 0.3, in agreement with the 0.25–0.5 reported inthe literature.1,2,24–26
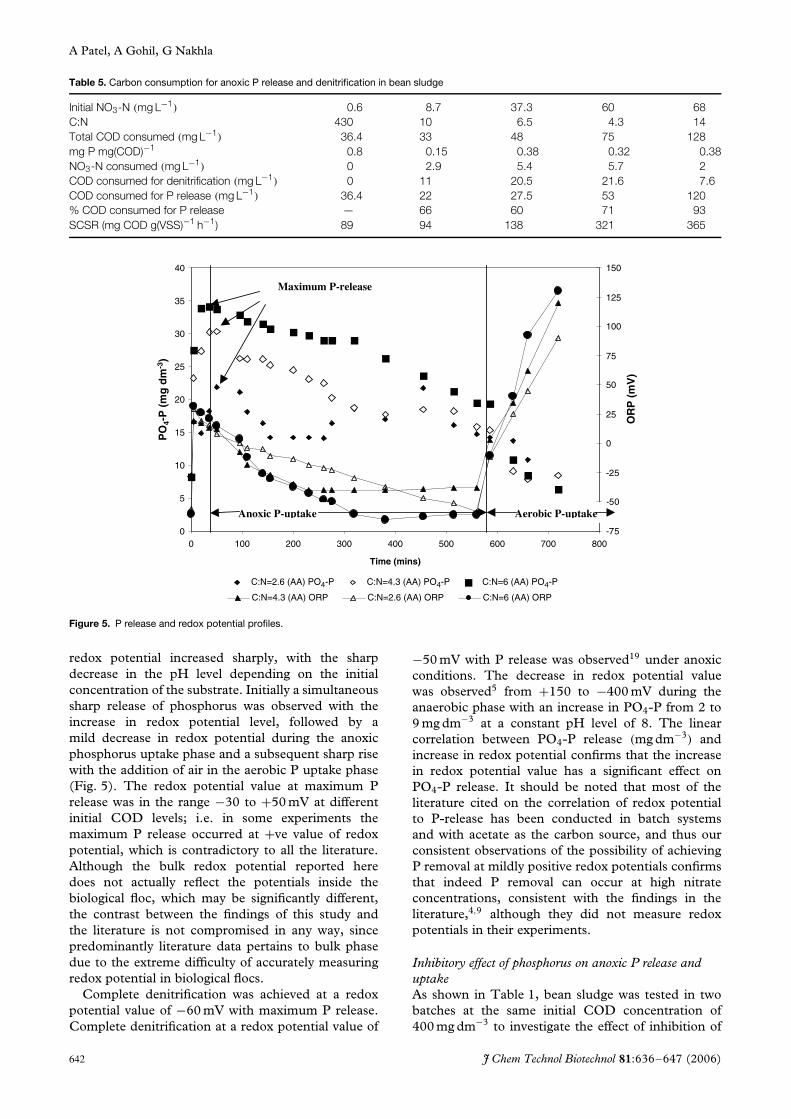
Effect of redox potential on P releaseTypical temporal profiles of redox potential andphosphorus are depicted in Fig. 5. During eachexperiment immediately after the addition of substrate,
J Chem Technol Biotechnol 81:636–647 (2006) 641
A Patel, A Gohil, G Nakhla
Table 5. Carbon consumption for anoxic P release and denitrification in bean sludge
Initial NO3-N (mg L−1) 0.6 8.7 37.3 60 68C:N 430 10 6.5 4.3 14Total COD consumed (mg L−1) 36.4 33 48 75 128mg P mg(COD)−1 0.8 0.15 0.38 0.32 0.38NO3-N consumed (mg L−1) 0 2.9 5.4 5.7 2COD consumed for denitrification (mg L−1) 0 11 20.5 21.6 7.6COD consumed for P release (mg L−1) 36.4 22 27.5 53 120% COD consumed for P release — 66 60 71 93SCSR (mg COD g(VSS)−1 h−1) 89 94 138 321 365
0
5
10
15
20
25
30
35
40
0 100 200 300 400 500 600 700 800
Time (mins)
PO
4-P
(m
g d
m-3
)
-75
-50
-25
0
25
50
75
100
125
150
OR
P (
mV
)
C:N=2.6 (AA) PO4-P C:N=4.3 (AA) PO4-P C:N=6 (AA) PO4-P
C:N=4.3 (AA) ORP C:N=2.6 (AA) ORP C:N=6 (AA) ORP
Maximum P-release
Anoxic P-uptake Aerobic P-uptake
Figure 5. P release and redox potential profiles.
redox potential increased sharply, with the sharpdecrease in the pH level depending on the initialconcentration of the substrate. Initially a simultaneoussharp release of phosphorus was observed with theincrease in redox potential level, followed by amild decrease in redox potential during the anoxicphosphorus uptake phase and a subsequent sharp risewith the addition of air in the aerobic P uptake phase(Fig. 5). The redox potential value at maximum Prelease was in the range −30 to +50 mV at differentinitial COD levels; i.e. in some experiments themaximum P release occurred at +ve value of redoxpotential, which is contradictory to all the literature.Although the bulk redox potential reported heredoes not actually reflect the potentials inside thebiological floc, which may be significantly different,the contrast between the findings of this study andthe literature is not compromised in any way, sincepredominantly literature data pertains to bulk phasedue to the extreme difficulty of accurately measuringredox potential in biological flocs.
Complete denitrification was achieved at a redoxpotential value of −60 mV with maximum P release.Complete denitrification at a redox potential value of
−50 mV with P release was observed19 under anoxicconditions. The decrease in redox potential valuewas observed5 from +150 to −400 mV during theanaerobic phase with an increase in PO4-P from 2 to9 mg dm−3 at a constant pH level of 8. The linearcorrelation between PO4-P release (mg dm−3) andincrease in redox potential confirms that the increasein redox potential value has a significant effect onPO4-P release. It should be noted that most of theliterature cited on the correlation of redox potentialto P-release has been conducted in batch systemsand with acetate as the carbon source, and thus ourconsistent observations of the possibility of achievingP removal at mildly positive redox potentials confirmsthat indeed P removal can occur at high nitrateconcentrations, consistent with the findings in theliterature,4,9 although they did not measure redoxpotentials in their experiments.
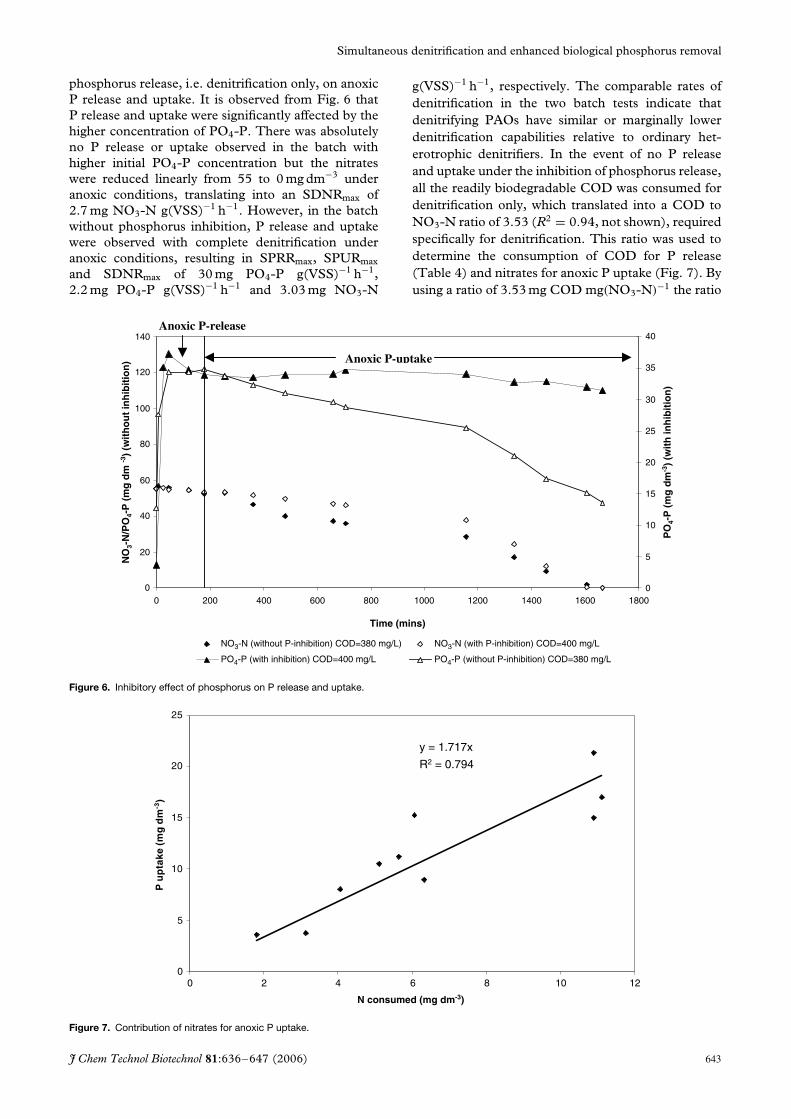
Inhibitory effect of phosphorus on anoxic P release anduptakeAs shown in Table 1, bean sludge was tested in twobatches at the same initial COD concentration of400 mg dm−3 to investigate the effect of inhibition of
642 J Chem Technol Biotechnol 81:636–647 (2006)
Simultaneous denitrification and enhanced biological phosphorus removal
phosphorus release, i.e. denitrification only, on anoxicP release and uptake. It is observed from Fig. 6 thatP release and uptake were significantly affected by thehigher concentration of PO4-P. There was absolutelyno P release or uptake observed in the batch withhigher initial PO4-P concentration but the nitrateswere reduced linearly from 55 to 0 mg dm−3 underanoxic conditions, translating into an SDNRmax of2.7 mg NO3-N g(VSS)−1 h−1. However, in the batchwithout phosphorus inhibition, P release and uptakewere observed with complete denitrification underanoxic conditions, resulting in SPRRmax, SPURmax
and SDNRmax of 30 mg PO4-P g(VSS)−1 h−1,2.2 mg PO4-P g(VSS)−1 h−1 and 3.03 mg NO3-N
g(VSS)−1 h−1, respectively. The comparable rates ofdenitrification in the two batch tests indicate thatdenitrifying PAOs have similar or marginally lowerdenitrification capabilities relative to ordinary het-erotrophic denitrifiers. In the event of no P releaseand uptake under the inhibition of phosphorus release,all the readily biodegradable COD was consumed fordenitrification only, which translated into a COD toNO3-N ratio of 3.53 (R2 = 0.94, not shown), requiredspecifically for denitrification. This ratio was used todetermine the consumption of COD for P release(Table 4) and nitrates for anoxic P uptake (Fig. 7). Byusing a ratio of 3.53 mg COD mg(NO3-N)−1 the ratio
0
20
40
60
80
100
120
0 200 400 600 800 1000 1200 1400 1600 1800
Time (mins)
NO
3-N
/PO
4-P
(m
g d
m -3
) (w
ith
ou
t in
hib
itio
n)
0
5
10
15
20
25
30
35
40
PO
4-P
(m
g d
m-3
) (w
ith
inh
ibit
ion
)
NO3-N (without P-inhibition) COD=380 mg/L) NO3-N (with P-inhibition) COD=400 mg/L
PO4-P (with inhibition) COD=400 mg/L PO4-P (without P-inhibition) COD=380 mg/L
Anoxic P-release
Anoxic P-uptake
140
Figure 6. Inhibitory effect of phosphorus on P release and uptake.
y = 1.717x
R2 = 0.794
0
5
10
15
20
25
0 6 10 12
N consumed (mg dm-3)
P u
pta
ke (
mg
dm
-3)
2 84
Figure 7. Contribution of nitrates for anoxic P uptake.
J Chem Technol Biotechnol 81:636–647 (2006) 643
A Patel, A Gohil, G Nakhla
of mgP mg(N)−1 during anoxic P uptake was derivedto be 1.72, which is comparable with the literaturevalues1–4 as reported in Table 6.
Impact of P content on P release and denitrificationThe impact of percentage P content in sludges onanoxic P release and denitrification was investigatedin bean and tomato sludge in two different batches:B3 and B7. Table 7 summarizes the effects of thesludge’s P content on SPRRmax and SDNRmax ofbean and tomato sludges. It must be asserted that thedifferences between the two sludges listed in Table 7were statistically significant at the 95% confidencelevel. It is inferred from Table 7 that the SPRRmax
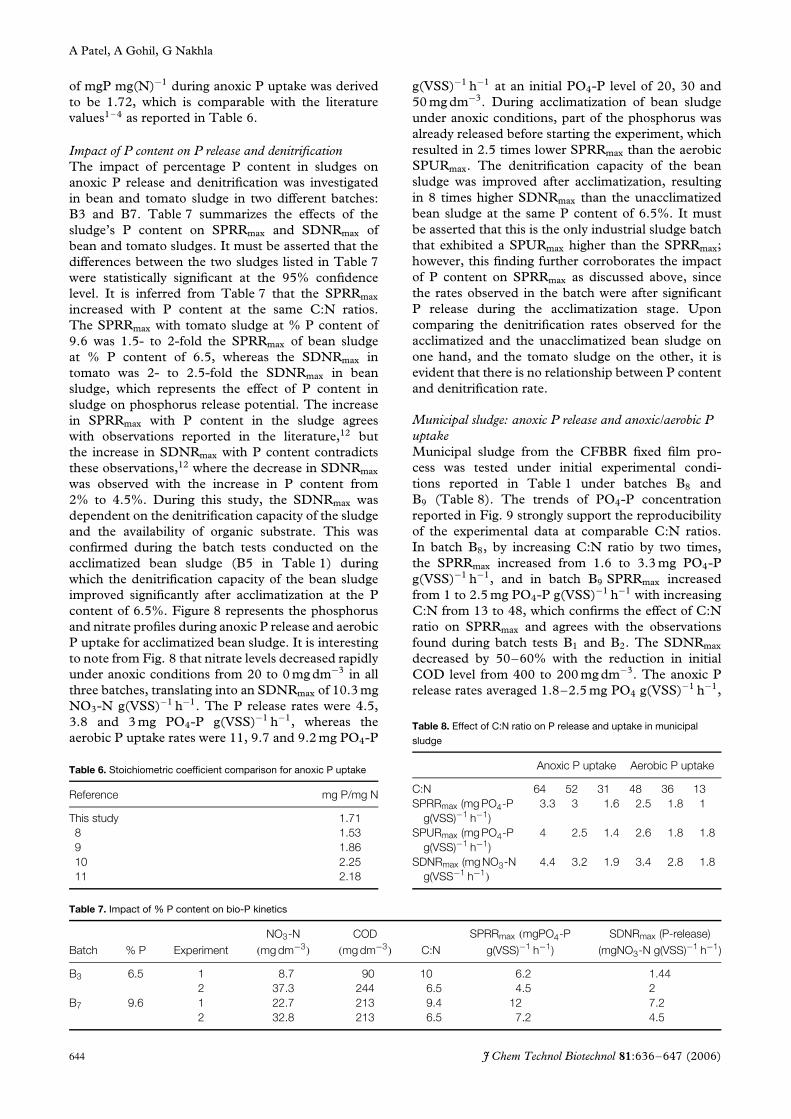
increased with P content at the same C:N ratios.The SPRRmax with tomato sludge at % P content of9.6 was 1.5- to 2-fold the SPRRmax of bean sludgeat % P content of 6.5, whereas the SDNRmax intomato was 2- to 2.5-fold the SDNRmax in beansludge, which represents the effect of P content insludge on phosphorus release potential. The increasein SPRRmax with P content in the sludge agreeswith observations reported in the literature,12 butthe increase in SDNRmax with P content contradictsthese observations,12 where the decrease in SDNRmax
was observed with the increase in P content from2% to 4.5%. During this study, the SDNRmax wasdependent on the denitrification capacity of the sludgeand the availability of organic substrate. This wasconfirmed during the batch tests conducted on theacclimatized bean sludge (B5 in Table 1) duringwhich the denitrification capacity of the bean sludgeimproved significantly after acclimatization at the Pcontent of 6.5%. Figure 8 represents the phosphorusand nitrate profiles during anoxic P release and aerobicP uptake for acclimatized bean sludge. It is interestingto note from Fig. 8 that nitrate levels decreased rapidlyunder anoxic conditions from 20 to 0 mg dm−3 in allthree batches, translating into an SDNRmax of 10.3 mgNO3-N g(VSS)−1 h−1. The P release rates were 4.5,3.8 and 3 mg PO4-P g(VSS)−1 h−1, whereas theaerobic P uptake rates were 11, 9.7 and 9.2 mg PO4-P
Table 6. Stoichiometric coefficient comparison for anoxic P uptake
Reference mg P/mg N
This study 1.718 1.539 1.8610 2.2511 2.18
g(VSS)−1 h−1 at an initial PO4-P level of 20, 30 and50 mg dm−3. During acclimatization of bean sludgeunder anoxic conditions, part of the phosphorus wasalready released before starting the experiment, whichresulted in 2.5 times lower SPRRmax than the aerobicSPURmax. The denitrification capacity of the beansludge was improved after acclimatization, resultingin 8 times higher SDNRmax than the unacclimatizedbean sludge at the same P content of 6.5%. It mustbe asserted that this is the only industrial sludge batchthat exhibited a SPURmax higher than the SPRRmax;however, this finding further corroborates the impactof P content on SPRRmax as discussed above, sincethe rates observed in the batch were after significantP release during the acclimatization stage. Uponcomparing the denitrification rates observed for theacclimatized and the unacclimatized bean sludge onone hand, and the tomato sludge on the other, it isevident that there is no relationship between P contentand denitrification rate.
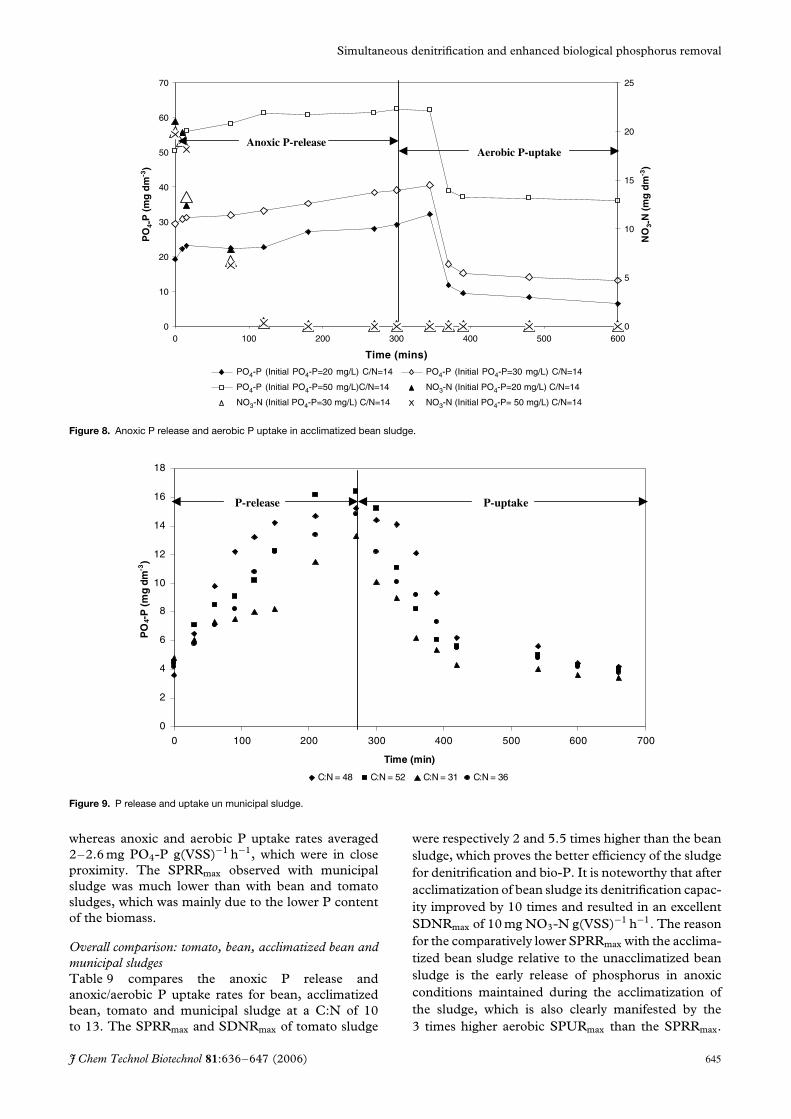
Municipal sludge: anoxic P release and anoxic/aerobic PuptakeMunicipal sludge from the CFBBR fixed film pro-cess was tested under initial experimental condi-tions reported in Table 1 under batches B8 andB9 (Table 8). The trends of PO4-P concentrationreported in Fig. 9 strongly support the reproducibilityof the experimental data at comparable C:N ratios.In batch B8, by increasing C:N ratio by two times,the SPRRmax increased from 1.6 to 3.3 mg PO4-Pg(VSS)−1 h−1, and in batch B9 SPRRmax increasedfrom 1 to 2.5 mg PO4-P g(VSS)−1 h−1 with increasingC:N from 13 to 48, which confirms the effect of C:Nratio on SPRRmax and agrees with the observationsfound during batch tests B1 and B2. The SDNRmax
decreased by 50–60% with the reduction in initialCOD level from 400 to 200 mg dm−3. The anoxic Prelease rates averaged 1.8–2.5 mg PO4 g(VSS)−1 h−1,
Table 8. Effect of C:N ratio on P release and uptake in municipal
sludge
Anoxic P uptake Aerobic P uptake
C:N 64 52 31 48 36 13SPRRmax (mg PO4-P
g(VSS)−1 h−1)3.3 3 1.6 2.5 1.8 1
SPURmax (mg PO4-Pg(VSS)−1 h−1)
4 2.5 1.4 2.6 1.8 1.8
SDNRmax (mg NO3-Ng(VSS−1 h−1)
4.4 3.2 1.9 3.4 2.8 1.8
Table 7. Impact of % P content on bio-P kinetics
Batch % P ExperimentNO3-N
(mg dm−3)
COD(mg dm−3) C:N
SPRRmax (mgPO4-Pg(VSS)−1 h−1)
SDNRmax (P-release)(mgNO3-N g(VSS)−1 h−1)
B3 6.5 1 8.7 90 10 6.2 1.442 37.3 244 6.5 4.5 2
B7 9.6 1 22.7 213 9.4 12 7.22 32.8 213 6.5 7.2 4.5
644 J Chem Technol Biotechnol 81:636–647 (2006)
Simultaneous denitrification and enhanced biological phosphorus removal
0
10
20
30
40
50
60
70
0 100 200 300 400 500 600
Time (mins)
PO
4-P
(m
g d
m-3
)
0
5
10
15
20
25
NO
3-N
(m
g d
m-3
)
PO4-P (Initial PO4-P=20 mg/L) C/N=14 PO4-P (Initial PO4-P=30 mg/L) C/N=14
PO4-P (Initial PO4-P=50 mg/L)C/N=14 NO3-N (Initial PO4-P=20 mg/L) C/N=14
NO3-N (Initial PO4-P=30 mg/L) C/N=14 NO3-N (Initial PO4-P= 50 mg/L) C/N=14
Anoxic P-releaseAerobic P-uptake
Figure 8. Anoxic P release and aerobic P uptake in acclimatized bean sludge.
0
2
4
6
8
10
12
14
16
18
0 100 200 300 400 500 600 700
Time (min)
PO
4-P
(mg
dm-3
)
C:N = 48 C:N = 52 C:N = 31 C:N = 36
P-release P-uptake
Figure 9. P release and uptake un municipal sludge.
whereas anoxic and aerobic P uptake rates averaged2–2.6 mg PO4-P g(VSS)−1 h−1, which were in closeproximity. The SPRRmax observed with municipalsludge was much lower than with bean and tomatosludges, which was mainly due to the lower P contentof the biomass.
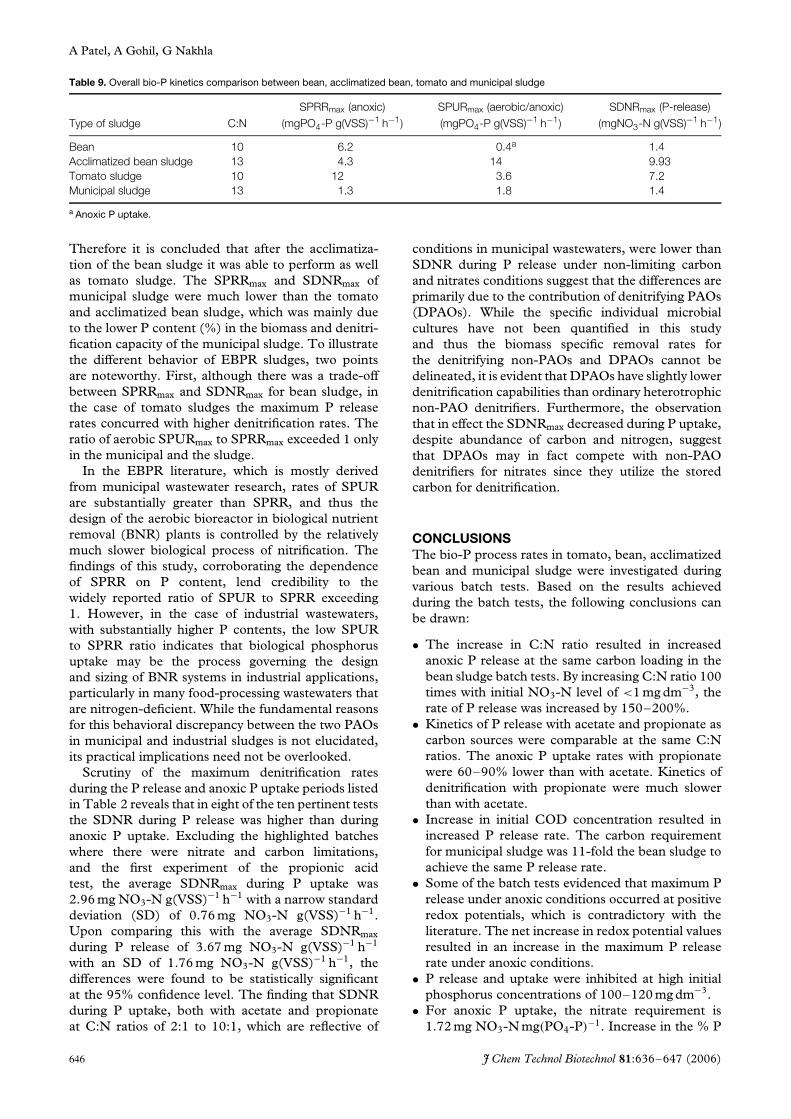
Overall comparison: tomato, bean, acclimatized bean andmunicipal sludgesTable 9 compares the anoxic P release andanoxic/aerobic P uptake rates for bean, acclimatizedbean, tomato and municipal sludge at a C:N of 10to 13. The SPRRmax and SDNRmax of tomato sludge
were respectively 2 and 5.5 times higher than the beansludge, which proves the better efficiency of the sludgefor denitrification and bio-P. It is noteworthy that afteracclimatization of bean sludge its denitrification capac-ity improved by 10 times and resulted in an excellentSDNRmax of 10 mg NO3-N g(VSS)−1 h−1. The reasonfor the comparatively lower SPRRmax with the acclima-tized bean sludge relative to the unacclimatized beansludge is the early release of phosphorus in anoxicconditions maintained during the acclimatization ofthe sludge, which is also clearly manifested by the3 times higher aerobic SPURmax than the SPRRmax.
J Chem Technol Biotechnol 81:636–647 (2006) 645
A Patel, A Gohil, G Nakhla
Table 9. Overall bio-P kinetics comparison between bean, acclimatized bean, tomato and municipal sludge
Type of sludge C:NSPRRmax (anoxic)
(mgPO4-P g(VSS)−1 h−1)SPURmax (aerobic/anoxic)(mgPO4-P g(VSS)−1 h−1)
SDNRmax (P-release)(mgNO3-N g(VSS)−1 h−1)
Bean 10 6.2 0.4a 1.4Acclimatized bean sludge 13 4.3 14 9.93Tomato sludge 10 12 3.6 7.2Municipal sludge 13 1.3 1.8 1.4
a Anoxic P uptake.
Therefore it is concluded that after the acclimatiza-tion of the bean sludge it was able to perform as wellas tomato sludge. The SPRRmax and SDNRmax ofmunicipal sludge were much lower than the tomatoand acclimatized bean sludge, which was mainly dueto the lower P content (%) in the biomass and denitri-fication capacity of the municipal sludge. To illustratethe different behavior of EBPR sludges, two pointsare noteworthy. First, although there was a trade-offbetween SPRRmax and SDNRmax for bean sludge, inthe case of tomato sludges the maximum P releaserates concurred with higher denitrification rates. Theratio of aerobic SPURmax to SPRRmax exceeded 1 onlyin the municipal and the sludge.
In the EBPR literature, which is mostly derivedfrom municipal wastewater research, rates of SPURare substantially greater than SPRR, and thus thedesign of the aerobic bioreactor in biological nutrientremoval (BNR) plants is controlled by the relativelymuch slower biological process of nitrification. Thefindings of this study, corroborating the dependenceof SPRR on P content, lend credibility to thewidely reported ratio of SPUR to SPRR exceeding1. However, in the case of industrial wastewaters,with substantially higher P contents, the low SPURto SPRR ratio indicates that biological phosphorusuptake may be the process governing the designand sizing of BNR systems in industrial applications,particularly in many food-processing wastewaters thatare nitrogen-deficient. While the fundamental reasonsfor this behavioral discrepancy between the two PAOsin municipal and industrial sludges is not elucidated,its practical implications need not be overlooked.
Scrutiny of the maximum denitrification ratesduring the P release and anoxic P uptake periods listedin Table 2 reveals that in eight of the ten pertinent teststhe SDNR during P release was higher than duringanoxic P uptake. Excluding the highlighted batcheswhere there were nitrate and carbon limitations,and the first experiment of the propionic acidtest, the average SDNRmax during P uptake was2.96 mg NO3-N g(VSS)−1 h−1 with a narrow standarddeviation (SD) of 0.76 mg NO3-N g(VSS)−1 h−1.Upon comparing this with the average SDNRmax
during P release of 3.67 mg NO3-N g(VSS)−1 h−1
with an SD of 1.76 mg NO3-N g(VSS)−1 h−1, thedifferences were found to be statistically significantat the 95% confidence level. The finding that SDNRduring P uptake, both with acetate and propionateat C:N ratios of 2:1 to 10:1, which are reflective of
conditions in municipal wastewaters, were lower thanSDNR during P release under non-limiting carbonand nitrates conditions suggest that the differences areprimarily due to the contribution of denitrifying PAOs(DPAOs). While the specific individual microbialcultures have not been quantified in this studyand thus the biomass specific removal rates forthe denitrifying non-PAOs and DPAOs cannot bedelineated, it is evident that DPAOs have slightly lowerdenitrification capabilities than ordinary heterotrophicnon-PAO denitrifiers. Furthermore, the observationthat in effect the SDNRmax decreased during P uptake,despite abundance of carbon and nitrogen, suggestthat DPAOs may in fact compete with non-PAOdenitrifiers for nitrates since they utilize the storedcarbon for denitrification.
CONCLUSIONSThe bio-P process rates in tomato, bean, acclimatizedbean and municipal sludge were investigated duringvarious batch tests. Based on the results achievedduring the batch tests, the following conclusions canbe drawn:
• The increase in C:N ratio resulted in increasedanoxic P release at the same carbon loading in thebean sludge batch tests. By increasing C:N ratio 100times with initial NO3-N level of <1 mg dm−3, therate of P release was increased by 150–200%.
• Kinetics of P release with acetate and propionate ascarbon sources were comparable at the same C:Nratios. The anoxic P uptake rates with propionatewere 60–90% lower than with acetate. Kinetics ofdenitrification with propionate were much slowerthan with acetate.
• Increase in initial COD concentration resulted inincreased P release rate. The carbon requirementfor municipal sludge was 11-fold the bean sludge toachieve the same P release rate.
• Some of the batch tests evidenced that maximum Prelease under anoxic conditions occurred at positiveredox potentials, which is contradictory with theliterature. The net increase in redox potential valuesresulted in an increase in the maximum P releaserate under anoxic conditions.
• P release and uptake were inhibited at high initialphosphorus concentrations of 100–120 mg dm−3.
• For anoxic P uptake, the nitrate requirement is1.72 mg NO3-N mg(PO4-P)−1. Increase in the % P
646 J Chem Technol Biotechnol 81:636–647 (2006)
Simultaneous denitrification and enhanced biological phosphorus removal
content of the two different sludges, i.e. bean andtomato, resulted in increased P release rate at thesame C:N ratio. The rate of denitrification underanoxic conditions was independent of % P contentof the sludge.
• The ratios of aerobic SPURmax to SPRRmax for thebean and tomato sludges were significantly less than1, while in municipal sludge a ratio of 1.4 wasobserved.
REFERENCES1 Falkentoft CM, Harremoes P and Mosbaek H, The significance
of zonation in a denitrifying phosphorus removing biofilm.Water Res 33:3303–3310 (1999).
2 Kerrn-Jespersen JP and Henze M, Biological phosphorus uptakeunder anoxic and aerobic conditions. Water Res 27:617–624(1993).
3 Lee DS, Jeon CO and Park JM, Biological nitrogen removal withenhanced phosphate uptake in a sequencing batch reactorusing single sludge system. Water Res 35:3968–3976 (2001).
4 Meinhold J, Filipe CDM, Daigger GT and Isaacs S, Character-ization of the denitrifying fraction of phosphate accumulatingorganisms in biological phosphate removal. Water Sci Technol39:31–42 (1999).
5 Sorm R, Bortone G, Saltarelli R, Jenicek P, Wanner J andTilche A, Phosphate uptake under anoxic conditions andfixed-film nitrification in nutrient removal activated sludgesystem. Water Res 30:1573–1584 (1996).
6 Kuba T, Smolders G, van Loosdrecht MCM and Heijnen JJ,Biological phosphorus removal from wastewater by anaer-obic–anoxic sequencing batch reactor. Water Sci Technol27:241–252 (1993).
7 Kuba T, Wachtmeister A, van Loosdrecht MCM and Heij-nen JJ, Effect of nitrate on phosphorus release in biologicalphosphorus removal systems. Water Sci Technol 30:263–269(1994).
8 Murnleitner E, Kuba T, van Loosdrecht MCM and Heijnen JJ,An integrated metabolic model for the aerobic and denitrifyingbiological phosphorus removal. Biotechnol Bioeng 54:434–450(1997).
9 Hascoet MC and Florentz M, Influence of nitrates on biologicalphosphorus removal from wastewater. Water SA 11:1–8(1985).
10 Iwema A and Meunier A, Influence of nitrate on acetic acidinduced biological phosphate removal. Water Sci Technol17:289–294 (1985).
11 Malnou D, Megnack M, Faup GM and du Rostu M, Biologicalphosphorus removal: study of the main parameters. Water SciTechnol 16:173–185 (1984).
12 Chaung SH, Ouyang CF and Wang YB, Kinetic competitionbetween phosphorus release and denitrification on sludgeunder anoxic condition. Water Res 30:2961–2968 (1996).
13 Gerber A, Mostert ES, Winter CT and de Villiers RH, Theeffect of acetate and other short chain carbon compounds onthe kinetics of biological nutrient removal. Water SA 12:7–12(1986).
14 Gerber A, de Villiers RH, Mostert ES and van Riet CJ, Thephenomenon of simultaneous phosphate uptake and releaseand its importance in biological nutrient removal fromwastewaters, in Biological Phosphate Removal from Wastewaters,ed by Ramadori R. Pergamon Press, Oxford, pp 123–134(1987).
15 Ng WL, Ong SL and Hu JY, Denitrifying phosphorus removalby anaerobic/anoxic sequencing batch reactor. Water SciTechnol 43:139–146 (2001).
16 Muyima NYO, Momba MNB and Cloete TE, Biological meth-ods for the treatment of wastewaters in microbial communityanalysis: the key to the design of biological wastewater treat-ment systems. IAWQ Scientific and Technical Report No 5,pp 1–24 (1997).
17 Yu RF, Liaw SL, Chang CN and Cheng WY, Applying real-time control to enhance the performance of nitrogen removalin the continuous-flow SBR system. Water Sci Technol38:271–280 (1998).
18 Akin BS and Ugurlu A, Monitoring and control of biologicalnutrient removal in a sequencing batch reactor. ProcessBiochem 40:2873–2878 (2005).
19 Gohil A and Nakhla G, UASB–anoxic–oxic system for thetreatment of high strength tomato processing wastewater,in 33rd Annual General Conference of the Canadian Society forCivil Engineering, Toronto, Canada, 2–4 June (2005).
20 Patel A, Nakhla G and Zhu J, Anoxic phosphorus uptake incirculating fluidized bed bioreactor, in 33rd Annual GeneralConference of the Canadian Society for Civil Engineering,Toronto, Canada, 2–4 June (2005).
21 APHA, AWWA and WPCF, Standards Methods for the Exami-nation of Water and Wastewater (18th edn). American PublicHealth Association, Washington, DC (1992).
22 Cui Y, Nakhla G, Zhu J and Patel A, Simultaneous carbonand nitrogen removal in anoxic–aerobic circulating fluidizedbed biological reactor (CFBBR). Environ Tech 25:699–712(2004).
23 Barnard JL and Scruggs CE, Biological phosphorus removal.Water Environ Technol 15:26–33 (2003).
24 Artan N, Tasli R, Ozgur N and Orhon D, The fate ofphosphate under anoxic conditions in biological nutrientremoval activated sludge systems. Biotech Lett 20:1085–1090(1998).
25 Isaacs SH and Henze M, Controlled carbon source additionto an alternating nitrification denitrification wastewatertreatment process including biological P removal. Water Res29:77–89 (1995).
26 Henze M, Gujer W, Mino T, Matsuo T, Wentzel MC andMarais GvR, Activated sludge model no 2. Scientific andTechnical Report No 3, IAWQ Task Group (1995).
27 Gohil A and Nakhla G, Treatment of tomato processingwastewater by UASB–anoxic aerobic system. BioresourceTechnology (2005).
J Chem Technol Biotechnol 81:636–647 (2006) 647