Embed Size (px)
Citation preview
Corporate PresentationAugust 2018
Advisories
2
• In the interest of providing information regarding Paramount Resources Ltd.("Paramount", "PRL" or the "Company") and its future plans and operations, thispresentation contains certain forward-looking information and statements.
• The projections, estimates and forecasts contained in such forward-lookinginformation and statements necessarily involve a number of assumptions, and aresubject to both known and unknown risks and uncertainties that may cause theCompany's actual performance and financial results in future periods to differmaterially from these projections, estimates and forecasts. The Advisories Appendixattached hereto lists some of the material assumptions, risks and uncertainties thatthese projections, estimates and forecasts are based on and are subject to.
• Accordingly, recipients are cautioned that events or circumstances could causeactual results to differ materially from those predicted.
• Any use of information contained in this presentation is expressly forbidden.
• All dollar amounts in this presentation are expressed in Canadian dollars, unlessotherwise noted.
• Reserves and production information are presented in accordance with Canadianstandards.
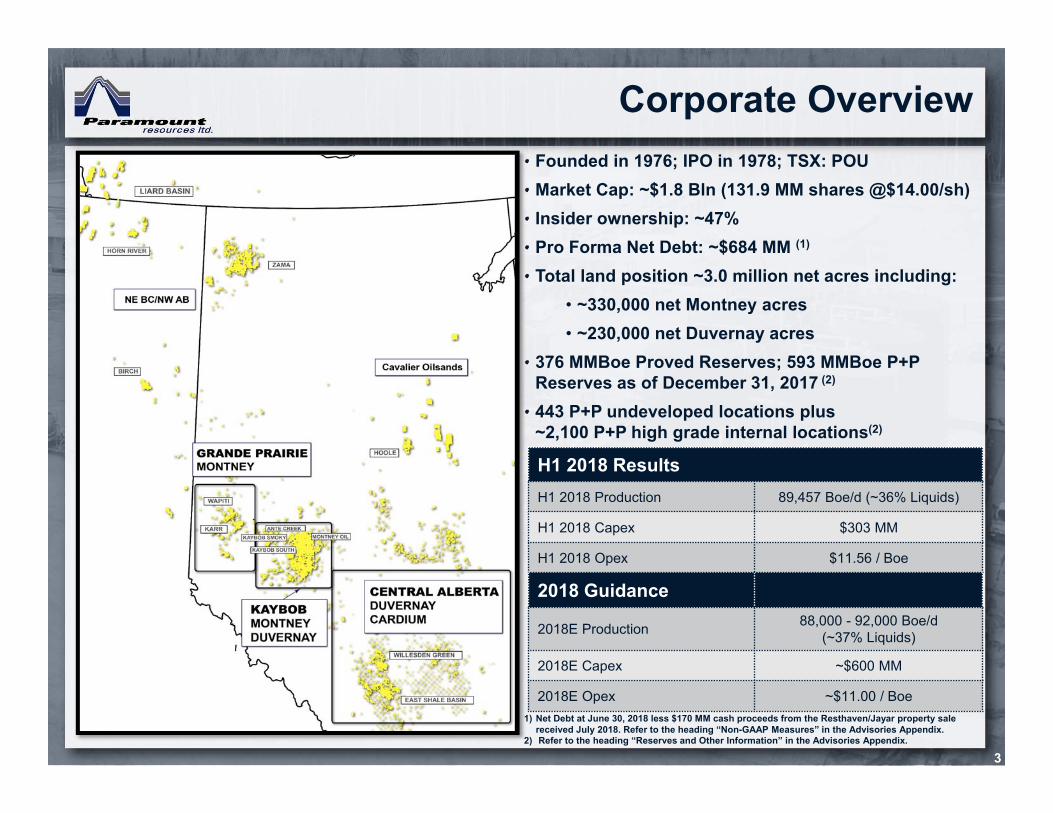
• Founded in 1976; IPO in 1978; TSX: POU• Market Cap: ~$1.8 Bln (131.9 MM shares @$14.00/sh)• Insider ownership: ~47% • Pro Forma Net Debt: ~$684 MM (1)
• Total land position ~3.0 million net acres including:• ~330,000 net Montney acres• ~230,000 net Duvernay acres
• 376 MMBoe Proved Reserves; 593 MMBoe P+P Reserves as of December 31, 2017 (2)
• 443 P+P undeveloped locations plus ~2,100 P+P high grade internal locations(2)
Corporate Overview
3
H1 2018 Results H1 2018 Production 89,457 Boe/d (~36% Liquids)
H1 2018 Capex $303 MM
H1 2018 Opex $11.56 / Boe
2018 Guidance
2018E Production 88,000 - 92,000 Boe/d (~37% Liquids)
2018E Capex ~$600 MM
2018E Opex ~$11.00 / Boe1) Net Debt at June 30, 2018 less $170 MM cash proceeds from the Resthaven/Jayar property sale
received July 2018. Refer to the heading “Non-GAAP Measures” in the Advisories Appendix. 2) Refer to the heading “Reserves and Other Information” in the Advisories Appendix.
Highlights
4
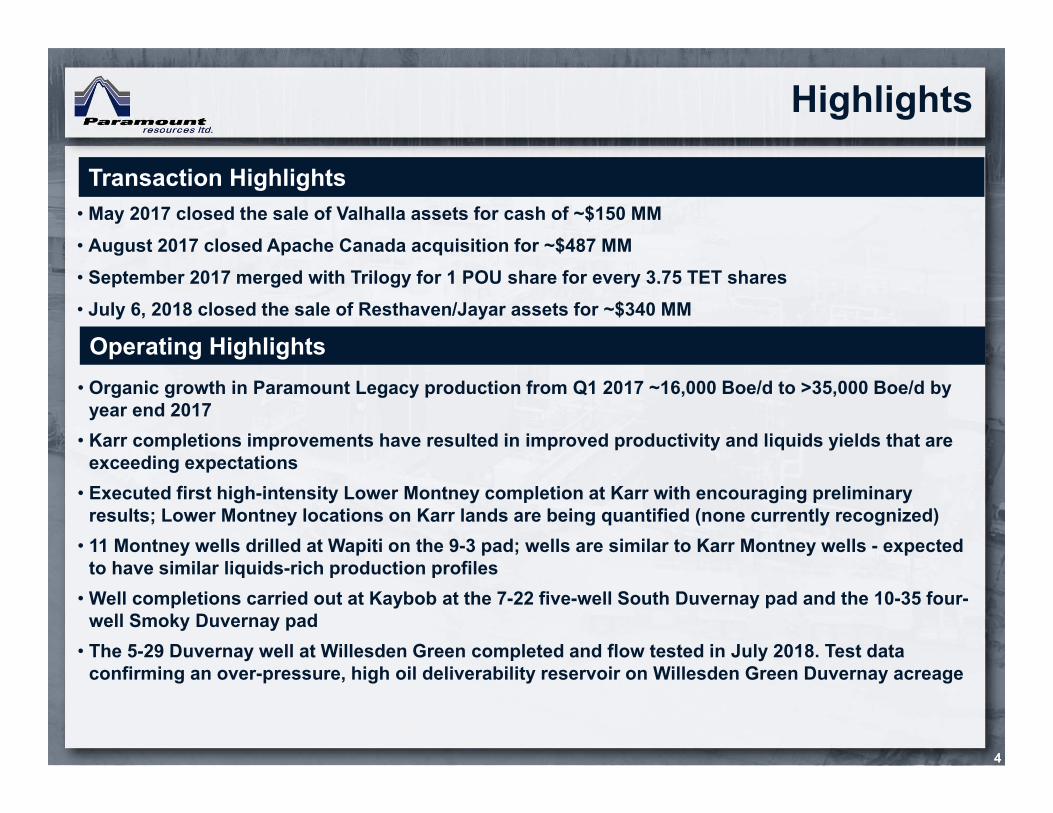
Transaction Highlights• May 2017 closed the sale of Valhalla assets for cash of ~$150 MM• August 2017 closed Apache Canada acquisition for ~$487 MM• September 2017 merged with Trilogy for 1 POU share for every 3.75 TET shares• July 6, 2018 closed the sale of Resthaven/Jayar assets for ~$340 MM
Operating Highlights• Organic growth in Paramount Legacy production from Q1 2017 ~16,000 Boe/d to >35,000 Boe/d by
year end 2017• Karr completions improvements have resulted in improved productivity and liquids yields that are
exceeding expectations• Executed first high-intensity Lower Montney completion at Karr with encouraging preliminary
results; Lower Montney locations on Karr lands are being quantified (none currently recognized)• 11 Montney wells drilled at Wapiti on the 9-3 pad; wells are similar to Karr Montney wells - expected
to have similar liquids-rich production profiles• Well completions carried out at Kaybob at the 7-22 five-well South Duvernay pad and the 10-35 four-
well Smoky Duvernay pad • The 5-29 Duvernay well at Willesden Green completed and flow tested in July 2018. Test data
confirming an over-pressure, high oil deliverability reservoir on Willesden Green Duvernay acreage
Higher Sales & Stronger Balance Sheet
5
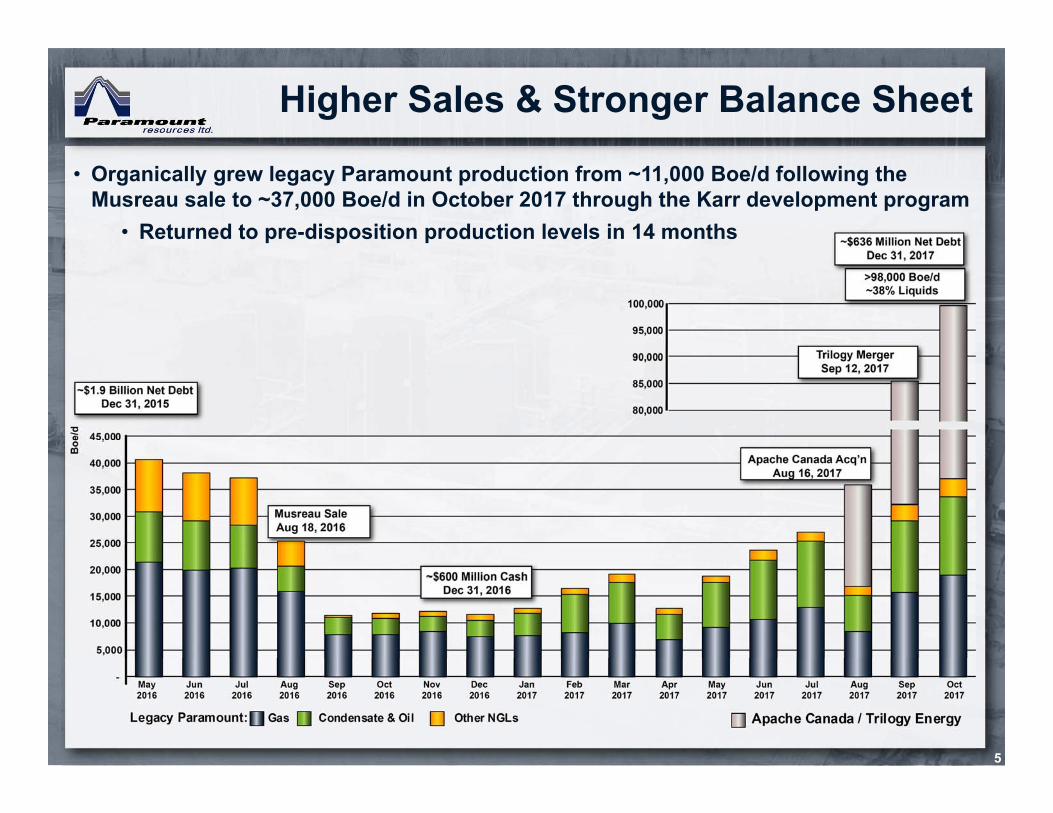
• Organically grew legacy Paramount production from ~11,000 Boe/d following the Musreau sale to ~37,000 Boe/d in October 2017 through the Karr development program
• Returned to pre-disposition production levels in 14 months
Strategic Transactions
6
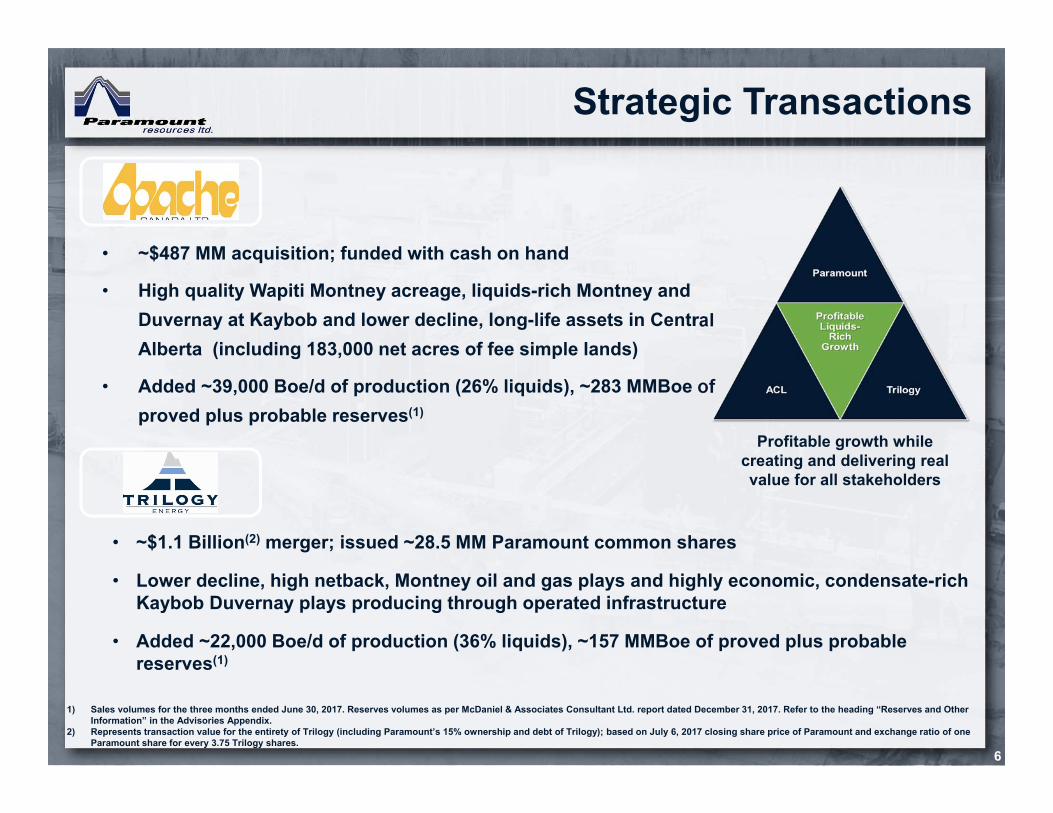
• ~$487 MM acquisition; funded with cash on hand
• High quality Wapiti Montney acreage, liquids-rich Montney and Duvernay at Kaybob and lower decline, long-life assets in Central Alberta (including 183,000 net acres of fee simple lands)
• Added ~39,000 Boe/d of production (26% liquids), ~283 MMBoe of proved plus probable reserves(1)
1) Sales volumes for the three months ended June 30, 2017. Reserves volumes as per McDaniel & Associates Consultant Ltd. report dated December 31, 2017. Refer to the heading “Reserves and Other Information” in the Advisories Appendix.
2) Represents transaction value for the entirety of Trilogy (including Paramount’s 15% ownership and debt of Trilogy); based on July 6, 2017 closing share price of Paramount and exchange ratio of one Paramount share for every 3.75 Trilogy shares.
• ~$1.1 Billion(2) merger; issued ~28.5 MM Paramount common shares
• Lower decline, high netback, Montney oil and gas plays and highly economic, condensate-rich Kaybob Duvernay plays producing through operated infrastructure
• Added ~22,000 Boe/d of production (36% liquids), ~157 MMBoe of proved plus probable reserves(1)
Profitable growth while creating and delivering real value for all stakeholders
Diversified Montney and Duvernay Assets
7
1) Refer to the heading “Reserves and Other Information” in the Advisories Appendix. 2) Breakeven analysis discounted at 10 percent before tax, based on internal type well assumptions using constant costs, FX rate of $0.80 $US/$C and AECO basis of US$1.00/MMbtu. Breakeven oil prices
based on a constant NYMEX gas price of US$3.00/MMbtu. Breakeven gas prices based on a constant WTI oil price of US$50.00/Bbl.3) Wellhead production volumes are before surface losses and shrinkage. Liquids volumes refer to C5+ volumes only.
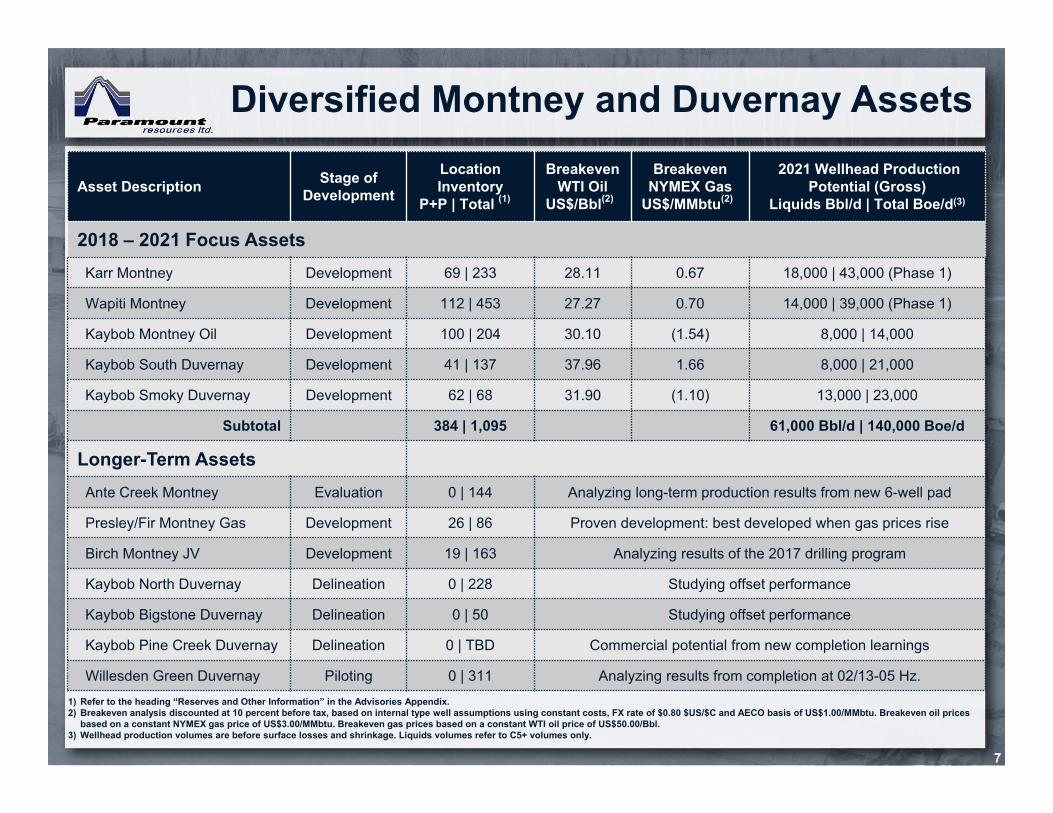
Asset Description Stage of Development
Location Inventory
P+P | Total (1)(1)
Breakeven WTI Oil
US$/Bbl(2)()
BreakevenNYMEX Gas
US$/MMbtu(2)()
2021 Wellhead ProductionPotential (Gross)
Liquids Bbl/d | Total Boe/d(3)
2018 – 2021 Focus AssetsKarr Montney Development 69 | 233 28.11 0.67 18,000 | 43,000 (Phase 1)
Wapiti Montney Development 112 | 453 27.27 0.70 14,000 | 39,000 (Phase 1)
Kaybob Montney Oil Development 100 | 204 30.10 (1.54) 8,000 | 14,000
Kaybob South Duvernay Development 41 | 137 37.96 1.66 8,000 | 21,000
Kaybob Smoky Duvernay Development 62 | 68 31.90 (1.10) 13,000 | 23,000
Subtotal 384 | 1,095 61,000 Bbl/d | 140,000 Boe/d
Longer-Term AssetsAnte Creek Montney Evaluation 0 | 144 Analyzing long-term production results from new 6-well pad
Presley/Fir Montney Gas Development 26 | 86 Proven development: best developed when gas prices rise
Birch Montney JV Development 19 | 163 Analyzing results of the 2017 drilling program
Kaybob North Duvernay Delineation 0 | 228 Studying offset performance
Kaybob Bigstone Duvernay Delineation 0 | 50 Studying offset performance
Kaybob Pine Creek Duvernay Delineation 0 | TBD Commercial potential from new completion learnings
Willesden Green Duvernay Piloting 0 | 311 Analyzing results from completion at 02/13-05 Hz.
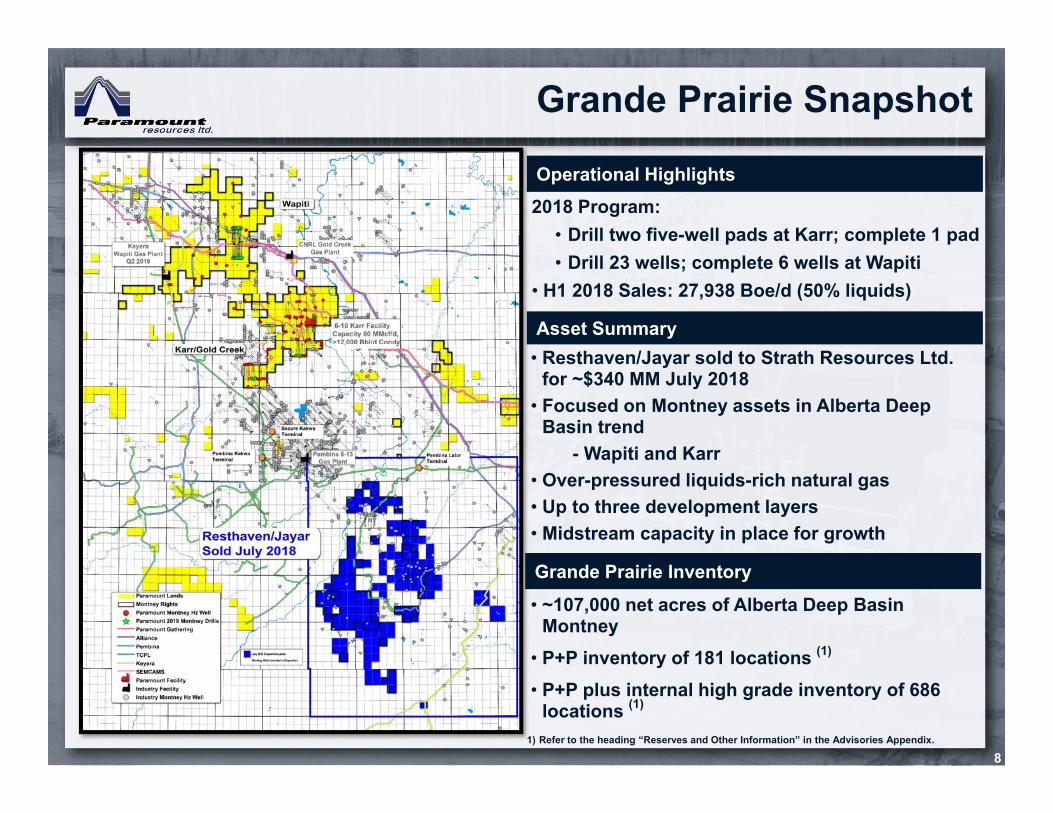
• ~107,000 net acres of Alberta Deep Basin Montney
• P+P inventory of 181 locations (1)
• P+P plus internal high grade inventory of 686 locations (1)
Grande Prairie Snapshot
8
Operational Highlights2018 Program:
• Drill two five-well pads at Karr; complete 1 pad• Drill 23 wells; complete 6 wells at Wapiti
• H1 2018 Sales: 27,938 Boe/d (50% liquids)
Asset Summary• Resthaven/Jayar sold to Strath Resources Ltd.
for ~$340 MM July 2018• Focused on Montney assets in Alberta Deep
Basin trend- Wapiti and Karr
• Over-pressured liquids-rich natural gas• Up to three development layers• Midstream capacity in place for growth• Cretaceous upside across the Deep Basin trendGrande Prairie Inventory
1) Refer to the heading “Reserves and Other Information” in the Advisories Appendix.
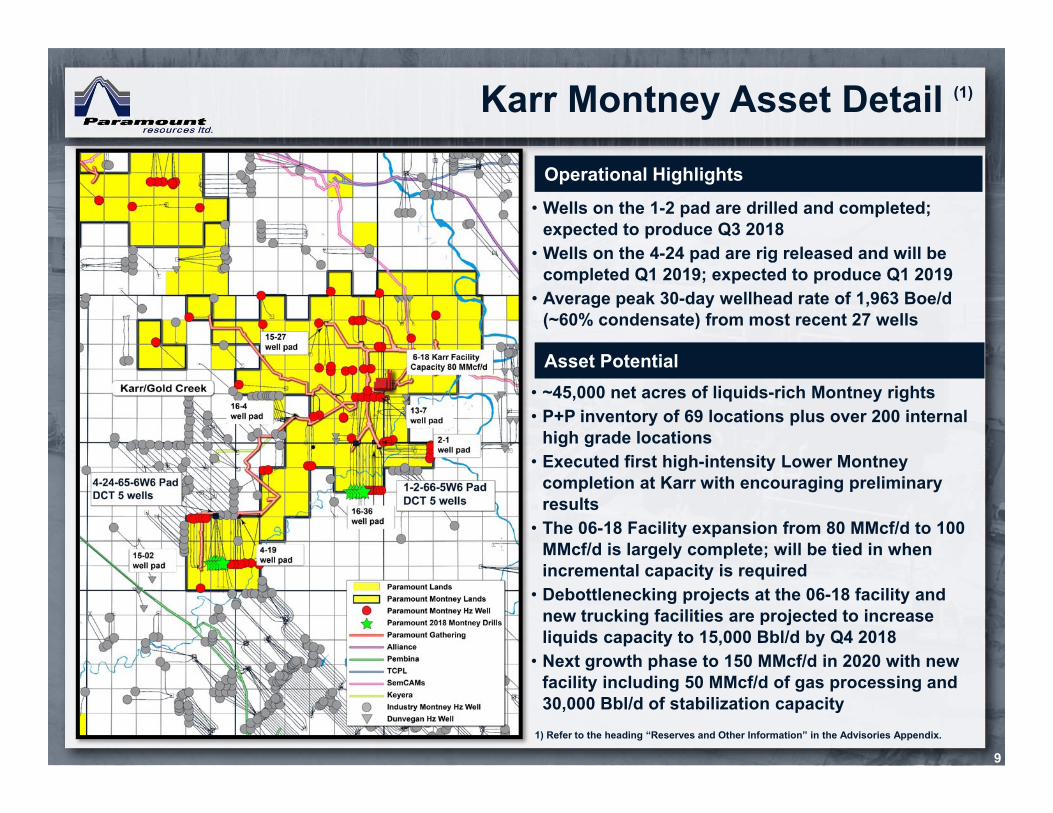
Karr Montney Asset Detail (1)
9
Operational Highlights• Wells on the 1-2 pad are drilled and completed;
expected to produce Q3 2018• Wells on the 4-24 pad are rig released and will be
completed Q1 2019; expected to produce Q1 2019• Average peak 30-day wellhead rate of 1,963 Boe/d
(~60% condensate) from most recent 27 wells
Asset Potential• ~45,000 net acres of liquids-rich Montney rights• P+P inventory of 69 locations plus over 200 internal
high grade locations • Executed first high-intensity Lower Montney
completion at Karr with encouraging preliminary results
• The 06-18 Facility expansion from 80 MMcf/d to 100 MMcf/d is largely complete; will be tied in when incremental capacity is required
• Debottlenecking projects at the 06-18 facility and new trucking facilities are projected to increase liquids capacity to 15,000 Bbl/d by Q4 2018
• Next growth phase to 150 MMcf/d in 2020 with new facility including 50 MMcf/d of gas processing and 30,000 Bbl/d of stabilization capacity
1) Refer to the heading “Reserves and Other Information” in the Advisories Appendix.

Karr Montney P+P Type-Well (1)
10
Note: Includes 7 month spud to first production time and capital for gathering/compression nodes.
Karr West Unit
Wellhead IP30 Boe/d 2,112
Wellhead IP30 Condensate % 67
Total Sales Gas Bcf 4.8
Total Sales Condensate MBbl 569
Total Sales Volume MBoe 1,428
DCET (multi-well pad) MM$ 12.8
Btax NPV10 MM$ 10.4
Btax Return % 68
Payout Months 11
Lifetime CGR Bbl/MMcf 118
Karr East Unit
Wellhead IP30 Boe/d 1,632
Wellhead IP30 Condensate % 54
Total Sales Gas Bcf 5.2
Total Sales Condensate MBbl 468
Total Sales Volume MBoe 1,410
DCET (multi-well pad) MM$ 12.8
Btax NPV10 MM$ 7.0
Btax Return % 47
Payout Months 16
Lifetime CGR Bbl/MMcf 96
Lateral Length = 3,000mProppant Loading = 1,565 lb/ft (2.3 t/m) Stages = 75
Lateral Length = 3,000mProppant Loading = 1,565 lb/ft (2.3 t/m)Stages = 75
1) Based on Management’s estimates. US$50/Bbl WTI & US$3.00/MMbtu NYMEX, US$1.00/MMbtu AECO Basis & FX US$/C$0.80. Refer to the heading “Reserves and Other Information” in the Advisories Appendix.
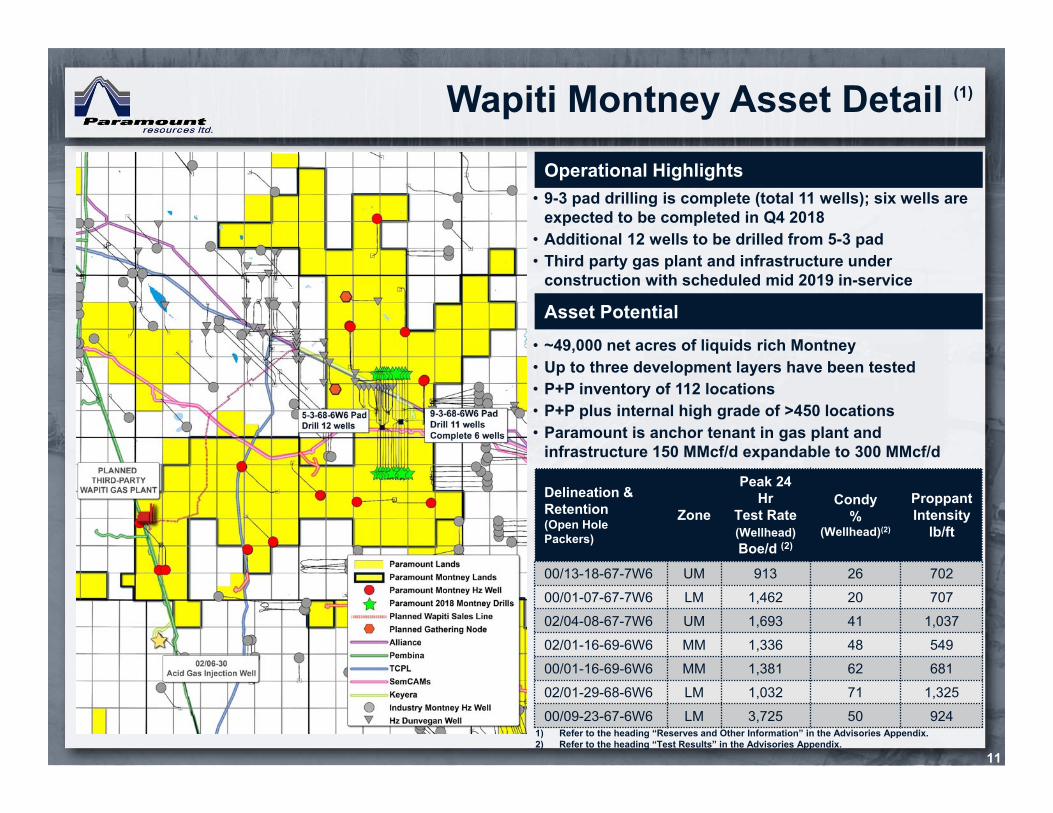
Wapiti Montney Asset Detail (1)
11
Operational Highlights• 9-3 pad drilling is complete (total 11 wells); six wells are
expected to be completed in Q4 2018• Additional 12 wells to be drilled from 5-3 pad• Third party gas plant and infrastructure under
construction with scheduled mid 2019 in-service
Asset Potential• ~49,000 net acres of liquids rich Montney• Up to three development layers have been tested• P+P inventory of 112 locations • P+P plus internal high grade of >450 locations• Paramount is anchor tenant in gas plant and
infrastructure 150 MMcf/d expandable to 300 MMcf/d
Delineation & Retention(Open Hole Packers)
Zone
Peak 24 Hr
Test Rate (Wellhead)Boe/d (2)
Condy%
(Wellhead)(2)
ProppantIntensity
lb/ft
00/13-18-67-7W6 UM 913 26 70200/01-07-67-7W6 LM 1,462 20 70702/04-08-67-7W6 UM 1,693 41 1,03702/01-16-69-6W6 MM 1,336 48 54900/01-16-69-6W6 MM 1,381 62 68102/01-29-68-6W6 LM 1,032 71 1,32500/09-23-67-6W6 LM 3,725 50 924
1) Refer to the heading “Reserves and Other Information” in the Advisories Appendix.2) Refer to the heading “Test Results” in the Advisories Appendix.
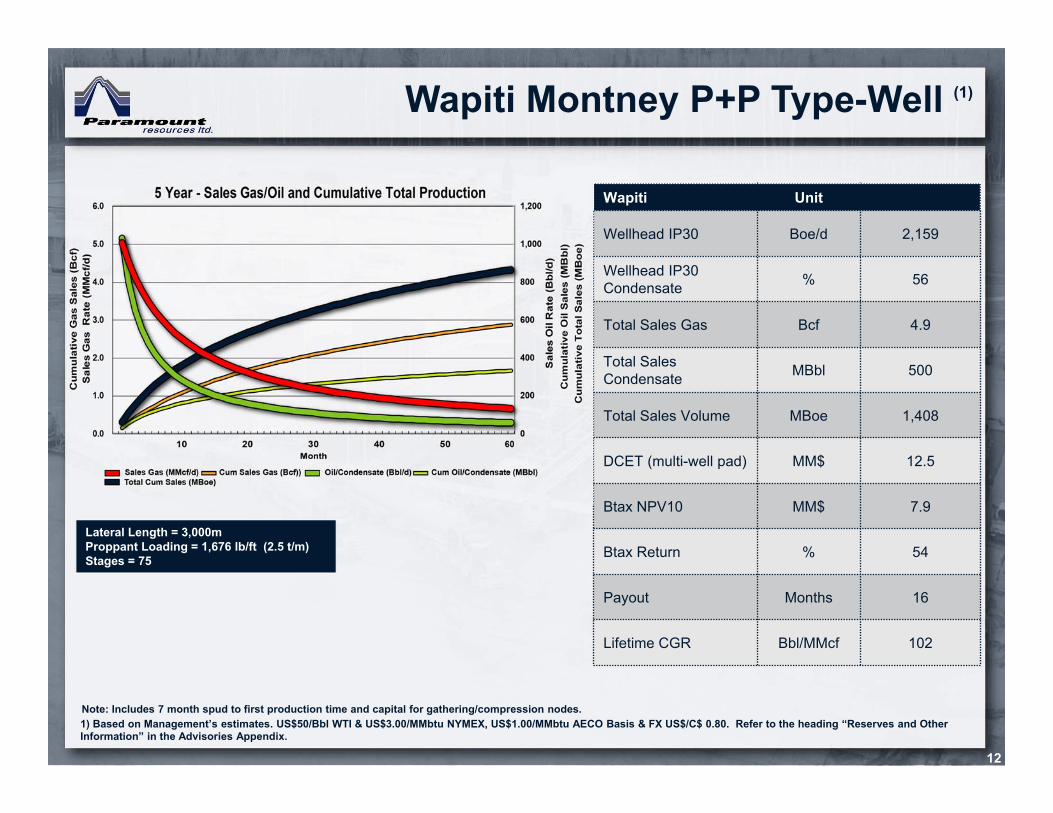
Wapiti Montney P+P Type-Well (1)
12
Note: Includes 7 month spud to first production time and capital for gathering/compression nodes.
Wapiti Unit
Wellhead IP30 Boe/d 2,159
Wellhead IP30Condensate % 56
Total Sales Gas Bcf 4.9
Total Sales Condensate MBbl 500
Total Sales Volume MBoe 1,408
DCET (multi-well pad) MM$ 12.5
Btax NPV10 MM$ 7.9
Btax Return % 54
Payout Months 16
Lifetime CGR Bbl/MMcf 102
Lateral Length = 3,000mProppant Loading = 1,676 lb/ft (2.5 t/m)Stages = 75
1) Based on Management’s estimates. US$50/Bbl WTI & US$3.00/MMbtu NYMEX, US$1.00/MMbtu AECO Basis & FX US$/C$ 0.80. Refer to the heading “Reserves and Other Information” in the Advisories Appendix.
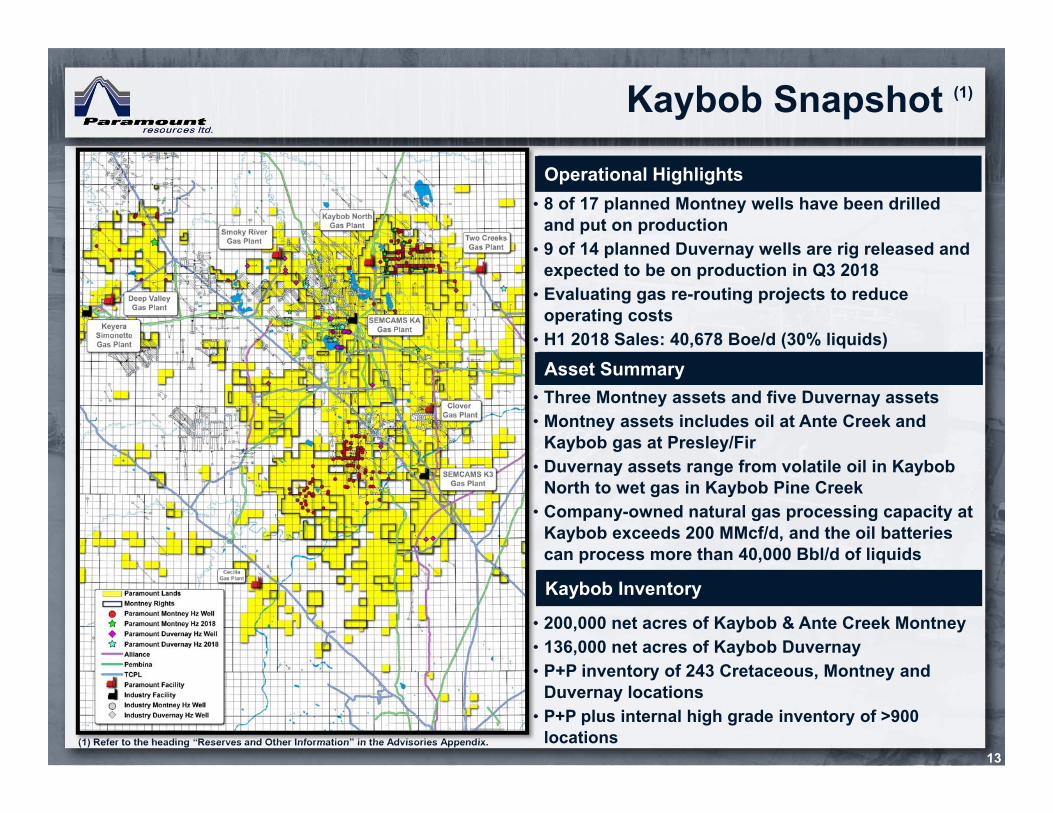
Kaybob Snapshot (1)
13
Operational Highlights• 8 of 17 planned Montney wells have been drilled
and put on production• 9 of 14 planned Duvernay wells are rig released and
expected to be on production in Q3 2018• Evaluating gas re-routing projects to reduce
operating costs• H1 2018 Sales: 40,678 Boe/d (30% liquids)
Asset Summary• Three Montney assets and five Duvernay assets• Montney assets includes oil at Ante Creek and
Kaybob gas at Presley/Fir• Duvernay assets range from volatile oil in Kaybob
North to wet gas in Kaybob Pine Creek• Company-owned natural gas processing capacity at
Kaybob exceeds 200 MMcf/d, and the oil batteries can process more than 40,000 Bbl/d of liquids
Kaybob Inventory
• 200,000 net acres of Kaybob & Ante Creek Montney• 136,000 net acres of Kaybob Duvernay • P+P inventory of 243 Cretaceous, Montney and
Duvernay locations• P+P plus internal high grade inventory of >900
locations(1) Refer to the heading “Reserves and Other Information” in the Advisories Appendix.

Kaybob Duvernay Asset Details (1)
14
Operational Highlights• Kaybob Smoky 10-35 pad: 4 wells drilled and completed;
expected to be brought on production Q3 2018• Kaybob South 7-22 pad: 5 wells drilled and completed;
currently producing on clean up • Special projects include fibre optics and micro-seismic
• Kaybob South 2-28 pad: 5 wells scheduled to commence drilling late in Q3
Asset Potential• ~136,000 core Kaybob Duvernay acres • Development focus on Kaybob Smoky and Kaybob
South• P+P inventory of >100 locations• P+P plus internal high grade >200 locations
Kaybob Smoky• Near-term production to Smoky 06-16 Gas Plant with
two options for longer-term growth including Kaybob 08-09 Gas Plant and SemCAMs KA
Kaybob South• Existing 40 MMcf/d third party capacity from field to
sales with expansion options for up to 40 MMcf/d of incremental capacity
(1) Refer to the heading “Reserves and Other Information” in the Advisories Appendix.
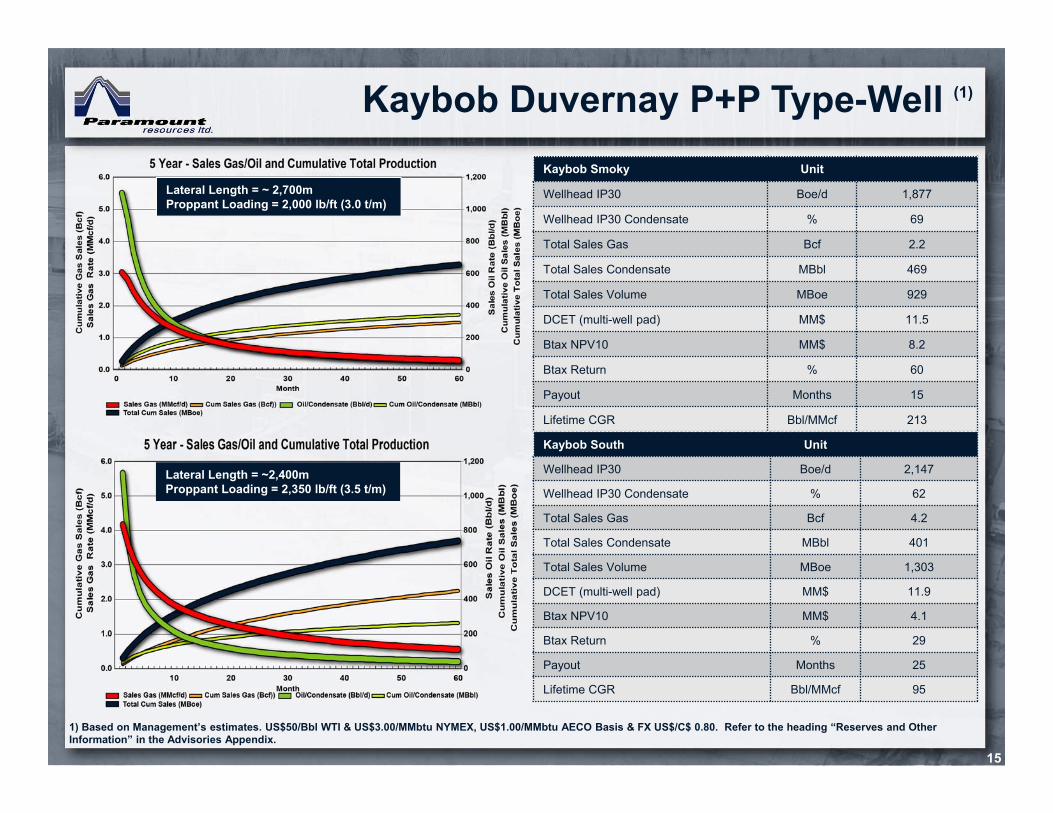
Kaybob Duvernay P+P Type-Well (1)
15
Kaybob Smoky Unit
Wellhead IP30 Boe/d 1,877
Wellhead IP30 Condensate % 69
Total Sales Gas Bcf 2.2
Total Sales Condensate MBbl 469
Total Sales Volume MBoe 929
DCET (multi-well pad) MM$ 11.5
Btax NPV10 MM$ 8.2
Btax Return % 60
Payout Months 15
Lifetime CGR Bbl/MMcf 213
Kaybob South Unit
Wellhead IP30 Boe/d 2,147
Wellhead IP30 Condensate % 62
Total Sales Gas Bcf 4.2
Total Sales Condensate MBbl 401
Total Sales Volume MBoe 1,303
DCET (multi-well pad) MM$ 11.9
Btax NPV10 MM$ 4.1
Btax Return % 29
Payout Months 25
Lifetime CGR Bbl/MMcf 95
Lateral Length = ~ 2,700mProppant Loading = 2,000 lb/ft (3.0 t/m)
Lateral Length = ~2,400mProppant Loading = 2,350 lb/ft (3.5 t/m)
1) Based on Management’s estimates. US$50/Bbl WTI & US$3.00/MMbtu NYMEX, US$1.00/MMbtu AECO Basis & FX US$/C$ 0.80. Refer to the heading “Reserves and Other Information” in the Advisories Appendix.
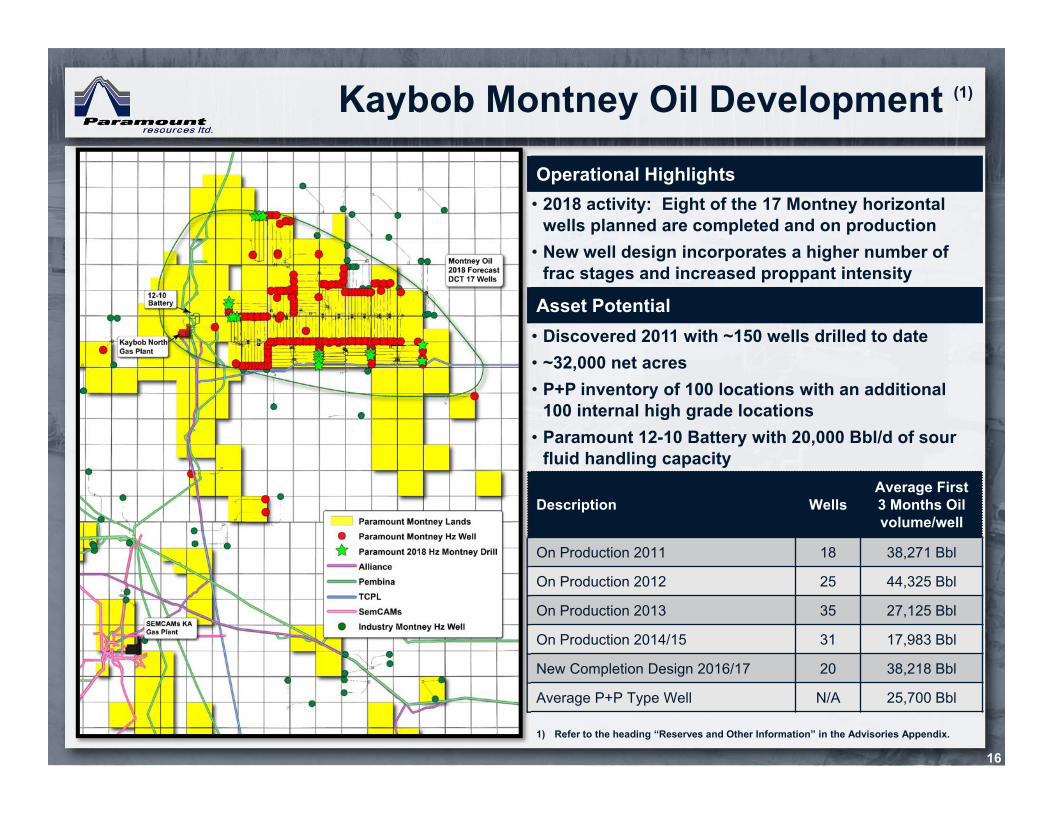
Kaybob Montney Oil Development (1)
16
Operational Highlights• 2018 activity: Eight of the 17 Montney horizontal
wells planned are completed and on production• New well design incorporates a higher number of
frac stages and increased proppant intensity
Asset Potential• Discovered 2011 with ~150 wells drilled to date• ~32,000 net acres • P+P inventory of 100 locations with an additional
100 internal high grade locations • Paramount 12-10 Battery with 20,000 Bbl/d of sour
fluid handling capacity
Description Wells Average First 3 Months Oilvolume/well
On Production 2011 18 38,271 Bbl
On Production 2012 25 44,325 Bbl
On Production 2013 35 27,125 Bbl
On Production 2014/15 31 17,983 Bbl
New Completion Design 2016/17 20 38,218 Bbl
Average P+P Type Well N/A 25,700 Bbl
1) Refer to the heading “Reserves and Other Information” in the Advisories Appendix.
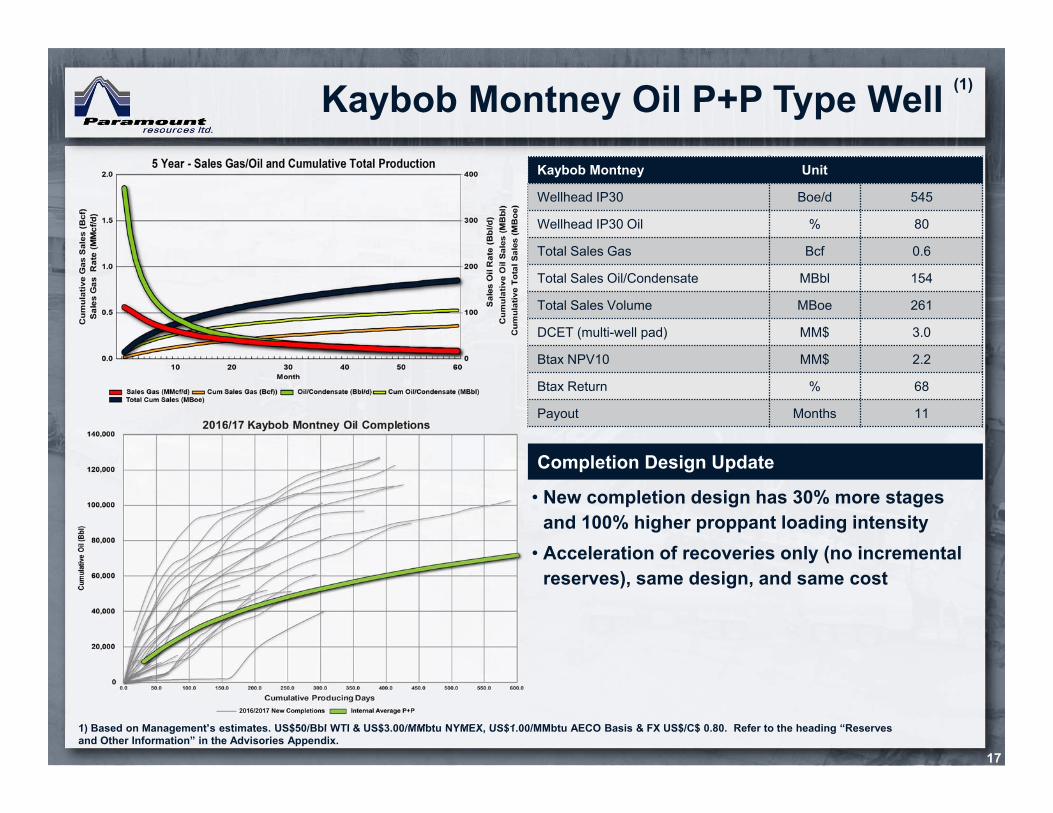
Kaybob Montney Oil P+P Type Well (1)
17
Kaybob Montney Unit
Wellhead IP30 Boe/d 545
Wellhead IP30 Oil % 80
Total Sales Gas Bcf 0.6
Total Sales Oil/Condensate MBbl 154
Total Sales Volume MBoe 261
DCET (multi-well pad) MM$ 3.0
Btax NPV10 MM$ 2.2
Btax Return % 68
Payout Months 11
Completion Design Update
• New completion design has 30% more stages and 100% higher proppant loading intensity
• Acceleration of recoveries only (no incremental reserves), same design, and same cost
1) Based on Management’s estimates. US$50/Bbl WTI & US$3.00/MMbtu NYMEX, US$1.00/MMbtu AECO Basis & FX US$/C$ 0.80. Refer to the heading “Reserves and Other Information” in the Advisories Appendix.
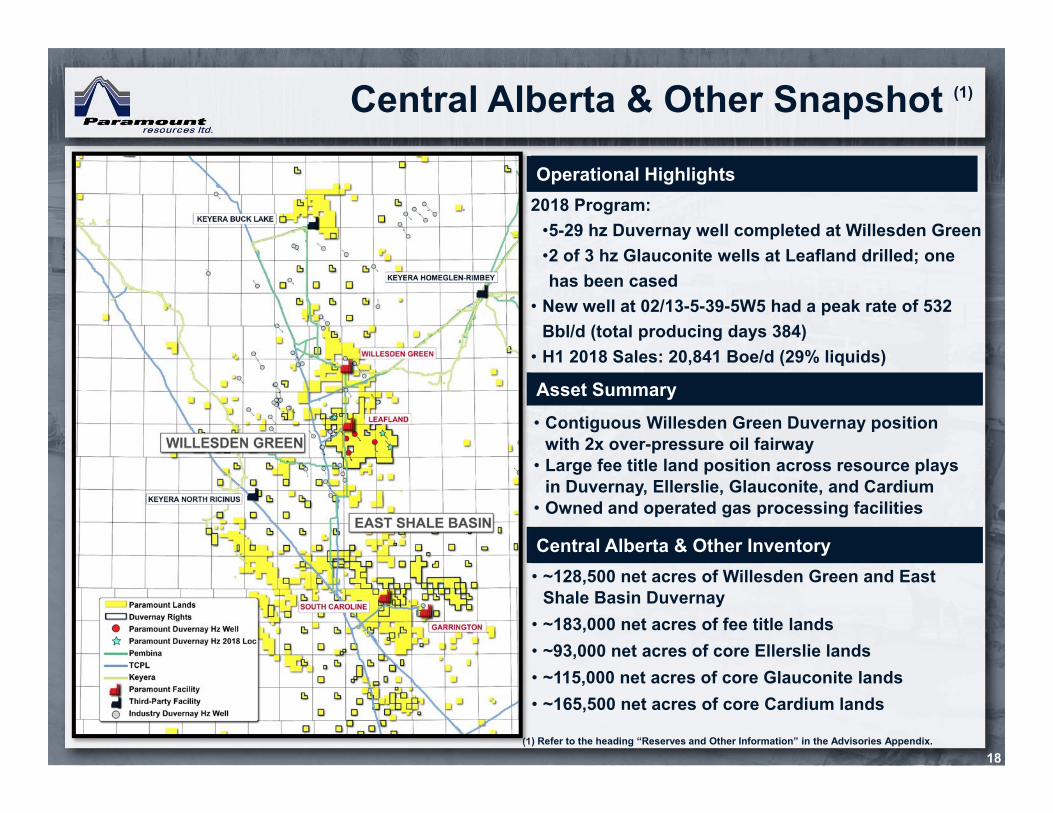
Central Alberta & Other Snapshot (1)
18
Operational Highlights2018 Program:
•5-29 hz Duvernay well completed at Willesden Green•2 of 3 hz Glauconite wells at Leafland drilled; one has been cased
• New well at 02/13-5-39-5W5 had a peak rate of 532 Bbl/d (total producing days 384)
• H1 2018 Sales: 20,841 Boe/d (29% liquids)
Asset Summary• Contiguous Willesden Green Duvernay position
with 2x over-pressure oil fairway• Large fee title land position across resource plays
in Duvernay, Ellerslie, Glauconite, and Cardium• Owned and operated gas processing facilities
Central Alberta & Other Inventory• ~128,500 net acres of Willesden Green and East
Shale Basin Duvernay• ~183,000 net acres of fee title lands• ~93,000 net acres of core Ellerslie lands • ~115,000 net acres of core Glauconite lands • ~165,500 net acres of core Cardium lands
(1) Refer to the heading “Reserves and Other Information” in the Advisories Appendix.

Willesden Green (1)
Operational Highlights• Horizontal well at 5-29 has been completed and is
expected to be brought on production Q3 2018
Asset Potential• Duvernay Shale Play• 59,686 acres of land (100% WI) • Drilled and completed 4 Hz Duvernay wells to date• 02/13-05 Cum Production to July 1, 2018
• 310.2 MMcf Gas• 104,206 Bbl Oil
191) Refer to the heading “Reserves and Other Information” in the Advisories Appendix.
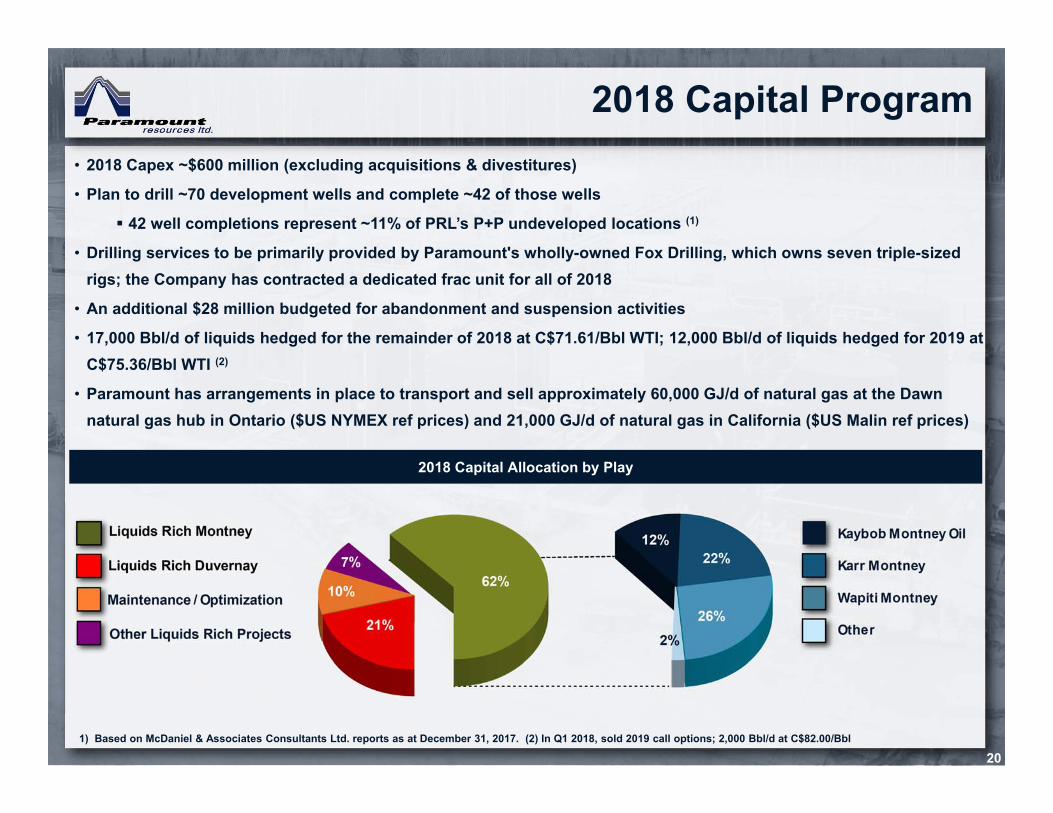
2018 Capital Program
20
2018 Capital Allocation by Play
• 2018 Capex ~$600 million (excluding acquisitions & divestitures)
• Plan to drill ~70 development wells and complete ~42 of those wells
42 well completions represent ~11% of PRL’s P+P undeveloped locations (1)
• Drilling services to be primarily provided by Paramount's wholly-owned Fox Drilling, which owns seven triple-sized rigs; the Company has contracted a dedicated frac unit for all of 2018
• An additional $28 million budgeted for abandonment and suspension activities
• 17,000 Bbl/d of liquids hedged for the remainder of 2018 at C$71.61/Bbl WTI; 12,000 Bbl/d of liquids hedged for 2019 at C$75.36/Bbl WTI (2)
• Paramount has arrangements in place to transport and sell approximately 60,000 GJ/d of natural gas at the Dawn natural gas hub in Ontario ($US NYMEX ref prices) and 21,000 GJ/d of natural gas in California ($US Malin ref prices)
1) Based on McDaniel & Associates Consultants Ltd. reports as at December 31, 2017. (2) In Q1 2018, sold 2019 call options; 2,000 Bbl/d at C$82.00/Bbl
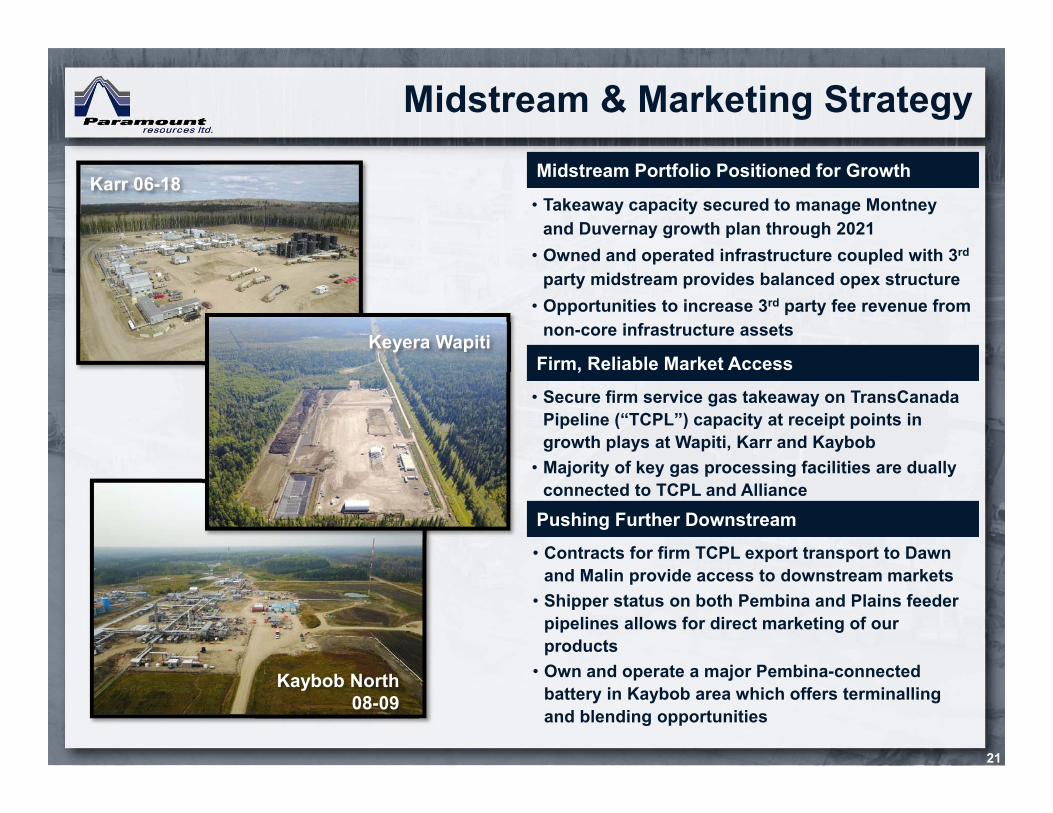
Midstream & Marketing Strategy
21
Midstream Portfolio Positioned for Growth
• Takeaway capacity secured to manage Montney and Duvernay growth plan through 2021
• Owned and operated infrastructure coupled with 3rd
party midstream provides balanced opex structure• Opportunities to increase 3rd party fee revenue from
non-core infrastructure assets
Firm, Reliable Market Access• Secure firm service gas takeaway on TransCanada
Pipeline (“TCPL”) capacity at receipt points in growth plays at Wapiti, Karr and Kaybob
• Majority of key gas processing facilities are dually connected to TCPL and Alliance
Pushing Further Downstream• Contracts for firm TCPL export transport to Dawn
and Malin provide access to downstream markets• Shipper status on both Pembina and Plains feeder
pipelines allows for direct marketing of our products
• Own and operate a major Pembina-connected battery in Kaybob area which offers terminallingand blending opportunities
Karr 06-18
Kaybob North08-09
Keyera Wapiti
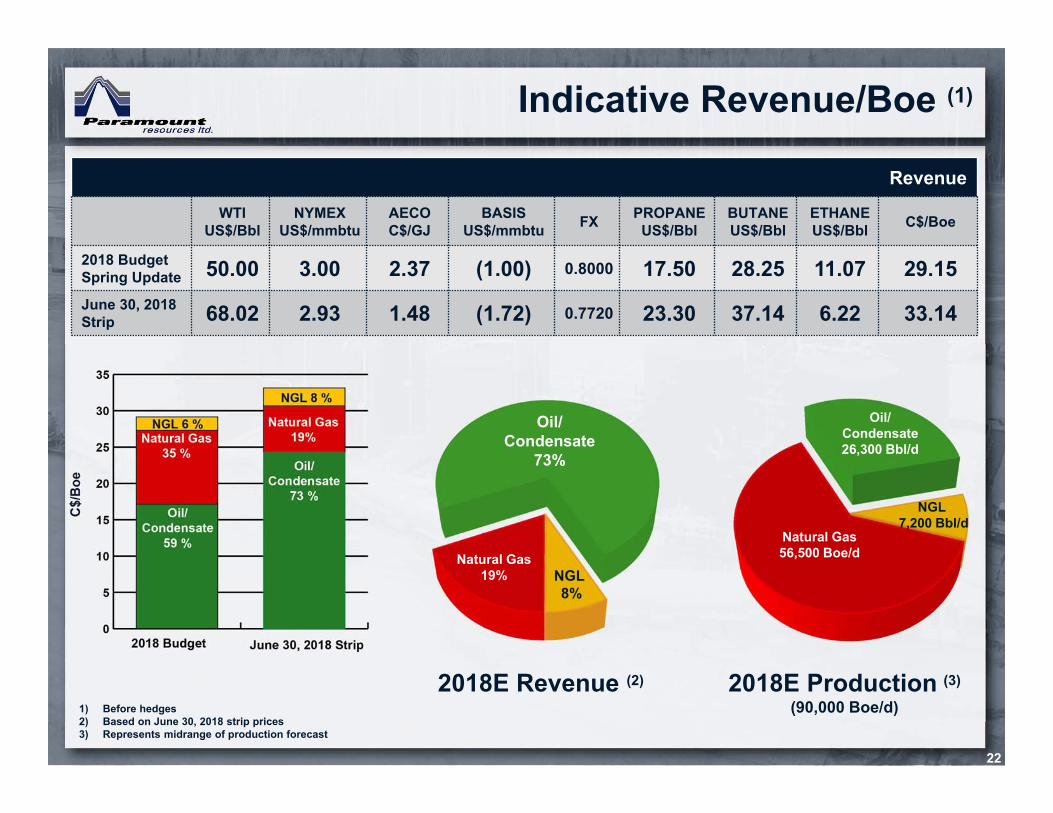
Indicative Revenue/Boe (1)
22
Revenue
WTIUS$/Bbl
NYMEXUS$/mmbtu
AECOC$/GJ
BASISUS$/mmbtu FX PROPANE
US$/BblBUTANEUS$/Bbl
ETHANEUS$/Bbl C$/Boe
2018 BudgetSpring Update 50.00 3.00 2.37 (1.00) 0.8000 17.50 28.25 11.07 29.15June 30, 2018 Strip 68.02 2.93 1.48 (1.72) 0.7720 23.30 37.14 6.22 33.14
Natural Gas19%
Natural Gas56,500 Boe/d
Oil/Condensate
73%
Oil/Condensate26,300 Bbl/d
NGL 8%
NGL 7,200 Bbl/d
2018E Production (3)
(90,000 Boe/d)2018E Revenue (2)
1) Before hedges2) Based on June 30, 2018 strip prices3) Represents midrange of production forecast
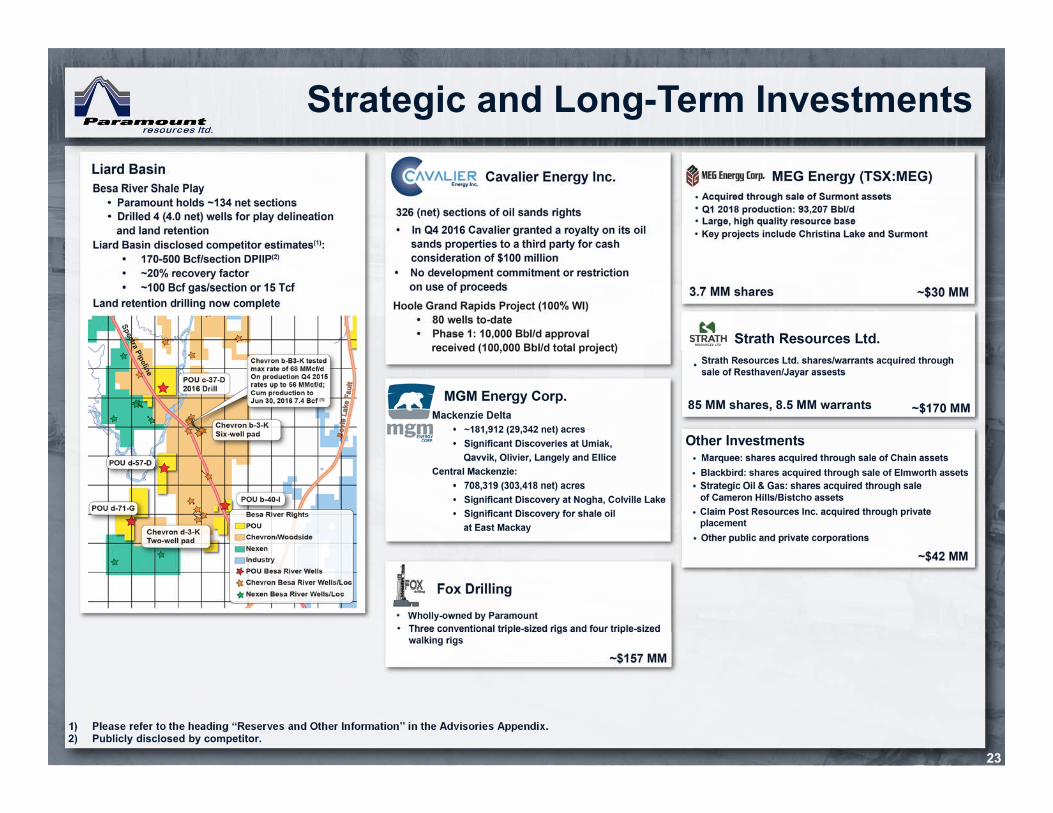
Strategic and Long-Term Investments
23
1) Please refer to the heading “Reserves and Other Information” in the Advisories Appendix. 2) Publicly disclosed by competitor.
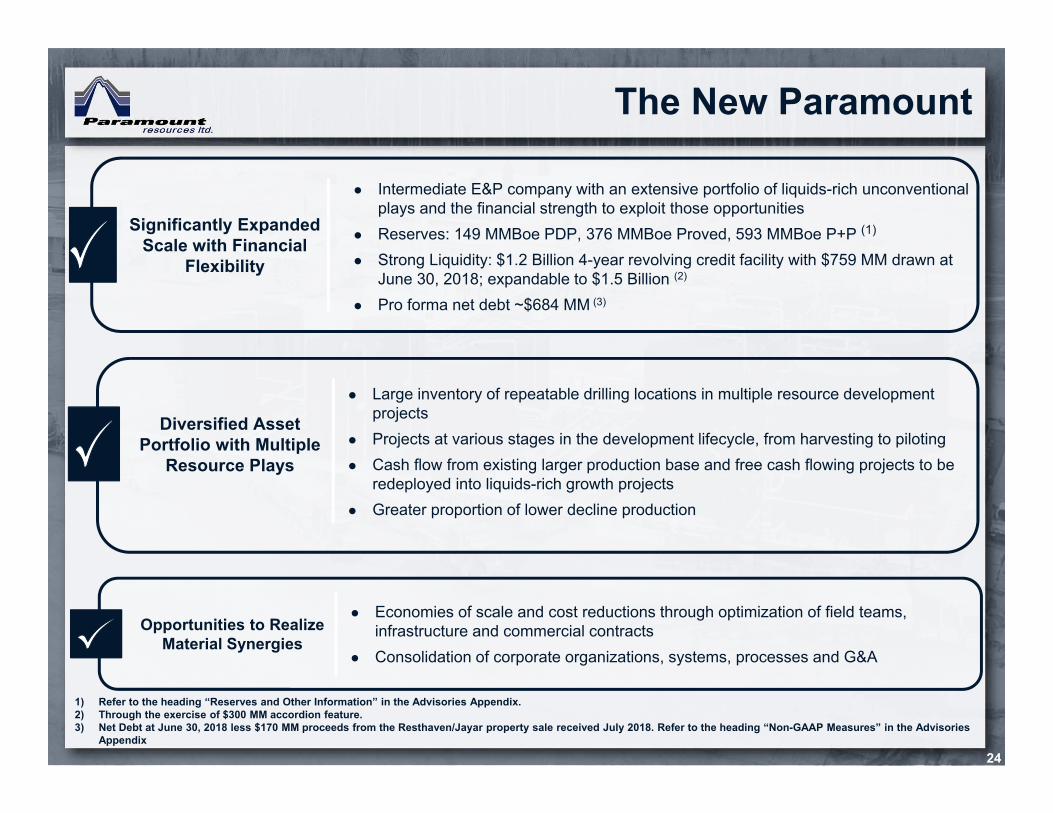
The New Paramount
24
Significantly ExpandedScale with Financial
Flexibility
Intermediate E&P company with an extensive portfolio of liquids-rich unconventional plays and the financial strength to exploit those opportunities
Reserves: 149 MMBoe PDP, 376 MMBoe Proved, 593 MMBoe P+P (1)
Strong Liquidity: $1.2 Billion 4-year revolving credit facility with $759 MM drawn at June 30, 2018; expandable to $1.5 Billion (2)
Pro forma net debt ~$684 MM (3)
Diversified Asset Portfolio with Multiple
Resource Plays
Large inventory of repeatable drilling locations in multiple resource development projects
Projects at various stages in the development lifecycle, from harvesting to piloting Cash flow from existing larger production base and free cash flowing projects to be
redeployed into liquids-rich growth projects Greater proportion of lower decline production
Opportunities to Realize Material Synergies
Economies of scale and cost reductions through optimization of field teams, infrastructure and commercial contracts
Consolidation of corporate organizations, systems, processes and G&A
1) Refer to the heading “Reserves and Other Information” in the Advisories Appendix.2) Through the exercise of $300 MM accordion feature.3) Net Debt at June 30, 2018 less $170 MM proceeds from the Resthaven/Jayar property sale received July 2018. Refer to the heading “Non-GAAP Measures” in the Advisories
Appendix

Appendix: Additional Information

Performance
26
1) Represents midpoint of 2018 production guidance2) As evaluated by McDaniel & Associates Consultants Ltd. as of December 31, 2017.
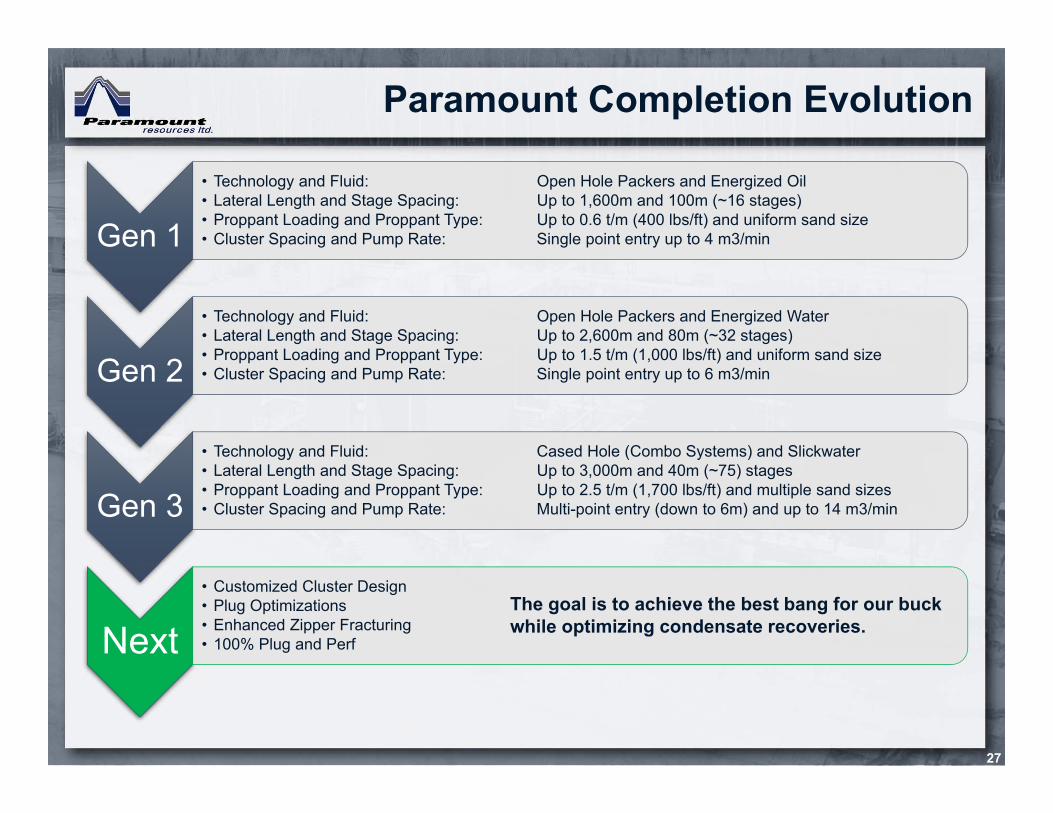
Paramount Completion Evolution
27
Gen 1
• Technology and Fluid: Open Hole Packers and Energized Oil• Lateral Length and Stage Spacing: Up to 1,600m and 100m (~16 stages)• Proppant Loading and Proppant Type: Up to 0.6 t/m (400 lbs/ft) and uniform sand size• Cluster Spacing and Pump Rate: Single point entry up to 4 m3/min
Gen 2
• Technology and Fluid: Open Hole Packers and Energized Water• Lateral Length and Stage Spacing: Up to 2,600m and 80m (~32 stages)• Proppant Loading and Proppant Type: Up to 1.5 t/m (1,000 lbs/ft) and uniform sand size• Cluster Spacing and Pump Rate: Single point entry up to 6 m3/min
Gen 3
• Technology and Fluid: Cased Hole (Combo Systems) and Slickwater• Lateral Length and Stage Spacing: Up to 3,000m and 40m (~75) stages• Proppant Loading and Proppant Type: Up to 2.5 t/m (1,700 lbs/ft) and multiple sand sizes• Cluster Spacing and Pump Rate: Multi-point entry (down to 6m) and up to 14 m3/min
Next• Customized Cluster Design• Plug Optimizations• Enhanced Zipper Fracturing• 100% Plug and Perf
The goal is to achieve the best bang for our buck while optimizing condensate recoveries.
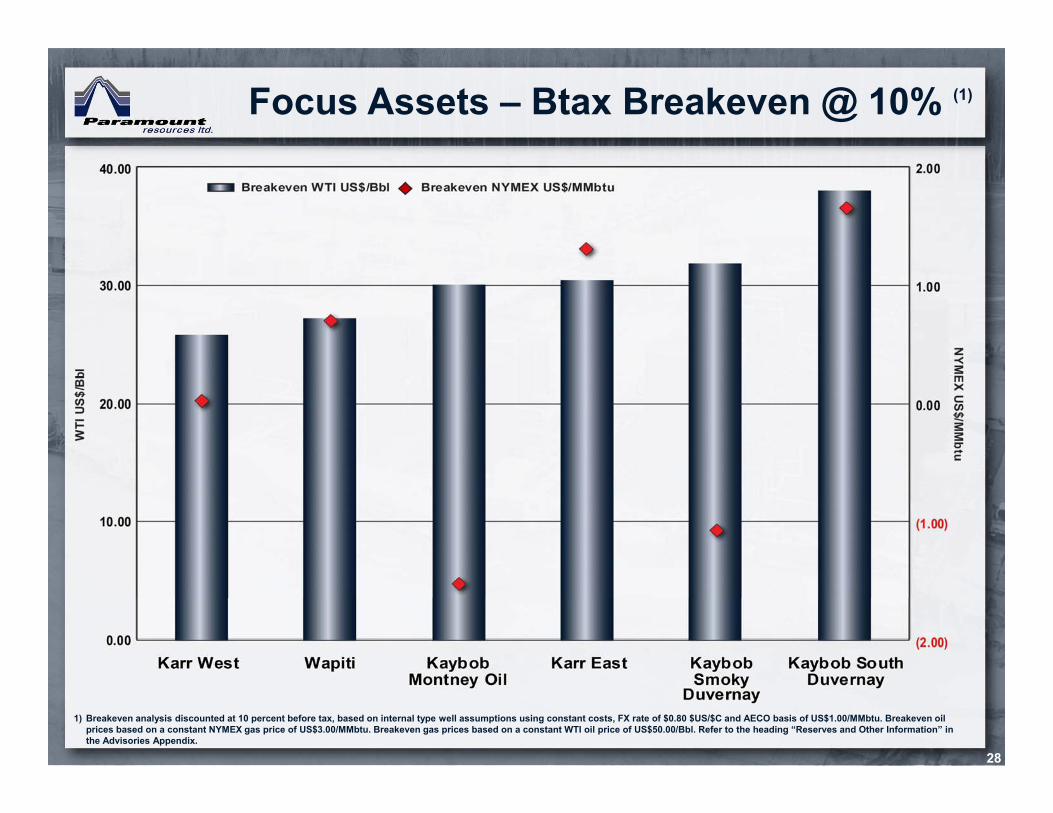
Focus Assets – Btax Breakeven @ 10% (1)
28
1) Breakeven analysis discounted at 10 percent before tax, based on internal type well assumptions using constant costs, FX rate of $0.80 $US/$C and AECO basis of US$1.00/MMbtu. Breakeven oil prices based on a constant NYMEX gas price of US$3.00/MMbtu. Breakeven gas prices based on a constant WTI oil price of US$50.00/Bbl. Refer to the heading “Reserves and Other Information” in the Advisories Appendix.
Advisories Appendix
Advisories
30
Forward-Looking Information
Certain statements in this presentation constitute forward-looking information under applicable securities legislation. Forward-looking information typically contains statements with words such as "anticipate", "believe", "estimate", "will", "expect", "plan", "intend", "propose", or similar words suggesting future outcomes or an outlook.
Forward-looking information in this presentation includes, but is not limited to: projected production and sales volumes (and the liquids component thereof); forecast capital expenditures (including the plays and activities in respect of which this capitalis expected to be spent); operating costs per BOE and abandonment and reclamation costs; estimated revenues per BOE under different pricing scenarios (and the portionsof such revenues attributable to oil and condensate, other NGLs and natural gas production and the foreign exchange rate, royalty, transportation cost and operatingexpense assumptions used to generate these estimates); reserves estimates; exploration, development and associated operational plans and strategies (including planneddrilling and completion programs, facility expansions and potential increases in third party processing and related capacities); estimated numbers of drilling locations(including high grade locations); the gross liquids and total production potential of each of the Company’s main plays as well as the estimated break-even prices forproduction from, and the projected internal rates of return and discounted net present value of wells in, each of these areas; ongoing enhancements in Paramount’s wellcompletion techniques; the projected ability of the Company’s existing midstream infrastructure and commitments to facilitate its Montney and Duvernay development plansthrough 2021; anticipated benefits from the acquisition of Apache and merger with Trilogy; projected type well production profiles (including the liquids component thereof)and associated net present value, internal rate of return and payout estimates (and the initial production rate, sales volumes, capital and operating cost, liquids yield,commodity price and other assumptions used to generate such profiles and estimates); and general business strategies and objectives.
Such forward-looking information is based on a number of assumptions which may prove to be incorrect. Assumptions have been made with respect to the following matters, in addition to any other assumptions identified in this presentation or Paramount’s continuous disclosure documents:future natural gas and liquids prices; royalty rates, taxes and capital, operating, general & administrative and other costs; foreign currency exchange rates and interestrates; general economic, market and business conditions; the ability of Paramount to obtain the required capital to finance its exploration, development and other operationsand meets its commitments and financial obligations; the ability of Paramount to obtain equipment, services, supplies and personnel in a timely manner and at anacceptable cost to carry out its activities; the ability of Paramount to secure adequate product processing, transportation, de-ethanization, fractionation and storage capacityon acceptable terms; the ability of Paramount to market its natural gas and liquids successfully to current and new customers; the ability of Paramount and its industrypartners to obtain drilling success (including in respect of anticipated production volumes, reserves additions, liquids yields and resource recoveries) and operationalimprovements, efficiencies and results consistent with expectations; the timely receipt of required governmental and regulatory approvals; and anticipated timelines andbudgets being met in respect of drilling programs and other operations.
Although Paramount believes that the expectations reflected in such forward-looking information are reasonable, undue reliance should not be placed on them as Paramount can give no assurance that such expectations will prove to be correct. Forward-looking information is based on current expectations, estimates and projections that involve a number of risks and uncertainties which could cause actual results to differ materially from those anticipated by Paramount and described in the forward-looking information. These risks and uncertainties include and/or relate (but are not limited) to:fluctuations in natural gas and liquids prices; changes in foreign currency exchange rates and interest rates; the uncertainty of estimates and projections relating to futurerevenue, future production, reserve additions, liquids yields (including condensate to natural gas ratios), resources recoveries, royalty rates, taxes and costs and expenses;the ability to secure adequate product processing, transportation, de-ethanization, fractionation and storage capacity on acceptable terms; operational risks in exploring for,developing and producing natural gas and liquids; the ability to obtain equipment, services, supplies and personnel in a timely manner and at an acceptable cost; potentialdisruptions or unexpected technical or other difficulties in designing, developing, expanding or operating new, expanded or existing facilities (including third-partyfacilities); processing, pipeline, de-ethanization, and fractionation infrastructure outages, disruptions and constraints; risks and uncertainties involving the geology of oiland gas deposits; the uncertainty of reserves estimates; general business, economic and market conditions; the ability to generate sufficient cash flow from operations andobtain financing to fund planned exploration, development and operational activities and meet current and future commitments and obligations (including productprocessing, transportation, de-ethanization, fractionation and similar commitments and obligations); changes in, or in the interpretation of, laws, regulations or policies(including environmental laws); the ability to obtain required governmental or regulatory approvals in a timely manner and to obtain and maintain leases and licenses; theanticipated benefits from the acquisition of Apache and merger with Trilogy not being realized; the effects of weather and other factors, including wildlife and environmentalrestrictions which affect field operations and access;

the timing and costs of future abandonment and reclamation obligations and potential liabilities for environmental damage and contamination; uncertainties regarding aboriginalclaims and in maintaining relationships with local populations and other stakeholders; the outcome of existing and potential lawsuits, regulatory actions, audits andassessments; and other risks and uncertainties described elsewhere in this presentation and in Paramount’s filings with Canadian securities authorities, including its AnnualInformation Form.
The foregoing list of risks is not exhaustive. Additional information concerning these and other factors which could impact Paramount are included in Paramount’s Annual Information Form. The forward-looking information contained in this presentation is made as of the date hereof and, except as required by applicable securities law, Paramount undertakes no obligation to update publicly or revise any forward-looking statements or information, whether as a result of new information, future events or otherwise.
Oil and Gas Measures and Definitions
Abbreviations
Liquids Natural Gas Oil Equivalent
Bbl Barrels Mcf Thousands of cubic feet Boe Barrels of oil equivalentMBbl Thousands of barrels Bcf Billions of cubic feet MBoe Thousands of barrels of oil equivalentBbl/d Barrels per day MMcf/d Millions of cubic feet per day MMBoe Millions of barrels of oil equivalent NGLs Natural gas liquids GJ Gigajoule Boe/d Barrels of oil equivalent per dayCondensate Pentane and heavier hydrocarbons
All natural gas equivalency volumes have been derived using the ratio of six thousand cubic feet of natural gas to one barrel of oil. Equivalency measures may be misleading, particularly if used in isolation. A conversion ratio of six thousand cubic feet of natural gas to one barrel of oil is based on an energy equivalency conversion method primarily applicable at the burner tip and does not represent a value equivalency at the well head. During the quarter ended June 30, 2018 the value ratio between crude oil and natural gas was approximately 53:1. This value ratio is significantly different from the energy equivalency ratio of 6:1. Using a 6:1 ratio would be misleading as an indication of value.
Reserves and Other Information
The Company’s reserves were evaluated by McDaniel & Associates Consultants Ltd. (ʺMcDanielʺ) as of December 31, 2017 (the ʺMcDaniel Reserve Reportʺ). P+P Undeveloped Locations referred to in this document are the gross number of undrilled well locations included in the McDaniel Reserve Report. P+P and High Grade Locations referred to in this document are the P+P Undeveloped Locations plus internally identified high grade locations which have not been assigned reserves by McDaniel. Internal high grade is based on internal economic thresholds and recovery schemes. Internal remaining is based on reduced economic thresholds and more aggressive recovery schemes. Other properties include Montney assets at Birch, Presley, Fir and Ante Creek, and Duvernay assets at Kaybob North, Kaybob Bigstone, Kaybob Pine Creek, and Willesden Green.
Estimated future net revenue is not necessarily representative of the fair market value of our properties and reserve volumes and there is no guarantee that the volumes will be recovered.
Type well information is derived from internally generated type well models. The term “IRR” means the internal rate of return. IRRs are subject to a number of assumptions and risks, some of which are described herein and, accordingly, actual IRRs achieved may be materially different than that projected.
The term "IP 30” means the initial 30 days of production. 30 day peak rate is the highest daily average production rate over a 30-day consecutive period for an individual well, measured at the wellhead. Natural gas sales volumes are approximately 10 percent lower and stabilized condensate sales volumes are approximately 15 percent lower due to shrinkage. Excludes days when the well did not produce. 30 day peak rates are measured over a short period of time and, therefore, are not necessarily indicative of average daily production, long-term performance or of ultimate recovery from a well.
Advisories (con't)
31
Paramount has provided information with respect to certain of its plays and emerging opportunities which is "analogous information" as defined in NI 51-101. This analogous information includes Paramount's internally generated production type curves for certain of its wells and internal estimates of total sales volumes. This analogous information is derived from Paramount's internal sources as well as from a variety of publicly available information sources which are predominantly independent in nature (however, it is not clear in all cases whether analogous information derived from public sources was prepared by a qualified reserves evaluator or in accordance with the Canadian Oil and Gas Evaluation Handbook). These type curves and estimates are subject to the specific assumptions identified by Paramount with respect thereto, and the other assumptions contained in these advisories. No reserves, or resources other than reserves, are assigned to these type curve estimates and, accordingly, such estimates may not be representative of the actual production rates or resources associated with Paramount's wells and properties. The estimates of reserves for individual properties may not reflect the same confidence level as estimates of reserves for all properties, due to the effects of aggregation.
Analogous information is presented on a basin, sub-basin or area basis utilizing data derived from Paramount’s internal sources as well as from a variety of publicly available sources which are predominantly independent in nature. Internal estimates are subject to the specific assumptions identified by Paramount in respect of such estimates plus other assumptions contained herein, and are not necessarily representative of the actual resources associated with Paramount’s properties.
The Liard Basin estimates set forth herein are as publicly disclosed by a large U.S. public E&P company . The resource evaluation disclosed by such E&P company was not noted as having been prepared independently or by a qualified reserves evaluator or auditor (as such terms are defined in NI 51-101) or in accordance with the Canadian Oil and Gas Evaluation Handbook. This information is relevant to Paramount’s landholdings in the Liard Basin as the information is in respect of landholdings in the Liard Basin that are close to Paramount’s lands and are, accordingly, likely to have similar geology.
Test Results
The test rates disclosed in this document represent the average rate of production at the wellhead during post clean-up production testing at the largest choke setting. Pressure transient analyses and well-test interpretations have not been carried out for any of these wells and, as such, all data should be considered preliminary until such analyses or interpretations have been done. Test results are not necessarily indicative of long-term performance or of ultimate recovery.
Non-GAAP Measures
In this presentation "Net Debt" and "Cash Flow", collectively the "Non-GAAP measures", are used and do not have any standardized meaning as prescribed by GAAP. Net Debt is a measure of the Company’s overall debt position after adjusting for certain working capital and other amounts and is used by management to assess the Company’s overall leverage position. Refer to the Liquidity and Capital Resources section of the Company’s Management’s Discussion and Analysis for the calculation of Net Debt. Cash Flow means Adjusted Funds Flow and refers to cash from operating activities before net changes in operating non-cash working capital, geological and geophysical expenses, asset retirement obligation settlements and transaction and reorganization costs. Adjusted Funds Flow is commonly used in the oil and gas industry to assist management and investors in measuring the Company’s ability to fund capital programs and meet financial obligations. Refer to the Consolidated Results section of the Company’s Management’s Discussion and Analysis for the calculation of Adjusted Funds Flow.
Non-GAAP Measures should not be considered in isolation or construed as alternatives to their most directly comparable measure calculated in accordance with GAAP, or other measures of financial performance calculated in accordance with GAAP. Non-GAAP Measures are unlikely to be comparable to similar measures presented by other issuers.
Advisories (con't)
32