Embed Size (px)
Citation preview
ParaShares: Finding the Important Basic Blocks
in Multithreaded Programs
Melanie Kambadur, Kui Tang, and Martha Kim
Columbia University, New York, NY{melanie, martha}@cs.columbia.edu, [email protected]
Abstract. Understanding and optimizing multithreaded execution is asignificant challenge. Numerous research and industrial tools debug par-allel performance by combing through program source or thread tracesfor pathologies including communication overheads, data dependencies,and load imbalances. This work takes a new approach: it ignores anyunderlying pathologies, and focuses instead on pinpointing the exact lo-cations in source code that consume the largest share of execution. Ournew metric, ParaShares, scores and ranks all basic blocks in a programbased on their share of parallel execution. For the eight benchmarks ex-amined in this paper, ParaShare rankings point to just a few importantblocks per application. The paper demonstrates two uses of this infor-mation, exploring how the important blocks vary across thread countsand input sizes, and making modest source code changes (fewer than 10lines of code) that result in 14-92% savings in parallel program runtime.
1 Introduction
With massive-scale data to analyze, explosive growth in server and mobile corecounts, and multithreading making its way into mainstream language specifi-cations such as C++ [22], parallel software is officially ubiquitous. All parallelapplications share the same fundamental goal of making the best use of resources:time, power, money, or some combination of these. To honor this goal, programsmust be performant, bug-free, scalable, and not overly difficult to write or de-bug. Parallel program optimization poses particular challenges, as developersmust uncover and address a nearly unbounded catalog of potential inefficienciesarising at any level of the stack, from relatively high level algorithmic and designchoices, to program inputs, to source language implementation, to thread libraryselection, to operating system configurations, and the target hardware platform.Correcting performance inefficiencies requires programmers to have knowledgeof, and potentially, take action at, multiple levels of the stack.
Many research and industrial tools have been introduced over the years tohelp programmers correct parallel performance inefficiencies. Generally thesetools employ one of two broad strategies. The first is to look for specific kinds oferrors, sometimes within targeted program regions such as a program’s criticalpath. For example, tools may identify load imbalances [4], long waits [16, 8],lock contention [23, 6], I/O blocking [18], or unnecessary I/O [5]. One issue with
this approach is that each type of inefficiency may need its own tool or searchprocedure. The second general strategy is to troll for multiple or broader typesof problems by tracking hardware and system events. Some tools track threadtraces and program runtimes to predict which threads will scale poorly in futureruns [9, 12]. Other tools take a hardware perspective, monitoring instructioncounts, CPU utilization, thread preemption rates, and cache latencies [14, 7,26, 15, 21, 1]. Unfortunately, linking hardware events back to software can posea number of challenges. For example, event data may need to be aggregatedacross parallel threads. Additionally, it is often difficult to connect certain eventsprecisely to software, meaning that areas of code identified as problematic maybe large.
This paper utilizes a third strategy for performance debugging. ParaSharesidentify very tiny regions of code that take up the majority of multithreadedexecution, agnostic to the type or cause of underlying performance pathologies.Their only goal is to precisely point programmers to the lines in their programthat would benefit most from optimizations. A ParaShare is a rankable scorethat measures each basic block’s share of a total parallel program’s execution.The rankings are similar to hot block analyses that report the most frequentlyexecuted basic blocks and their CPU use. However, ParaShares factor in thedegree of program parallelism at each block execution, providing a more accuratereflection of a block’s contribution to wall-clock execution time. The weightingscheme downgrades the importance of blocks that execute during highly parallelprogram phases. As a result, it ranks blocks that mostly run during serial phasesrelatively higher in importance as they tend to consume a greater fraction ofruntime.
Per block parallelism weights are enabled by parallel block vector (PBV) pro-filing [17], a recent technique which was introduced for the purpose of improvingmicro-architectural design. In the next section, we explain this new applicationof PBVs in more detail, comparing ParaShares to existing analyses and moti-vating the use of such a precise and fine-grained performance debugging tool(Sect. 2). We then present a step by step procedure for collecting and analyzingParaShares (Sect. 3). Finally, using ParaShares for eight benchmark applications,we examine how the key optimization points move as input size and parallelismvary (Sect. 4.1), and make small, ParaShare-targeted source code changes that,although only a few lines apiece, speed the benchmarks 14–92%(Sect. 4.2).
2 ParaShares
ParaShares are a new way to rank the basic blocks in a parallel program accord-ing to their relative multithreaded runtime contributions. This section definesParaShares, describes how they differ from traditional hot block analyses, givesreaders a first look at experimentally collected ParaShares, and makes a case foranalyses that focus on fine-grained regions of code.
Fig. 1: ParaShares rank basic blocks to identify those with the greatest im-
pact on parallel execution, weighting blocks by the runtime parallelism exhibited bythe application each time the block was executed.
2.1 The Basic Concept
Basic blocks are small program fragments, constrained to be a linear sequenceof instructions with a single entry point and a single exit point. As the programexecutes, some blocks will be executed very frequently, while others may executerarely or not at all. The frequently executed blocks are called “hot” and are im-portant optimization targets as they constitute a large share of an application’sdynamic work. Hot block analysis has traditionally been used for a variety ofpurposes, including JIT translation [24], garbage collection optimizations [13],simulation points analysis [19], code cache management [20], and parallel per-formance debugging, for example, in Intel’s VTune Amplifier [15].
ParaShares makes a subtle but important twist on traditional hot block anal-yses, weighting each basic block by the degree of parallelism exhibited by theprogram when the block was executed. Figure 1 illustrates the significance of thischange. On the left is a program trace that highlights the execution patterns oftwo blocks of interest, A (gray) and B (black). For simplicity, we assume thatboth blocks have the same number of instructions and equal execution times,though in actual ParaShare computations this unlikely assumption is amended(Sect. 3.1). Simple counting reveals that B executes 9 times whereas A executesonly 4, giving B a higher rank of importance. However, A may consume more ofthe program’s execution time because its executions occur during serial phasesof the program. To account for this nuance, ParaShares divides the executionsby the degree of parallelism at execution time, in this example dividing B’s 9executions by the 4 threads that ran while B executed, and dividing A’s 4 blocksby 1 for the single running thread. As a rule, parallelism is counted at the startof a basic block’s execution to resolve any overlaps in block executions betweenthreads. The resulting scores capture parallel execution shares more effectively,and in this case rank A and B in the opposite order of importance versus tradi-tional execution counts.
2.2 A First Look At Real Applications
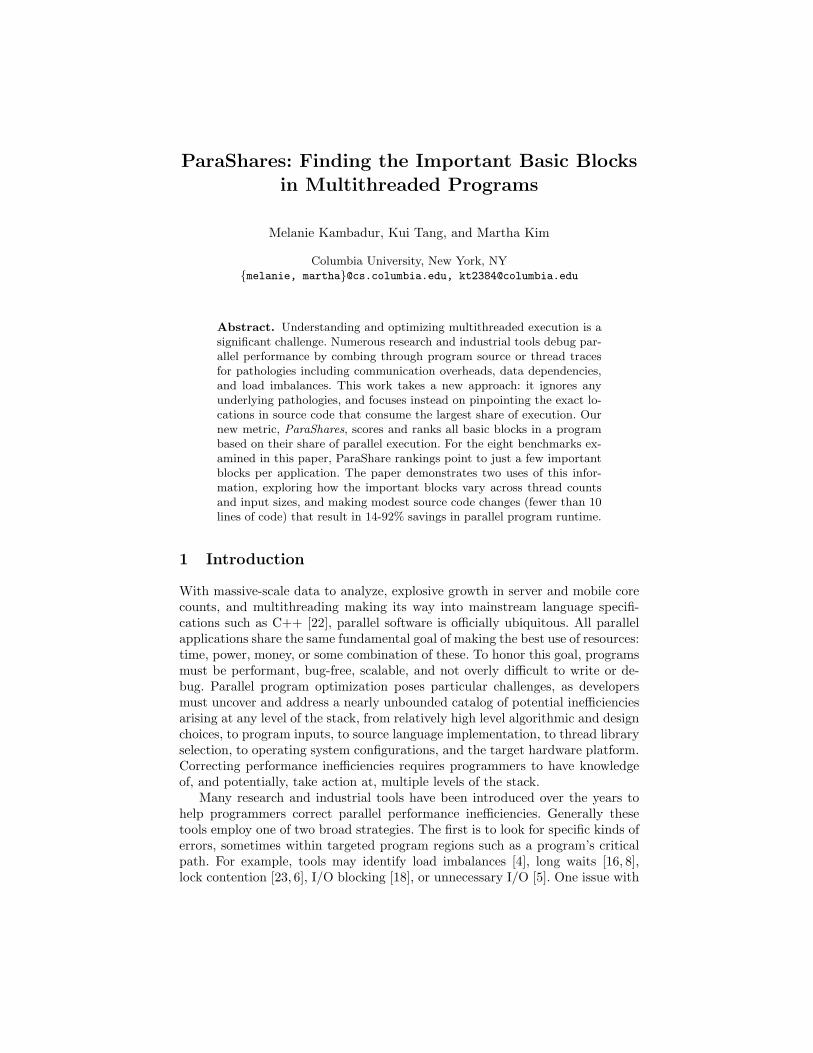
Figure 2 gives a first look at ParaShare block rankings for real applications,eight programs from the Parsec Version 3.0 [3] and Splash-2 [25] benchmark
0%
10%
20%
30%
40%
0 15 30 45 60
Par
aSha
re %
Basic Blocks
blackscholes
0%
10%
20%
30%
40%
0 100 200 300
Par
aSha
re %
Basic Blocks
streamcluster
0 150 300 450 600
Basic Blocks
canneal
0 250 500 750 1000
Basic Blocks
radiosity
0 250 500 750 1000
Basic Blocks
raytrace
0 50 100 150
Basic Blocks
swaptions
0 150 300 450 600
Basic Blocks
volrend
0 100 200 300
Basic Blocks
water_nsquared
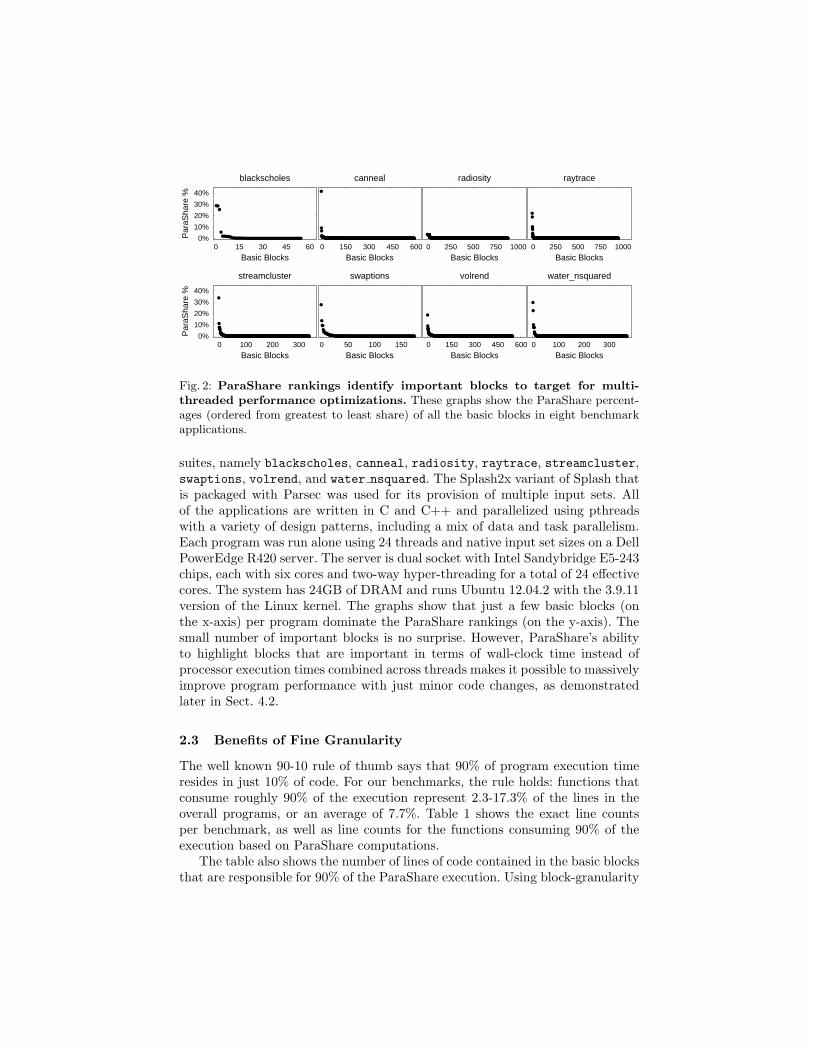
Fig. 2: ParaShare rankings identify important blocks to target for multi-
threaded performance optimizations. These graphs show the ParaShare percent-ages (ordered from greatest to least share) of all the basic blocks in eight benchmarkapplications.
suites, namely blackscholes, canneal, radiosity, raytrace, streamcluster,swaptions, volrend, and water nsquared. The Splash2x variant of Splash thatis packaged with Parsec was used for its provision of multiple input sets. Allof the applications are written in C and C++ and parallelized using pthreadswith a variety of design patterns, including a mix of data and task parallelism.Each program was run alone using 24 threads and native input set sizes on a DellPowerEdge R420 server. The server is dual socket with Intel Sandybridge E5-243chips, each with six cores and two-way hyper-threading for a total of 24 effectivecores. The system has 24GB of DRAM and runs Ubuntu 12.04.2 with the 3.9.11version of the Linux kernel. The graphs show that just a few basic blocks (onthe x-axis) per program dominate the ParaShare rankings (on the y-axis). Thesmall number of important blocks is no surprise. However, ParaShare’s abilityto highlight blocks that are important in terms of wall-clock time instead ofprocessor execution times combined across threads makes it possible to massivelyimprove program performance with just minor code changes, as demonstratedlater in Sect. 4.2.
2.3 Benefits of Fine Granularity
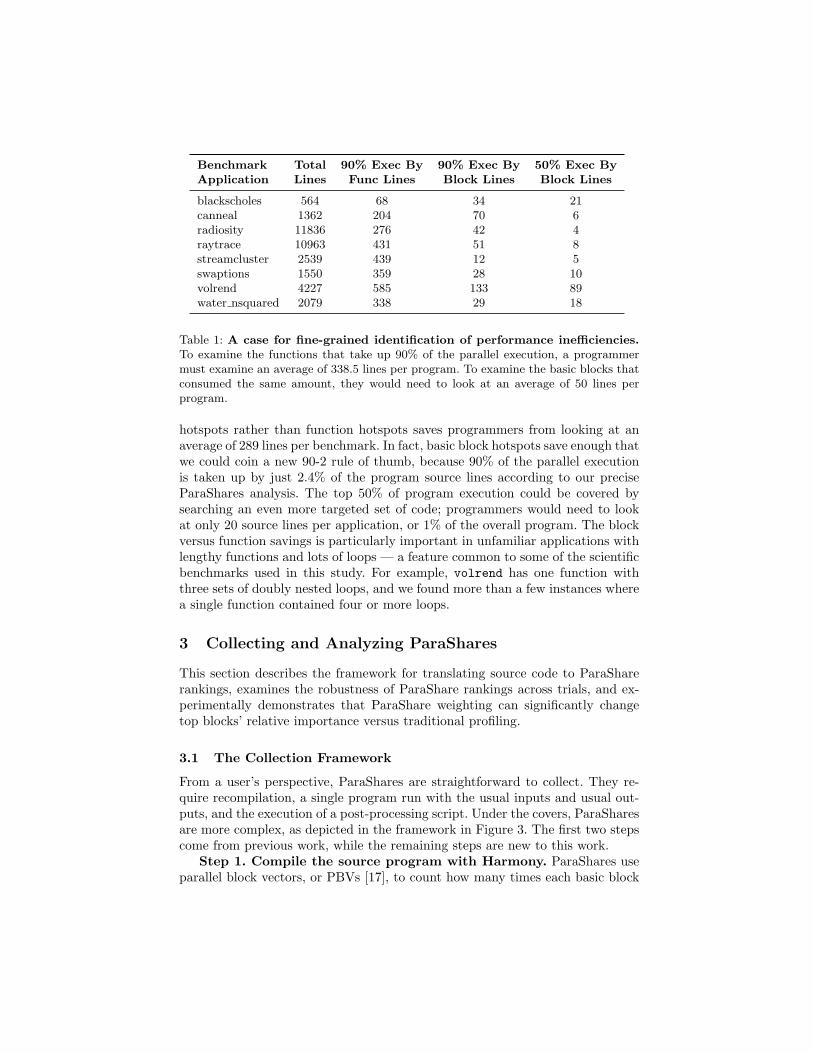
The well known 90-10 rule of thumb says that 90% of program execution timeresides in just 10% of code. For our benchmarks, the rule holds: functions thatconsume roughly 90% of the execution represent 2.3-17.3% of the lines in theoverall programs, or an average of 7.7%. Table 1 shows the exact line countsper benchmark, as well as line counts for the functions consuming 90% of theexecution based on ParaShare computations.
The table also shows the number of lines of code contained in the basic blocksthat are responsible for 90% of the ParaShare execution. Using block-granularity
Benchmark Total 90% Exec By 90% Exec By 50% Exec By
Application Lines Func Lines Block Lines Block Lines
blackscholes 564 68 34 21canneal 1362 204 70 6radiosity 11836 276 42 4raytrace 10963 431 51 8streamcluster 2539 439 12 5swaptions 1550 359 28 10volrend 4227 585 133 89water nsquared 2079 338 29 18
Table 1: A case for fine-grained identification of performance inefficiencies.
To examine the functions that take up 90% of the parallel execution, a programmermust examine an average of 338.5 lines per program. To examine the basic blocks thatconsumed the same amount, they would need to look at an average of 50 lines perprogram.
hotspots rather than function hotspots saves programmers from looking at anaverage of 289 lines per benchmark. In fact, basic block hotspots save enough thatwe could coin a new 90-2 rule of thumb, because 90% of the parallel executionis taken up by just 2.4% of the program source lines according to our preciseParaShares analysis. The top 50% of program execution could be covered bysearching an even more targeted set of code; programmers would need to lookat only 20 source lines per application, or 1% of the overall program. The blockversus function savings is particularly important in unfamiliar applications withlengthy functions and lots of loops — a feature common to some of the scientificbenchmarks used in this study. For example, volrend has one function withthree sets of doubly nested loops, and we found more than a few instances wherea single function contained four or more loops.
3 Collecting and Analyzing ParaShares
This section describes the framework for translating source code to ParaSharerankings, examines the robustness of ParaShare rankings across trials, and ex-perimentally demonstrates that ParaShare weighting can significantly changetop blocks’ relative importance versus traditional profiling.
3.1 The Collection Framework
From a user’s perspective, ParaShares are straightforward to collect. They re-quire recompilation, a single program run with the usual inputs and usual out-puts, and the execution of a post-processing script. Under the covers, ParaSharesare more complex, as depicted in the framework in Figure 3. The first two stepscome from previous work, while the remaining steps are new to this work.
Step 1. Compile the source program with Harmony. ParaShares useparallel block vectors, or PBVs [17], to count how many times each basic block
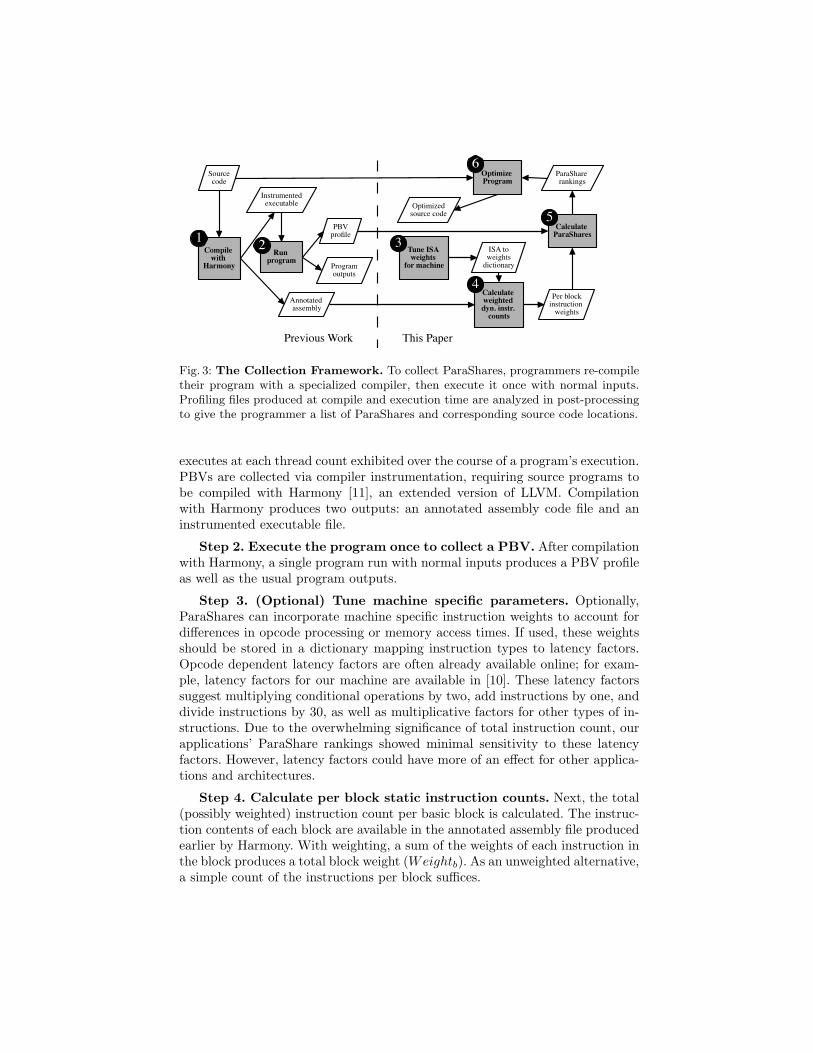
Fig. 3: The Collection Framework. To collect ParaShares, programmers re-compiletheir program with a specialized compiler, then execute it once with normal inputs.Profiling files produced at compile and execution time are analyzed in post-processingto give the programmer a list of ParaShares and corresponding source code locations.
executes at each thread count exhibited over the course of a program’s execution.PBVs are collected via compiler instrumentation, requiring source programs tobe compiled with Harmony [11], an extended version of LLVM. Compilationwith Harmony produces two outputs: an annotated assembly code file and aninstrumented executable file.
Step 2. Execute the program once to collect a PBV. After compilationwith Harmony, a single program run with normal inputs produces a PBV profileas well as the usual program outputs.
Step 3. (Optional) Tune machine specific parameters. Optionally,ParaShares can incorporate machine specific instruction weights to account fordifferences in opcode processing or memory access times. If used, these weightsshould be stored in a dictionary mapping instruction types to latency factors.Opcode dependent latency factors are often already available online; for exam-ple, latency factors for our machine are available in [10]. These latency factorssuggest multiplying conditional operations by two, add instructions by one, anddivide instructions by 30, as well as multiplicative factors for other types of in-structions. Due to the overwhelming significance of total instruction count, ourapplications’ ParaShare rankings showed minimal sensitivity to these latencyfactors. However, latency factors could have more of an effect for other applica-tions and architectures.
Step 4. Calculate per block static instruction counts. Next, the total(possibly weighted) instruction count per basic block is calculated. The instruc-tion contents of each block are available in the annotated assembly file producedearlier by Harmony. With weighting, a sum of the weights of each instruction inthe block produces a total block weight (Weightb). As an unweighted alternative,a simple count of the instructions per block suffices.
Step 5. Calculate ParaShare rankings. The ParaShare for each block b iscomputed using the block’s static instruction weight and dynamic thread weight.Specifically, the sum of each block’s executions at thread count t (Execsb,t) aredivided by t. This formula is loosely related to the runtime calculation usedin Quartz [2], but we apply it here at a smaller granularity and for a differentpurpose. The ParaShare of block b is the product of this dynamic thread weightand the static block weight, where max is the maximum number of threads thatever executes concurrently in the program:
ParaShareb =
max∑
t=1
Execsb,tt
×Weightb
As necessary for further analysis, the absolute ParaShare for each basic blockcan be normalized to the program’s total ParaShare (the sum of ParaSharesacross blocks).
Step 6. Use the ParaShare rankings for performance optimizationsor other analyses. Finally, ParaShares can be mapped back to the source codevia compiler debug information in the assembly code.
0%
10%
20%
30%
40%
50%
60%
blackscholes
canneal
radiosity
raytrace
streamcluster
swaptions
volrend
water_nsq
Std
ev /
Max
Tria
l
Benchmark
Between TrialsBetween ThreadsBetween Inputs
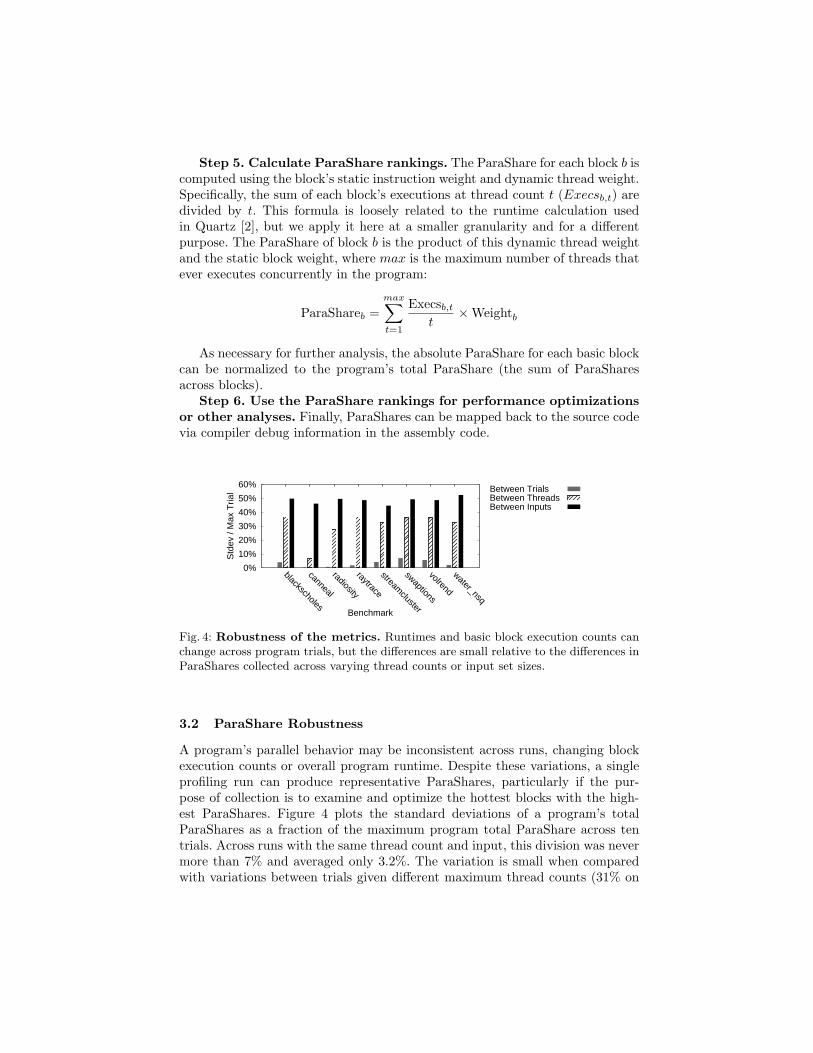
Fig. 4: Robustness of the metrics. Runtimes and basic block execution counts canchange across program trials, but the differences are small relative to the differences inParaShares collected across varying thread counts or input set sizes.
3.2 ParaShare Robustness
A program’s parallel behavior may be inconsistent across runs, changing blockexecution counts or overall program runtime. Despite these variations, a singleprofiling run can produce representative ParaShares, particularly if the pur-pose of collection is to examine and optimize the hottest blocks with the high-est ParaShares. Figure 4 plots the standard deviations of a program’s totalParaShares as a fraction of the maximum program total ParaShare across tentrials. Across runs with the same thread count and input, this division was nevermore than 7% and averaged only 3.2%. The variation is small when comparedwith variations between trials given different maximum thread counts (31% on
average) or different input sizes (48%). In addition to the magnitude of theoverall program ParaShare staying consistent between trials, the ranking of in-dividual basic blocks varies minimally, and changes only in lower ranked blockswith ParaShares of 2% or less. This is not the case across thread counts andinput sizes as explored in Sect. 4.1.
-100
-50
0
50
100
150
blackscholes
canneal
radiosity
raytrace
streamcluster
swaptions
volrend
water_nsq
Par
aSha
re R
ank
vers
us
Dyn
amic
Inst
ruct
ion
Ran
k
Benchmark
Max Increase (Top 90%)Max Decrease (Top 90%)Max Incr. (Top 100 blocks)Max Decr. (Top 100 blocks)
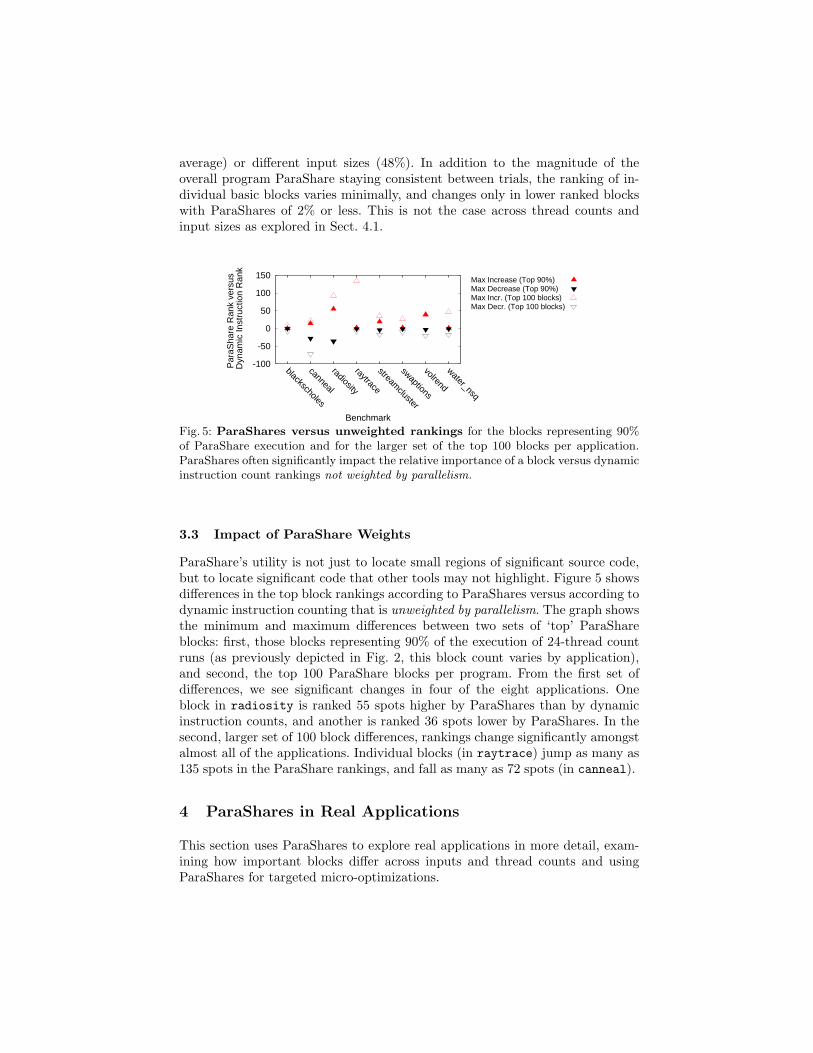
Fig. 5: ParaShares versus unweighted rankings for the blocks representing 90%of ParaShare execution and for the larger set of the top 100 blocks per application.ParaShares often significantly impact the relative importance of a block versus dynamicinstruction count rankings not weighted by parallelism.
3.3 Impact of ParaShare Weights
ParaShare’s utility is not just to locate small regions of significant source code,but to locate significant code that other tools may not highlight. Figure 5 showsdifferences in the top block rankings according to ParaShares versus according todynamic instruction counting that is unweighted by parallelism. The graph showsthe minimum and maximum differences between two sets of ‘top’ ParaShareblocks: first, those blocks representing 90% of the execution of 24-thread countruns (as previously depicted in Fig. 2, this block count varies by application),and second, the top 100 ParaShare blocks per program. From the first set ofdifferences, we see significant changes in four of the eight applications. Oneblock in radiosity is ranked 55 spots higher by ParaShares than by dynamicinstruction counts, and another is ranked 36 spots lower by ParaShares. In thesecond, larger set of 100 block differences, rankings change significantly amongstalmost all of the applications. Individual blocks (in raytrace) jump as many as135 spots in the ParaShare rankings, and fall as many as 72 spots (in canneal).
4 ParaShares in Real Applications
This section uses ParaShares to explore real applications in more detail, exam-ining how important blocks differ across inputs and thread counts and usingParaShares for targeted micro-optimizations.
0
10
20
30
40
50
60
70
1 thread
8 threads
24 threads
1 thread
8 threads
24 threads
1 thread
8 threads
24 threads
1 thread
8 threads
24 threads
1 thread
8 threads
24 threads
1 thread
8 threads
24 threads
1 thread
8 threads
24 threads
1 thread
8 threads
24 threads
Num
ber
of B
lock
s in
Top
90%
Top Blocks Shared with 1 ThreadRemaining Top Blocks
water_nsqvolrendswaptionsstreamclusterraytraceradiositycannealblackscholes
0
20
40
60
80
100
120
native
simlarge
simsm
all
native
simlarge
simsm
all
native
simlarge
simsm
all
native
simlarge
simsm
all
native
simlarge
simsm
all
native
simlarge
simsm
all
native
simlarge
simsm
all
native
simlarge
simsm
all
Num
ber
of B
lock
s in
Top
90%
Top Blocks Shared with nativeRemaining Top Blocks
water_nsqvolrendswaptionsstreamclusterraytraceradiositycannealblackscholes
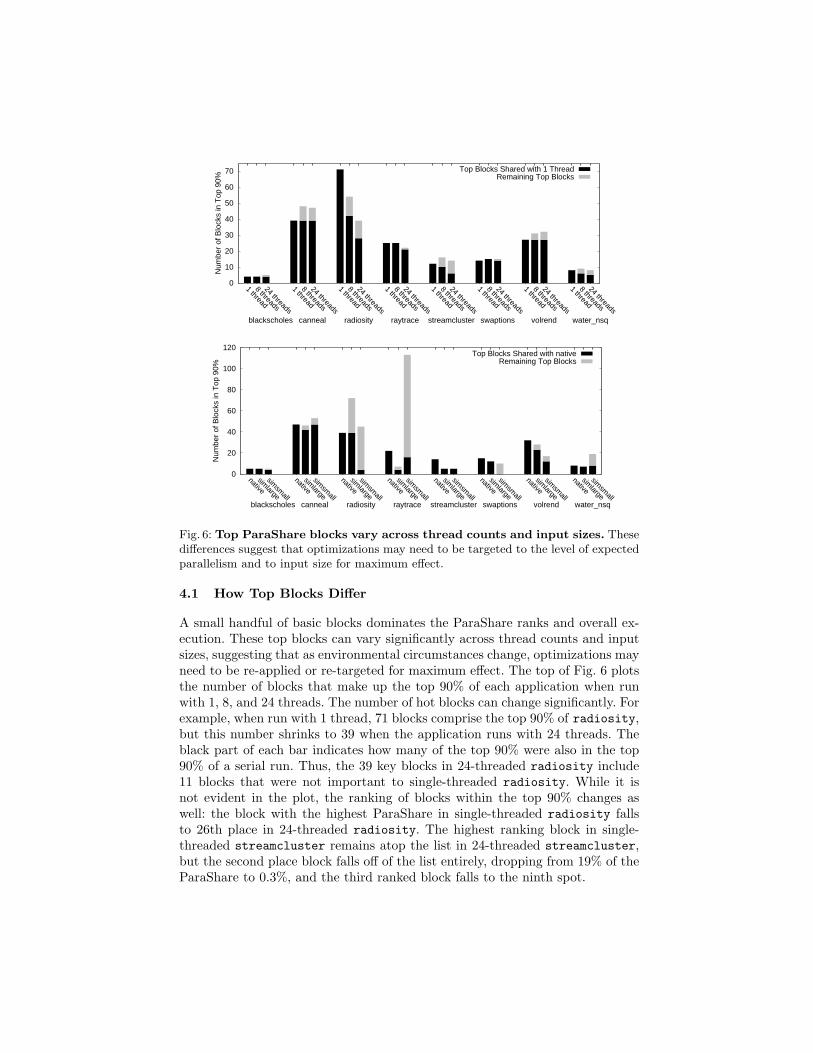
Fig. 6: Top ParaShare blocks vary across thread counts and input sizes. Thesedifferences suggest that optimizations may need to be targeted to the level of expectedparallelism and to input size for maximum effect.
4.1 How Top Blocks Differ
A small handful of basic blocks dominates the ParaShare ranks and overall ex-ecution. These top blocks can vary significantly across thread counts and inputsizes, suggesting that as environmental circumstances change, optimizations mayneed to be re-applied or re-targeted for maximum effect. The top of Fig. 6 plotsthe number of blocks that make up the top 90% of each application when runwith 1, 8, and 24 threads. The number of hot blocks can change significantly. Forexample, when run with 1 thread, 71 blocks comprise the top 90% of radiosity,but this number shrinks to 39 when the application runs with 24 threads. Theblack part of each bar indicates how many of the top 90% were also in the top90% of a serial run. Thus, the 39 key blocks in 24-threaded radiosity include11 blocks that were not important to single-threaded radiosity. While it isnot evident in the plot, the ranking of blocks within the top 90% changes aswell: the block with the highest ParaShare in single-threaded radiosity fallsto 26th place in 24-threaded radiosity. The highest ranking block in single-threaded streamcluster remains atop the list in 24-threaded streamcluster,but the second place block falls off of the list entirely, dropping from 19% of theParaShare to 0.3%, and the third ranked block falls to the ninth spot.
Hotspots shift even more with program input variations. Black portions ofthe bars in the bottom of Fig. 6 show the overlap of other input sizes withthe largest, native input size. Raytrace shows the biggest sensitivity to input,with the number of top blocks exploding from 22 to 113 between the native andsimsmall inputs. The first two top blocks stay the same across inputs, but theircombined ParaShare drops from 40.9% to 28.3%, while the third block dropseven more sharply from 10.2% to 2.6%. In swaptions, none of the top nativeblocks appear amongst the top simsmall blocks. These variations indicate thesurprising degree to which the internal dynamics of a parallel application canshift depending on simple parameters such as thread count and input size.
0%
20%
40%
60%
80%
100%
1 2 4 8 16 24
Mea
sure
d T
ime
Rel
ativ
eto
Ser
ial U
nopt
imiz
ed
Maximum Threads
blackscholes
1 2 4 8 16 24
Maximum Threads
streamcluster
1 2 4 8 16 24
Maximum Threads
swaptions
Unoptimized Optimized
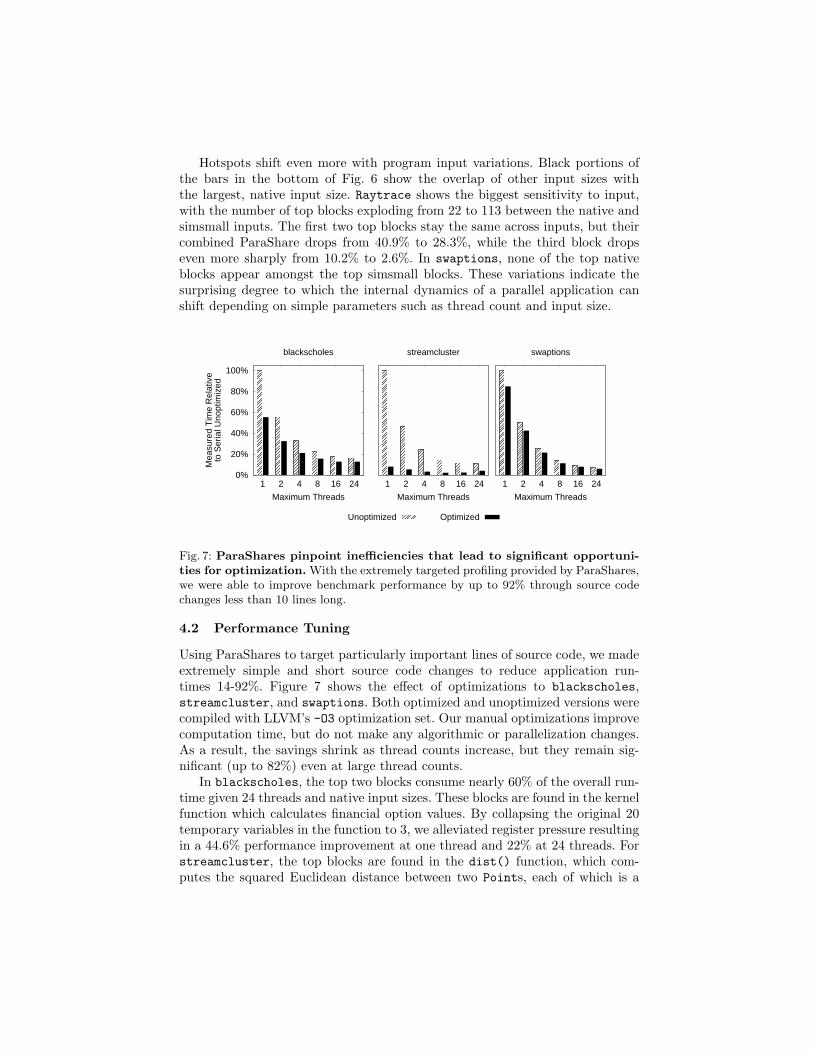
Fig. 7: ParaShares pinpoint inefficiencies that lead to significant opportuni-
ties for optimization. With the extremely targeted profiling provided by ParaShares,we were able to improve benchmark performance by up to 92% through source codechanges less than 10 lines long.
4.2 Performance Tuning
Using ParaShares to target particularly important lines of source code, we madeextremely simple and short source code changes to reduce application run-times 14-92%. Figure 7 shows the effect of optimizations to blackscholes,streamcluster, and swaptions. Both optimized and unoptimized versions werecompiled with LLVM’s -O3 optimization set. Our manual optimizations improvecomputation time, but do not make any algorithmic or parallelization changes.As a result, the savings shrink as thread counts increase, but they remain sig-nificant (up to 82%) even at large thread counts.
In blackscholes, the top two blocks consume nearly 60% of the overall run-time given 24 threads and native input sizes. These blocks are found in the kernelfunction which calculates financial option values. By collapsing the original 20temporary variables in the function to 3, we alleviated register pressure resultingin a 44.6% performance improvement at one thread and 22% at 24 threads. Forstreamcluster, the top blocks are found in the dist() function, which com-putes the squared Euclidean distance between two Points, each of which is a
struct with pointers to arrays of float coordinates. Inspecting the line of code inquestion (the body of a nested for loop), we guessed that the compiler missed anopportunity for common subexpression elimination, then modified the code toforce it to do so. This change halved the loop body’s original four array lookupsand two subtractions and reduced register pressure, saving 92% of the serial run-time, and 64% of the 24 thread runtime. Finally, the top blocks in swaptions cor-respond to a few nested loops within the HJM SimPath Forward Blocking.cpp
file. We experimentally unrolled these loops one to four times to find the op-timum unrolling level for each. In addition to the inability of the compiler todynamically test a variety of unrolling levels, these opportunities may have beenmissed because the loops involve nested accesses to custom data structures. Intotal, our loop optimizations resulted in a 15% savings for a single threadedswaptions execution, and a 19.7% savings for a 24-thread execution.
Given the simplicity of our optimizations, the performance savings are dispro-portionately large. Across a datacenter or many nodes in a distributed system,the savings could be even more important, and potentially financially significantas well. Best of all, we were able to make the optimizations quickly, becauseParaShares allowed us to focus our efforts on just a few lines of code rather thanthousands.
5 Conclusions
ParaShares provides a new lens through which to analyze multithreaded ap-plication performance. In contrast to most parallel performance optimizationtechniques, ParaShares do not target a specific type of inefficiency or level ofthe system stack. Instead, ParaShares track parallelism from the code’s point ofview, weighting each basic block execution by the whole program’s parallelism atthe time of the execution. This fine-grained scoring makes it simple to localizeimportant lines of code, even in large or unknown programs. Once importantcode is localized, more extensive analysis and optimizations can be preciselytargeted, leading to small code changes with big performance effects.
References
1. L. Adhianto, S. Banerjee, M. Fagan, M. Krentel, G. Marin, J. Mellor-Crummey,and N. R. Tallent. HPCTOOLKIT: tools for performance analysis of optimizedparallel programs. Concurrency and Computation, 22(6), Apr. 2010.
2. T. E. Anderson and E. D. Lazowska. Quartz: a tool for tuning parallel programperformance. SIGMETRICS, 18:115–125, 1990.
3. C. Bienia. Benchmarking Modern Multiprocessors. PhD thesis, Princeton Univer-sity, 2011.
4. D. Bohme, F. Wolf, B. R. de Supinski, M. Schulz, and M. Geimer. Scalable critical-path based performance analysis. In IPDPS, 2012.
5. M. Chabbi and J. Mellor-Crummey. Deadspy: a tool to pinpoint program ineffi-ciencies. In CGO, 2012.
6. G. Chen and P. Stenstrom. Critical lock analysis: diagnosing critical section bot-tlenecks in multithreaded applications. In SC, 2012.
7. K.-Y. Chen, J. Chang, and T.-W. Hou. Multithreading in Java: Performance andscalability on multicore systems. Transactions on Computers, 60(11), Nov. 2011.
8. K. Du Bois, S. Eyerman, J. B. Sartor, and L. Eeckhout. Criticality stacks: Identify-ing critical threads in parallel programs using synchronization behavior. In ISCA,2013.
9. K. Du Bois, J. B. Sartor, S. Eyerman, and L. Eeckhout. Bottle graphs: Visualizingscalability bottlenecks in multi-threaded applications. In OOPSLA, 2013.
10. T. Granlund. Instruction latencies and throughput for AMD and Intel x86 proces-sors, Feb. 2012. http://gmplib.org/~tege/x86-timing.pdf.
11. Harmony Parallel Block Vector Collection Tool. http://arcade.cs.columbia.
edu/harmony.12. Y. He, C. E. Leiserson, and W. M. Leiserson. The Cilkview scalability analyzer.
In SPAA, pages 145–156, 2010.13. X. Huang, S. M. Blackburn, K. S. McKinley, J. E. B. Moss, Z. Wang, and P. Cheng.
The garbage collection advantage: Improving program locality. In OOPSLA, Oct.2004.
14. Y. Huang, Z. Cui, L. Chen, W. Zhang, Y. Bao, and M. Chen. HaLock: hardware-assisted lock contention detection in multithreaded applications. In PACT, 2012.
15. IntelR© Corporation. IntelR© Parallel Amplifier 2011. http://software.intel.
com/en-us/articles/intel-parallel-amplifier/.16. J. A. Joao, M. A. Suleman, O. Mutlu, and Y. N. Patt. Bottleneck identification
and scheduling in multithreaded applications. In ASPLOS, 2012.17. M. Kambadur, K. Tang, and M. A. Kim. Harmony: Collection and analysis of
parallel block vectors. In ISCA, June 2012.18. B. P. Miller, M. D. Callaghan, J. M. Cargille, J. K. Hollingsworth, R. Bruce,
I. Karen, L. Karavanic, K. Kunchithapadam, and T. Newhall. The Paradyn parallelperformance measurement tools. IEEE Computer, 1995.
19. E. Perelman, G. Hamerly, M. Van Biesbrouck, T. Sherwood, and B. Calder. Usingsimpoint for accurate and efficient simulation. In SIGMETRICS, volume 31. ACM,2003.
20. H. Shi, Y. Wang, H. Guan, and A. Liang. An intermediate language level op-timization framework for dynamic binary translation. SIGPLAN Notices, 42(5),May 2007.
21. STMicroelectronics, Inc. PGProf: parallel profiling for scientists and engineers,2011. http://www.pgroup.com/products/pgprof.htm.
22. B. Stroustrup. C++11 the new ISO C++ standard, 2013. http://www.
stroustrup.com/C++11FAQ.html.23. N. R. Tallent, J. M. Mellor-Crummey, and A. Porterfield. Analyzing lock contention
in multithreaded applications. In PPoPP, 2010.24. N. Topham and D. Jones. High speed CPU simulation using JIT binary translation.
In MOBS, volume 7, 2007.25. S. Woo, M. Ohara, E. Torrie, J. Singh, and A. Gupta. The SPLASH-2 programs:
characterization and methodological considerations. In ISCA, 1995.26. W. Yoo, K. Larson, L. Baugh, S. Kim, and R. H. Campbell. ADP: automated
diagnosis of performance pathologies using hardware events. In SIGMETRICS,2012.