Embed Size (px)
Citation preview

Johne’s Disease
Australian and New Zealand Standard Diagnostic Procedure, July 2015 Page 1 of 68
Paratuberculosis (Johne’s Disease) GJ Eamens Elizabeth Macarthur Agricultural Institute IM Marsh NSW Department of Primary Industries
PMB 4008 Narellan NSW 2567
[email protected] 10 [email protected]
KM Plain Faculty of Veterinary Science RJ Whittington The University of Sydney
Werombi Road, Camden NSW 2570
[email protected] [email protected] 20
Part 1 – Diagnostic overview
Summary
Paratuberculosis (Johne's disease) is a chronic enteritis of ruminants caused by infection with Mycobacterium avium subsp paratuberculosis (Map), a slow growing, Gram-positive, 30 acid-fast bacillus. There are three major strains of this organism; S type (sheep type, Type I), C type (cattle type, Type II) and intermediate type (Type III), which have shown strong host preference in Australia. A further type, known as bison type (B type) can be identified among Type II strains. Young animals are most susceptible to infection. However, most clinical cases occur in adults between 2 and 5 years of age due to a prolonged incubation period. Progressive weight loss and weakness are the main clinical signs in all species. In addition, there is diarrhoea in cattle. 40 Clinically diseased animals may shed billions of Map organisms per day in faeces. It is assumed that most animals become infected by ingesting the bacilli. Johne's disease is endemic and widespread in sheep, cattle, deer and dairy goats in New Zealand. In Australia, the disease is mainly restricted to parts of temperate south-eastern Australia in dairy and beef cattle, sheep, goats, alpaca, llama and deer. Sporadic cases have been identified in the Northern Territory and Queensland. In the affected areas of Australia, cattle, goats and deer are primarily infected by C strains of Map, whereas sheep are infected by S strains of Map. Johne’s disease due to infection with an S strain of Map has been detected
Johne’s Disease
Australian and New Zealand Standard Diagnostic Procedure, July 2015 Page 2 of 68
in sheep and goats in Western Australia since 2011. Infection with confirmed C and B strains 50 have been detected in cattle in Queensland since 2012/2013. The detection of infection depends on the demonstration of Map in tissues or faeces by culture or molecular techniques, detection of specific antibodies by serology, or the demonstration of cell-mediated responses. The choice of test depends on the circumstances and the degree of sensitivity required at individual animal or herd level. The single largest problem in Johne's disease control is the difficulty of detecting subclinically infected animals. The diagnosis of Johne's disease is divided into two parts: the diagnosis of clinical disease, and the detection of subclinical infection, which is essential for control of the disease at farm, 60 national or international level. Diagnosis of Johne's disease is made on clinical grounds confirmed by the demonstration of Map in the faeces by microscopy, culture, or by the use of DNA-based techniques. Diagnosis is made at necropsy by the finding of pathognomonic lesions in the intestines and histological detection of acid fast organisms, or by detection of Map using culture or DNA-based techniques. The primary macroscopic lesions of Johne’s disease are usually confined to the ileum, 70 caecum, colon and draining lymph nodes. They consist of thickening of the intestinal mucosa, thickening and cording of mesenteric lymphatics and enlargement and oedema of mesenteric lymph nodes, as representations of granulomatous enteritis, lymphangitis, and lymphadenitis, respectively. Cultures of Map may be obtained from faeces or tissues (after treatment to eliminate contaminants) by inoculation of solid or liquid media containing egg yolk and the specific growth factor, mycobactin, that is essential for growth. The isolation of Map from faeces or tissue is the definitive test for Johne’s disease. It is a relatively sensitive diagnostic tool and is considered to be 100% specific. Recently, direct polymerase chain reaction testing for Map 80 has been shown to be sensitive for herd and flock detection of Map infection. The serological tests commonly used for Johne's disease are absorbed enzyme-linked immunosorbent assay, agarose gel immunodiffusion and complement fixation test. Relative sensitivity and specificity are often determined by reference to results of faecal culture. Tests that measure cell-mediated immune responses, such as a gamma interferon assay or skin test, are not commonly used as diagnostic tools. Safety and containment requirements used in laboratories for common bacterial pathogens 90 apply to work procedures with Map.
Aetiology

Johne’s Disease
Australian and New Zealand Standard Diagnostic Procedure, July 2015 Page 3 of 68
Paratuberculosis, or Johne's disease, is a chronic, wasting disease of domestic and wild ruminants caused by infection with Mycobacterium avium subsp. paratuberculosis (Map), formerly known as M. paratuberculosis or M. johnei.1-13 It is characterised by granulomatous inflammation of intestines and mesenteric lymph nodes.14
Map is a small (0.5 to 1.5 µm), slow growing, Gram-positive, acid-fast bacillus.1 This 100 organism shares considerable DNA homology with the organisms previously known as M. avium and M. silvaticum.15, 16 It was proposed by Thorel et al (1990) to separate these organisms into 3 distinct clusters: M. avium subsp avium, M. avium subsp paratuberculosis and M. avium subsp silvaticum, subsequent to a large taxonomic study based on phenotypic tests.17 Under defined in-vitro growth conditions, Map requires supplementation of media with iron-chelating mycobactin for growth.18
Several typing methods have been used to investigate the genetic diversity of Map.19 Based on the patterns obtained by IS900 restriction fragment length polymorphism (RFLP) and pulsed field gel electrophoresis (PFGE) and on growth characteristics and pigmentation, Map strains have been divided into three main groups: sheep (S) or Type I strains, cattle (C) or 110 Type II strains and intermediate or Type III strains.20, 21 Type I and Type III can also be considered as subtypes of the S strain lineage.22 A single nucleotide polymorphism in the IS1311 sequence assayed by restriction enzyme analysis (REA) of products of the IS1311 polymerase chain reaction (PCR) distinguishes S and C strains, consistent with the S (Type I, sheep) and C (Type II, cattle) patterns of the RFLP and PFGE. Although the IS1311 PCR-REA does not distinguish between Types I and III, it distinguishes C and 'B' (bison) strains within Type II.23, 24
There is some host preference evident in Australia from sheep-beef cattle co-grazing observations but cross-species infections do occur. Several studies have demonstrated that regardless of global geographic location, the overwhelming majority of isolates from cattle 120 have been of the C (Type II, cattle) strain. In comparison, most isolates from sheep have been found to be S (Type I, sheep) or I (Type III, intermediate) strains. Most isolates from goats and deer have belonged to C.19-21, 23-25 A similar, distinct distribution of strains within host populations has been observed in New Zealand and Australia.20, 26-29 Results of a 2008 study in Australia suggest that based on the current distribution of Johne’s disease, the likelihood of transmission of the S strain from sheep to cattle is low.30 The S strain has also been found to be less virulent for deer than the C strain after experimental exposure.31 However, emerging evidence from the Cattle Council of Australia's Financial and Non-Financial Assistance (FNF) program in Australian beef cattle, and from New Zealand suggests that ‘S’ strain is becoming increasingly common where cattle co-graze with infected sheep. 130
Other genotyping methods suited to epidemiological studies to investigate the movement and origin of Map strains in animal populations include variable number tandem repeat (VNTR) procedures, particularly in applications to short sequence repeats (SSR) or mycobacterial interspersed repetitive units (MIRU) of Map.32-34 The tandem application of MIRU and multilocus SSR procedures was recently applied to study Map isolates from bovine Johne's disease incursions in QLD.35 Two strains were identified as the source of the incursions, with no genotypic link to isolates from regions of Australia with a higher prevalence of Johne's disease.
Clinical Signs

Johne’s Disease
Australian and New Zealand Standard Diagnostic Procedure, July 2015 Page 4 of 68
The incubation period of Johne’s disease is not well defined. Most clinical cases occur in 140 animals between 2 and 5 years of age but it can be delayed for as long as 14 years.1, 36-38 In a Victorian dairy herd in the 1990's, stressed young bulls (less than 2 years of age) have shown clinical signs of disease (L. Gavey, personal communication 2014). In all ruminant species, the disease is characterised by gradual weight loss and progressive weakness that advances to lethargy and emaciation.4, 7, 9-11, 36, 37, 39-41
In affected cattle the faeces are usually green and bubbly and do not contain blood or mucus. Faecal consistency may improve for short periods. The appetite is usually normal, even in animals in an advanced stage of the disease.41 In sheep flocks, the first indication of the disease may be the development of a distinct ‘tail’ in the mob. This ‘tail’ is demonstrated by the weaker animals that drop toward the back of the mob when the animals are mustered. 150 Unlike cattle, only a small percentage of clinically affected sheep, goats and deer show diarrhoea, and this is usually confined to the terminal stage of the disease.4, 9, 36, 37, 39 Similar observations have been reported in llamas and alpacas.10, 11 Wool break has been reported in sheep42 and deer may show patchy alopecia,9 presumably due to stress.
A notable feature of Johne’s disease in farmed deer is clinical disease in animals as young as 8-12 months of age.43 Affected animals may have a short illness with weight loss and diarrhoea. Clinical disease is also observed in older deer.43
Epidemiology
Young animals are most susceptible to infection.44 It has been assumed that most animals which become infected, do so shortly after birth,1 but recent studies have indicated that 160 infection rates of young and adult sheep are similar.45 Despite this, sheep exposed as lambs are significantly more likely to shed Map, develop lesions and die compared to sheep exposed for the first time as adults.45 Ingestion of Map is believed to be the primary route of infection.
Clinically affected animals may shed billions of bacilli per day in faeces. It is assumed that most animals become infected by ingesting the bacilli from a manure-contaminated udder shortly after birth or from pasture.1, 38 An oral dose of 1,000 organisms (colony forming units) has caused intestinal infection in lambs and young deer31, 46, 47 but higher doses may be required (from sheep studies).47 The survival of Map in the environment is favoured by low temperature variations associated with protection from direct solar radiation.48
The bacteraemia that develops during the course of infection may lead to dissemination of 170 Map to other organs (including the udder, sex organs, skeletal muscle)5, 49-56 and to vertical transmission of infection.57
Intrauterine infection of the foetus has been reported in goats, cattle, sheep and deer.5, 58-61 The percentage of congenitally infected foetuses from cows with clinical Johne’s disease ranged from 26.4% to 63.9%,62 whereas the infection was detected in only 8.6% of foetuses from subclinically infected cows.59 A recent meta-analysis suggests a significant role for bovine intrauterine infection in Johne’s disease epidemiology.57 In addition, both milk and colostrum may be significant sources of infection, despite the low concentration of Map organisms likely to be present in milk.63 The organism has been isolated from colostrum of 22% of asymptomatically infected cows,64 from milk of 35% of cows with clinical Johne’s 180 disease65 and from mammary secretions or mammary glands of 3% of clinically affected sheep.66 Although in cattle, Map excretion via milk appears to be correlated with the stage of

Johne’s Disease
Australian and New Zealand Standard Diagnostic Procedure, July 2015 Page 5 of 68
infection,63 the shedding of this organism in bovine faeces and milk is not synchronized as many cows with negative faecal cultures yield positive milk cultures and vice versa.67
Map has been recovered from bovine and ovine semen,68, 69 but it is unlikely that venereal transmission plays a significant, if any, role in the epidemiology of Johne’s disease.70
Map has also been isolated from faeces and tissues of wild ruminants and non-ruminant species.71-74 Interspecies transmission between wildlife and domestic ruminants occurs, and wildlife may play a role as a reservoir of infection.74
Occurrence and distribution 190
Historically, Johne's disease has occurred in temperate south-eastern Australia in dairy and beef cattle, sheep, goats, deer, and rarely in alpaca and llama. In recent years, infected livestock in Western Australia (sheep, goats) and in Queensland and the Northern Territory (cattle) have been detected. The disease affects animal productivity and market access. Johne’s disease is a notifiable disease in all States and the Northern Territory in Australia.
Ovine Johne’s disease was first diagnosed in Australia in the central tablelands of New South Wales in 1980. Further investigations found infected sheep flocks in Victoria, Flinders Island, Kangaroo Island, south-eastern South Australia and mainland Tasmania. The proportion of infected sheep in a flock varies between 1 and 15% and is typically around 4%. In June 2000 the first case of infection of a goat with the S strain of Map was detected in Western Australia 200 followed by the diagnosis of Johne’s disease in sheep flocks in that state.
Johne’s disease was first recorded in Australian cattle in Warburton, Victoria, in 1925. It is most common in dairy herds. In 2010 approximately 1,150 cattle herds were officially classified as infected in the south-east of Australia (Victoria, New South Wales, Tasmania and South Australia). The first cases in alpaca and deer were detected in 1993 and 1999, respectively. To prevent the disease from spreading further, zoning for bovine Johne’s disease was introduced in 1999. Western Australia has identified Map-infected sheep and a goat but remains a zone free of bovine Johne’s disease in 2014. Western Australia does have periodic introductions of infected cattle, and maintains free zone status normally by eradication in herds where identified cases have occurred. Endemic infection is not known 210 to occur in Queensland or the Northern Territory, but infected cattle properties were detected in Queensland in 2011, 2012 and 2013. Bovine Johne’s disease in the Northern Territory has been associated with importation of infected animals from interstate on three occasions in 1976, 1994 and 2001 and was successfully eradicated from each herd with no further spread within or between herds.75 Current estimates of the prevalence of ovine and bovine Johne’s disease, and disease management programs adopted in Australia, are available on the Animal Health Australia website: (http://www.animalhealthaustralia.com.au/programs/jd/jd_home.cfm)
Johne's disease is endemic and widespread in sheep, cattle, deer and dairy goats in New Zealand. The initial diagnosis of Johne’s disease in New Zealand occurred in an 220 imported cow in 1912, while ovine Johne’s disease was first reported in south Canterbury in 1952 and the first case of Johne's disease in farmed deer was recognized in the late 1980s.76 Johne’s disease is no longer a reportable disease in New Zealand.
Gross Pathology

Johne’s Disease
Australian and New Zealand Standard Diagnostic Procedure, July 2015 Page 6 of 68
It must be noted that many infected animals do not have gross lesions, there is not always a close correlation between the severity of clinical signs and the extent of intestinal lesions, and a wide range of specimens must be examined to ensure a reliable diagnosis.
In cattle, small ruminants and deer the gross pathological findings are generally similar. Clinically affected animals are usually emaciated, have serous atrophy of fat and effusion in the body cavities. The primary macroscopic lesions of Johne’s disease in ruminants are 230 usually confined to the ileum, caecum, colon and draining lymphatics and lymph nodes.4, 8, 9,
37, 39, 40, 77-80
The earliest lesions are thickening and cording of mesenteric lymphatics. The mesenteric and ileocaecal lymph nodes may be enlarged and oedematous, and may have focal or diffuse pallor in the cortex. In sheep and deer the lymphatics may have small, white miliary nodules of caseous necrosis along their length.9,37
The enteric lesions are most common in the terminal ileum and vary from mild, velvety thickening of the mucosa to severe thickening of the bowel with transverse corrugation of the mucosal surface.8,37,78-81 Necrotic foci in the intestinal mucosa may be found in goats, sheep and deer.14 In addition, mucosal hyperaemia, erosions and petechiation 240 have been observed in deer.4,8 In some goats, sheep and deer, areas of caseous necrosis and mineralisation may be present in the lymph node cortex and appear as white foci 1-4 mm in diameter.62,78-81 Necrosis, caseation or calcification rarely occur in cattle.14
Tubercle-like lesions have also been observed in lymph nodes of the head in deer.82 Gross changes in deer are very difficult to distinguish from lesions caused by M. bovis or other members of the M. avium complex.82, 83
Diagnostic Tests
The sensitivity of diagnostic tests for detection of Map infection in individual animals is relatively low, and assays including histopathology, culture, DNA probes and serological tests have their lowest sensitivity in animals in the early stages of infection. Test sensitivities 250 improve as the mycobacterial load increases, and are generally high in advanced stages of infection.
The accuracy of diagnostic tests is influenced by host factors and the level of exposure to Map and other related bacteria in the environment. As such, results of diagnostic tests should be interpreted in the context of the actual population under test. False negative and positive results will occur. The limitations of test precision mandate that good quality control in specimen collection, handling, storage and laboratory testing is needed to maintain precision at a high level. Positive, negative and inconclusive results occur with all types of tests for Map infection.
Microscopic examination of Ziehl–Neelsen stained faecal smears lacks sensitivity and 260 specificity and its application is limited to clinical cases to obtain a provisional diagnosis of Johne’s disease.
Faecal culture is arguably the best test available for the diagnosis of Johne’s disease in live animals. It is believed that culture of faeces on solid media detects about 30–40% of infected cattle, while sensitivity in liquid media has been found to be superior to solid culture (refer 'Part 2: Test Methods - Culture'). The sensitivity of faecal culture is affected by the stage of

Johne’s Disease
Australian and New Zealand Standard Diagnostic Procedure, July 2015 Page 7 of 68
infection of the animals tested. It detects only a few animals in the early stages of infection but its sensitivity approaches 100% in clinically-affected animals.84 The isolation of Map from faeces or tissue is considered to be 100% specific.
In sheep, goats, cattle and alpaca, faecal specimens from several individual animals can be 270 combined and culture undertaken on the pooled sample.85-87 This approach, known as pooled faecal culture (PFC), is used as a screening test. The reported herd sensitivity of the PFC in cattle ranges from 22% to almost 100%.88-93 In Australia, recommended pool sizes are 5 for cattle, 25 for goats and 50 for sheep. In sheep, herd sensitivity depends on the sampling regimen. In Australian control programs for ovine Johne’s disease, PFC is estimated to have a flock sensitivity of 95% in flocks with a prevalence of 2% or more with the recommended regimen of 7 pools of 50 sheep per pool.94 The specificity of the PFC is considered almost perfect, but it is not uncommon that individual faecal samples from pools tested positive by PFC yield no growth of Map, presumably due to low bacterial load and uneven distribution of the organism in the samples.88-93 280
Culture of environmental samples of manure from areas where a large proportion of cows defecate offers a convenient and unobtrusive alternative strategy to tests currently used to monitor the status of Johne’s disease in dairy cattle herds.95-97 Australian studies in 2005-2008 indicated that replicate sampling (6 samples/yard) is superior to single sampling for detection of infected herds (J. Gwozdz, personal communication 2010). United States of America (USA) studies using 6 samples/herd and culture on four tubes of solid Herrold's media, have suggested a sensitivity of only 40%98 whereas in high-shedder herds, sensitivities of 50-78% can be found.95-97 Sampling of lagoons may be more sensitive than alleyways and cow pens.96 Commercial liquid culture systems have also been applied to bovine environmental samples in USA prevalence studies and were considered cost-effective.99 290
Among simulated testing strategies, the culture of environmental samples of manure was the most cost-effective for detection of Johne’s disease in dairy herds, followed by PFC, individual faecal culture and serum enzyme linked immunosorbent assay (ELISA) with follow-up faecal culture.100
Histological examination of tissues has been reported to be less sensitive than culture of tissues in sheep, goats and cattle.79,101,102 The reasons for this include the small amount of tissue examined microscopically compared to culture, and the examination of different parts of the same organ in the two tests.38 The specificity of histopathology as a follow-up to a positive ELISA test, where typical lesions are seen (in the intestine and draining lymph nodes) and typical acid-fast organisms are detected, is considered to be 100% in cattle, sheep and 300 goats. While such lesions are required to confirm the presence of Johne’s disease in these species, paucibacillary forms of Johne’s disease are recognised, particularly in sheep. However, in other species such as deer, lesions may be confused with other infections.
The ELISA is, at present, the most sensitive and specific test for serum antibodies to Map in cattle. It detects about 30–40% of cows identified as infected by culture of faeces on solid media.84 As both culture of faeces and ELISA detect advanced cases most readily, the true sensitivity of ELISA is much lower, with estimates of <16% determined in dairy cattle in Victoria.103 The complement fixation test (CFT) has been the standard test used for cattle for many years, but it lacks sensitivity and specificity compared to the ELISA and is mainly requested for export testing. The agar gel immunodiffusion (AGID) test is sometimes used 310 for testing sheep and goats but not cattle, and may require Chief Veterinary Officer approval
Johne’s Disease
Australian and New Zealand Standard Diagnostic Procedure, July 2015 Page 8 of 68
for use in certain applications, such as the ovine Johne’s disease market assurance program (OJD MAP).
Tests that measure cell-mediated immune responses (CMI), such as a gamma interferon assay or skin test, are not commonly used for the diagnosis of Johne’s disease in domestic ruminants. The CMI tests tend to detect animals in early stages of infection that produce negative reactions in serological tests.
Although several PCR assays for the direct detection of Map in clinical specimens such as milk or faeces have been reported, the low sensitivity and specificity of these tests has limited their adoption.104-111 The role of the PCR in programs aiming at controlling Johne’s disease 320 has primarily been restricted to identification of culture isolates. The PCR has infrequently been used for the confirmation of infection in individual animals by direct detection of Map in tissues submitted for histopathological examination.112, 113
Recent advances in PCR technology and DNA extraction techniques offer new avenues for the development of tests for rapid, sensitive and specific diagnosis of Johne’s disease.114, 115 Results of recent studies are promising,116-118 with new, improved, direct faecal PCR tests having sensitivities relative to culture ranging from 23%117 to 70%116 and specificities ranging from 85.3%116 to 99.7%.117 The faecal extraction and PCR test developed by Kawaji et al118 was 100% specific in 176 Map-unexposed, faecal culture-negative sheep and produced positive results in 8/13 (62%) experimentally exposed but faecal and tissue culture negative 330 and histopathology negative sheep; 14/208 (7%) exposed, faecal culture negative sheep; 24/40 (60%) exposed faecal culture negative but tissue culture positive and/or histopathology positive sheep; and in 68/69 (99%) exposed faecal culture positive sheep.
A direct High Throughput Johne’s (HT-J) assay for faeces, which incorporates the PCR described by Kawaji et al.118 has been developed by the University of Sydney and the Elizabeth Macarthur Agricultural Institute (EMAI),119 and was approved by the Subcommittee on Animal Health Laboratory Standards (SCAHLS) for use in cattle and sheep on a herd/flock basis in 2013. It has been shown to have the same high analytical specificity as the Kawaji et al assay based on a panel of 49 Mycobacterium spp other than Map including 10 isolates with IS900-like sequences119 reported in two earlier studies.120, 121 The HT-J assay 340 has been shown to have similar sensitivity to radiometric faecal culture.119 For example, among 870 cattle in Map-infected herds, 67 of the cattle were positive on both HT-J and faecal culture testing, while similar numbers were HT-J positive/faecal culture negative (n=57) compared to faecal culture positive/HT-J negative (n=44).119 Based on the protocol and criteria for positive results described for the HT-J assay in Part 2 of this document, 62% and 86% of culture positive faecal samples from cattle and sheep respectively were positive in the HT-J assay, whereas the diagnostic specificity relative to faecal culture for individual animals ranged between 98.7 and 98.9% in cattle and sheep.119
Safety and Containment Requirements 350
Safety and containment requirements used in laboratories for common bacterial pathogens apply to work procedures with Map. Map belongs to pathogen risk group 2, according to the Australian standard for safety in microbiological laboratories (AS/NZS 2243.3: 2010 Safety in laboratories - Microbiological safety and containment), requiring PC2 containment.

Johne’s Disease
Australian and New Zealand Standard Diagnostic Procedure, July 2015 Page 9 of 68

Johne’s Disease
Australian and New Zealand Standard Diagnostic Procedure, July 2015 Page 10 of 68
Part 2 – Test Methods
Histopathology
Principle of the Test 360
Histological lesions of Johne’s disease are characterised by the presence of aggregations of large macrophages with abundant granular cytoplasm, often referred to as epithelioid cells, in the intestinal mucosa and submucosa, lymphatics and in the cortex of mesenteric lymph nodes.4, 8, 9, 37, 39, 40, 77-81, 122 In the intestines, these aggregations of macrophages are accompanied by focal or diffuse infiltration of lymphocytes with occasional eosinophils and neutrophils.37, 39, 40, 78, 80 Multinucleate giant cells may be seen in the intestinal mucosa and cortex of the mesenteric lymph nodes.77, 78, 81
In some cases, there are focal to locally extensive aggregates of macrophages and scanty acid-fast organisms (AFOs), together with a lymphocytic infiltrate, in the lamina propria. This type of granulomatous inflammatory reaction is classified as ‘paucibacillary’ or ‘tuberculoid’, 370 whereas the diffuse infiltration of the intestinal mucosa and submucosa with macrophages that are laden with numerous AFOs is referred to as a ‘multibacillary’ or ‘lepromatous’ reaction.123 The diffuse infiltration of the intestinal mucosa is associated with fusion and atrophy of villi and a decrease in the number of crypts.37
In some studies, focal areas of caseation and calcification have been observed in the bowel and mesenteric lymph nodes of sheep and goats.39, 40, 77-79, 124, 125 However, other workers have either failed to identify such lesions, or have attributed them to parasitic infestation.37, 80, 122,
126
Extensive fibrosis and necrosis in the mesenteric lymph nodes, and in some cases in lymph nodes of the head, is a feature of Johne’s disease in deer.9, 82 Identification of the organism by 380 bacterial culture or PCR is required to distinguish lesions in mesenteric lymph nodes and lymph nodes of the head caused by Map from those caused by M. bovis and M. avium.82
Gross lesions in the liver have rarely been reported in sheep,80 but microgranulomas may be scattered throughout the hepatic parenchyma.37, 80, 81 In cattle, aggregates of globule leukocytes have been observed in, or around, myenteric ganglion cells.81 Lymphocytic neuritis in the gut has been reported in sheep.127
In all ruminant species, AFOs are usually present within macrophages and multinucleate giant cells in intestinal sections. Numbers of Map bacilli in intestinal sections vary from scant to abundant. Fewer AFOs are present in the mesenteric lymph nodes and they are scanty in liver lesions.37, 80, 81 Standard grading categories have been reported to describe the severity of 390 histopathological changes of Johne’s disease in sheep,80, 122 cattle52 and deer.128, 129
Post-mortem examination of ewes at abattoirs, followed by histopathology of selected tissues, is being used to screen ovine flocks for Johne’s disease in Australia.
Reagents and Materials
The following is a list of tissues that should be collected using aseptic techniques. Each tissue should be divided into two equally representative portions for submission to the laboratory; one refrigerated in a sterile leak-proof container (for culture) and the other in 10% buffered formalin (for histopathology). Samples for histopathology should be stored and shipped at ambient temperature. Storage and shipment conditions of specimens for bacteriology are

Johne’s Disease
Australian and New Zealand Standard Diagnostic Procedure, July 2015 Page 11 of 68
specified in the ‘Bacteriology’ section below. 400
Recommended specimens to collect for culture and histopathology are as follows. Intestinal sections of at least 5 cm each for culture and histopathology are advised.
Entire ileocaecal valve (ICV), Ileocaecal lymph nodes, Ileal (caudal jejunal) lymph nodes, Two (10 cm) pieces of ileum (one proximal and one distal (terminal)) One (10 cm) piece of proximal colon.
Test Procedure
At necropsy, tissues collected into 10% buffered formalin are processed routinely and stained 410 for normal tissue elements with haematoxylin and eosin and also for acid-fast bacilli using the Ziehl-Neelsen method.
Tissues must be well preserved and sufficient time must be devoted to the search for acid-fast bacilli. From a single animal, each Ziehl-Neelsen stained section of tissue with cellular changes indicative of Johne’s disease should be examined under oil immersion for a minimum of 5 minutes before reporting no evidence of acid-fast organisms. If, after examination of sections from all tissues, it is only possible to make a diagnosis of ‘suggestive of Map infection’, examination of one additional section from each block with lesions is recommended.
A positive control consisting of tissues with mycobacteria should be included in the Ziehl-420 Neelsen procedure. In tissue sections with the correct degree of destaining, the cytoplasm of erythrocytes will retain a pink tinge rather than be heavily counterstained.
Interpretation of Results
A diagnosis of ‘lesions consistent with Map infection’ is indicated if in any one section, one or more single giant cells and/or one or more accumulations of epithelioid macrophages are observed in the intestinal lamina propria and/or lymph node cortex with the presence of at least one AFO morphologically consistent with Map.
A finding ‘suggestive of Map infection’ is indicated if in any one section, Langhans’ giant cells and/or accumulations of epithelioid macrophages in the intestinal lamina propria and/or lymph node cortex are observed without the detection of an AFO. 430
When lesions consistent with Map infection are present in cattle, sheep or goats (granulomatous inflammation, AFO visible), these results can be interpreted as positive for Johne’s disease and should enable appropriate field control measures to be instituted.
Microscopy for AFO's

Johne’s Disease
Australian and New Zealand Standard Diagnostic Procedure, July 2015 Page 12 of 68
Principle of the Test
Examination of Ziehl–Neelsen stained faecal smears can be applied in clinical cases to demonstrate typical clumps of acid-fast bacilli. However, false negative results occur and 440 while the presence of acid-fast bacilli singly and in clumps morphologically consistent with Map is consistent with Johne’s disease, this is not a definitive test.
Reagents and Materials
See Part 3.
Test Procedure
There are several variations on this staining procedure found in various publications. In general, a hot carbol fuchsin method (Ziehl-Neelsen stain) for mycobacteria is used, and the following is based on well-established clinical pathology procedures in mycobacteriology.130,
131 Prepare smears and air dry for 10 minutes. Heat fix at 60–70oC. Flood each slide with 450 Ziehl-Neelsen carbol fuchsin. Heat each slide gently until a small amount of steam rises. Do not boil. Leave for 5–10 minutes. Rinse with tap water, then add acid-alcohol for at least 1–2 minutes. Rinse thoroughly with tap water. Flood with counterstain. Leave for 1–2 minutes. Rinse with tap water or alkali tap water and air dry. Examine under immersion oil.
A cold staining procedure (Kinyoun acid-fast stain) can also be applied for staining mycobacteria in smears. The Kinyoun staining method is similar to the Ziehl-Neelsen stain, but its primary carbol fuchsin stain has a greater concentration of basic fuchsin and phenol, and does not require heating in order to stain properly. After flooding the entire slide with Kinyoun carbol fuchsin stain, the smear is allowed to stain for 2 minutes, then rinsed with water. The slide is then flooded with decolouriser and decolourised until no more colour 460 drains from the slide (approximately 3 to 5 seconds). The slide is rinsed thoroughly with water and any excess moisture shaken off. The slide is flooded with counterstain and allowed to stain for 30 seconds before it is rinsed thoroughly with water and allowed to air dry before examination under oil immersion.
A positive control (smear containing/spiked with Map) must be included in each batch of specimens for microscopy.
Interpretation of Results
Acid-fast bacteria stain red. Other organisms and organic material stain green or blue depending on counterstain.
Culture 470
Principle of the Test
The isolation of Map from faeces or tissue is the definitive test to confirm the presence of Map, which is critical in the initial diagnosis of Johne’s disease in a herd or flock. There are several culture methods, which vary with respect to media, sample type and sample processing protocols. The cultivation of Map is always performed using special media supplemented with mycobactin J. Culture of Map is a specialised procedure.
Since Map organisms are vastly outnumbered by other bacteria or fungi in faecal and

Johne’s Disease
Australian and New Zealand Standard Diagnostic Procedure, July 2015 Page 13 of 68
intestinal tissue specimens, the successful isolation of the target organism depends on efficient inactivation of the undesirable microbes. Decontamination of faeces is undertaken based on the double incubation/centrifugation method developed in the USA.132-134 The 480 procedure employs hexadecylpyridinium chloride (HPC) to reduce contaminants in the initial step, half strength brain heart infusion (BHI) broth to promote germination of contaminant spores on incubation, and an antibiotic mixture of vancomycin, amphotericin B and nalidixic acid (VAN) to destroy contaminant vegetative organisms.134 However, the decontamination process has a negative effect on Map. Routine decontamination protocols decrease the number of Map organisms by about 2.7 log10 and 3.1 log10 for faeces and tissues, respectively.135 HPC is recommended as the decontaminant of choice. Despite these decontamination procedures, in Australian studies 11% of bovine faecal cultures,136 7% of ovine faecal cultures137 and 0.13% of ovine tissue cultures137 in liquid media were mixed (i.e. contained ‘contaminating’ organisms), while in the USA up to 60% of faecal cultures from 490 cattle were mixed cultures.138 Decontamination of tissues can be undertaken using either the method described above for faeces, or a simpler method based on HPC decontamination.
There are two techniques for the isolation of Map: (i) using solid media and (ii) using liquid media. The latter method can reduce the time required for obtaining a result and is considered to be the more sensitive technique.102, 136, 139 The decontamination protocol involving double incubation of faecal samples in HPC and a mixture of antibiotics (VAN) may further improve culture sensitivity.136 The addition of ampicillin to the media has been reported to reduce the growth of undesired microbes.137, 140
Most laboratories in Australia and New Zealand use a liquid media culture method for primary isolation, whereas culture on solid media is mainly used to determine mycobactin 500 dependency of isolates. A number of publications have shown that for primary isolation, liquid culture methods have considerably greater sensitivity than solid media culture, regardless of the strain of Map.92, 102, 104, 136, 138, 141, 142 The lower sensitivity of solid media is only partially disguised by the fact that protocols often specify inoculation of multiple (up to four) solid media slopes.138 Liquid culture is recommended for primary culture of Map in Australia.
Samples
Collection procedures for bacteriological tests should avoid contamination of specimens with environmental fungi or bacteria. Sample jars must be refrigerated after collection. Specimens should be refrigerated for transport to the laboratory (using at least a chiller brick in an 510 insulated box). All specimens must reach the laboratory within 48 hours of collection. Subsequent laboratory processing of both faecal and tissue samples should occur within 48 hours of receipt. Where this is not possible, it is recommended that specimens be stored frozen at -80oC.
Individual faeces
At least 2 g of faeces should be collected directly from the rectum and placed in a sterile, leak-proof, plastic container. Use separate clean gloves when multiple individual samplings are made.
Faeces for PFC test (cattle, alpaca, sheep and goats)
For the PFC test, faeces are collected from five cows, or five alpacas, per pool (at least 2 g 520 from each animal) as described above for individual faeces.
Johne’s Disease
Australian and New Zealand Standard Diagnostic Procedure, July 2015 Page 14 of 68
Individual faecal pellets are collected from up to 50 sheep or 25 goats and pooled for culture. Collect one pellet directly from the rectum of each animal, using a gloved finger, and place in a sterile screw capped jar. If an animal has soft faeces, collect an amount of faeces equivalent to a pellet.
Change gloves after collection of faeces from each pool. A change of gloves between individuals in a pool is recommended when groups of animals with high value or high risk of infection are sampled, to avoid later misidentification of infected individuals. Pooling of cattle faeces is best done in the laboratory, to ensure that the pooled sample contains an equivalent volume from each animal. It is necessary to identify animals in each pool by ear 530 tags or other methods and to record this information on the specimen advice form, to enable later follow-up of individual animals if required.
Tissues
Collect small (approximately 10 g) pieces of relevant sections of small intestine, large intestine and associated lymph nodes (refer above section 'Histopathology' for recommended tissues) into sterile leak proof plastic containers using aseptic technique.
Reagents and Materials
There are several liquid media culture systems available for Map but only one has been validated in Australia (M7H9C, University of Sydney).143 It is a modified non-radiometric Middlebrook 7H9 broth media with additives and replaces the radiometric BACTEC 460 540 culture system which was based on BACTEC 12B media (Becton Dickinson). Like the former system, M7H9C is suitable for cultivation of S and C strains of Map. The incubation time is 12 weeks for C and S strains, and requires PCR testing of all cultures. Manufacture of the M7H9C medium is based on commercial Middlebrook 7H9 base to which casitone (667 mg/L) is added, and the media is supplemented with commercially-available ADC enrichment (albumin faction V, bovine; dextrose; catalase) (26.7 mL/L), egg yolk (167 mL/L), mycobactin J (0.83 mg in 16.7 mL/L) and an antibiotic mixture (polymyxin B, amphotericin B, nalidixic acid, trimethoprim and azlocillin). Among other liquid media culture systems, MGIT 960 (Becton Dickinson) is only suitable for cultivation of C strains.140,
144 550
There are two commonly used solid media for the diagnostic isolation of Map in Australia and New Zealand: Herrold’s egg yolk agar (HEY) and modified Middlebrook 7H10.102 Both media are supplemented with egg yolk and mycobactin. The latter media supports the growth of both S and C strains,102 whereas HEY primarily supports the growth of C strains.145, 146 Although there are reports that Lowenstein-Jensen (LJ) media with mycobactin is suitable for the isolation of S and C strains found in Europe, in general very prolonged incubation periods are needed for these media.145, 146 The addition of sodium pyruvate to HEY may inhibit the growth of some isolates, but in most cases substantially increases the recovery rate and number and size of colonies.134, 145, 147, 148 Other media, such as Dubos media and Watson-Reid media, are not recommended for routine culture of clinical specimens. 560
Primary colonies of Map on solid media may be expected to appear any time after 3 weeks following inoculation, but may not appear for months. The sheep strains grow less well than the cattle strains, and primary cultures on solid media should not be discarded as negative without prolonged incubation, as some may take 6-8 months,145 although incubation beyond 20 weeks is less practical.

Johne’s Disease
Australian and New Zealand Standard Diagnostic Procedure, July 2015 Page 15 of 68
Colonies of the cattle strain of Map on HEY media are typically convex, off-white to cream or buff coloured and non-chromogenic. As cultures age and media dry out, colonies and media tend to become more buff- or beige-coloured and more raised. Colonies are soft, moist, glistening, non-mucoid and remain miscible with water. Colony size is initially pinpoint, and many remain at 0.25 to 1 mm and tend to remain small when colonies are numerous on a 570 slope. Older isolated colonies may reach 2 mm. On modified 7H10 media, colonies of the cattle strain are less convex than those on HEY, especially in aged cultures; are pinpoint to approximately 1 mm in diameter, and being buff-coloured are only slightly lighter than the media. Compared with colonies of cattle strains on HEY, those on 7H10 are more difficult to detect (due to less contrast in colour between colony and media) and to differentiate from colonies of some other mycobacteria.
Colonies of the sheep strain of Map on modified 7H10 are convex, shiny, raised, white to off-white, and difficult to distinguish against the background colour of the media. Colonies are typically between pinpoint and 0.5 mm in diameter, but can reach 1 mm, and rarely 1.5 mm if few colonies occur on a slope.102, 146 580
Colonies of Map often appear as a mixed culture with other taxa. Saprophytic mycobacteria may have a similar appearance on either media but are often evident after 5-7 days. Other organisms may grow on both media with colonies appearing after days or months.
Test Procedures
A range of volumes of sample materials and their associated solutions have been successfully applied for Map culture, with a general aim to provide sufficient source material but reduce levels of potential contaminants. The protocols described here afford a range of such volumes.
Decontamination of individual faeces for culture
Method 1: Mix 1.2 to 3 g faeces with 10-15 mL saline or water. After 30 minutes sedimentation, the top 3-5 mL is transferred to 20-25 mL 0.9% HPC in half-strength BHI 590 broth. (It is important to avoid transfer of the faecal sediment, so the volume transferred may be variable). After incubating at 35-37oC for 16–26 hours, the inoculated HPC in half-strength BHI is centrifuged at 900-1200 g for 30 minutes (keep temperature >10oC to avoid precipitation).
Method 2: Alternatively, 2 g of faeces is mixed vigorously in 35 mL 0.75% HPC in half-strength BHI broth and after incubation as above, 20 mL of the supernatant is transferred (avoiding fibrous sediment) and centrifuged as above.
Discard the supernatant fluid and re-suspend the pellet in 1 mL of VAN or VAN/BHI solution. Incubate at 37oC for 24–72 hours (72 hours is recommended to minimise contamination) and 0.1 mL of the re-suspended pellet is inoculated into the culture media. 600
Homogenisation of pooled faeces
Work must be conducted in a manner that minimises the risk of sample-to-sample cross-contamination. The method of homogenisation of pooled faeces prior to culture or HT-J faecal PCR is dependent on the sample type and availability of equipment. If it is desired to prepare a common suspension for use in culture and for testing by direct faecal PCR using the HT-J protocol, refer to the ‘High Throughput Johne’s (HT-J) Direct PCR Assay’ section for the

Johne’s Disease
Australian and New Zealand Standard Diagnostic Procedure, July 2015 Page 16 of 68
appropriate volume and step for inclusion of pooled material.
Method 1: Homogenisation using a Waring commercial blender. Faecal pellets from up to 50 sheep or 25 goats, or faecal samples (2 g each) from five cows or five alpaca are completely 610 homogenised using the Waring commercial blender base with 250 mL stainless steel blenders, without the addition of saline. For culture and HT-J, the homogenised faecal sample prepared in this way may be treated the same as an individual faecal sample. Refer to the section on ‘Decontamination of individual faeces for culture’ for sedimentation method.
Method 2: Homogenisation using a stomacher system with added saline. The supernatant from the sedimentation step for each of the variants described below (2.1, 2.2 and 2.3) is suitable to proceed to ‘Decontamination of pooled faeces for culture’.
Method 2.1: In sheep or goats, the submitted faecal sample (pooled pellets from up to 50 individual sheep or 25 goats) is weighed, added to a blender/stomacher bag containing a volume of 0.85% saline (1:1) and homogenised for a minimum of 1 minute. For a 1:1 620 homogenisation mixture, a universal screw-topped container with 50 sheep pellets contains approximately 40-50 g, so requires 40-50 mL saline. From this homogenate, 3-4 mL of the mixture is transferred to a 20-25 mL screw-topped tube (or centrifuge tube) containing 10 mL of saline. After mixing by hand, the material is allowed to settle for 30 minutes (but not more than 60 minutes).
Method 2.2: In cattle and alpaca, faecal samples (2 g each) from five cows or five alpaca are added to a blender/stomacher bag containing a volume of 0.85% saline (1:1) and homogenised for a minimum of 1 minute (total 10 g of pooled faeces in 10 mL saline). From this, 3-4 mL is removed and added to 10 mL saline for sedimentation as described for method 2.1. 630
Method 2.3: Alternatively, for cattle and alpaca, a larger saline volume can be used; for example a total of 10 g pooled faeces can be mixed with 50 mL saline (1:5), of which 10 mL is removed post homogenisation and added to 10 mL saline for sedimentation as described for method 2.1.
Decontamination of pooled faeces for culture
3-5 mL of supernatant from the sedimentation tube (containing saline) is added to a 25 mL tube containing 20 mL of 0.9% HPC in half-strength BHI, mixed, incubated at 37oC for 16–26 hours and centrifuged at 900-1200 g for 30 minutes (keep temperature > 10oC to prevent HPC precipitation). After discarding the supernatant, the pellet is re-suspended in 1 mL of VAN or VAN/BHI, incubated at 37oC for 72 hours and 0.1 mL of the re-suspended pellet is 640 inoculated into the culture media.

Johne’s Disease
Australian and New Zealand Standard Diagnostic Procedure, July 2015 Page 17 of 68
A general procedure for individual faecal culture is shown in Figure 1. 650 660 670 Figure 1. Steps in Map culture from an individual faecal sample based on centrifugation/double incubation method 1. 680
Mix individual faeces
(1.2-3 g)
in saline (10-15 mL)
Sediment for 30 minutes
Take 3-5 mL supernatant and add to 20-25 mL 0.9% HPC in ½ strength BHI to make a final concentration of approximately 0.75% HPC.
Incubate at 37oC for 16-26 hours
Centrifuge at 900-1200 g for 30 minutes and
discard supernatant.
Re-suspend pellet in 1 mL VAN or VAN/BHI.
Incubate at 37oC for 72 hours
Add 0.1 mL pellet mixture to
liquid culture medium

Johne’s Disease
Australian and New Zealand Standard Diagnostic Procedure, July 2015 Page 18 of 68
General procedures for pooled faecal culture are shown in Figure 2. Supernatant after the sedimentation step can be used for direct PCR (HT-J) testing; refer to the ‘High Throughput Johne’s (HT-J) Direct PCR Assay’ section for the appropriate volume and step for inclusion of pooled material.
Figure 2. Steps in Map culture from a faecal pool based on centrifugation/double incubation method, with homogenisation using either a Waring blender without saline (top left) or stomacher-type systems with saline (top centre and top right).
Method 2.3
Homogenise 10 g faecal pool in 50 mL saline (1:5) in
a stomacher
Subsample 10 mL of 1:5 homogenate into 10 mL
saline (equivalent to 1.5-2 g original faeces) and
sediment for 30 minutes
Method 2.1, 2.2
Homogenise faecal pool in saline (1:1) in a stomacher
Method 1
Homogenise faecal pool in Waring blender
Mix 1.2-3 g into 10-15 mL saline and sediment
for 30 minutes
Subsample 3-4 mL of 1:1 homogenate into 10 mL saline (equivalent to 1.5-2 g original faeces) and sediment for 30 minutes
Take 3-5 mL supernatant and add to 20-25 mL
0.9% HPC in ½ strength BHI to make a final concentration of
approximately 0.75% HPC.
Incubate at 37oC for 16-26 hours
Centrifuge at 900-1200 gfor 30 minutes and
discard supernatant. Re-suspend pellet in 1 mL VAN or VAN/BHI.
Incubate at 37oC for 72 hours
Add 0.1 mL pellet to liquid culture medium

Johne’s Disease
Australian and New Zealand Standard Diagnostic Procedure, July 2015 Page 19 of 68
Decontamination of tissues for culture
Two methods to disrupt and decontaminate tissues have been applied successfully in 690 Australia. One is based on the double incubation/centrifugation method used for faeces while the second uses a sedimentation technique with decontamination of homogenised tissue in 0.75% HPC for 72 hours and inoculation of sediment. In general the culture contamination rate for tissue samples is very low, suggesting that both approaches are highly effective.
Method 1: Finely chop 2 g of tissue sample (trimmed of fat) using a sterile scalpel blade or scissors and homogenise or process in a stomacher in 25 mL of 0.75% HPC for 1 minute. Allow the sample to stand so that foam dissipates and larger pieces of tissue settle. Pour tissue homogenate into a centrifuge tube taking care to avoid carry-over of fat or large tissue pieces. Allow to settle for 30 minutes, then take 10 mL of cellular suspension from just above the sediment into a 30 mL centrifuge tube and incubate at 37oC for 3 hours. Centrifuge at 900 g 700 for 30 minutes, discard the supernatant fluid and re-suspend the pellet in 1 mL of VAN or VAN/BHI. Incubate at 37oC overnight. Inoculate media as described below. Alternatively, a sedimentation technique for tissues involves decontamination of homogenised tissue in 0.75% HPC for 24 to 72 hours and inoculation of sediment onto media.
Method 2: With sterile forceps, finely chop 2 - 5 g of tissue sample (trimmed of fat) using a sterile scalpel blade or scissors and add to either a glass homogeniser jar or a 80-100 mL stomacher bag containing 2-4 mL sterile 0.85% w/v saline solution. Homogenise in the homogeniser jar for approximately 10-30 seconds at full speed (increasing speed gradually) or in the stomacher for 2 minutes. Note that if using an homogeniser, do not allow the specimen to heat up through prolonged homogenisation. Avoiding any obvious pieces of 710 tissue, transfer 2 mL of tissue homogenate to 25 mL of 0.75% HPC (or 2-5 mL homogenate to 30 mL of 0.75% HPC) in a sterile 30-35 mL polycarbonate tube. Mix by inverting a couple of times, then incubate at room temperature (approximately 23oC), away from light for 72 hours. Avoid disturbing the HPC and inoculate 0.1 mL of the sediment layer at the bottom of the tube into 7H9 liquid media.
Inoculation and incubation of solid media cultures
Primary culture onto solid media is not recommended as a routine procedure due to its lower sensitivity compared with liquid culture. Although solid media can be used successfully with samples from animals with high concentrations of Map in faeces or tissues (such as clinical cases), solid media is only recommended for routine use as a subculture from liquid 7H9 broth 720 to confirm mycobactin dependence, colonial morphology and to obtain purified material for strain typing or storage/lyophilisation. It is important to note that a false negative culture outcome rate of 30% can be expected when liquid media is subcultured to solid media due to the lower capacity of solid media to support growth.137 As animals showing clinical signs consistent with Johne’s disease may be infected with Map at low levels but have clinical signs due to an unrelated condition, laboratory testing of samples using primary solid media for cultural confirmation should seek evidence to confirm high level shedding or infection (e.g. by demonstration of Ziehl-Neelsen positive smears from faeces or tissues) is present.
For cattle or sheep strains, culture of decontaminated sample material or 12 week broth culture material can be undertaken by adding 0.1 mL to 2-3 slopes of modified 7H10 media 730 supplemented with 2 µg/mL mycobactin J. For cattle strains only, culture to HEY supplemented with 2 µg/mL mycobactin J (HEYM) and sodium pyruvate and onto one slope of HEYM without sodium pyruvate can be used. Incubate slopes at 35-37oC for at least 4

Johne’s Disease
Australian and New Zealand Standard Diagnostic Procedure, July 2015 Page 20 of 68
months but preferably 6 months. Subsequent subculture of colonies resembling Map onto media with and without mycobactin is used to demonstrate mycobactin dependence. Care should be taken not to transfer excessive amounts of culture or parts of the solid media, as this can inadvertently transfer a small amount of mycobactin and make mycobactin dependency testing invalid.
Inoculation and incubation of M7H9C broth cultures
Inoculate 0.1 mL of decontaminated sample into one supplemented M7H9C tube. Incubate at 740 35-37oC for 12 weeks for all samples (i.e. for cattle and sheep strains). After the 12 week incubation assess all cultures by IS900 PCR tests recommended in the section ‘PCR testing to confirm Map’ below. If desired, subculture to solid media for mycobactin dependence testing can be carried out at this stage.
Negative and positive controls must be included in each batch of specimens for culture. Ideally the positive samples should be authentic faecal samples from animals with Johne’s disease, but spiked faeces may be used if authentic samples are not available.
Interpretation of Results
The identification of Map isolates commonly relies on the slow growth rate of acid-fast bacilli, demonstration of mycobactin dependency and detection of IS900, a DNA fragment 750 that is considered to be unique for the Map genome.15, 16 Ziehl-Neelsen staining of colonies to demonstrate acid-fastness is not obligatory for operators with extensive experience in recognition of typical colonies of Map, but is recommended where there is doubt that colonies are typical of Map. Similarly, the Ziehl-Neelsen stain may be applied on liquid cultures to confirm the presence of acid fast organisms. However, mycobacteria other than Map may be present and cannot be distinguished from Map, and the sensitivity of Ziehl-Neelsen staining is low relative to PCR.
Mycobactin Dependency Assay
Principle of the Test 760
For the demonstration of mycobactin dependency, a small inoculum of suspect colonies should be subcultured on solid media with and without mycobactin. Mycobactin is present in the cell wall of the organism, and heavy inoculum may contain enough of this compound to support the growth of Map on the media without mycobactin, leading to misidentifications and false negative results. Mycobactin dependency tests for cattle strains can be performed on HEY media or modified 7H10 media, whereas tests on the sheep strain must be performed using modified 7H10 media.
In addition, the identification process may be confounded by infections caused by mycobactin-dependent M. avium subsp. sylvaticum and M. avium subsp. avium strains,149-151 the difficulty in the isolation of some ovine strains of Map,37, 152-154 variations in mycobactin-770 dependence of the organism under different culture conditions,155 and presence of IS900-like genes in mycobacteria other than Map.121
Test Procedure
One colony from the solid media is mixed in 0.5 to 1 mL of phosphate-buffered saline (PBS, pH 7.2). Subculture 0.1 mL volumes of the prepared suspension or liquid culture to slopes of

Johne’s Disease
Australian and New Zealand Standard Diagnostic Procedure, July 2015 Page 21 of 68
media with and without mycobactin, in each case spreading the inoculum evenly over the surface of the slope, and incubate for up to 10 weeks. Alternatively, use a loop to make an even, light inoculum (from a single colony) onto tubes with and without mycobactin.
Interpretation of Results
Acid-fast bacilli that show significantly enhanced growth on media containing mycobactin 780 after at least 2 weeks incubation, with no growth on an un-supplemented slope, are considered consistent with Map. Acid-fast bacilli not dependent on mycobactin are classified as other mycobacteria (not Map).
PCR Testing to Confirm Map
Principle of the Test
Since the discovery of the first Map-specific repetitive insertion segment IS900 by Green et al. (1989),156 a number of primers that target IS900 have been published.106, 118, 157-165 Their specificity was evaluated using different numbers of Mycobacterium spp and other common bacteria.159, 161, 164-167 The occurrence of IS900-like sequences in non-Map isolates is 790 extremely rare but has caused some uncertainties about the specificity of PCR systems targeting IS900 for routine diagnosis. Over several decades of testing hundreds of thousands of samples of suspect Map cultures, IS900-like sequences have been found in three non-Map isolates related to M. scrofulaceum121 and one related to M. cookie,120 and false positive results obtained by IS900 PCR for some Mycobacterium avium complex (MAC) strains and non-Map isolates including two unidentified mycobactin-independent isolates, M. terrae, M. xenopi and M. chelonei.121, 167-170 Cousins et al (1999) found IS900-like sequences in Australian M. scrofulaceum-like organisms were present in fewer copy number than in Map and were able to be differentiated from IS900 in Map by restriction endonuclease analysis.121 As a general guide, primers must be selected from the specific (5’) end of IS900. In addition, 800 increased annealing temperatures of 62-68oC have been recommended to ensure specificity of conventional IS900 PCR used in Australia,162 as well as use of new IS900 primers that are not cross-reactive with other mycobacteria.118, 164
The identification of new DNA fragments considered unique to Map has provided additional targets for rapid identification of this organism using PCR technology. Such sequences include ISMap02,171 ISMav2,172, 173 f57,164, 174-176 hspX,177 and locus 255.178, 179 Assays for the new sequences have been developed for standard (gel-based) or quantitative (real time)118 PCR platforms, with the former including single172, 173 or nested164, 171 applications. Multiplex real time PCR assays that target various combinations of these sequences have been reported (e.g. IS900, f57 and ISMap02,180 or f57 and ISMav2181). However, the PCR tests based on 810 new sequences usually have reduced analytical sensitivity due to lower copy numbers of target DNA in the Map genome compared to IS900.172, 174, 177, 182 While IS900 is present in 15-20 copies156 (average 17 copies171) in the Map genome, f57 and locus 255 are single copy genes,180 ISMav2 is present in 3 copies,180 and ISMap02 is present in 6 copies.171 Due to copy number differences it is not uncommon for assays of samples that contain Map to yield negative results for f57 whereas IS900 is positive;183-185 this is not useful in a diagnostic setting. In addition, conventional PCR assays that use a nested approach require high levels of containment to avoid amplicon contamination, thus posing difficulties for routine diagnostic application, and so are not recommended. Redesign of some published primers for
Johne’s Disease
Australian and New Zealand Standard Diagnostic Procedure, July 2015 Page 22 of 68
the newer sequences may also be required if evidence of cross-reactivity is confirmed. Mobius 820 et al179 reported that stringent selection of IS900-specific primers will ensure that IS900 remains a favourite target sequence for amplification of Map specific loci. They found single round standard PCR systems based on f57 and locus 255 were reliable, but revision of ISMav2 primers was necessary.
For the identification of culture-derived isolates, a PCR test based on primers that target a specific segment of the insertion sequence IS900 is recommended. Conventional IS900 PCR tests using primers described by Vary et al (IS900/150C, IS900/921, 229 bp target)159 or Moss et al (P90, P91, 400 bp target)186 as modified by Millar et al (P90+, P91+, 413 bp target)160 have been used successfully in Australia, while for real-time assays, the primer set described by Kawaji et al (MP10-1, MP11-1, 183 bp target)118 is recommended. The 830 quantitative IS900 PCR methodology used to detect Map as part of the HT-J direct faecal quantitative PCR (qPCR) protocol119 incorporates the MP10-1 and MP11-1 primers from Kawaji et al and is sensitive and specific for use in the detection of Map in liquid cultures (K. Plain, personal communication 2014). Primers for the Mycobacterium genus based on the 16S rRNA sequence can also be included in the PCR mix to produce a multiplex conventional PCR that can differentiate Map from other Mycobacterium spp that grow in liquid or on solid media.187 Restriction endonuclease analysis of conventional IS900 PCR product with an enzyme such as Hae III (in the Vary system) or Mse I (in the Moss/Millar system) is recommended to achieve high specificity of the assay.121
All PCR methods, both conventional and real-time variants, should be validated and 840 optimised in each laboratory to determine, for example, the optimum concentrations of each of the essential components in the reaction (primers, enzyme, MgCl2 and nucleotides) and the temperature and time of each of the cycles used in amplification.188 Appropriate laboratory practice should be instituted to prevent contamination.189
Special Requirements for PCR-based Methods
Preparation of samples from colonies on solid media
A sample of colony growth (normally one colony is sufficient) is mixed in 100 μL of purified sterile water, or a commercial DNA preparation solution (e.g. Prepman Ultra, ABI). The suspension is heated at 95-100oC for 10-15 minutes and centrifuged at high speed (14,000 g in a standard bench-top centrifuge). At this stage, supernatant can be stored frozen at -20oC. 850 Dilution of the supernatant as template for PCR may be required to obtain a positive result.
Preparation of samples from liquid culture
The presence of egg yolk has been found to inhibit the PCR reaction. At the end of the incubation period this can be overcome by:
(a) subculture into liquid media without egg yolk; or (b) by removing the egg yolk from the primary culture by alcohol precipitation; or (c) using a commercial extraction kit known to effectively reduce PCR inhibition in the
PCR platform to be utilised; but this approach requires validation.
Procedures (a) and (b) above can be performed as follows:
(a) Inoculate 100 μL of the positive sample into liquid 7H9 media with mycobactin J but 860 without egg yolk or PANTA. Incubate the subculture for about 14 days, at which stage 200 μL is removed and heated to 100oC for 30 minutes to make ready for testing.139

Johne’s Disease
Australian and New Zealand Standard Diagnostic Procedure, July 2015 Page 23 of 68
(b) To precipitate egg yolk, 200 μL of culture is transferred to 500 μL absolute ethanol and allowed to stand for 2 minutes before centrifuging at low speed (8 g for 10 minutes) to deposit egg yolk on the wall of the tube. The supernatant is centrifuged at high speed (18,000 g for 5 minutes). The resulting pellet is washed twice in PBS, re-suspended in 50 μL sterile purified water and heated at 100oC for 20 minutes to make ready for testing.102
Preparation of samples from fixed tissue
A sample of paraffin-embedded tissue is prepared for PCR according to Whittington et al 870 (1999).113
Test Procedure
Conventional IS900 PCR procedures
A minimum annealing temperature of 60oC and 35 cycles of amplification should be used for IS900 primers. Suggested primers and products for IS900 PCR application to culture material or fixed tissue are outlined in Table 1, while controls that must be run with each PCR or REA are shown in Table 2.
For the 900M and 900V reaction, the PCR conditions are as described by Whittington et al,102,
142 with a single denaturation cycle of 94oC for 2-3 minutes, followed by 37 cycles of denaturation at 94oC for 30 seconds, annealing at 62oC for 15 seconds and extension at 72oC 880 for 1 minute. The 900M primers are as follows: P90: GAA GGG TGT TCG GGG CCG TCG CTT AGG; P91: GGC GTT GAG GTC GAT CGC CCA CGT GAC. The 900V primers are as follows: 150C: CCG CTA ATT GAG AGA TGC GAT TGG; 921: AAT CAA CTC CAG CAG CGC GGC CTC G.
Table 1. Suggested IS900 PCR reactions
Source material
Target Reaction (name)
Forward Primer
Reverse Primer
Predicted Product
(bp)
Reference
Culture IS900 900 M P90+ P91+ 413
Millar et al 1996 160
Fixed tissue IS900 900 V 150C 921 229 Whittington et al 1999 113 Vary et al 1990 159
890
Table 2. Controls required for IS900 PCR and REA assays
Control type PCR controls REA controls Positive Extraction from Map positive
ovine faeces or tissue PCR product from extraction positive control
Positive Map cattle strain PCR product from Map cattle strain control
Positive - Uncut PCR product from

Johne’s Disease
Australian and New Zealand Standard Diagnostic Procedure, July 2015 Page 24 of 68
Map cattle strain control (i.e. not exposed to enzymes)
Negative PCR MilliQ water (PCR MQW)
REA MilliQ water (REA MQW)
Negative PCR cocktail only REA cocktail only Negative Extraction from negative
control faeces/tissue -
For conventional (standard) PCR systems, 5–10 μL of PCR product is subjected to electrophoresis in a 2% gel at 80-100 V for 0.6-1 hour and stained with 0.5 μg/mL ethidium bromide or 1 GelRed® (Biotium Inc.) or equivalent alternative to ethidium bromide. Amplified product is visualised using an ultraviolet transilluminator and photographed. The 900 size of the amplified products is estimated after comparison with an appropriate molecular weight ladder and the expected size of the IS900 product based on the positive control. This will depend on the primer sequences selected for use in the PCR reaction.
Where a multiplex PCR is used for Map confirmation as described by Wilton and Cousins 1992,190 a positive result should produce two amplified products: one consistent with the genus target (1030 bp in size) and the other consistent with the size of the targeted IS900 sequence. Other Mycobacterium spp should produce only the genus band in the multiplex PCR.
REA procedures on conventional IS900 PCR product
REA of the amplified product is recommended for routine use of conventional IS900 PCR to 910 confirm that the sequence of the amplified product is consistent with the known Map sequence. Alternatively, the amplified product can be sequenced in its entirety. The isolate may also be tested for other DNA fragments that are considered unique for Map,164, 171, 172, 177 although the sensitivity of such assays will be lower than those based on IS900.
For conventional PCR, results of laboratory testing may range from a trace reaction to a strong band of appropriate molecular size in the gel. REA can only be performed on IS900 amplified products that show a specific gel band (i.e. a positive result). The volume of amplified product required for REA is determined according to the intensity of the observed specific amplified product. As a guide, a volume range for the different PCR reactions is shown in Table 3, where a PCR reaction grade 4+ is a very strong positive gel line, and a 0.5 to trace represents 920 a barely visible line of reaction.
In the case of IS900 PCR using the Vary primers, the Hae III REA digest results in visible fragments of 60 and 137 bp from Map (two smaller fragments of 12 and 20 bp are generated but will not be visible), whereas in the Moss/Millar system, the Mse I digest produces fragments of 130 and 283 bp. Other enzymes may be used, based on logical choice from DNA sequence data.
Table 3. Volumes suggested for REA depending on strength of relevant PCR reaction 930
IS900 PCR reaction grade Volume range suggested for REA (L)
4+ 1-5 3+ 2-6

Johne’s Disease
Australian and New Zealand Standard Diagnostic Procedure, July 2015 Page 25 of 68
2+ 5-12 1+ 10-19.2
0.5 to trace 19.2
940
950 Figure 3. Suggested grading of amplified product for REA estimation. This figure is derived from an IS900 PCR using the 900M reaction and a 10 fold DNA dilution series. 20 µL of PCR product was added to the gel directly from the PCR tube after adding 4 µL of loading dye. Dilutions are shown at the top of each lane. NC: negative control. LM8: molecular weight ladder, showing 404 bp marker relative to the expected specific 413 bp product. 960 The REA cocktail volume is determined by the number of samples plus 1 spare for every 10 tubes. The following tables can be used as a guide to calculate the cocktail reagent volumes for IS900 REA reactions. When gel bands of 2+ to 4+ are found in the 900M, 900V PCR, routine REA volumes of 16 L according to Table 4 can be applied. For weak gel bands of up to 1+, reactant volumes need to be increased to 25 L according to Table 5.
970
Table 4. Reagents for routine REA for 900M or 900V, for a volume of PCR product (X) to a maximum of 12.3 L
Reagent Volume per tube
(µL) Final
concentration/amount
MQW Up to final volume 10 NE Buffer 2 1.6 1 10 BSA (1g/L) 1.6 1.6 g
10-3 10-4 10-5 10-6 10-7 10-8 10-9 10-10 NC LM8
- 404 bp

Johne’s Disease
Australian and New Zealand Standard Diagnostic Procedure, July 2015 Page 26 of 68
Mse 1 (4 U/L) 0.5 2 U Cocktail Volume 16-X PCR product X Final Volume 16
Table 5. Reagents for special REA reaction for 900V or 900M for a volume of PCR product (X)
to a maximum of 19.2 L
Reagent Volume per tube (µL)
Final concentration/amount
MQW Up to final volume 10 BSA (1g/L) 2.5 2.5 g Mse 1 (4 U/L) 0.8 3.2 U Cocktail Volume 25-X PCR product X Final volume 25
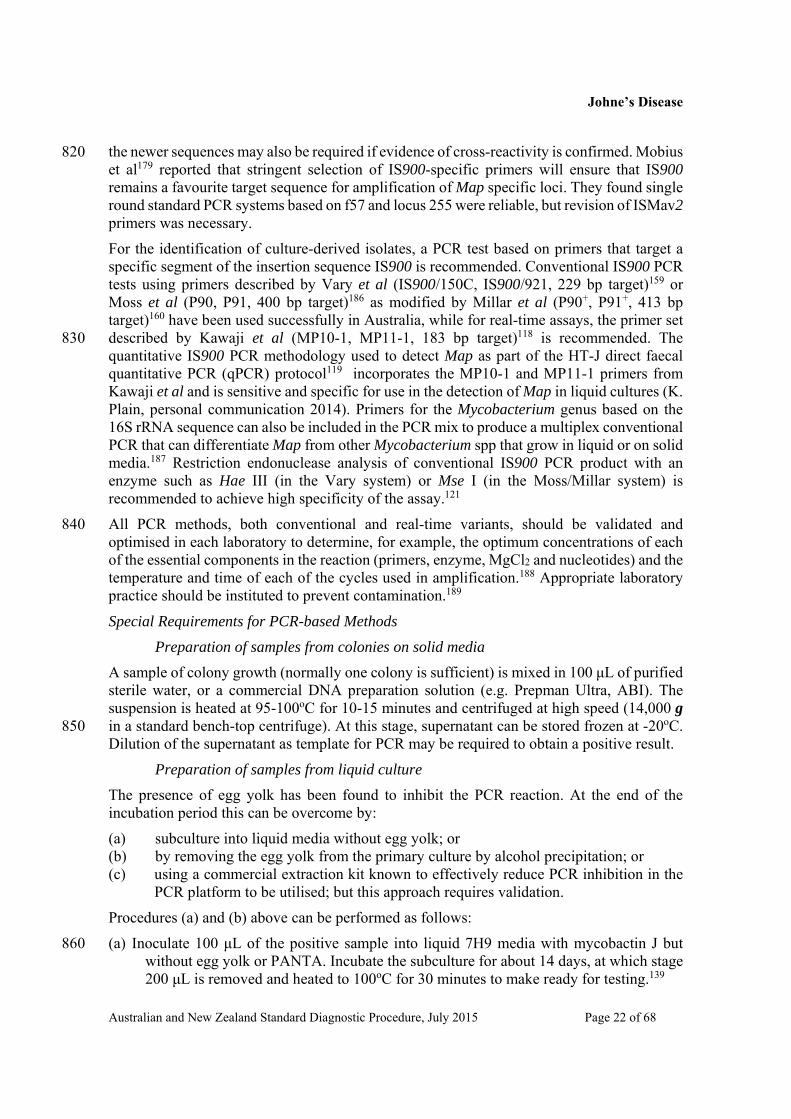
980 For IS900 REA, 3% agarose is typically used to visualise the results of electrophoresis, with appropriate molecular weight markers (e.g. Roche Molecular Weight Markers VIII). The entire volume of digested product (including loading buffer) is run. The predicted REA band sizes for IS900 assays 900M and 900V are shown in Table 6, while Figure 4 shows the expected gel profile for Map.
Table 6. Predicted band sizes for Map IS900 REA based on reactions 900M and 900V. Uncut cattle strain control will show a single band at 413 or 229 bp depending on the reaction
type. 990
REA reaction
PCR product
(bp)
Enzyme Species Predicted REA bands (bp)
900M 413 Mse 1 Map 130, 283
900V
229 Mse 1 Map 70, 159
900V 229 Hae III Map 12a, 20a, 60, 137
a Bands at 12 and 20 bp not visible

Johne’s Disease
Australian and New Zealand Standard Diagnostic Procedure, July 2015 Page 27 of 68
IS900 PCR and REA quality control acceptance criteria
For the IS900 PCR, the negative controls (PCR MQW, PCR cocktail, negative sample control) must show no bands. The positive controls (extraction positive control, cattle strain positive control) will show a single band equivalent to the original target of the PCR assay used.
For the IS900 REA, the negative controls (REA MQW, REA cocktail) must show no bands. The positive controls (extraction positive control, cattle strain positive control, uncut cattle strain 1000 positive control) will show bands as indicated in Table 6.
Samples found positive in the standard IS900 PCR/REA should be interpreted as containing ‘DNA consistent with Map’.
1010
IS900 real-time PCR procedures
The primer set described by Kawaji et al (MP10-1, MP11-1, 183 bp target)118 is recommended. The quantitative IS900 PCR methodology used in the HT-J assay, described in this ANZSDP, incorporates the MP10-1 and MP11-1 primers from Kawaji et al (refer to the ‘High Throughput Johne’s (HT-J) Direct PCR Assay’ section for the method).119 For real-time PCR systems used to identify Map, the amplification curve of each sample and a melt 1020 curve analysis (if applicable) need to be visually examined for the presence of exponential and plateau phases and Tm consistent with controls, respectively. Other interpretation criteria related to limit of detection and limit of quantification may be required, depending on purpose and reaction chemistry. In general CT >40 are not meaningful.191
Figure 4. IS900 profiles of Map (900M) before REA (left) and after REA (right). Lanes 1, 3: Molecular weight markers Lane 2: Pre-digest with 413 bp band Lane 4: Post-digest with 130 and 283 bp bands

Johne’s Disease
Australian and New Zealand Standard Diagnostic Procedure, July 2015 Page 28 of 68
In real time PCR, results should be recorded as a DNA concentration and interpreted relevant to a positive-negative cut-point. Samples found positive in the IS900 real time PCR should be interpreted as containing ‘DNA consistent with Map.’
Strain typing of Map samples and cultures by PCR
Principle of the Test
Rapid molecular typing of Map in cultures is possible by evaluating sequence polymorphisms 1030 in the IS1311 gene by PCR and REA and is the most common method used in Australia.23, 192 Finer level typing is possible using RFLP, variable number tandem repeat (VNTR) or PFGE methods, but these require pure cultures.
For the identification of strain type from cultures, conventional IS1311 PCR primers described by Marsh et al (M56, M119, 608 bp target)23 are recommended. REA of the IS1311 PCR product with enzymes HinfI and MseI is required to identify the polymorphism associated with different types from Map cultures. Map strains can be separated into C, S and B (Bison) types, based on cytosine/thymidine (C/T) polymorphisms at base pair 223. At that site, the presence of cytosine and thymidine nucleotides occurs in C strains, only cytosine nucleotides in S strains and only thymidine nucleotides in B strains.23, 24, 192 Following REA, 1040 Map C strains are characterized by four gel bands at 67, 218, 285 and 323 bp, while S strains show two bands of 285 and 323 bp and B strains show three bands of 67, 218 and 323 bp.24,
193
Reagents and Materials
Sample preparation as described for the IS900 PCR.
Conventional IS1311 PCR procedures
For cultures, the 1311L reaction using primers as described in Table 7 is applied, while for fixed tissues the 1311S reaction is used. These primers and conditions are as described in earlier Australian studies.23, 24 The primers involve a single forward primer [M56 : GCG TGA GGC TCT GTG GTG AA] and one of the following reverse primers: M94: CAG CGA TCG 1050 TCG ACA GTG TG; M119: ATG ACG ACC GCT TGG GAG AC. The conditions are the same as for the 900M PCR. The controls required are shown in Table 8 and are similar to those used for the conventional IS900 PCR as described earlier.
Table 7. Suggested PCR reactions for application in Map REA procedures
Source material
Target Reaction (name)
Forward Primer
Reverse Primer
Predicted Product
(bp)
Reference
Culture IS1311 1311L M56 M119 608 Marsh et al 199923
Whittington et al 200124 Fixed tissue
IS1311
1311S
M56
M94
268
Marsh et al 199923
Table 8. Controls required for IS1311 PCR and REA assays 1060

Johne’s Disease
Australian and New Zealand Standard Diagnostic Procedure, July 2015 Page 29 of 68
Control type PCR controls REA controls Positive Extraction from Map positive
ovine faeces or tissue PCR product from extraction positive control
Positive Map cattle strain PCR product from Map cattle strain control
Positivea
Positive
Map bison strain
-
PCR product from Map bison strain control Uncut PCR product from Map cattle strain control (i.e not exposed to enzymes)
Negative PCR MilliQ water
REA MilliQ water
Negative PCR cocktail only REA cocktail only Negative Extraction from negative
control faeces/tissue -
a Only required where this is a likely outcome
IS1311 PCR REA procedure
REA can only be performed on IS1311 amplified products that show a specific gel band (i.e. a positive result). The volume of amplified product required for REA is determined according to the intensity of the observed specific amplified product. As a guide, a volume range for the different PCR reactions is shown in Table 9, where a PCR reaction grade 4+ is a very strong positive gel line, and a 0.5 to trace represents a barely visible line of reaction.
Table 9. Volumes suggested for REA depending on strength of relevant PCR reaction 1070
IS1311 PCR reaction grade Volume range suggested for
REA (L) 4+ 1-5 3+ 2-6 2+ 5-12 1+ 10-19.2
0.5 to trace 19.2
The REA cocktail volume is determined by the number of samples plus 1 spare for every 10 tubes. The following tables can be used to calculate the cocktail reagent volumes for IS 1311 REA reactions. When gel bands of 2+ to 4+ are found in the 1311L PCR, routine REA volumes of 16 L according to Table 10 can be applied, while for 1311S reactions of this strength, routine REA volumes of 16 L according to Table 11 are applicable. For weak gel bands of up to 1+, reactant volumes need to be increased to 25 L according to Tables 12 and 13. 1080
Table 10. Reagents for routine REA for 1311L, for a volume of PCR product (X) to a
maximum of 12.1 L

Johne’s Disease
Australian and New Zealand Standard Diagnostic Procedure, July 2015 Page 30 of 68
Reagent Volume per tube (µL)
Final concentration/amount
MQW Up to final
volume
10 NE Buffer 2 1.6 1 10 BSA (1g/L) 1.6 1.6 g Mse 1 (4 U/L) 0.5 2 U Hinf 1 (10 U/L) 0.2 2 U Cocktail Volume 16-X PCR product X Final Volume 16
1090
Table 11. Reagents for routine REA for 1311S, for up to 14.2 L of PCR product
Reagent Volume per tube (µL)
Final concentration/amount
MQW Up to FV 10 NE buffer 2 1.6 1 Hinf 1 (10 U/L) 0.2 2 U Cocktail Volume 16-X PCR product X Final Volume 16
Table 12. Reagents for special REA reaction for 1311L for a volume of PCR product (X) to a maximum of 18.9 L
Reagent Volume per tube (L) Final
concentration/amount MQW Up to final volume 10 NE buffer 2 2.5 1 10 BSA (1g/L) 2.5 2.5 g Mse 1 (4 U/L) 0.8 3.2 U Hinf 1 (10 U/L) 0.35 3.2 U Cocktail Volume 25-X PCR product X Final Volume 25
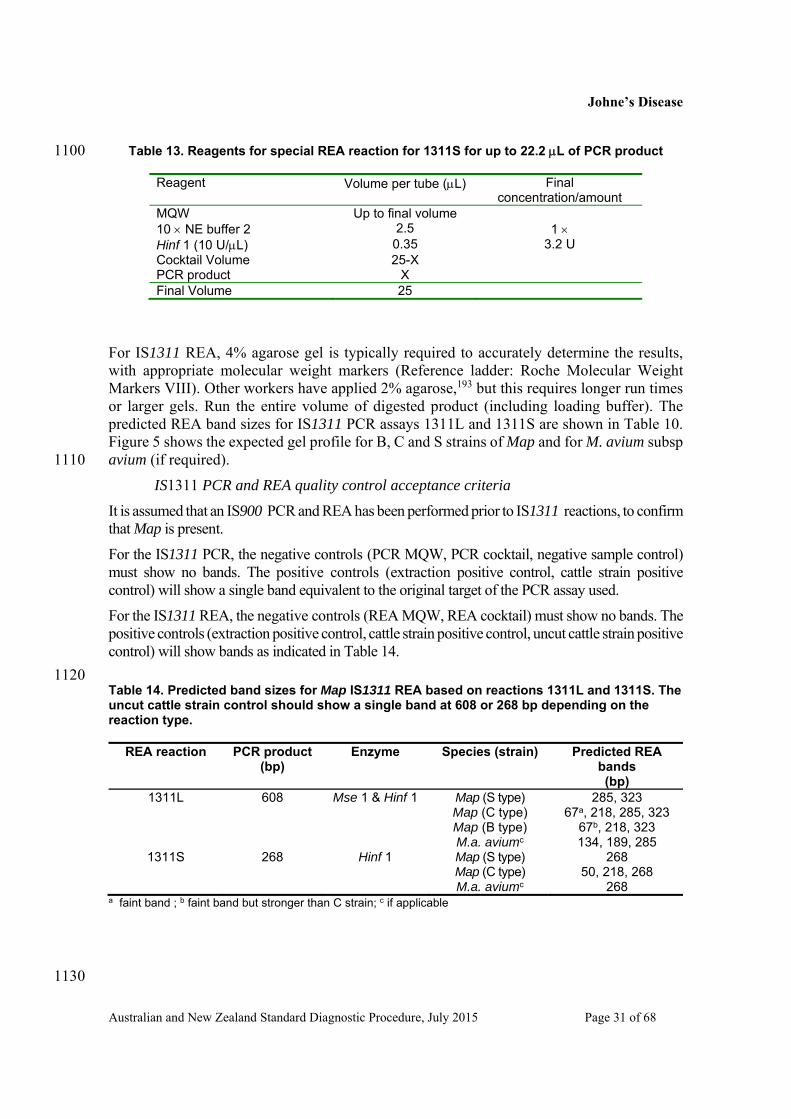
Johne’s Disease
Australian and New Zealand Standard Diagnostic Procedure, July 2015 Page 31 of 68
Table 13. Reagents for special REA reaction for 1311S for up to 22.2 L of PCR product 1100
Reagent Volume per tube (L) Final concentration/amount
MQW Up to final volume 10 NE buffer 2 2.5 1 Hinf 1 (10 U/L) 0.35 3.2 U Cocktail Volume 25-X PCR product X Final Volume 25
For IS1311 REA, 4% agarose gel is typically required to accurately determine the results, with appropriate molecular weight markers (Reference ladder: Roche Molecular Weight Markers VIII). Other workers have applied 2% agarose,193 but this requires longer run times or larger gels. Run the entire volume of digested product (including loading buffer). The predicted REA band sizes for IS1311 PCR assays 1311L and 1311S are shown in Table 10. Figure 5 shows the expected gel profile for B, C and S strains of Map and for M. avium subsp avium (if required). 1110
IS1311 PCR and REA quality control acceptance criteria
It is assumed that an IS900 PCR and REA has been performed prior to IS1311 reactions, to confirm that Map is present.
For the IS1311 PCR, the negative controls (PCR MQW, PCR cocktail, negative sample control) must show no bands. The positive controls (extraction positive control, cattle strain positive control) will show a single band equivalent to the original target of the PCR assay used.
For the IS1311 REA, the negative controls (REA MQW, REA cocktail) must show no bands. The positive controls (extraction positive control, cattle strain positive control, uncut cattle strain positive control) will show bands as indicated in Table 14.
1120 Table 14. Predicted band sizes for Map IS1311 REA based on reactions 1311L and 1311S. The uncut cattle strain control should show a single band at 608 or 268 bp depending on the reaction type.
REA reaction PCR product (bp)
Enzyme Species (strain) Predicted REA bands (bp)
1311L 608 Mse 1 & Hinf 1 Map (S type) Map (C type) Map (B type) M.a. aviumc
285, 323 67a, 218, 285, 323
67b, 218, 323 134, 189, 285
1311S 268 Hinf 1 Map (S type) Map (C type) M.a. aviumc
268 50, 218, 268
268 a faint band ; b faint band but stronger than C strain; c if applicable
1130
Johne’s Disease
Australian and New Zealand Standard Diagnostic Procedure, July 2015 Page 32 of 68
1140 1150
Interpretation of Results
Culture on solid media
Cultures with colonies of typical appearance that are mycobactin dependent are considered ‘consistent with Map’. If the colonies are demonstrated to contain IS900 on PCR/REA testing then the sample is considered ‘culture positive for Map’.
Cultures with no growth after the prescribed incubation period are considered negative on 1160 solid media culture. Where overgrowth of irrelevant microbes on solid media renders cultures uninterpretable, the culture is considered to be ‘contaminated’. This is equivalent to an inconclusive test outcome.
Liquid culture in M7H9C media
Liquid cultures may be subcultured to solid media to examine colony morphology and mycobactin dependence, or to obtain purified cultures for further study or storage. In ovine pooled faecal samples, a false negative culture rate of 10-25% can be encountered on subculture, reflecting the lower sensitivity of solid medium subculture compared with PCR of primary liquid cultures.137 The overall contamination rate of pooled and individual fecal culture with liquid media in Victoria was about 5-7% (JM Gwozdz, personal communication 1170 2013). In NSW the contamination rate (presence of irrelevant microorganisms in liquid cultures with or without Map) was 7% for ovine faecal culture and <0.2% for tissue culture.137
Isolates subcultured onto solid media from a sample of liquid culture that have typical colony appearance and are mycobactin dependent, are considered ‘consistent with Map’. If this sample is also shown to contain IS900 on PCR/REA testing (in either M7H9C broth or from
Figure 5. IS1311 REA profiles (1311L) for Map B, C and S strains and for M. avium subsp avium Lane 1 Consistent with M. avium subsp. avium Lane 2 Consistent with Map, bison strain Lane 3 Consistent with Map, cattle strain Lane 4 Consistent with Map, sheep strain Lane 5: Molecular weight markers

Johne’s Disease
Australian and New Zealand Standard Diagnostic Procedure, July 2015 Page 33 of 68
solid media) then the sample is considered ‘culture positive for Map’.
Where growth in liquid media is identified as being due to organisms other than Map, or where overgrowth of irrelevant microbes on solid media renders cultures uninterpretable, the culture is considered to be contaminated.
Liquid cultures that are positive for IS900 on PCR/REA testing are considered to have ‘DNA 1180 consistent with Map’. Growth of irrelevant microbes on solid media does not negate a finding from liquid media of DNA consistent with Map.
Liquid cultures that are negative for IS900 on PCR/REA are considered as ‘no Map detected’.
Liquid cultures that are negative for IS900 on PCR/REA and produce no growth on solid media subculture are considered as ‘negative’.
Liquid cultures that are negative for IS900 on PCR/REA testing and produce growth of irrelevant microbes on solid media subculture are considered to be ‘no Map detected, contaminated’.
High Throughput Johne’s (HT-J) Direct PCR Assay
Principle of the Test 1190
The HT-J direct PCR assay has been developed by the University of Sydney and EMAI to detect Map DNA in faeces. It is based on a semi-automated DNA extraction system that utilises bead beating and a commercial DNA extraction kit designed for robotic workstations, followed by qPCR procedures that utilise primers to detect the IS900 target and melt curve analysis based on SYBR green chemistry. The test has been validated for sensitivity and specificity with bovine and ovine faecal samples on two qPCR platforms (ABI 7500, Stratagene Mx3000). As a DNA-based assay, it does not rely on viable Map for detection, but storage of samples at -80oC is critical where processing cannot be undertaken on receipt at the laboratory. The test is based on primers and amplicon described by Kawaji et al (2007),118 modified and validated by scientists at the University of Sydney and EMAI.119 1200
Concurrent pooled faecal culture and HT-J assay
If it is desired to prepare an homogenised pooled faecal sample for testing by direct faecal PCR using the HT-J protocol, refer to ‘Homogenisation of pooled faeces’ in the culture section for detailed methods of pooling for various species. The volume of faeces/faecal suspension that is transferred to the HT-J assay is dependent on the faecal pooling method used. In general, if an homogenate is generated using a blender without the addition of saline (Method 1 under ‘Homogenisation of pooled faeces’), this material can be treated as for an individual faecal sample at Step 6 of the HT-J protocol. If an homogenate is generated with the addition of saline using a stomacher method (Methods 2.1, 2.2 and 2.3 under ‘Homogenisation of pooled faeces’), this material is added post-sedimentation at Step 9 of 1210 the HT-J protocol. The appropriate volume to add for each method variant is shown in Table 15.
Table 15. Calculation of the equivalent volume of faecal suspension to transfer post-sedimentation into the HT-J assay for each pooling method variant described in the 'Culture' section under “Homogenisation of pooled faeces”.

Johne’s Disease
Australian and New Zealand Standard Diagnostic Procedure, July 2015 Page 34 of 68
Pooling method variant
Volume of pooled faecal
homogenate
Volume of saline for
sedimentation
Equivalent amount of
faeces
Volume to be transferred after sedimentation
(Step 9 of HT-J protocol) Method 1 Refer to protocol - - -
Method 2.1 3-4 mL 10 mL 1.5 – 2.0 g 3.5 mL
Method 2.2 3-4 mL 10 mL 1.5 – 2.0 g 3.5 mL
Method 2.3 10 mL 10 mL 1.67 g 5-6 mL
Note 1: For pooling Method 1, the homogenised faecal sample may be treated the same as 1220 an individual faecal sample for the purposes of input volumes at Step 6 of the HT-J protocol. Note 2: The volumes in columns 2, 3 and 4 are derived from earlier described culture methods (refer Figure 2). The volumes described in column 5 are chosen for equivalence to the amount of faecal substrate for HT-J that would be present in 4 mL of supernatant from Method 1 (described at Step 9 of the HT-J procedure). Minimal variation from these specified volumes are recommended for test standardisation.
The full HT-J assay protocol includes: Part 1. HT-J faecal DNA extraction procedure (that incorporates the Qiagen Biosprint®96 One-For-All Vet kit), and, Part 2. HT-J qPCR procedure. 1230
Reagents and Materials
Reagents (including suggested suppliers)
Sterile saline (0.85% w/v) 100% ethanol (molecular grade) Isopropanol (molecular grade) BioSprint®96 One-For-All Vet, Qiagen (Cat no. 947057) SensiMix SYBR Low-ROX Kit, Bioline (Cat nos. QT625-02 [250 Reactions],
QT625-05 [500 Reactions], QT625-20 [2000 Reactions]) Water, nuclease free (molecular grade) (Sigma, Cat no.W4502) PCR Primers (Product size 183bp)118 1240
MP10-1: 5’-ATG CGC CAC GAC TTG CAG CCT -3’ MP11-1: 5’-GGC ACG GCT CTT GTT GTA GTC G-3’
Disposables
Plastic transfer pipette, sterile 1.5mL flip top tube (e.g. DNA Lo-Bind tubes 1.5mL, Eppendorf) 2.0 mL bead tube (Sarstedt, Cat no. 72.694.006) 10 mL centrifuge tube (Sarstedt, Cat no. 62.9924.284) 15 mL faecal tube (EasyFlip Centrifuge Tubes, JETBIOFIL, Cat no. CFT-212-150;
Sarstedt, Cat no. 80.623.111) 0.1 mm Zirconia/Silica Beads (BioSpec Products Inc, Daintree Scientific, Cat no. 1250
11079101z) P1000 tip (ART, Cat no. 2079E) P1000 tip Reach (ART, Cat no. 2079) P1000 tip wide bore (ART, Cat no. 2079G) 0.2 mL individually-capped PCR tubes (Scientific Specialties Inc. 3240-09)
Johne’s Disease
Australian and New Zealand Standard Diagnostic Procedure, July 2015 Page 35 of 68
96 well Real time PCR plate (Applied Biosystems, Cat no. 4346906)a 96 well Real time plate cover (Applied Biosystems, Cat no. 4311971)a a If using an alternative validated platform (e.g. Stratagene), appropriate plates and
covers should be used)
Equipment 1260
Pipettes covering a range of 10 μL to 1000 μL 25-1,250 μL multichannel Top pan balance Vortex machine Centrifuge with spin capability of 1,231 g Microfuge with spin capability of 16,060 g Mechanical cell disruption (bead beating) machine (e.g. Mini-beadbeater-96, Biospec
Products; Fast Prep® 24, MP Biomedicals; TissueLyser II, Qiagen)
Platforms
Automated magnetic particle processor (eg. KingFisher™ Flex, Thermo Scientific; 1270 MAGMAX™ Express 96, Ambion; BioSprint® 96 Workstation, Qiagen)
Note: The magnetic particle processor program script (BS96 Vet 100) for the BioSprint® 96 One-For-All Vet protocol can be obtained from Qiagen technical help and is able to be run by all of the above instruments.
Magnetic head suitable for deep well plates (available from supplier of magnetic particle processor if not standard)
Quantitative (real-time) thermocycler
Test Procedures
Specimen collection and handling
Faecal samples are collected in an appropriate sterile sample container by the veterinary 1280 practitioner. The samples are stored at 4oC by the veterinary practitioner prior to delivery and on ice whilst in transit to the laboratory. Samples are best sent to the laboratory as soon as possible, avoiding unnecessary delays in transit (e.g. delivered to the laboratory during weekdays avoiding storage over the weekend). On arrival at the laboratory, faecal samples should be either stored at -80oC or mixed thoroughly by hand using a wooden applicator stick and two aliquots removed and placed in sterile containers to enable both culture (if required) and HT-J testing. These aliquots and the remainder of the faecal sample should be stored at -80oC until DNA extraction is to be undertaken.
Part 1: HT-J faecal DNA extraction procedure
Important information regarding the BioSprint® 96 One-For-All Vet kit (Qiagen): This 1290 procedure incorporates in part a modification of the ‘Purification of Viral Nucleic Acids and Bacterial DNA from Animal Tissue Homogenates, Serum, Plasma, Other Body Fluids,Swabs, and Washes’ protocol described in the BioSprint® 96 One-For-All Vet Handbook (Qiagen, August 2009). Significant changes to the input volumes and processing steps for the sample have been made to optimise for Map detection in faecal matter. It is critical to follow the modified protocol steps described below, and not the handbook protocol. Sections of this protocol have been adapted from the BioSprint® 96 One-For-All Vet Handbook. Consult the above handbook for safety information, kit contents and storage recommendations, product

Johne’s Disease
Australian and New Zealand Standard Diagnostic Procedure, July 2015 Page 36 of 68
use limitations, warranty and quality control.
All steps including centrifugation are performed at room temperature (15–25°C) unless 1300 otherwise stated.
1. Key list all samples to be used. Prepare an extraction plan using the key listed samples.
2. Include the following controls for each extraction:
i. Positive control faeces from an infected animal, that produces a positive faecal culture result
ii. Negative control faeces from a non-infected animal, that gives a negative faecal culture result
iii. Process control, containing no faeces, only the buffers in the extraction process
3. Prepare reagents from the BioSprint® 96 One-For-All Vet kit as follows:
a. Buffer AW1. Supplied as a concentrate. Add 160 mL ethanol to the bottle. Tick 1310 to show ethanol has been added and record date. Reconstituted Buffer AW1 can be stored at room temperature for up to 1 year.
b. Buffer RPE. Supplied as a concentrate. Add 220 mL ethanol to the bottle. Tick to show ethanol has been added and record date. Store reconstituted Buffer RPE at room temperature.
c. Carrier RNA stock solution. Add 310 μL of Buffer AVE to the carrier RNA tube (310 μg) to obtain a final concentration of 1 μg/mL. Store at -20oC in aliquots. Do not freeze-thaw the aliquots of carrier RNA more than three times.
d. Lysis/Binding solution i. Check Buffer RLT has not formed a precipitate during storage. If it has, warm 1320
to re-dissolve (37oC) then return to room temperature. ii. Important: Do not add Isopropanol or MagAttract Suspension G to Buffer RLT
mixture at this stage. iii. Prepare Buffer RLT Lysis/binding solution as shown in Table 16. This should
be prepared fresh on the day of the extraction.
Table 16. Lysis/binding solution preparation
Reagent Number of samplesa 1 48b 96b
Buffer RLT 597 L 31 mL 59.7 mL Carrier RNAc 2.8 L 146 L 280 L TOTAL 600 L/tube
a The volume prepared allows for pipetting error. 1330 b For sample numbers (x) other than 48 or 96, calculate the required volumes by multiplying volumes for 1 sample by (x + 4)
4. c Carrier RNA does not dissolve in Buffer RLT and must first be dissolved in Buffer AVE before
addition to Buffer RLT mixture (Step 3c)For each sample and control to be used, fill a 2.0 mL conical base screw capped bead beating tube with 0.3 g of zirconia/silica beads. These will be used during the bead beating step later in the process.
5. Add 10 mL of sterile saline (0.85% w/v) to a 15 mL faecal tube for each sample and control.
6. Using a balance, weigh and add faeces to the 15 mL faecal tube with the supplied sterile spoon. Discard the spoon. 1340

Johne’s Disease
Australian and New Zealand Standard Diagnostic Procedure, July 2015 Page 37 of 68
a. Individual faeces - 1.2 g dry faeces or 1.5 g moist faeces b. Pooled faeces – If the homogenised faecal pool is prepared without the addition of saline, weigh 1.2 g dry faeces or 1.5 g moist faeces. For all other pooling methods, refer to the section ‘Concurrent pooled faecal culture and HT-J assay’ above.
7. Thoroughly mix the faeces by shaking the tube vigorously.
8. Allow the faeces to settle for 30 minutes, give the suspension a gentle flick after 5 minutes to release any air bubbles and dislodge any floating debris.
9. Transfer 3 to 5 mL of the top portion of the supernatant to a 10 mL centrifuge tube using a sterile plastic transfer pipette. For pooled faeces see ‘Concurrent pooled 1350 faecal culture and HT-J assay’ and Table 15 at the start of this section for the appropriate volume of supernatant to transfer post-sedimentation to a 10 mL centrifuge tube.
10. Centrifuge at 1,231 g for 30 minutes with low brake then carefully pour off and discard the supernatant without dislodging the pellet.
11. Remove any remaining supernatant with a pipette and P1000 aerosol resistant tip.
12. Add 600 μL of Lysis/binding solution (see step 3d) to the pellet with a P1000G (wide bore) aerosol resistant tip.
a. Without touching the wall of the tube with the shaft of the pipette, re-suspend the pellet by pipetting up and down and transfer the full volume of Lysis/binding 1360 solution and pellet to a prepared bead tube (see step 4). b. Alternatively, using a sterile transfer pipette, re-suspend the pellet by gently pipetting up and down, keeping the sample in the lower portion of the transfer pipette and not allowing it to lodge in the bulb, and transfer the full volume of Lysis/binding solution and pellet to a prepared bead tube (see step 4).
13. Place bead tubes into mechanical cell disruptor (bead beater) and run:
a. at the maximum speed (36 oscillations/second) for 90 seconds in a frozen (-80oC) 1.5 mL tube holder using a Mini-Beadbeater-96 bead-beater, or,
b. at the maximum speed (6.5 m/second) for 60 seconds, twice, using a Fast Prep-24 bead-beater, or, 1370
c. at 30 oscillations/second for 100 seconds, using a Tissuelyser II.
14. Centrifuge at 16000 g for 3 minutes in a microfuge.
15. Transfer all the supernatant (~600 μL) to a new flip top 1.5 mL tube.
16. Centrifuge at 16000 g for 3 minutes. (The supernatant will be transferred to a plate in Step 20)
17. Set up for magnetic bead purification method. Check that buffers (Buffer AW1, Buffer RPE) have been prepared (see steps 3a and 3b). Label four deep 96 well (termed S-Block) plates and one standard 96 well plate, according to Table 17.
18. Aliquot the appropriate buffers/volumes into the Elution plate and Wash plates (Wash 1, 2 and 3), according to Table 17. 1380
a. Mix the reconstituted Buffer AW1 and Buffer RPE before use by shaking the bottle

Johne’s Disease
Australian and New Zealand Standard Diagnostic Procedure, July 2015 Page 38 of 68
5 times b. For pipetting with multichannel pipettes, pour buffer into a reagent container
provided with the kit In each plate, the number of wells filled with buffer should match the number of samples + controls to be processed; e.g. if processing 48 samples + controls, fill 48 wells per plate. Ensure that the buffers are added to the same positions (eg. A1, A2 …) in each plate. Refer to plate plan (see step 1). Table 17. Plate plan, reagent volumes and magnetic processor loading order/position 1390 Load
position Plate name
(loading message)
Plate type Reagent to add
Volume per well (µL)
6 Rod covera Standard 96 wella - - 5 Elution Standard 96 well Buffer AVE 75 4 Wash 3 S-block a Buffer RPE 500 3 Wash 2 S-block Buffer RPE 500 2 Wash 1 S-block Buffer AW1 700 1 Lysate S-block Lysate See step 20
a Rod cover, Standard 96 well and S-block (deep well) plates are supplied in the BioSprint® 96 One-For-All Vet kit
19. Prepare the Bead Mix according to Table 18. Important: Before adding MagAttract
Suspension G, ensure that it is fully re-suspended. Before the first use, shake the bottle, and vortex for 3 minutes. Before subsequent uses, shake the bottle and vortex for 1 minute.
1400 Table 18: Bead mix preparation
Reagent Number of samplesa 1 48b 96 b
Isopropanol 300 L 14.4 mL 28.8 mL MagAttract Suspension Gc 25 L 1.2 L 2.4 mL TOTAL Add only 300 L/well
a The volume prepared allows for pipetting error. b For sample numbers (x) other than 48 or 96, calculate the required volumes by multiplying volumes for 1 sample by (x) c MagAttract Suspension G must be re-suspended by vortexing before addition to Isopropanol (see Step 19-'Important').
20. Load the Lysate plate, referring to the plate plan (see Step 1) 1410
a. Pipette 40 μL of Proteinase K into the bottom of the appropriate wells of the lysate (S-Block) plate.
b. For each sample, transfer as close to 400 μL as possible of the supernatant (from Step 16) with a pipette and P1000 aerosol resistant tip to the lysate plate, without disturbing any pellet.
c. Vortex the prepared Bead Mix (Table 18) thoroughly for 30 seconds immediately prior to aliquoting.
d. For pipetting with a multichannel pipette, pour the mix into a reagent container provided with the kit. 1420

Johne’s Disease
Australian and New Zealand Standard Diagnostic Procedure, July 2015 Page 39 of 68
e. Add 300 μL of Bead Mix to all wells according to the plate plan.
Note: In general, it is not necessary to vortex the mixture during dispensing if working without interruption. If dispensing takes longer than 3 minutes per 96-well plate, seal the reagent container tightly and vortex carefully to ensure that MagAttract Suspension G remains fully re-suspended.
21. Place one deep well Rod cover (supplied) into a standard 96 well plate (Table 17, Load position 6).
22. Switch on the automated magnetic particle processor (KingFisher/ MAGMAX/ BioSprint 96) at the power switch. Slide open the front door of the protective cover. 1430
23. Select the “BS96 Vet 100” protocol using the up and down keys on the front panel. (The program script for the protocol is available from Qiagen(www.qiagen.com). Refer to the instrument manual for details on loading the program.)
24. Press 'Start' to start the protocol run.
25. Load plates into the magnetic particle processor (refer also to Table 17):
a. The LCD displays a message requesting the operator to load slot 6 of the worktable inside the instrument (which should be directly adjacent to the door) with the 96-well rod cover. b. After loading slot 6, press 'Start'. The worktable will rotate, and a new message appears, requesting the operator to load slot 5 with the Elution plate. Load slot 5 1440 and press 'Start' again. c. Ensure the Elution plate and all subsequent plates are loaded onto the worktable so that well A1 on the plate is aligned with the plate slot label (i.e. well A1 faces inward). d. Continue this process of pressing 'Start' and loading the particular slot until all slots are loaded.
26. After loading the last slot (Lysate), slide the door shut to protect samples from contamination.
27. Press 'Start' to start sample processing.
28. After the samples are processed, remove the plates as instructed by the display of the 1450 instrument. Press 'Start' after removing each plate. The first plate to be removed will be the Elution plate, containing the purified DNA samples.
29. Press 'Stop' after all plates are removed and switch off the instrument. (See Safety/bio-safety precautions/special laboratory requirements for waste disposal)
30. Transfer the contents of individual wells of the Elution plate to appropriately-labelled 200 µL PCR tubes. Store at 4oC if PCR to be performed within 24 hours or at -20oC/-80oC.
Part 2: HT-J qPCR procedure
31. Prepare a qPCR worksheet to accommodate samples to be tested. 32. Include the following controls for each qPCR run: 1460
i. Positive control. Purified DNA from Map used to produce a 10-fold dilution series

Johne’s Disease
Australian and New Zealand Standard Diagnostic Procedure, July 2015 Page 40 of 68
(see Step 33 below) ii. Negative control. Contains PCR buffers and purified sterile water used to produce the
DNA standards. iii. qPCR process control (or No Template Control). Contains qPCR cocktail reagents
only.
33. Prepare Map genomic DNA standards purchased from the University of Sydney as per product insert and validate these against reference information supplied in the product insert. Information from the product insert is also available in Part 3 of this ANZSDP. Note: Up to four replicates of standard 5 should be included to increase the chance that at 1470 least two react.
34. Calculate volumes of qPCR mastermix required by referring to Table 19. For each faecal sample, DNA extracts are tested in duplicate (replicates 1 and 2).
Table 19. Reagents and volumes to prepare qPCR mastermix
Ingredient Stock
Concentration or Amount
Final Concentration
Number of PCR assaysa 1 96
2 x SensiMix SYBR Low-ROX
2 1 12.5 L 1.25 mL
Water (molecular grade) - - 7.25 L 725 L Primer MP10-1 50 M 250 nM 0.125 L 12.5 L Primer MP11-1 50 M 250 nM 0.125 L 12.5 L Final volume 20.0 L 2 mL Template DNA 5.0 L -
a Volumes are given in μL for 1 or 96 assays. For volumes required for (x) assays, multiply volumes for 1 PCR assay by (x+4). 1480 35. Aliquot mastermix into the qPCR reaction plate in accordance with good nucleic acid
testing laboratory guidelines. 36. For all samples and controls, add 5 µL of template DNA/control to PCR reaction plate. 37. Load plate into thermocycler and run using the thermocycling parameters described in
Table 20.
Table 20. Thermocycling parameters (ABI 7500 thermocycler; Stratagene MX300) 1490
Stage Temperature (oC) Time Cycles
Initial denaturation 95 10 mins 1 Denaturation 95 15 secs
40 Annealing 68 30 secs Extension 72 1 min Melt Curve 65-95 1
38. Analyse results following test acceptance criteria (see Interpretation of Results below).
Safety/biosafety precautions
Johne’s Disease
Australian and New Zealand Standard Diagnostic Procedure, July 2015 Page 41 of 68
Refer to the BioSprint® 96 One-For-All Vet Handbook for chemical safety information regarding kit reagents. After running the automated magnetic-bead program, the liquid waste solutions from Plates A to D should be transferred to an appropriately labelled hazardous waste container for disposal. The empty 96 well plates can then be discarded in biological hazard waste bins. 1500 Technical and professional staff requirements Staff undertaking these procedures must be qualified by an appropriate TAFE or university certificate, diploma or degree and have experience and knowledge in the procedures of DNA extraction from clinical samples and quantitative real-time PCR set up and dynamics. All staff should have training and experience in, knowledge of and ability to follow QA procedures, especially those procedures and practices required to minimise false positive reactions from amplicon contamination. Appropriately qualified technical and professional staff must be trained and deemed to be 1510 experienced and competent in all aspects of the entire HT-J assay procedure including:
Sample handling and storage Sample and assay documentation DNA extraction Quantitative real-time PCR Data analysis and result recording Reporting.
Interpretation of Results
For a valid set of results each qPCR run must meet the following acceptance criteria: a standard curve derived from standards 1-4 or 5 producing an amplification 1520 efficiency between 90.0 and 110.0% and controls producing the correct outcome. While uncommon, an obvious outlier of a single replicate within standards 1-4 can be removed, using professional judgement. at least one positive result from up to four replicates of standard 5. positive and negative extraction and qPCR controls in each PCR run meet the criteria shown in Table 21. To be positive each replicate of the positive controls and standards must have: based on the recommended mastermix (Sensimix SYBR Low-ROX Kit Bioline), a
melting temperature (Tm) of 89.4+1.5oC (Stratagene platform) or 87.8+1.5oC (ABI 1530 platform), and
a DNA quantity ≥ the cut-point of 0.001 pg (1/5 genome equivalent) as determined by a standard curve derived from the standards included in each qPCR run.
Table 21. Positive and negative control acceptance criteria
Procedure Control Acceptance criteria Extraction Positive faeces (refer Part1, Step 2) Positive Negative faeces (refer Part1, Step 2) Negative Extraction process controla (refer Part1, Step 2) Negative Extraction plate controlb Negative

Johne’s Disease
Australian and New Zealand Standard Diagnostic Procedure, July 2015 Page 42 of 68
qPCR Positive (refer Part 2, Step 32) Positive Negative (refer Part 2, Step 32) Negative qPCR process control (cocktail only) (refer Part 2,
Step 32)
Negative a Saline + buffers; b Buffer RLT only in place of sample lysate in extraction plate. For each faecal sample, DNA extracts are tested in duplicate (replicates 1 and 2). For an individual DNA extract to be graded as positive in the qPCR assay, the following criteria 1540 must be met:
• Based on the recommended mastermix (SensiMix SYBR Low-ROX Kit, Bioline), a Tm of 89.4+1.5oC (Stratagene platform) or 87.8+1.5oC (ABI platform).
• For replicates with Tm’s within the correct range, the mean DNA quantity of the 2 replicates is ≥ the cut-point of 0.001 pg (1/5 genome equivalent) as determined by a standard curve derived from the standards included in each qPCR run.
Note 1: If one or both replicates have a Tm that is not within the correct range, any DNA quantity recorded in that reaction is not MAP-specific and should be disregarded, that is, the value should be corrected to ‘zero’.
Note 2: Professional judgment should be used to determine when a sample should be retested, 1550 for example where one replicate has no CT and the other a low CT (consistent with pipetting error).
A POSITIVE result: To be considered positive, the mean DNA quantity of replicates 1 and 2 must be positive.
A NEGATIVE result: To be considered negative, the mean DNA quantity of replicates 1 and 2 must be negative.
Note 3: With regard to the acceptable Tm range using other qPCR platforms (such as the Rotorgene platform) and/or mastermixes, this would need to be determined and fully validated using known positive faecal samples (faeces from animals/pooled samples derived from an infected herd/flock, previously examined by faecal culture and having a positive 1560 faecal culture result).
An estimate of this acceptable range can be derived based on the Tm results for the Map genomic DNA standards that are included in the qPCR. For the University of Sydney and EMAI data used in test validation, the standards have an average Tm that approximates the centre of the acceptable Tm range. Therefore, to estimate a Tm range, calculate as: Tm range = (Average Tm of Map genomic DNA standards) ± 1.5oC.
Note 4: If primer-dimer is observed, its Tm is at least 5oC less than that of the Map-specific Tm.
Throughput and turn-around times
Samples are set up for batch testing depending on the capability of the testing laboratory. 1570 Samples should be stored at -80oC until the required number for a batch is accumulated. The minimum turn-around time for a sample is 3-4 business days.
Immunological Tests
There is a prolonged delay between infection with Map and detection of the systemic immune

Johne’s Disease
Australian and New Zealand Standard Diagnostic Procedure, July 2015 Page 43 of 68
response. The detection of a systemic cell-mediated immunity (CMI) response precedes detectable antibody production. Animals that are minimally infected frequently react positively to tests that measure CMI, but do not react on serological testing. In contrast, some sero-positive animals have no detectable CMI response. It is believed that the CMI is inversely related to antibody response as the disease progresses. Serum antibodies are present more constantly and are of higher titre as lesions become more extensive, reflecting the 1580 amount of antigen present. In advanced stages of infection animals may become anergic and have no detectable antibody or CMI responses.
Enzyme-linked immunosorbent assay (ELISA)
Principle of the Test
The sensitivity of ELISA is comparable with that of the CFT in clinical cases, but is greater than that of the CFT in subclinically infected carriers. The specificity of the ELISA is increased by M. phlei absorption of sera.194
Reagents and Materials
Three commercial absorbed ELISA kits are currently available in Australia: Idexx Paratuberculosis Screening Ab test, Parachek® 2 from Prionics, and ID Screen® 1590 Paratuberculosis Indirect from IDVET. All kits employ anti-ruminant conjugates that can be applied to bovine, caprine and ovine sera. Only the Idexx Paratuberculosis Screening Ab is approved by SCAHLS, for use in cattle. This test is also equivalent to an earlier Pourquier ELISA that was validated on sera from Australian sheep and goats.195 A non-absorbed ELISA has also been used in deer in New Zealand,196, 197 but has not been approved by SCAHLS.
Test Procedure
Testing in duplicate is a recommended method for ELISA. Although the ELISA may be performed in single wells as a screening test it is recommended that samples with reactions within +/-10% of the positive cut-off point be retested in duplicate. Positive and negative control sera are included in each run. 1600
Interpretation of Results
The sensitivity of the ELISA depends on the age of animal, stage of infection and the degree of Map shedding in faeces. In a large study in Australia, the actual sensitivity of the ELISA in 2-, 3- and 4-year-old cows was 1.2%, 8.9% and 11.6%, respectively, but remained between 20 and 30% in older age-groups.103 The overall sensitivity for all infection stages and age-groups of cattle was calculated to be about 15%.84, 103
The three commercial ELISA kits available in Australia have specificities above 99%.
All available commercial kits offer an option of testing bovine milk samples, while the Parachek® 2 assay has been applied to ovine and caprine milk. The ELISA on bovine and caprine milk has been found to have a specificity similar to that of the serum ELISA, but is 1610 less sensitive than the blood test.198, 199
Agar gel immunodiffusion test (AGID)
Principle of the Test

Johne’s Disease
Australian and New Zealand Standard Diagnostic Procedure, July 2015 Page 44 of 68
The AGID on serum has a high specificity, is relatively independent of the animal species and is simple and relatively inexpensive to perform. However, it uses large amounts of reagent and requires subjective interpretation. It has been reported that in small ruminants in New Zealand and Australia the AGID offers slightly higher sensitivity and specificity than that obtained by the ELISA tests,200-202 but a recent study confirmed that the Idexx (formerly Pourquier) screening ELISA is significantly more sensitive than AGID in both sheep and goats.195 The reported specificity and sensitivity of the AGID measured against histological 1620 results were 99-100% (95% CI) and 38-56% (95% CI), respectively,200 while specificity in disease-free populations of sheep and goats is estimated to be 100%.195
Reagents and Materials
The antigen for this test is prepared from Map grown on Watson-Reid media. Laboratories should use Weybridge strain 316V, but it may be preferable to use the goat strain, Ama, for goats and alpacas (see Part 3). Harvested bacterial cells are suspended in borate or veronal buffer pH 8.6 and ultrasonically disrupted. Care must be taken to prevent antigens being destroyed by heating during sonication. Alternatively, the cells can be suspended in PBS, pH 7.2, and mechanically disrupted in a French pressure cell. After clarification by centrifugation, the supernatant fluid is titrated against positive sera and stored in aliquots at -1630 20oC.
Test Procedure
Prepare agarose by combining 1.35 g borate (H3BO3), 0.3 g NaOH, 0.015 g sodium azide and distilled water to 150 mL. Stir to dissolve, adjust pH to 8.5-9.0, add SeakemTM agarose to 0.75-1.0 % w/v and stand in a boiling water bath until agarose is dissolved. Dispense in appropriate volumes (15 mL for a 90 mm Petri dish) and store at 4oC. When required, agarose is melted in a boiling water bath and the contents poured and allowed to set in a 90 mm Petri dish, or on a glass slide. Wells are cut in a hexagonal pattern, using a well-cutting stamp. Wells are 4 mm diameter, 2-4 mm apart, and 3-4 mm deep (volume = 25 to 35 µL). Antigen is added to the centre well and test or control sera are added to peripheral wells. It is necessary 1640 to include a positive control in every pattern to show that the antigen is satisfactory. Any positive reaction is confirmed on a subsequent test with an adjacent control positive. Plates are incubated in a humid chamber at either 37oC overnight, or at room temperature for 20-24 hours. If weak precipitin lines are observed, plates can be incubated for a further 24 hours, or the test repeated. A modified gel pattern with a larger gap between the antigen and serum wells may assist interpretation of some doubtful reactions. Positive and negative control sera are included in each run.
Interpretation of Results
Greatest specificity is associated with lines that appear within 24 hours. The control positive serum should give a strong line halfway (2+ reaction) between the antigen and serum wells. 1650 For sheep, this control line may have a slight bend against 316V, unlike goats, which typically show a straight precipitin line between the 316V antigen and the control sera. Lines of non-identity may appear with subsequent incubation, but these are regarded as negative (non-specific reactions). A positive reaction must have a line of identity with the positive control. Lines of partial identity are regarded as suspicious. Precipitin lines are recorded on a scale of 3+ (closer to antigen well than serum well), 2+ (up to half way between the wells) and 1+ (closest to serum well).

Johne’s Disease
Australian and New Zealand Standard Diagnostic Procedure, July 2015 Page 45 of 68
Complement Fixation Test (CFT)
Principle of the Test
The CFT works well on clinically suspect animals, but does not have sufficient sensitivity 1660 and specificity to enable its use in the general population for disease control, diagnosis or certification purposes. Nevertheless, it is often demanded by countries that import cattle from Australia and New Zealand.
Reagents and Materials
The test is performed using M. avium strain D4 (see Part 3), which is more readily cultivated and gives similar reactivity to antigens prepared from Map.203
The CFT closely follows that for the ‘Bovine Brucellosis: Serology’ as described in the Australian Standard Diagnostic Techniques for Animal Diseases (1993), Ed. LA Corner (http://www.scahls.org.au/Procedures/Documents/ASDTs/bovine_brucellosis2.pdf).
Test Procedure 1670
Sera are heated at 58oC (cattle) or 60oC (sheep and goats) for 30 minutes. If inactivation is performed in plate format in an air incubator, the actual period of incubation must be extended to ensure the sera remain at the required temperature for at least 30 minutes. A positive control serum (see Part 3) should be included on each plate. Guinea pigs may be bled and the serum preserved in Richardson's buffer, or the complement may be purchased as a lyophilised product from Sigma-Aldrich. Five complement haemolytic activity units (CH50) are used in the test. Washed sheep erythrocytes (3%) are sensitised with approximately three minimal haemolytic doses (MHD) of haemolysin (Dade Behring Diagnostics) to give a 1.5% suspension of sensitised cells.
Primary and secondary incubations are performed at 37oC such that reagents are maintained 1680 at the required temperatures for 30 minutes. In the case of tests performed in plate format, additional time may be required for the plates (and reagents) to reach desired temperatures.
Positive and negative control sera are included in each run.
Interpretation of Results
Plates may be left to settle or centrifuged (1,500 rpm for 5 minutes) and read. A reading of 4+ in the 1:8 dilution is regarded as test positive. Positive sera are retested (in duplicate) with the final titre being the mean of at least two consistent results.
Tests for CMI
These include the gamma interferon assay and the intradermal johnin test. Other tests have been used to assess CMI responses but have never been widely accepted as diagnostic tools. 1690 These tests include the intravenous johnin test, lymphocyte transformation/stimulation/proliferation tests and the leucocyte migration inhibition test.204-210
Gamma Interferon Assay
Principle of the Test
Johne’s Disease
Australian and New Zealand Standard Diagnostic Procedure, July 2015 Page 46 of 68
The gamma interferon assay (BOVIGAM) was developed for the diagnosis of bovine tuberculosis. It measures the release of gamma interferon from sensitised lymphocytes during an 18–36 hour incubation period with specific antigen (avian tuberculin purified protein derivative [PPD], bovine tuberculin PPD or johnin PPD).211 The test procedure and materials are fully described in the instructions accompanying the commercial kit. This test has not 1700 been validated by the manufacturer (Prionics, Switzerland) for the diagnosis of Johne’s disease. As such, results derived from this assay are frequently difficult to interpret because there is no agreement with respect to the interpretation criteria and types and amounts of antigens used to stimulate blood lymphocytes.
Test Procedure
Positive and negative control sera are included in each run. Results are validated following the manufacturer’s recommendations.
Interpretation of Results
In cattle, the reported specificity of the gamma interferon assay varied from 94% to 67% depending on the interpretation criteria.212 In sheep, the reported sensitivity of this test was 1710 66.7% in tissue culture-positive animals, and the specificity was 98.3% in non-infected flocks.213 The gamma interferon assay is unreliable in calves under 12 months of age due to the occurrence of many false positive results.214-216
Johnin Skin Test
Principle of the Test
The skin test for delayed-type hypersensitivity (DTH) measures CMI, but has limited value. The test is still required by some overseas countries for certification of imported cattle and sheep.
Reagents and Materials
The test is conducted in the same manner as the tuberculin test using johnin purified protein 1720 derivative (PPD) or M. avium PPD (25,000 units/mL, AsureQuality, New Zealand). Johnin PPD is not currently available from CSL Limited and is unlikely to be available in the future. If the johnin skin test is mandatorily required by the importing country, then johnin PPD should be sourced from that country (or the country provide a source) subject to approval from Australia’s regulatory authorities.
Test Procedure
The test is conducted by intradermal inoculation of 0.1 mL johnin PPD into the caudal fold or the mid-neck region. The skin thickness is measured with calipers before and 72 hours after inoculation. 1730
Interpretation of Results
An increase in skin thickness of >3 mm is taken as positive. It should be noted that positive reactions in deer may take the form of diffuse plaques rather than discrete circumscribed swellings, thus making reading of the test more difficult. The presence of any swelling should be regarded as positive in this species. However, sensitisation to the M. avium complex is

Johne’s Disease
Australian and New Zealand Standard Diagnostic Procedure, July 2015 Page 47 of 68
widespread in animals, and neither avian tuberculin nor johnin are highly specific.209 Furthermore, the interpretation of the skin test results is complicated by the lack of agreement with respect to interpretation criteria.
In a 2003 study in which johnin (ID-Lelystad, The Netherlands) was used to test cattle, the skin test specificity was 88.8% at the cut-off value of ≥2 mm, 91.3% at the cut-off value 1740 of ≥3 mm and 93.5% at the cut-off value of ≥4 mm.212 The effect of these cut-off values on the sensitivity has not been determined. The performance of this test may also be significantly affected by minor antigenic differences that occur in different batches of antigen.212
Acknowledgements
The 1993 version of this section was written by L. Stephens. A workshop was sponsored in 1995 by the Dairy Research and Development Corporation and the Meat Research Corporation to promote standardisation of diagnostic methods. A further workshop in 1999, funded through the National Ovine JD Control and Evaluation Program, concentrated on bacteriological culture, including pooled faecal culture and identification of sheep strains. These workshops resulted in production of revised sections in 1998-2000 by JM Tennent, DV 1750 Cousins, RJ Condron, GJ Eamens and RJ Whittington. The current edition incorporates advances in knowledge, technology and standardisation since the previous revisions performed in 2002 by DV Cousins, RJ Condron, GJ Eamens, RJ Whittington and GW de Lisle and in 2010 by JM Gwozdz. It was written with the assistance of R McCoy, Gribbles South Australia, and E Sergeant, AusVet Animal Health Services, Orange NSW.
1760
Part 3 – Reagents and Kits 1770
Ziehl-Neelsen stain 1. Ziehl-Neelsen carbol fuchsin
Basic fuchsin 0.3 g Ethanol (95% v/v) 10 mL Phenol 5.0 g Distilled water 95 mL
2. Acid alcohol Ethanol (95% v/v) 97 mL 1780

Johne’s Disease
Australian and New Zealand Standard Diagnostic Procedure, July 2015 Page 48 of 68
Concentrated HCl 3 mL 3. Counterstain
Malachite green or Methylene blue 1.0 g* Distilled water 100 mL
4. Alkaline tap water If malachite green is used as counterstain, it is intensified by washing with alkali tap water prepared by adding 1 mL of 1 M NaOH to 500 mL of tap water. * Lower concentrations of methylene blue chloride (0.3% w/v) are also satisfactory. 1790
Kinyoun acid fast stain 1. Kinyoun carbol fuchsin
Solution A: Basic fuchsin 4 g Ethanol (95% v/v) 20 mL Solution B: Phenol (melted crystals) 8.0 g Distilled water 100 mL Mix solutions A and B and stand for 2-3 days before use.
2. Acid alcohol Ethanol (95% v/v) 97 mL 1800 Concentrated HCl 3 mL
3. Counterstain Methylene blue 0.3 g (or Brilliant green 1 g ) (or Malachite green 0.5 g) Distilled or deionised water 100 mL
1810
Culture Media and Reagents Decontamination reagents
HPC/BHI 1820
This solution contains 0.9% hexadecylpyridinium chloride (HPC) in half-strength Brain Heart Infusion (BHI) broth.
Hexadecylpyridinium chloride (Sigma) 9 g (Sigma) Brain heart infusion 18.5 g (Difco) MilliQ purified water 1 L

Johne’s Disease
Australian and New Zealand Standard Diagnostic Procedure, July 2015 Page 49 of 68
Mix and dissolve (heating at 58oC may be required) then autoclave at 120oC for 20 minutes. Solution will froth, so fill flasks to only 70% capacity. This solution is stable at room temperature for 1 week only. Do not refrigerate. When 0.9% w/v HPC is diluted with 1830 faeces/saline at a rate of 1:5 (e.g. 4 mL faeces/saline in 20 mL HPC solution, or 5 mL in 25 mL HPC solution), this produces a final concentration of 0.75% HPC. If other concentrations of HPC are required, adjust the amount of HPC in the recipe above.
VAN
(Vancomycin 100 μg/mL, Amphotericin B 50 μg/mL and Naladixic acid 100 μg/mL).
Note: Avoid skin contact with vancomycin - gloves should be worn at all times. MilliQ purified water 200 mL Vancomycin 20 mg 1840 Naladixic acid 20 mg Amphotericin B solution (10 mg/mL) 1 mL
Mix ingredients then dispense and store at -20°C. For VAN/BHI, add antibiotics to sterile half-strength Brain Heart Infusion instead of water.
Amphotericin B stock solution (10 mg/mL) Amphotericin B 45% with sodium deoxycholate 35% (Sigma) 50 mg MilliQ purified water 5 mL 1850 Mix to dissolve, dispense into aliquots and store at - 20°C.
M7H9C (Modified Middlebrook 7H9 liquid culture medium, University of Sydney, Camden)143 This medium can be manufactured from a combination of commercial broth base and purchased additives, based on a medium made up of Middlebrook 7H9 broth with added Casitone, and a supplement containing ADC enrichment, egg yolk, mycobactin J and antibiotics. 1860
For a batch size of 540 mL of final medium (approx 90 tubes):
Part 1: Base
Middlebrook Difco 7H9 broth (BD) 1.68 g
Casitone (Bacto) 0.36 g
Purified watera 409 mL a Addition of glycerol (0.2% v/v) or polysorbate 80 (Tween 80; 0.05% w/v) to water is optional for Middlebrook 7H9 medium for mycobacteria but was not included in the formulation of Bactec 12B media.
Autoclave base at 121oC for 10 minutes, and add supplement when cooled to 45oC. 1870
Part 2: Supplement

Johne’s Disease
Australian and New Zealand Standard Diagnostic Procedure, July 2015 Page 50 of 68
For each 409 mL of base add 131.4 mL of supplement made up as:
BBL Middlebrook ADC Enrichment (BD) 14.4 mL Egg yolk (approx 13 large eggs) 90 mL Mycobactin J (50 g/mL) 9 mL PANTA antibioticsb (BD) (3 vials) 18 mL b Original Bactec 12B medium was supplemented with PANTA PLUS® which is no longer commercially available. PANTA antibiotics (for MGIT system) are available and contain the same antibiotic mixture (as lyophilized antibiotics) reconstituted using 6 mL sterile water per vial 1880
The complete M7H9C medium is aliquoted aseptically in 6 mL volumes into sterile glass or plastic tubes with screw tops.
Modified 7H10 media with Mycobactin J 102 This media is for culture of sheep or cattle strains of Map
Middlebrook 7H10 agar 19 g Casitone 1 g Glycerol 5 mL 1890 MilliQ water 900 mL
Autoclave at 121oC for 15 minutes; cool to 58oC.
Using aseptic technique, combine the following additional ingredients and add to the 7H10 base:
PANTA 50 mL Mycobactin J solution (50 µg /mL) 25 mL ADC enrichment 100 mL Egg yolk 250 mL
Thoroughly mix additives using a slow swirling action. Slowly add the additives to the media 1900 making sure the solution is kept well mixed. Dispense 10 mL volumes into sterile tubes to form slopes. Perform a sterility check by incubation at 37oC for 1 week. Perform a suitability check by inoculation of Map to demonstrate media ability to support growth of the target organism. Store media at 4oC.
Herrold’s Egg Yolk media (with mycobactin J and sodium pyruvate) (HEYM)
This media is for culture of cattle strains of Map.
Proteose peptone 9.0 g NaCl 4.5 g 1910 Agar 15.0 g Beef extract 2.7 g Glycerol 27.0 mL

Johne’s Disease
Australian and New Zealand Standard Diagnostic Procedure, July 2015 Page 51 of 68
Sodium pyruvate 4.0 g Dissolve the above in 890 mL distilled water, adjust pH of warm media to 6.9-7.0 with NaOH to achieve pH 7.2 in the solid media. Add 4 mL of stock solution (2 mg) of Mycobactin J. Autoclave at 121oC for 20 minutes. After cooling, aseptically add:
Egg yolks 120 mL Malachite green (2%) 5.1 mL 1920
Mix gently and dispense 10 mL volumes into sterile tubes to form slopes.
Media supplements
Mycobactin J Mycobactin J stock solution (500 μg/mL) and working solution (50 μg /mL)
For each vial of 2 mg Mycobactin J,c add 1 mL ethanol (95% v/v) and mix until completely dissolved. 1930
Add 3 mL MilliQ purified water for stock solution or 39 mL water for working solution. Autoclave and store in the dark. c Allied Monitor, 201 Golden Drive, Fayette, Missouri, USA 65248
Malachite green
Prepare a 2% (w/v) solution, autoclave, and add to medium through a 0.22 μm filter.
Egg yolks 1940
Use fresh eggs from chickens that are not receiving antibiotics. If the eggs are dirty, scrub with detergent. Rinse with water and allow to dry. Soak in 70% ethanol for 30 minutes. Remove eggs and allow to dry in a sterile environment. Using aseptic technique, crack the egg and separate the egg white and chalaza from the yolk leaving the yolk in the shell halves. Using a 10 mL sterile syringe, extract yolk from the yolk sac and dispense/measure into a 50 mL sterile tube (Falcon). Dispense aseptically into sterile, sealable bottles. To test sterility, a sample from each bottle should be cultured on blood agar and examined after incubation at 37oC for 48 hours.
PANTA 1950
PANTA can be reconstituted by adding sterile water to lyophilised PANTA supplement.
Two commercial PANTA supplements are available from BD:
1. MGIT PANTA Catalogue 245114 Pack size 6 x 6 mL
2. PANTA/F Catalogue 442188 Pack size 10 x 10 mL

Johne’s Disease
Australian and New Zealand Standard Diagnostic Procedure, July 2015 Page 52 of 68
The ingredients of these are equivalent, and only differ in pack size which needs to be taken into account before reconstituting. Either can be used to prepare M7H9C and modified 7H10 media.
Absorbed ELISA 1960
Three commercial absorbed ELISA kits: Parachek® 2 (Prionics), Idexx Paratuberculosis Screening Test, ID Screen® Paratuberculosis Indirect (IDVET) are available in Australia, of which only the Idexx kit is currently SCAHLS approved, for use in cattle. The Idexx Paratuberculosis Screening Test and Parachek® 2 kits have been validated for cattle, sheep and goat sera, while the ID Screen® kit has been validated in cattle and may also be applied to sheep and goat sera. In addition, one test is in use in NZ. The method and interpretation of the results and calculations are fully described in the instructions accompanying the commercial kits.
The Australian Reference positive and negative sera for use with the ELISA for cattle are 1970 available from the current Johne's Disease Reference Laboratory.
Complement fixation test (CFT)
Prepared antigen (M. avium strain D4) and Australian Reference Positive Serum used to calibrate the test are available from the Department of Environment and Primary Industries, Bundoora, Victoria.
M. avium strain D4 may be grown on Lowenstein-Jensen, Watson-Reid or other media, harvested, washed and dried. It is recommended that the antigen be ultrasonically disrupted (taking care to contain aerosols during the procedure), rather than autoclaved. One g of dried 1980 cells added to 200 mL distilled water should have a titre of about 1:50 when titrated against positive sera.
Agar gel immunodiffusion (AGID) test Prepared antigens of strains 316V can be obtained from EMAI, Menangle, NSWa or from AgResearch Wallaceville Animal Research Centre, Upper Hutt, NZ.b Control positive sheep and goat sera are available from EMAI, NSW. a [email protected] Tel: 61 2 46406423 b [email protected], Tel: 64 4 9221 30 1990
Gamma interferon assay
The BOVIGAM kit is distributed in Australia and New Zealand by AsureQuality, New Zealand (Tel: 64 9 573 8000).
Map genomic DNA for standard preparation (as used in the HT-J assay)
Reconstitution 2000

Johne’s Disease
Australian and New Zealand Standard Diagnostic Procedure, July 2015 Page 53 of 68
Map genomic DNA reagent is supplied by the University of Sydney in freeze-dried form. Reconstitute using 0.5 mL of TE buffer (10 mM Tris-HCl, 1mM EDTA, pH 8.0) and allow the vial to stand at room temperature for 20 minutes. Mix the vial very gently. This will give the concentrated stock at a concentration of 2 mg/L (or 2 ng/µL). It is recommended that this be transferred into 1.5ml DNA LoBind tubes (Eppendorf). Store at -80oC. Do not repetitively freeze-thaw the concentrated stock; aliquot in a minimum of 50 µL and thaw when preparing a large batch of standards.
Method of preparation of standards
Prepare standard dilutions from the concentrated stock of Map genomic DNA:
a. Take an aliquot of 2 ng/µL concentrated Map gDNA stock from -80oC freezer and 2010 thaw.
b. Prepare 20 pg/µL working stock by performing a 1/100 dilution with TE buffer e.g. 10 µl of 2 ng/µL concentrated Map gDNA + 990 µL TE buffer.
c. Prepare a 5-point serial dilution (ten-fold) of Map gDNA in 1.5 mL LoBind Eppendorf tubes, with nuclease free (NF) water (Table 22). Change tips between each addition and mix well.
Table 22. Preparation of DNA standards for HT-J assay
Standard Description Manufacture
1 2 pg/µL, 10 pg/qPCR reaction Add 100µl of 20 µM working stock + 900 µL nuclease-free (NF) water
2 200 fg/µL, 1 pg/qPCR reaction Add 100µl of Standard 1 + 900 µL NF
3 20 fg/µL, 0.1 pg/qPCR reaction Add 100µl of Standard 2 + 900 µL NF
4 2 fg/µL, 0.01 pg/qPCR reaction Add 100µl of Standard 3 + 900 µL NF
5 0.2 fg/µL, 0.001 pg/qPCR reaction Add 100µl of Standard 4 + 900 µL NF
d. Aliquot standards (minimum volume 50 µL) and store at -80oC. 2020
e. Use in qPCR: Add 5 µL of each standard DNA dilution to duplicate qPCR tubes, starting from the lowest to highest concentration. Use of quadruplicate qPCR tubes for standard 5 is recommended.
Method of production (template format only)
Map genomic DNA (Lot # specified here) was derived from Map (type C or S and strain identity specified here). Highly pure genomic DNA was extracted using the method described in Choy et al. (1998).217 DNA quantity and quality was determined using a Nanodrop spectrophotometer. Map gDNA (1 µg) was freeze-dried in 1 mL aliquots and stored at 4°C. 2030
One vial was reconstituted and standards prepared as directed above. These were tested in qPCR and gave an acceptable standard curve with an efficiency of 99.5%.

Johne’s Disease
Australian and New Zealand Standard Diagnostic Procedure, July 2015 Page 54 of 68
(Note: Refer to product insert for graphs of amplification plots, dissociation curve and standard curve of the relevant Reagent Lot).
Shelf life and stability
Map genomic DNA freeze dried is stable for at least 4 years at 4°C. The minimum shelf life is 6 months when reconstituted and stored as directed.
Recommendations
The use of DNA LoBind tubes from Eppendorf is based on the experience of the Johne’s disease laboratory at the University of Sydney. These gave best standard curve efficiency 2040 when diluted standards were stored at -80oC.

Johne’s Disease
Australian and New Zealand Standard Diagnostic Procedure, July 2015 Page 55 of 68
References
1. Chiodini RJ, Kruiningen HJv, Merkal RS. Ruminant paratuberculosis (Johne's disease): the current status and future prospects. Cornell Veterinarian 1984;74:218-262. 2. Bang B. Chronische pseudotuberculose Darmentzuendung beim Rinde. Berliner Tierarztliche Wochenschrift 1906;42:759-763. 3. Brotherston JG, Gilmour NJ, McSamuel J. Quantitative studies of Mycobacterium johnei in the tissues of sheep. I. Routes of infection and assay of viable M. johnei. Journal of 2050 Comparative Pathology 1961;71:286-299. 4. Vance HN. Johne's Disease in a European Red Deer. Canadian Veterinary Journal 1961;2:305-307. 5. Goudswaard J. Studies on the incidence of Mycobacterium johnei in the organs of experimentally infected goats. Netherlands Journal of Veterinary Science 1971;4:65-75. 6. Boever WJ. Johne's disease in aoudads and mouflon. Journal of Zoo Animal Medicine 1976;7:19-23. 7. Williams ES, Snyder SP, Martin KL. Experimental infection of some North American wild ruminants and domestic sheep with Mycobacterium paratuberculosis: clinical and bacteriological findings. Journal of Wildlife Diseases 1983;19:185-191. 2060 8. Williams ES, Snyder SP, Martin KL. Pathology of spontaneous and experimental infection of North American wild ruminants with Mycobacterium paratuberculosis. Veterinary Pathology 1983;20:274-290. 9. Gilmour N, Nyange J. Paratuberculosis (Johne's disease) in deer. In Practice 1989;11:193-196. 10. Belknap EB, Getzy DM, Johnson LW et al. Mycobacterium paratuberculosis infection in two llamas. Journal of the American Veterinary Medical Association 1994;204:1805-1808. 11. Ridge SE, Harkin JT, Badman RT et al. Johne's disease in alpacas (Lama pacos) in Australia. Australian Veterinary Journal 1995;72:150-153. 2070 12. Machackova M, Svastova P, Lamka J et al. Paratuberculosis in farmed and free-living wild ruminants in the Czech Republic (1999-2001). Veterinary Microbiology 2004;101:225-234. 13. Crawford GC, Ziccardi MH, Gonzales BJ et al. Mycobacterium avium subspecies paratuberculosis and Mycobacterium avium subsp. avium infections in a tule elk (Cervus elaphus nannodes) herd. Journal of Wildlife Diseases 2006;42:715-723. 14. Brown CC, Baker DC, Barker IK. Infectious and parasitic diseases of the gastrointestinal tract. In: Maxie MG, editor. Jubb, Kennedy and Palmer's Pathology of Domestic Animals. 5th edn. W.B. Saunders, Philadelphia, 2007:222-225. 15. McFadden JJ, Butcher PD, Chiodini R et al. Crohn's disease-isolated mycobacteria 2080 are identical to Mycobacterium paratuberculosis, as determined by DNA probes that distinguish between mycobacterial species. Journal of Clinical Microbiology 1987;25:796-801. 16. McFadden JJ, Butcher PD, Thompson J et al. The use of DNA probes identifying restriction-fragment-length polymorphisms to examine the Mycobacterium avium complex. Molecular Microbiology 1987;1:283-291. 17. Thorel MF, Krichevsky M, Levy-Frebault VV. Numerical taxonomy of mycobactin-dependent mycobacteria, emended description of Mycobacterium avium, and description of Mycobacterium avium subsp. avium subsp. nov., Mycobacterium avium subsp.

Johne’s Disease
Australian and New Zealand Standard Diagnostic Procedure, July 2015 Page 56 of 68
paratuberculosis subsp. nov., and Mycobacterium avium subsp. silvaticum subsp. nov. 2090 International Journal of Systematic Bacteriology 1990;40:254-260. 18. Lambrecht RS, Collins MT. Mycobacterium paratuberculosis. Factors that influence mycobactin dependence. Diagnostic Microbiology and Infectious Disease 1992;15:239-246. 19. Motiwala AS, Li LL, Kapur V et al. Current understanding of the genetic diversity of Mycobacterium avium subsp paratuberculosis. Microbes and Infection 2006;8:1406-1418. 20. Collins DM, Gabric DM, de Lisle GW. Identification of two groups of Mycobacterium paratuberculosis strains by restriction endonuclease analysis and DNA hybridization. Journal of Clinical Microbiology 1990;28:1591-1596. 21. de Lisle GW, Collins DM, Huchzermeyer HF. Characterization of ovine strains of Mycobacterium paratuberculosis by restriction endonuclease analysis and DNA 2100 hybridization. Onderstepoort Journal Of Veterinary Research 1992;59:163-165. 22. Biet F, Sevilla IA, Cochard T et al. Inter- and intra-subtype genotypic differences that differentiate Mycobacterium avium subspecies paratuberculosis strains. BMC Microbiology 2012;12:264. 23. Marsh I, Whittington R, Cousins D. PCR-restriction endonuclease analysis for identification and strain typing of Mycobacterium avium subsp. paratuberculosis and Mycobacterium avium subsp. avium based on polymorphisms in IS1311. Molecular and Cellular Probes 1999;13:115-126. 24. Whittington RJ, Marsh IB, Whitlock RH. Typing of IS1311 polymorphisms confirms that bison (Bison bison) with paratuberculosis in Montana are infected with a strain of 2110 Mycobacterium avium subsp. paratuberculosis distinct from that occurring in cattle and other domesticated livestock. Molecular and Cellular Probes 2001;15:139-145. 25. Sevilla I, Garrido JM, Geijo M et al. Pulsed-field gel electrophoresis profile homogeneity of Mycobacterium avium subsp paratuberculosis isolates from cattle and heterogeneity of those from sheep and goats. BMC Microbiology 2007;7. 26. Cousins DV, Williams SN, Hope A et al. DNA fingerprinting of Australian isolates of Mycobacterium avium subsp paratuberculosis using IS900 RFLP. Australian Veterinary Journal 2000;78:184-190. 27. Whittington RJ, Hope AF, Marshall DJ et al. Molecular epidemiology of Mycobacterium avium subsp. paratuberculosis: IS900 restriction fragment length 2120 polymorphism and IS1311 polymorphism analyses of isolates from animals and a human in Australia. Journal of Clinical Microbiology 2000;38:3240-3248. 28. Whittington RJ, Taragel CA, Ottaway S et al. Molecular epidemiological confirmation and circumstances of occurrence of sheep (S) strains of Mycobacterium avium subsp. paratuberculosis in cases of paratuberculosis in cattle in Australia and sheep and cattle in Iceland. Veterinary Microbiology 2001;79:311-322. 29. de Lisle GW, Cannon MC, Yates GF et al. Use of a polymerase chain reaction to subtype Mycobacterium avium subspecies paratuberculosis, an increasingly important pathogen from farmed deer in New Zealand. New Zealand Veterinary Journal 2006;54:195-197. 2130 30. Moloney BJ, Whittington RJ. Cross species transmission of ovine Johne's disease from sheep to cattle: an estimate of prevalence in exposed susceptible cattle. Australian Veterinary Journal 2008;86:117-123. 31. Mackintosh CG, Labes RE, Clark RG et al. Experimental infections in young red deer (Cervus elaphus) with a bovine and an ovine strain of Mycobacterium avium subsp paratuberculosis. New Zealand Veterinary Journal 2007;55:23-29.

Johne’s Disease
Australian and New Zealand Standard Diagnostic Procedure, July 2015 Page 57 of 68
32. Thibault VC, Grayon M, Boschiroli ML et al. New variable-number tandem-repeat markers for typing Mycobacterium avium subsp. paratuberculosis and M. avium strains: comparison with IS900 and IS1245 restriction fragment length polymorphism typing. Journal of Clinical Microbiology 2007;45:2404-2410. 2140 33. Thibault VC, Grayon M, Boschiroli ML et al. Combined Multilocus Short-Sequence-Repeat and Mycobacterial Interspersed Repetitive Unit-Variable-Number Tandem-Repeat Typing of Mycobacterium avium subsp paratuberculosis Isolates. Journal of Clinical Microbiology 2008;46:4091-4094. 34. Sevilla I, Li LL, Amonsin A et al. Comparative analysis of Mycobacterium avium subsp. paratuberculosis isolates from cattle, sheep and goats by short sequence repeat and pulsed-field gel electrophoresis typing. BMC Microbiology 2008;8:204. 35. Oakey J, Gavey L, Singh SV et al. Variable-number tandem repeats genotyping used to aid and inform management strategies for a bovine Johne's disease incursion in tropical and subtropical Australia. Journal of Veterinary Diagnostic Investigation 2014;pii: 2150 1040638714547257. [Epub ahead of print]. 36. Gezon HM, Bither HD, Gibbs HC et al. Identification and control of paratuberculosis in a large goat herd. American Journal of Veterinary Research 1988;49:1817-1823. 37. Carrigan MJ, Seaman JT. The pathology of Johne's disease in sheep. Australian Veterinary Journal 1990;67:47-50. 38. Whittington RJ, Sergeant ES. Progress towards understanding the spread, detection and control of Mycobacterium avium subsp paratuberculosis in animal populations. Australian Veterinary Journal 2001;79:267-278. 39. Morin M. Johne's disease (paratuberculosis) in goats: a report of eight cases in Quebec. Canadian Veterinary Journal 1982;23:55-58. 2160 40. Thomas GW. Paratuberculosis in a large goat herd. Veterinary Record 1983;113:464-466. 41. Whitlock RH, Buergelt C. Preclinical and clinical manifestations of paratuberculosis (including pathology). Veterinary Clinics of North America, Food Animal Practice 1996;12:345-356. 42. Cranwell MP. Control of Johne's disease in a flock of sheep by vaccination. Veterinary Record 1993;133:219-220. 43. Mackintosh CG, de Lisle GW, Collins DM et al. Mycobacterial diseases of deer. New Zealand Veterinary Journal 2004;52:163-174. 44. Payne JM, Rankin JD. Comparison of the pathogenesis of experimental Johne's 2170 disease in calves and cows. Research in Veterinary Science 1961;2:175-179. 45. McGregor H, Dhand NK, Dhungyel OP et al. Transmission of Mycobacterium avium subsp paratuberculosis: Dose-response and age-based susceptibility in a sheep model. Preventive Veterinary Medicine 2012;107:76-84. 46. Brotherston JG, Gilmour NJL, McSamuel J. Quantitative studies of Mycobacterium johnei in the tissues of sheep: I. Routes of infection and assay of viable M. johnei. Journal of Comparative Pathology 1961;71:286-299. 47. Reddacliff LA, Whittington RJ. Experimental infection of weaner sheep with S strain Mycobacterium avium subsp paratuberculosis. Veterinary Microbiology 2003;96:247-258. 48. Whittington RJ, Marshall DJ, Nicholls PJ et al. Survival and dormancy of 2180 Mycobacterium avium subsp paratuberculosis in the environment. Applied and Environmental Microbiology 2004;70:2989-3004. 49. Hines SA, Buergelt CD, Wilson JH et al. Disseminated Mycobacterium

Johne’s Disease
Australian and New Zealand Standard Diagnostic Procedure, July 2015 Page 58 of 68
paratuberculosis infection in a cow. Journal of the American Veterinary Medical Association 1987;190:681-683. 50. Rohde RF, Shulaw WP. Isolation of Mycobacterium paratuberculosis from the uterine flush fluids of cows with clinical paratuberculosis. Journal of the American Veterinary Medical Association 1990;197:1482-1483. 51. Koenig GJ, Hoffsis GF, Shulaw WP et al. Isolation of Mycobacterium paratuberculosis from mononuclear cells in tissues, blood, and mammary glands of cows 2190 with advanced paratuberculosis. American Journal of Veterinary Research 1993;54:1441-1445. 52. Dennis MM, Antognoli MC, Garry FB et al. Association of severity of enteric granulomatous inflammation with disseminated Mycobacterium avium subspecies paratuberculosis infection and antemortem test results for paratuberculosis in dairy cows. Veterinary Microbiology 2008;131:154-163. 53. Bower KL, Begg DJ, Whittington RJ. Culture of Mycobacterium avium subspecies paratuberculosis (MAP) from blood and extra-intestinal tissues in experimentally infected sheep. Veterinary Microbiology 2011;147:127-132. 54. Alonso-Hearn M, Molina E, Geijo M et al. Isolation of Mycobacterium avium subsp 2200 paratuberculosis from muscle tissue of naturally infected cattle. Foodborne Pathogens & Disease 2009;6:513-518. 55. Reddacliff LA, Marsh IB, Fell SA et al. Isolation of Mycobacterium avium subspecies paratuberculosis from muscle and peripheral lymph nodes using acid-pepsin digest prior to BACTEC culture. Veterinary Microbiology 2010;145:122-128. 56. Pribylova R, Slana I, Kralik P et al. Correlation of Mycobacterium avium subsp. paratuberculosis counts in gastrointestinal tract, muscles of the diaphragm and the masseter of dairy cattle and potential risk for consumers. International Journal of Food Microbiology 2011;151:314-318. 57. Whittington RJ, Windsor PA. In utero infection of cattle with Mycobacterium avium 2210 subsp paratuberculosis: A. critical review and meta-analysis. The Veterinary Journal 2009;179:60-69. 58. Seitz SE, Heider LE, Heuston WD et al. Bovine fetal infection with Mycobacterium paratuberculosis. Journal of the American Veterinary Medical Association 1989;194:1423-1426. 59. Sweeney RW, Whitlock RH, Rosenberger AE. Mycobacterium paratuberculosis isolated from fetuses of infected cows not manifesting signs of the disease. American Journal of Veterinary Research 1992;53:477-480. 60. Lambeth C, Reddacliff LA, Windsor P et al. Intrauterine and transmammary transmission of Mycobacterium avium subsp paratuberculosis in sheep. Australian 2220 Veterinary Journal 2004;82:504-508. 61. Thompson BR, Clark RG, Mackintosh CG. Intra-uterine transmission of Mycobacterium avium subsp paratuberculosis in subclinically affected red deer (Cervus elaphus). New Zealand Veterinary Journal 2007;55:308-313. 62. Gay JM, Sherman DM. Factors in the epidemiology and control of ruminant paratuberculosis. Veterinary Medicine 1992;87:1133-1139. 63. Sweeney RW, Whitlock RH, Rosenberger AE. Mycobacterium paratuberculosis cultured from milk and supramammary lymph nodes of infected asymptomatic cows. Journal of Clinical Microbiology 1992;30:166-171. 64. Streeter RN, Hoffsis GF, Bech-Nielsen S et al. Isolation of Mycobacterium 2230

Johne’s Disease
Australian and New Zealand Standard Diagnostic Procedure, July 2015 Page 59 of 68
paratuberculosis from colostrum and milk of subclinically infected cows. American Journal of Veterinary Research 1995;56:1322-1324. 65. Taylor TK, Wilks CR, McQueen DS. Isolation of Mycobacterium paratuberculosis from the milk of a cow with Johne's disease. Veterinary Record 1981;109:532-533. 66. Lambeth C, Reddacliff LA, Windsor P et al. Intrauterine and transmammary transmission of Mycobacterium avium subsp paratuberculosis in sheep. Australian Veterinary Journal 2004;82:504-508. 67. Gao A, Odumeru J, Raymond M et al. Comparison of milk culture, direct and nested polymerase chain reaction (PCR) with fecal culture based on samples from dairy herds infected with Mycobacterium avium subsp. paratuberculosis. Canadian Journal of 2240 Veterinary Research 2009;73:58-64. 68. Larsen AB, Kopecky KE. Mycobacterium paratuberculosis in reproductive organs and semen of bulls. American Journal of Veterinary Research 1970;31:255-258. 69. Eppleston J, Whittington RJ. Isolation of Mycobacterium avium subsp paratuberculosis from the semen of rams with clinical Johne's disease. Australian Veterinary Journal 2001;79:776-777. 70. Merkal RS, Miller JM, Hintz AM et al. Intrauterine inoculation of Mycobacterium paratuberculosis into guinea pigs and cattle. American Journal of Veterinary Research 1982;43:676-678. 71. Beard PM, Daniels MJ, Henderson D et al. Paratuberculosis infection of nonruminant 2250 wildlife in Scotland. Journal of Clinical Microbiology 2001;39:1517-1521. 72. Greig A, Stevenson K, Perez V et al. Paratuberculosis in wild rabbits (Oryctolagus cuniculus). Veterinary Record 1997;140:141-143. 73. McClure HM, Chiodini RJ, Anderson DC et al. Mycobacterium paratuberculosis infection in a colony of stumptail macaques (Macaca arctoides). Journal of Infectious Diseases 1987;155:1011-1019. 74. Stevenson K, Alvarez J, Bakker D et al. Occurrence of Mycobacterium avium subspecies paratuberculosis across host species and European countries with evidence for transmission between wildlife and domestic ruminants. BMC Microbiology 2009;9. 75. Fitzpatrick S. Bovine Johne's Disease (BJD) - NT Fact Sheet. 2260 www.nt.gov.au/d/Primary_Industry/Content/File/biosecurity/FS_JohnesDiseasepdf#search=%22Johne%22. Northern Territory Government, Darwin, 2012. 76. de Lisle GW. Johne's disease in New Zealand: the past, present and a glimpse into the future. New Zealand Veterinary Journal 2002;50:53-56. 77. Stamp JT, Watt JA. Johne's disease in sheep. Journal of Comparative Pathology 1954;64:26-40. 78. Rajya BS, Singh CM. Studies on the pathology of Johne's disease in sheep. III. Pathologic changes in sheep with naturally occurring infection. American Journal of Veterinary Research 1961;22:189-203. 79. Fodstad FH, Gunnarsson E. Post-mortem examination in the diagnosis of Johne's 2270 disease in goats. Acta Veterinaria Scandinavica 1979;20:157-167. 80. Clarke CJ, Little D. The pathology of ovine paratuberculosis: gross and histological changes in the intestine and other tissues. Journal of Comparative Pathology 1996;114:419-437. 81. Buergelt CD, Hall C, McEntee K et al. Pathological evaluation of paratuberculosis in naturally infected cattle. Veterinary Pathology 1978;15:196-207; 115 ref. 82. de Lisle GW, Yates GF, Montgomery RH. The emergence of Mycobacterium

Johne’s Disease
Australian and New Zealand Standard Diagnostic Procedure, July 2015 Page 60 of 68
paratuberculosis in farmed deer in New Zealand - a review of 619 cases. New Zealand Veterinary Journal 2003;51:58-62. 83. Glawischnig W, Steineck T, Spergser J. Infections caused by Mycobacterium avium 2280 subspecies avium, hominissuis, and paratuberculosis in free-ranging red deer (Cervus elaphus hippelaphus) in Austria, 2001-2004. Journal of Wildlife Diseases 2006;42:724-731. 84. Whitlock RH, Wells SJ, Sweeney RW et al. ELISA and fecal culture for paratuberculosis (Johne's disease): sensitivity and specificity of each method. Veterinary Microbiology 2000;77:387-398. 85. Whittington RJ, Fell S, Walker D et al. Use of pooled fecal culture for sensitive and economic detection of Mycobacterium avium subsp. paratuberculosis infection in flocks of sheep. Journal of Clinical Microbiology 2000;38:2550-2556. 86. Eamens GJ, Walker DM, Porter NS et al. Pooled faecal culture for the detection of Mycobacterium avium subsp paratuberculosis in goats. Australian Veterinary Journal 2290 2007;85:243-251. 87. Eamens GJ, Walker DM, Porter NS et al. Radiometric pooled faecal culture for the detection of Mycobacterium avium subsp paratuberculosis in low-shedder cattle. Australian Veterinary Journal 2008;86:259-265. 88. Kalis CHJ, Hesselink JW, Barkema HW et al. Culture of strategically pooled bovine fecal samples as a method to screen herds for paratuberculosis. Journal of Veterinary Diagnostic Investigation 2000;12:547-551. 89. Kalis CHJ, Collins MT, Barkema HW et al. Certification of herds as free of Mycobacterium paratuberculosis infection: actual pooled faecal results versus certification model predictions. Preventive Veterinary Medicine 2004;65:189-204. 2300 90. Wells SJ, Whitlock RH, Lindeman CJ et al. Evaluation of bacteriologic culture of pooled fecal samples for detection of Mycobacterium paratuberculosis. American Journal of Veterinary Research 2002;63:1207-1211. 91. Wells SJ, Godden SM, Lindeman CJ et al. Evaluation of bacteriologic culture of individual and pooled fecal samples for detection of Mycobacterium paratuberculosis in dairy cattle herds. Journal of the American Veterinary Medical Association 2003;223:1022-1025. 92. Tavornpanich S, Gardner IA, Anderson RJ et al. Evaluation of microbial culture of pooled fecal samples for detection of Mycobacterium avium subsp paratuberculosis in large dairy herds. American Journal of Veterinary Research 2004;65:1061-1070. 93. van Schaik G, Pradenas FM, Mella NA et al. Diagnostic validity and costs of pooled 2310 fecal samples and individual blood or fecal samples to determine the cow- and herd-status for Mycobacterium avium subsp paratuberculosis. Preventive Veterinary Medicine 2007;82:159-165. 94. Sergeant ESG, Whittington RJ, More SJ. Sensitivity and specificity of pooled faecal culture and serology as flock-screening tests for detection of ovine paratuberculosis in Australia. Preventive Veterinary Medicine 2002;52:199-211. 95. Raizman EA, Wells SJ, Godden SM et al. The distribution of Mycobacterium avium ssp. paratuberculosis in the environment surrounding Minnesota dairy farms. Journal of Dairy Science 2004;87:2959-2966. 96. Berghaus RD, Farver TB, Anderson RJ et al. Environmental sampling for detection 2320 of Mycobacterium avium ssp. paratuberculosis on large California dairies. Journal of Dairy Science 2006;89:963-970. 97. Lombard JE, Wagner BA, Smith RL et al. Evaluation of environmental sampling and culture to determine Mycobacterium avium subspecies paratuberculosis distribution and herd

Johne’s Disease
Australian and New Zealand Standard Diagnostic Procedure, July 2015 Page 61 of 68
infection status on US dairy operations. Journal of Dairy Science 2006;89:4163-4171. 98. Smith RL, Schukken YH, Pradhan AK et al. Environmental contamination with Mycobacterium avium subsp paratuberculosis in endemically infected dairy herds. Preventive Veterinary Medicine 2011;102:1-9. 99. Pillars RB, Grooms DL, Woltanski JA et al. Prevalence of Michigan dairy herds infected with Mycobacterium avium subspecies paratuberculosis as determined by 2330 environmental sampling. Preventive Veterinary Medicine 2009;89:191-196. 100. Tavornpanich S, Munoz-Zanzi CA, Wells SJ et al. Simulation model for evaluation of testing strategies for detection of paratuberculosis in Midwestern US dairy herds. Preventive Veterinary Medicine 2008;83:65-82. 101. Koh SH, Dobson KY, Tomasovic A. A Johne's disease survey and comparison of diagnostic tests. Australian Veterinary Journal 1988;65:160-161. 102. Whittington RJ, Marsh I, McAllister S et al. Evaluation of modified BACTEC 12B radiometric medium and solid media for culture of Mycobacterium avium subsp. paratuberculosis from sheep. Journal of Clinical Microbiology 1999;37:1077-1083. 103. Jubb TF, Sergeant ESG, Callinan APL et al. Estimate of the sensitivity of an ELISA 2340 used to detect Johne's disease in Victorian dairy cattle herds. Australian Veterinary Journal 2004;82:569-573. 104. Sockett DC, Carr DJ, Collins MT. Evaluation of conventional and radiometric fecal culture and a commercial DNA probe for diagnosis of Mycobacterium paratuberculosis infections in cattle. Canadian Journal of Veterinary Research 1992;56:148-153. 105. van der Giessen JW, Haring RM, Vauclare E et al. Evaluation of the abilities of three diagnostic tests based on the polymerase chain reaction to detect Mycobacterium paratuberculosis in cattle: application in a control program. Journal of Clinical Microbiology 1992;30:1216-1219. 106. Collins DM, Stephens DM, de Lisle GW. Comparison of polymerase chain reaction 2350 tests and faecal culture for detecting Mycobacterium paratuberculosis in bovine faeces. Veterinary Microbiology 1993;36:289-299. 107. Fang Y, Wu W-H, Pepper JL et al. Comparison of real-time, quantitative PCR with molecular beacons to nested PCR and culture methods for detection of Mycobacterium avium subsp. paratuberculosis in bovine fecal samples. Journal of Clinical Microbiology 2002;40:287-291. 108. Christopher-Hennings J, Dammen MA, Weeks SR et al. Comparison of two DNA extractions and nested PCR, real-time PCR, a new commercial PCR assay, and bacterial culture for detection of Mycobacterium avium subsp paratuberculosis in bovine feces. Journal of Veterinary Diagnostic Investigation 2003;15:87-93. 2360 109. Stabel JR, Bosworth TL, Kirkbride TA et al. A simple, rapid, and effective method for the extraction of Mycobacterium paratuberculosis DNA from fecal samples for polymerase chain reaction. Journal of Veterinary Diagnostic Investigation 2004;16:22-30. 110. Taddei S, Robbi C, Cesena C et al. Detection of Mycobacterium avium subsp. paratuberculosis in bovine fecal samples: comparison of three polymerase chain reaction-based diagnostic tests with a conventional culture method. Journal of Veterinary Diagnostic Investigation 2004;16:503-508. 111. Ellingson JLE, Koziczkowski JJ, Anderson JL. Comparison of PCR prescreening to two cultivation procedures with PCR confirmation for detection of Mycobacterium avium subsp. paratuberculosis in U.S. Department of Agriculture fecal check test samples. Journal 2370 of Food Protection 2004;67:2310-2314.

Johne’s Disease
Australian and New Zealand Standard Diagnostic Procedure, July 2015 Page 62 of 68
112. Plante Y, Remenda BW, Chelack BJ et al. Detection of Mycobacterium paratuberculosis in formalin-fixed paraffin-embedded tissues by the polymerase chain reaction. Canadian Journal of Veterinary Research 1996;60:115-120. 113. Whittington RJ, Reddacliff L, Marsh I et al. Detection of Mycobacterium avium subsp. paratuberculosis in formalin-fixed paraffin-embedded intestinal tissue by IS900 polymerase chain reaction. Australian Veterinary Journal 1999;77:392-397. 114. Odumeru J, Gao A, Chen S et al. Use of the bead beater for preparation of Mycobacterium paratuberculosis template DNA in milk. Canadian Journal of Veterinary Research 2001;65:201-205. 2380 115. Kim SG, Shin SJ, Jacobson RH et al. Development and application of quantitative polymerase chain reaction assay based on the ABI 7700 system (TaqMan) for detection and quantification of Mycobacterium avium subsp. paratuberculosis. Journal of Veterinary Diagnostic Investigation 2002;14:126-131. 116. Clark DL, Koziczkowski JJ, Radcliff RP et al. Detection of Mycobacterium avium subspecies paratuberculosis: comparing fecal culture versus serum enzyme-linked immunosorbent assay and direct fecal polymerase chain reaction. Journal of Dairy Science 2008;91:2620-2627. 117. Wells SJ, Collins MT, Faaberg KS et al. Evaluation of a rapid fecal PCR test for detection of Mycobacterium avium subsp. paratuberculosis in dairy cattle. Clinical Vaccine 2390 Immunology 2006;13:1125-1130. 118. Kawaji S, Taylor D, Mori Y et al. Detection of Mycobacterium avium subsp paratuberculosis in ovine faeces by direct quantitative PCR has similar or greater sensitivity compared to radiometric culture. Veterinary Microbiology 2007;125:36-48. 119. Plain KM, Marsh IB, Waldron AM et al. High-throughput direct fecal PCR assay for detection of Mycobacterium avium subsp. paratuberculosis in sheep and cattle. Journal of Clinical Microbiology 2014;52:745-757. 120. Englund S, Bölske G, Johansson KE. An IS900-like sequence found in a Mycobacterium sp. other than Mycobacterium avium subsp. paratuberculosis. FEMS Microbiology Letters 2002;209:267-271. 2400 121. Cousins DV, Whittington R, Marsh I et al. Mycobacteria distinct from Mycobacterium avium subsp. paratuberculosis isolated from the faeces of ruminants possess IS900 -like sequences detectable by IS900 polymerase chain reaction: implications for diagnosis. Molecular and Cellular Probes 1999;13:431-442. 122. Perez V, Garcia Marin JF, Badiola JJ. Description and classification of different types of lesion associated with natural paratuberculosis infection in sheep. Journal of Comparative Pathology 1996;114:107-122. 123. Clarke CJ. The pathology and pathogenesis of paratuberculosis in ruminants and other species. Journal of Comparative Pathology 1997;116:217-261. 124. Juste RA, Garcia Marin JF, Peris B et al. Experimental infection of vaccinated and 2410 non-vaccinated lambs with Mycobacterium paratuberculosis. Journal of Comparative Pathology 1994;110:185-194. 125. Tafti AK, Rashidi K. The pathology of goat paratuberculosis: gross and histopathological lesions in the intestines and mesenteric lymph nodes. Journal of Veterinary Medicine-Series-B 2000;47:487-495. 126. Corpa JM, Garrido J, Garcia Marin JF et al. Classification of lesions observed in natural cases of paratuberculosis in goats. Journal of Comparative Pathology 2000;122:255-265.

Johne’s Disease
Australian and New Zealand Standard Diagnostic Procedure, July 2015 Page 63 of 68
127. Gwozdz JM, Thompson KG, Manktelow BW. Lymphocytic neuritis of the ileum in sheep with naturally acquired and experimental paratuberculosis. Journal of Comparative 2420 Pathology 2001;124:317-320. 128. Clark RG, Griffin JFT, Mackintosh CG. Johne's disease caused by Mycobacterium avium subsp paratuberculosis infection in red deer (Cervus elaphus): An histopathological grading system, and comparison of paucibacillary and multibacillary disease. New Zealand Veterinary Journal 2010;58:90-97. 129. Clark RG, Griffin JF, Mackintosh CG. Modification to histopathological lesion severity score in red deer (Cervus elaphus) affected by Johne's disease. New Zealand Veterinary Journal 2011;59:261-262. 130. Corner LA. Bovine Tuberculosis: Pathology and Bacteriology. In: Corner LA, Bagust TJ, editors. Australian Standard Diagnostic Techniques for Animal Diseases. CSIRO 2430 Information Services, East Melbourne, 1993:10-11. 131. Master RN. 3. Mycobacteriology 3.5 Acid-Fast Stain Procedures. In: Isenberg HD, editor. Clinical Microbiology Procedures Handbook. American Society for Microbiology, Washington, D.C., 1992:3.5.3-3.5.7. 132. Shin S. New methods for reduction in bacterial and fungal contamination from fecal culture for Mycobacterium paratuberculosis. Report of the Committee on Johne's Disease. Proceedings Annual Meeting of the United States Animal Health Association 1989;93:381. 133. Whitlock RH, Rosenberger AE. Fecal culture protocol for Mycobacterium paratuberculosis. A recommended procedure. Proceedings Annual Meeting of the United States Animal Health Association 1990;94:280-285. 2440 134. Whitlock RH, Rosenberger AE, Sweeney RW et al. Culture techniques and media constituents for the isolation of M. paratuberculosis from bovine faecal samples. In: Chiodini RJ, Kreeger JM, editors. 3rd International Colloquium on Paratuberculosis. International Association for Paratuberculosis Inc, Orlando, Florida, 1991:94-111. 135. Reddacliff LA, Vadali A, Whittington RJ. The effect of decontamination protocols on the numbers of sheep strain Mycobacterium avium subsp. paratuberculosis isolated from tissues and faeces. Veterinary Microbiology 2003;95:271-282. 136. Eamens GJ, Whittington RJ, Marsh IB et al. Comparative sensitivity of various faecal culture methods and ELISA in dairy cattle herds with endemic Johne's disease. Veterinary Microbiology 2000;77:357-367. 2450 137. Whittington RJ. Factors affecting isolation and identification of Mycobacterium avium subsp paratuberculosis from fecal and tissue samples in a liquid culture system. Journal of Clinical Microbiology 2009;47:614-622. 138. Whittington RJ. Cultivation of Mycobacterium avium subsp. paratuberculosis. In: Behr MA, Collins DM, editors. Paratuberculosis Organism, Disease, Control. CABI, Wallingford, 2010:244-266. 139. Cousins DV, Evans RJ, Francis BR. Use of BACTEC radiometric culture method and polymerase chain reaction for the rapid screening of faeces and tissues for Mycobacterium paratuberculosis. Australian Veterinary Journal 1995;72:458-462. 140. Gumber S, Whittington RF. Comparison of BACTEC 460 and MGIT 960 systems for 2460 the culture of Mycobacterium avium subsp. paratuberculosis S strain and observations on the effect of inclusion of ampicillin in culture media to reduce contamination. Veterinary Microbiology 2009;139:423-424. 141. McDonald J, Collins MT, Lambrecht RS. Radiometric detection of Mycobacterium paratuberculosis from clinical specimens. In: Milner AR, Wood PR, editors. Johne's disease:

Johne’s Disease
Australian and New Zealand Standard Diagnostic Procedure, July 2015 Page 64 of 68
current trends in research, diagnosis and management CSIRO, East Melbourne, 1989:146-152. 142. Whittington RJ, Marsh I, Turner MJ et al. Rapid detection of Mycobacterium paratuberculosis in clinical samples from ruminants and in spiked environmental samples by modified BACTEC 12B radiometric culture and direct confirmation by IS900 PCR. Journal 2470 of Clinical Microbiology 1998;36:701-707. 143. Whittington RJ, Whittington AM, Waldron A et al. Development and validation of a liquid medium (M7H9C) for routine culture of Mycobacterium avium subsp. paratuberculosis to replace modified Bactec 12B medium. Journal of Clinical Microbiology 2013;51:3993-4000. 144. Grant IR, Kirk RB, Hitchings E et al. Comparative evaluation of the MGIT and BACTEC culture systems for the recovery of Mycobacterium avium subsp. paratuberculosis from milk. Journal of Applied Microbiology 2003;95:196-201. 145. de Juan L, Alvarez J, Romero B et al. Comparison of four different culture media for isolation and growth of type II and type I/III Mycobacterium avium subsp paratuberculosis 2480 strains isolated from cattle and goats. Applied and Environmental Microbiology 2006;72:5927-5932. 146. Whittington RJ, Marsh IB, Saunders V et al. Culture phenotypes of genomically and geographically diverse Mycobacterium avium subsp paratuberculosis isolates from different hosts. Journal of Clinical Microbiology 2011;49:1822-1830. 147. Merkal RS. Paratuberculosis: advances in cultural, serologic, and vaccination methods. Journal of the American Veterinary Medical Association 1984;184:939-943. 148. Merkal RS, Curran BJ. Growth and metabolic characteristics of Mycobacterium paratuberculosis. Applied Microbiology 1974;28:276-279. 149. Matthews PRJ, McDiarmid A, Collins P et al. The dependence of some strains of 2490 Mycobacterium avium on mycobactin for initial and subsequent growth. Journal of Medical Microbiology 1978;11:53-57. 150. Barclay R, Ratledge C. Iron-binding compounds of Mycobacterium avium, M. intracellulare, M. scrofulaceum, and mycobactin-dependent M. paratuberculosis and M. avium. Journal of Bacteriology 1983;153:1138-1146. 151. Thorel MF, Desmettre P. Comparative study of mycobactin-dependent mycobacterial strains from the wood-pigeon, and Mycobacterium avium and Mycobacterium paratuberculosis: study of biological and antigenic characteristics. Annales de Microbiologie 1982;133B:291-302. 152. Gunnarsson E, Fodstad FH. Cultural and biochemical characteristics of 2500 Mycobacterium paratuberculosis isolated from goats in Norway. Acta Veterinaria Scandinavica 1979;20:122-134. 153. Brooks BW, Robertson RH, Corner AH et al. Evaluation of the serological response of sheep in one flock to Mycobacterium paratuberculosis by crossed immunoelectrophoresis. Canadian Journal of Veterinary Research 1988;52:199-204. 154. Shulaw WP, Bech-Nielsen S, Rings DM et al. Serodiagnosis of paratuberculosis in sheep by use of agar gel immunodiffusion. American Journal of Veterinary Research 1993;54:13-19. 155. Morrison NE. Circumvention of the mycobactin requirement of Mycobacterium paratuberculosis. Journal of Bacteriology 1965;89:762-767. 2510 156. Green EP, Tizard ML, Moss MT et al. Sequence and characteristics of IS900, an insertion element identified in a human Crohn's disease isolate of Mycobacterium

Johne’s Disease
Australian and New Zealand Standard Diagnostic Procedure, July 2015 Page 65 of 68
paratuberculosis. Nucleic Acids Research 1989;17:9063-9073. 157. Moss MT, Green EP, Tizard ML et al. Specific detection of Mycobacterium paratuberculosis by DNA hybridisation with a fragment of the insertion element IS900. Gut 1991;32:395-398. 158. Sanderson JD, Moss MT, Tizard ML et al. Mycobacterium paratuberculosis DNA in Crohn's disease tissue. Gut 1992;33:890-896. 159. Vary PH, Andersen PR, Green E et al. Use of highly specific DNA probes and the polymerase chain reaction to detect Mycobacterium paratuberculosis in Johne's disease. 2520 Journal of Clinical Microbiology 1990;28:933-937. 160. Millar D, Ford J, Sanderson J et al. IS900 PCR to detect Mycobacterium paratuberculosis in retail supplies of whole pasteurized cows' milk in England and Wales. Applied and Environmental Microbiology 1996;62:3446-3452. 161. Englund S, Ballagi-Pordány A, Bölske G et al. Single PCR and nested PCR with a mimic molecule for detection of Mycobacterium avium subsp. paratuberculosis. Diagnostic Microbiology & Infectious Disease 1999;33:163-171. 162. Marsh IB, Whittington RJ. Progress towards a rapid polymerase chain reaction diagnostic test for the identification of Mycobacterium avium subsp. paratuberculosis in faeces. Molecular and Cellular Probes 2001;15:105-118. 2530 163. Bull TJ, McMinn EJ, Sidi-Boumedine K et al. Detection and verification of Mycobacterium avium subsp. paratuberculosis in fresh ileocolonic mucosal biopsy specimens from individuals with and without Crohn's disease. Journal of Clinical Microbiology 2003;41:2915-2923. 164. Vansnick E, De Rijk P, Vercammen F et al. Newly developed primers for the detection of Mycobacterium avium subspecies paratuberculosis. Veterinary Microbiology 2004;100:197-204. 165. Ikonomopoulos J, Gazouli M, Pavlik I et al. Comparative evaluation of PCR assays for the robust molecular detection of Mycobacterium avium subsp. paratuberculosis. Journal of Microbiological Methods 2004;56:315-321. 2540 166. Collins DM, Gabric DM, De Lisle GW. Identification of a repetitive DNA sequence specific to Mycobacterium paratuberculosis. FEMS Microbiology Letters 1989;51:175-178. 167. Tasara T, Hoelzle LE, Stephan R. Development and evaluation of a Mycobacterium avium subspecies paratuberculosis (MAP) specific multiplex PCR assay. International Journal of Food Microbiology 2005;104:279-287. 168. Motiwala AS, Amonsin A, Strother M et al. Molecular epidemiology of Mycobacterium avium subsp paratuberculosis isolates recovered from wild animal species. Journal of Clinical Microbiology 2004;42:1703-1712. 169. Rajeev S, Zhang Y, Sreevatsan S et al. Evaluation of multiple genomic targets for identification and confirmation of Mycobacterium avium subsp paratuberculosis isolates 2550 using real-time PCR. Veterinary Microbiology 2005;105:215-221. 170. Herthnek D, Bolske G. New PCR systems to confirm real-time PCR detection of Mycobacterium avium subsp paratuberculosis. BMC Microbiology 2006;6. 171. Stabel JR, Bannantine JP. Development of a nested PCR method targeting a unique multicopy element, ISMap02, for detection of Mycobacterium avium subsp paratuberculosis in fecal samples. Journal of Clinical Microbiology 2005;43:4744-4750. 172. Strommenger B, Stevenson K, Gerlach GF. Isolation and diagnostic potential of ISMav2, a novel insertion sequence-like element from Mycobacterium avium subspecies paratuberculosis. FEMS Microbiology Letters 2001;196:31-37.

Johne’s Disease
Australian and New Zealand Standard Diagnostic Procedure, July 2015 Page 66 of 68
173. Shin SJ, Chang YF, Huang C et al. Development of a polymerase chain reaction test 2560 to confirm Mycobacterium avium subsp. paratuberculosis in culture. Journal of Veterinary Diagnostic Investigation 2004;16:116-120. 174. Poupart P, Coene M, Van Heuverswyn H et al. Preparation of a specific RNA probe for detection of Mycobacterium paratuberculosis and diagnosis of Johne's disease. Journal of Clinical Microbiology 1993;31:1601-1605. 175. Tasara T, Stephan R. Development of an F57 sequence-based real-time PCR assay for detection of Mycobacterium avium subsp. paratuberculosis in milk. Applied and Environmental Microbiology 2005;71:5957-5968. 176. Slana I, Kralik P, Kralova A et al. On-farm spread of Mycobacterium avium subsp paratuberculosis in raw milk studied by IS900 and F57 competitive real time quantitative 2570 PCR and culture examination. International Journal of Food Microbiology 2008;128:250-257. 177. Ellingson JLE, Bolin CA, Stabel JR. Identification of a gene unique to Mycobacterium avium subspecies paratuberculosis and application to diagnosis of paratuberculosis. Molecular and Cellular Probes 1998;12:133-142. 178. Bannantine JP, Baechler E, Zhang Q et al. Genome scale comparison of Mycobacterium avium subsp. paratuberculosis with Mycobacterium avium subsp. avium reveals potential diagnostic sequences. Journal of Clinical Microbiology 2002;40:1303-1310. 179. Möbius P, Hotzel H, Rassbach A et al. Comparison of 13 single-round and nested PCR assays targeting IS900, ISMav2, f57 and locus 255 for detection of Mycobacterium 2580 avium subsp. paratuberculosis. Veterinary Microbiology 2008;126:324-333. 180. Irenge LM, Walravens K, Govaerts M et al. Development and validation of a triplex real-time PCR for rapid detection and specific identification of M. avium subsp. paratuberculosis in faecal samples. Veterinary Microbiology 2009;136:166-172. 181. Schonenbrucher H, Abdurnawjood A, Failing K et al. New triplex real-time PCR assay for detection of Mycobacterium avium subsp paratuberculosis in bovine feces. Applied and Environmental Microbiology 2008;74:2751-2758. 182. Paustian ML, Amonsin A, Kapur V et al. Characterization of novel coding sequences specific to Mycobacterium avium subsp paratuberculosis: implications for diagnosis of Johne's disease. Journal of Clinical Microbiology 2004;42:2675-2681. 2590 183. Rhodes G, Henrys P, Thomson BC et al. Mycobacterium avium subspecies paratuberculosis is widely distributed in British soils and waters: implications for animal and human health. . Environmental Microbiology 2013;15:2761-2774. 184. Slana I, Pribylova R, Kralova A et al. Persistence of Mycobacterium avium subsp paratuberculosis at a farm-scale biogas plant supplied with manure from paratuberculosis-affected dairy cattle. Applied and Environmental Microbiology 2011;77:3115-3119. 185. Herthnek D, Bölske G. New PCR systems to confirm real-time PCR detection of Mycobacterium avium subsp. paratuberculosis. BMC Microbiology 2006;6. 186. Moss MT, Sanderson JD, Tizard ML et al. Polymerase chain reaction detection of Mycobacterium paratuberculosis and Mycobacterium avium subsp silvaticum in long term 2600 cultures from Crohn's disease and control tissues. Gut 1992;33:1209-1213. 187. Wilton S, Cousins D. Detection and identification of multiple mycobacterial pathogens by DNA amplification in a single tube. PCR Methods Appl 1992;1:269-273. 188. Saiki RK. The design and optimisation of the PCR. In: Erlich HA, editor. PCR Technology Principles and Application. Stockton Press, New York, 1989:7-16. 189. McCreedy BJ, Callaway TH. Laboratory design and work flow. In: Persing DH,
Johne’s Disease
Australian and New Zealand Standard Diagnostic Procedure, July 2015 Page 67 of 68
editor. Diagnostic Molecular Biology: Principles and Applications. Mayo Foundation, Rochester, 1993:149-159. 190. Wilton S, Cousins D. Detection and identification of multiple mycobacterial pathogens by DNA amplification in a single tube. PCR Methods and Applications 2610 1992;1:269-273. 191. Bustin SA, Benes V, Garson JA et al. The MIQE Guidelines: Minimum Information for Publication of Quantitative Real-Time PCR Experiments. Clinical Chemistry 2009;55:611-622. 192. Whittington R, Marsh I, Choy E et al. Polymorphisms in IS1311, an insertion sequence common to Mycobacterium avium and M. avium subsp. paratuberculosis, can be used to distinguish between and within these species. Molecular and Cellular Probes 1998;12:349-358. 193. Sevilla I, Singh SV, Garrido JM et al. Molecular typing of Mycobacterium avium subspecies paratuberculosis strains from different hosts and regions. Revue Scientifique Et 2620 Technique-Office International Des Epizooties 2005;24:1061-1066. 194. Yokomizo Y, Yugi H, Merkal RS. A method for avoiding false-positive reactions in an enzyme-linked immunosorbent assay (ELISA) for the diagnosis of bovine paratuberculosis. Japanese Journal of Veterinary Science 1985;47:111-119. 195. Gumber S, Eamens G, Whittington RJ. Evaluation of a Pourquier ELISA kit in relation to agar gel immunodiffusion (AGID) test for assessment of the humoral immune response in sheep and goats with and without Mycobacterium paratuberculosis infection. Veterinary Microbiology 2006;115:91-101. 196. O’Brien R, Rodgers C, Liggett S et al. Immunodiagnosis of TB and Johne’s disease in deer. Proceedings of the 1st World Deer Veterinary Congress; Deer Course for 2630 Veterinarians, No 21,. Deer Branch of the New Zealand Veterinary Association, 2004:102-105. 197. O’Brien R, Hughes A, Liggett S et al. Composite testing for ante-mortem diagnosis of Johne’s disease in farmed New Zealand deer: correlations between bacteriological culture, histopathology, serological reactivity and faecal shedding as determined by quantitative PCR. BMC Veterinary Research 2013;9:72. 198. Salgado M, Manning EJB, Collins MT. Performance of a Johne's disease enzyme-linked immunosorbent assay adapted for milk samples from goats. Journal of Veterinary Diagnostic Investigation 2005;17:350-354. 199. Hendrick SH, Duffield TE, Kelton DE et al. Evaluation of enzyme-linked 2640 immunosorbent assays performed on milk and serum samples for detection of paratuberculosis in lactating dairy cows. Journal of the American Veterinary Medical Association 2005;226:424-428. 200. Hope AF, Kluver PF, Jones SL et al. Sensitivity and specificity of two serological tests for the detection of ovine paratuberculosis. Australian Veterinary Journal 2000;78:850-856. 201. Gwozdz JM, Thompson KG, Murray A et al. Comparison of three serological tests and an interferon-gamma assay for the diagnosis of paratuberculosis in experimentally infected sheep. Australian Veterinary Journal 2000;78:779-783. 202. Sergeant ESG, Marshall DJ, Eamens GJ et al. Evaluation of an absorbed ELISA and 2650 an agar-gel immuno-diffusion test for ovine paratuberculosis in sheep in Australia. Preventive Veterinary Medicine 2003;61:235-248. 203. Ratnamohan TN, Norris MJ, Mitchell G et al. A reappraisal of the complement

Johne’s Disease
Australian and New Zealand Standard Diagnostic Procedure, July 2015 Page 68 of 68
fixation test using soluble Mycobacterium avium antigen for the detection of M. paratuberculosis infection in cattle. Australian Veterinary Journal 1986;63:133-134. 204. Larsen AB, Kopecky KE. Studies on the intravenous administration of johnin to diagnose Johne's disease. American Journal of Veterinary Research 1965;26:673-675. 205. Buergelt CD, DeLisle G, Hall CE et al. In vitro lymphocyte transformation as a herd survey method for bovine paratuberculosis. American Journal of Veterinary Research 1978;39:591-595. 2660 206. de Lisle GW, Duncan JR. Bovine paratuberculosis III. An evaluation of a whole blood lymphocyte transformation test. Canadian Journal of Comparative Medicine 1981;45:304-309. 207. Hintz AM. Comparative lymphocyte stimulation studies on whole blood from vaccinated and nonvaccinated cattle with paratuberculosis. American Journal of Veterinary Research 1981;42:507-510. 208. Elsken LA, Nonnecke BJ. In vitro transformation of lymphocytes from blood and milk of cows with subclinical paratuberculosis. American Journal of Veterinary Research 1986;47:1513-1516. 209. Aalund O, Hoerlein AB, Adler HC. The migration test on circulating bovine 2670 leukocytes and its possible application in the diagnosis of Johne's disease. Acta Vet Scandinavica 1970;11:331-334. 210. Bendixen PH. Application of the direct leukocyte-migration agarose test in cattle naturally infected with Mycobacterium paratuberculosis. American Journal of Veterinary Research 1977;38:1161-1162. 211. Wood PR, Billman-Jacobe H, Milner AR et al. Serological and cellular assays for the diagnosis of mycobacterial infections in cattle. In: Chiodini RJ, Kreeger JM, editors. 3rd International Colloquium on Paratuberculosis. International Association for Paratuberculosis Inc, Orlando, Florida, 1991:12-21. 212. Kalis CHJ, Collins MT, Hesselink JW et al. Specificity of two tests for the early 2680 diagnosis of bovine paratuberculosis based on cell-mediated immunity: the Johnin skin test and the gamma interferon assay. Veterinary Microbiology 2003;97:73-86. 213. Robbe-Austerman S, Stabel JR, Palmer MV. Evaluation of the gamma interferon ELISA in sheep subclinically infected with Mycobacterium avium subspecies paratuberculosis using a whole-cell sonicate or a johnin purified-protein derivative. Journal of Veterinary Diagnostic Investigation 2006;18:189-194. 214. McDonald WL, Ridge SE, Hope AF et al. Evaluation of diagnostic tests for Johne's disease in young cattle. Australian Veterinary Journal 1999;77:113-119. 215. Jungersen G, Huda A, Hansen JJ et al. Interpretation of the gamma interferon test for diagnosis of subclinical paratuberculosis in cattle. Clinical and Diagnostic Laboratory 2690 Immunology 2002;9:453-460. 216. Huda A, Jungersen G, Lind P. Longitudinal study of interferon-gamma, serum antibody and milk antibody responses in cattle infected with Mycobacterium avium subsp paratuberculosis. Veterinary Microbiology 2004;104:43-53. 217. Choy E, Whittington RJ, Marsh I et al. A method for purification and characterisation of Mycobacterium avium subsp. paratuberculosis from the intestinal mucosa of sheep with Johne's disease. Veterinary Microbiology 1998;64:51-60.