Embed Size (px)
Citation preview
Measuring
College and
Career
Readiness
PARCC RESULTS:
YEAR ONE
NORTH HALEDON SCHOOL DISTRICT
DECEMBER 2015
PRESENTED BY:
MICHELE MAZZOLA
SUPERVISOR OF ACADEMIC AFFAIRS
“New Jersey will educate all students to
prepare them to lead productive, fulfilling
lives. Through a public education system
that is seamlessly aligned from pre-school
to college, students will gain the requisite
academic knowledge and technical and
critical thinking skills for life and work in
the 21st century.”
VISION FOR PUBLIC EDUCATION IN NEW JERSEY
2009: New Jersey adopted h igher course taking requirements for a l l s tudents .
2010: New Jersey adopted the Common Core State Standards in Engl ish Language Ar ts and Mathemat ics .
RAISING
STANDARDSCollege and Career Ready Standards
“Align New Jersey high school standards and graduation requirements to college and workforce entry requirements.” – NJ High School Redesign Steering Committee (HSRSC - 2008)
New Jersey has adopted standards that “are widely recognized as appropriate standards for college and career readiness.” - College and Career Ready Taskforce (CCRT -2012)
NEXT STEPS:
REPLACE
HSPA
“Currently the New Jersey High
School Proficiency Assessment
(HSPA) does not measure
college or work
readiness…Further, New Jersey
colleges and universities do
not use scores from the HSPA
for admissions or placement,
because the test does not
reflect postsecondary
placement requirements.”
(HSRSC - 2008)
2015: New Jersey adopted the Par tnersh ip for Assessment of Readiness for Col lege and Careers (PARCC) assessments in Engl ish Language Ar ts/L i teracy and Mathemat ics .
IMPROVING
STUDENT
ASSESSMENT
A System of Aligned Assessments
“Replace HSPA with a series of end of course assessments in math… and a proficiency exam in language arts literacy that are aligned with the expectations of higher education and the workplace.” (HSRSC - 2008)
Current tests should be “replaced with a system of end-of-course assessments.” (CCRT -2012)
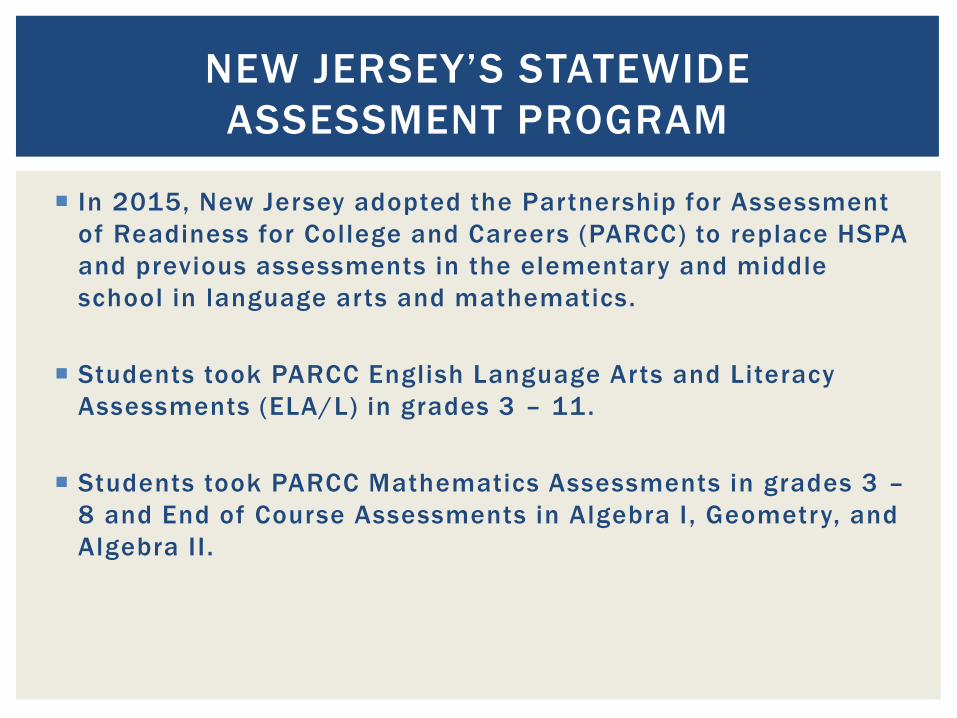
In 2015, New Jersey adopted the Partnership for Assessment
of Readiness for College and Careers (PARCC) to replace HSPA
and previous assessments in the elementary and middle
school in language arts and mathematics.
Students took PARCC English Language Arts and Literacy
Assessments (ELA/L) in grades 3 – 11.
Students took PARCC Mathematics Assessments in grades 3 –
8 and End of Course Assessments in Algebra I, Geometry, and
Algebra II.
NEW JERSEY’S STATEWIDE
ASSESSMENT PROGRAM
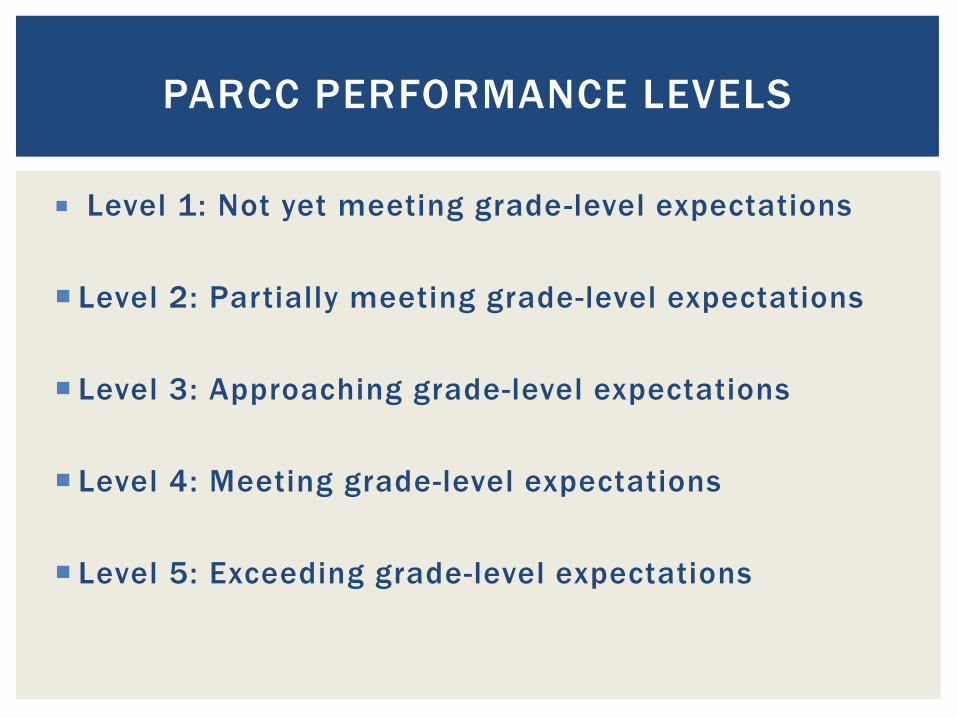
Level 1: Not yet meeting grade-level expectations
Level 2: Partially meeting grade-level expectations
Level 3: Approaching grade-level expectations
Level 4: Meeting grade-level expectations
Level 5: Exceeding grade-level expectations
PARCC PERFORMANCE LEVELS

Not Yet
Meeting
(Level 1)
Partially
Meeting
(Level 2)
Approaching
Expectations
(Level 3)
Meeting
Expectations
(Level 4)
Exceeding
Expectations
(Level 5)
% >=
Level 4
Grade 3 15% 18% 24% 39% 5% 44%
Grade 4 8% 15% 27% 39% 12% 51%
Grade 5 7% 15% 26% 45% 6% 52%
Grade 6 8% 16% 28% 40% 9% 49%
Grade 7 11% 15% 23% 34% 18% 52%
Grade 8 12% 15% 22% 39% 13% 52%
Grade 9 18% 19% 24% 30% 10% 40%
Grade 10 25% 18% 20% 26% 11% 37%
Grade 11 17% 19% 24% 30% 11% 41%
NEW JERSEY’S 2015 PARCC OUTCOMES
ENGLISH LANGUAGE ARTS/LITERACY
Note: Numbers may not sum to 100% due to rounding.
Not Yet
Meeting
(Level 1)
Partially
Meeting
(Level 2)
Approaching
Expectations
(Level 3)
Meeting
Expectations
(Level 4)
Exceeding
Expectations
(Level 5)
% >=
Level 4
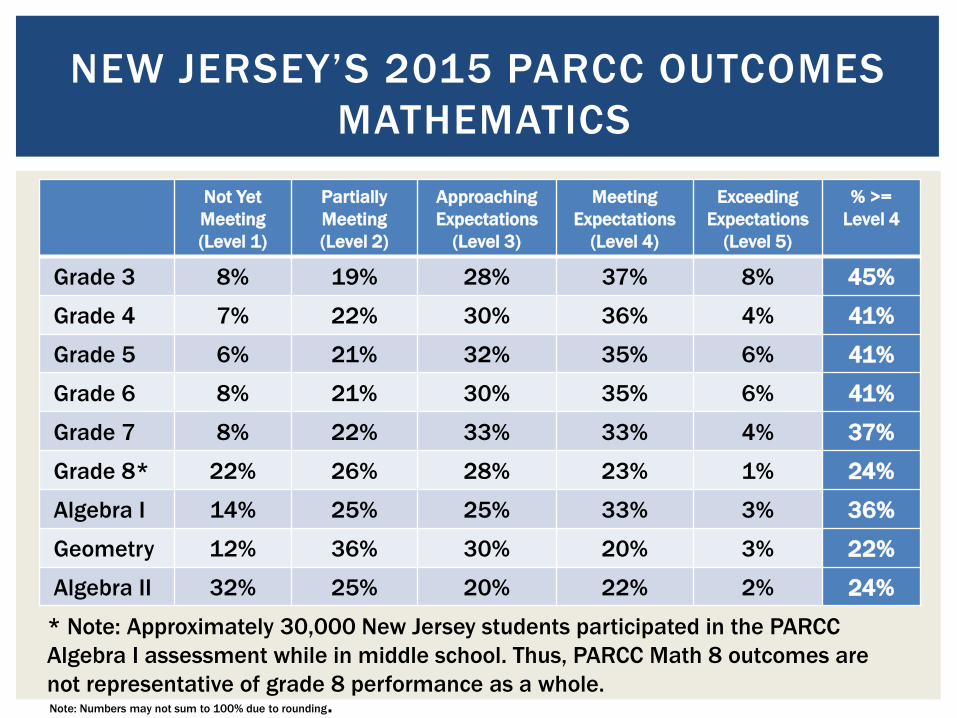
Grade 3 8% 19% 28% 37% 8% 45%
Grade 4 7% 22% 30% 36% 4% 41%
Grade 5 6% 21% 32% 35% 6% 41%
Grade 6 8% 21% 30% 35% 6% 41%
Grade 7 8% 22% 33% 33% 4% 37%
Grade 8* 22% 26% 28% 23% 1% 24%
Algebra I 14% 25% 25% 33% 3% 36%
Geometry 12% 36% 30% 20% 3% 22%
Algebra II 32% 25% 20% 22% 2% 24%
NEW JERSEY’S 2015 PARCC OUTCOMES
MATHEMATICS
* Note: Approximately 30,000 New Jersey students participated in the PARCC
Algebra I assessment while in middle school. Thus, PARCC Math 8 outcomes are
not representative of grade 8 performance as a whole.Note: Numbers may not sum to 100% due to rounding.
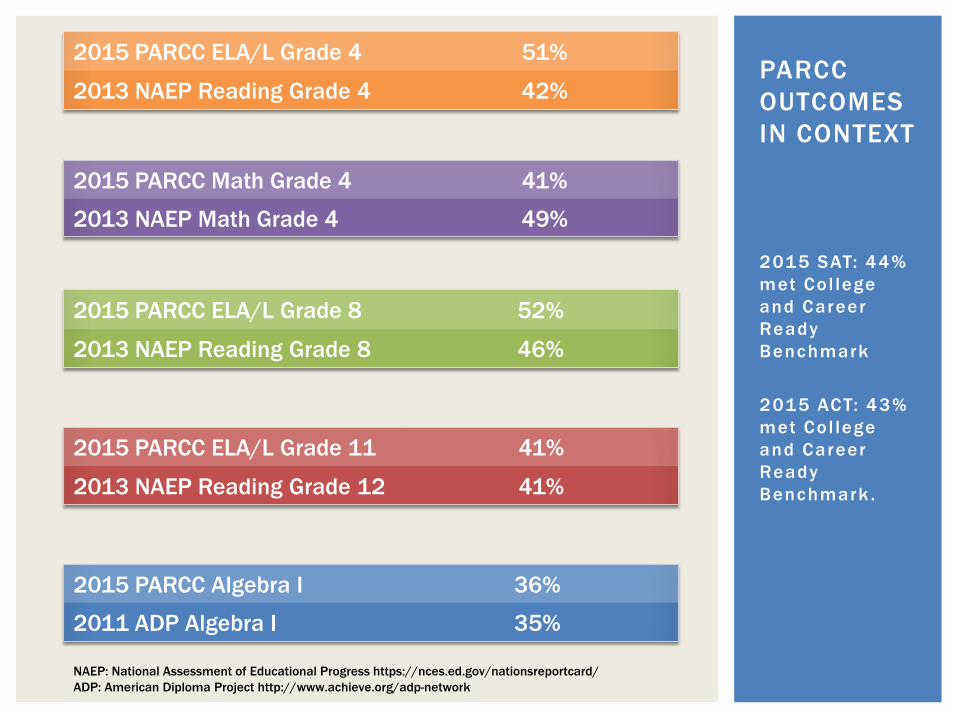
2015 PARCC ELA/L Grade 4 51%
2013 NAEP Reading Grade 4 42%
2015 SAT: 44%
met Col lege
and Career
Ready
Benchmark
2015 ACT: 43%
met Col lege
and Career
Ready
Benchmark .
PARCC
OUTCOMES
IN CONTEXT
2015 PARCC Math Grade 4 41%
2013 NAEP Math Grade 4 49%
2015 PARCC ELA/L Grade 8 52%
2013 NAEP Reading Grade 8 46%
2015 PARCC ELA/L Grade 11 41%
2013 NAEP Reading Grade 12 41%
2015 PARCC Algebra I 36%
2011 ADP Algebra I 35%
NAEP: National Assessment of Educational Progress https://nces.ed.gov/nationsreportcard/
ADP: American Diploma Project http://www.achieve.org/adp-network
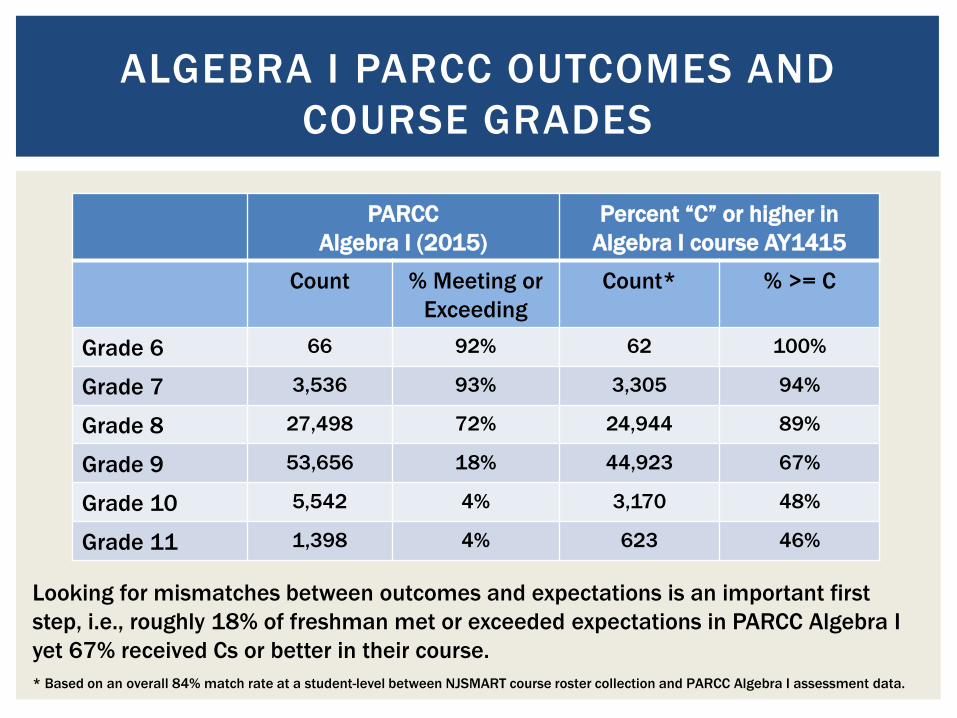
ALGEBRA I PARCC OUTCOMES AND
COURSE GRADES
PARCC
Algebra I (2015)
Percent “C” or higher in
Algebra I course AY1415
Count % Meeting or
Exceeding
Count* % >= C
Grade 6 66 92% 62 100%
Grade 7 3,536 93% 3,305 94%
Grade 8 27,498 72% 24,944 89%
Grade 9 53,656 18% 44,923 67%
Grade 10 5,542 4% 3,170 48%
Grade 11 1,398 4% 623 46%
* Based on an overall 84% match rate at a student-level between NJSMART course roster collection and PARCC Algebra I assessment data.
Looking for mismatches between outcomes and expectations is an important first
step, i.e., roughly 18% of freshman met or exceeded expectations in PARCC Algebra I
yet 67% received Cs or better in their course.
Count of
Valid Test
Scores
Not Yet
Meeting
(Level 1)
Partially
Meeting
(Level 2)
Approaching
Expectations
(Level 3)
Meeting
Expectations
(Level 4)
Exceeding
Expectation
(Level 5)
District
% >=
Level 4
NJ % >=
Level 4
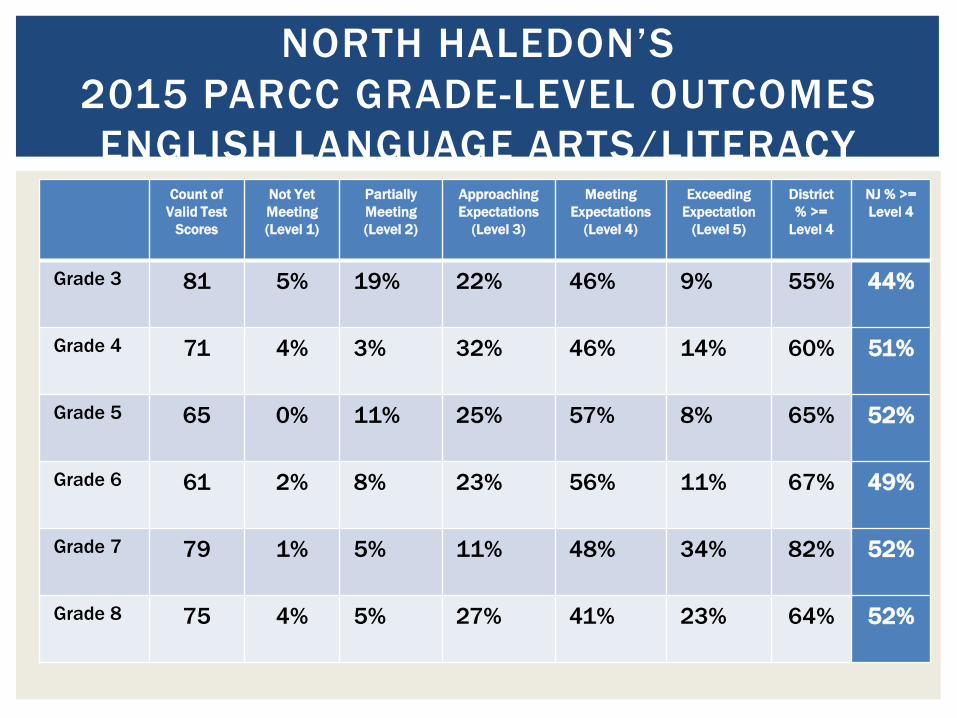
Grade 3 81 5% 19% 22% 46% 9% 55% 44%
Grade 4 71 4% 3% 32% 46% 14% 60% 51%
Grade 5 65 0% 11% 25% 57% 8% 65% 52%
Grade 6 61 2% 8% 23% 56% 11% 67% 49%
Grade 7 79 1% 5% 11% 48% 34% 82% 52%
Grade 8 75 4% 5% 27% 41% 23% 64% 52%
NORTH HALEDON’S
2015 PARCC GRADE-LEVEL OUTCOMES
ENGLISH LANGUAGE ARTS/LITERACY
Reading
Average Score
Writing Average
Score
PARCC Average
Overall Score
State Average
Overall Score
District Average
Overall Score
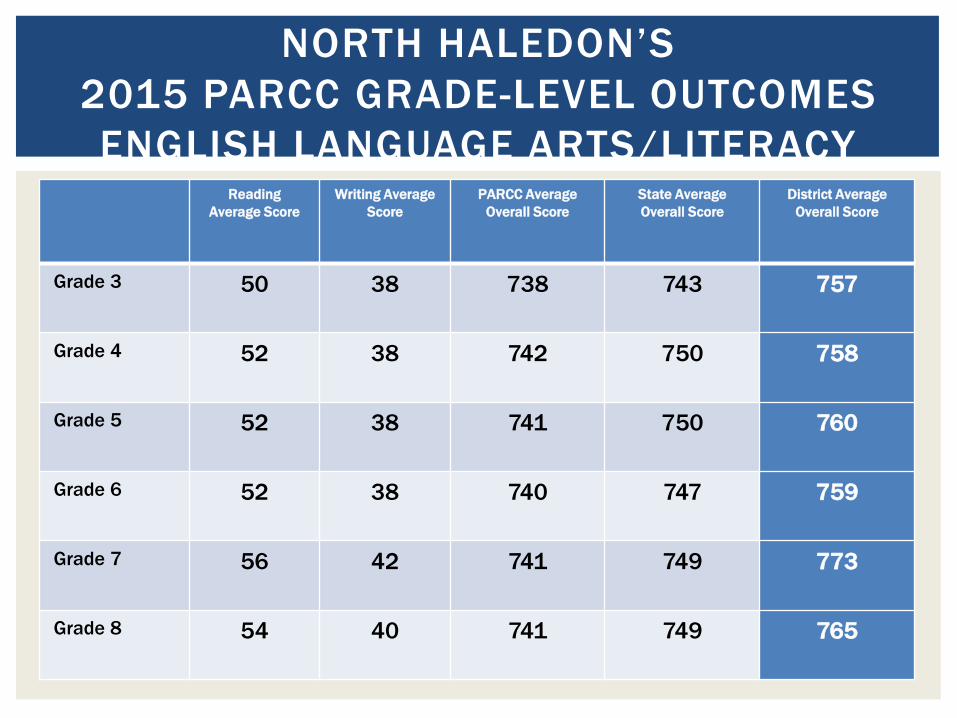
Grade 3 50 38 738 743 757
Grade 4 52 38 742 750 758
Grade 5 52 38 741 750 760
Grade 6 52 38 740 747 759
Grade 7 56 42 741 749 773
Grade 8 54 40 741 749 765
NORTH HALEDON’S
2015 PARCC GRADE-LEVEL OUTCOMES
ENGLISH LANGUAGE ARTS/LITERACY

Count of
Valid Test
Scores
Not Yet
Meeting
(Level 1)
Partially
Meeting
(Level 2)
Approaching
Expectations
(Level 3)
Meeting
Expectations
(Level 4)
Exceeding
Expectation
(Level 5)
District %
>= Level
4
NJ % >=
Level 4
Grade 3 81 7% 20% 30% 32% 11% 43% 45%
Grade 4 71 10% 23% 34% 32% 1% 33% 41%
Grade 5 66 3% 20% 36% 38% 3% 41% 41%
Grade 6 61 2% 13% 28% 41% 16% 57% 41%
Grade 7 80 1% 10% 24% 54% 11% 65% 37%
Grade 8* 59 7% 32% 19% 42% 0% 42% 24%
Algebra I 18 0% 0% 0% 88% 13% 100% 36%
NORTH HALEDON’S
2015 PARCC GRADE-LEVEL OUTCOMES
MATHEMATICS

PARCC Average Overall
Score
State Average Overall
Score
District Average Overall Score
Grade 3 738 745 747
Grade 4 736 743 738
Grade 5 736 743 745
Grade 6 735 742 756
Grade 7 734 739 757
Grade 8* 728 725 738
Algebra I 734 737 786
NORTH HALEDON’S
2015 PARCC GRADE-LEVEL OUTCOMES
MATHEMATICS
The Score Report
16
http://www.parcconline.org/assessments/score-results

What Parents Need to Know About the Score Reports
• The PARCC tests replace the old state tests. They measure how well students are performing against the new state standards that guide math and English language arts instruction.
• The PARCC tests are only one of several measures, including report card grades and in-class performance, that are used to determine a student's academic achievement. They do not impact a student’s GPA.
• The score reports are a valuable tool for parents and teachers. The report provides a deeper level of information that can be used to better understand where students are doing well and where they need additional support. This helps teachers and parents support students.
17
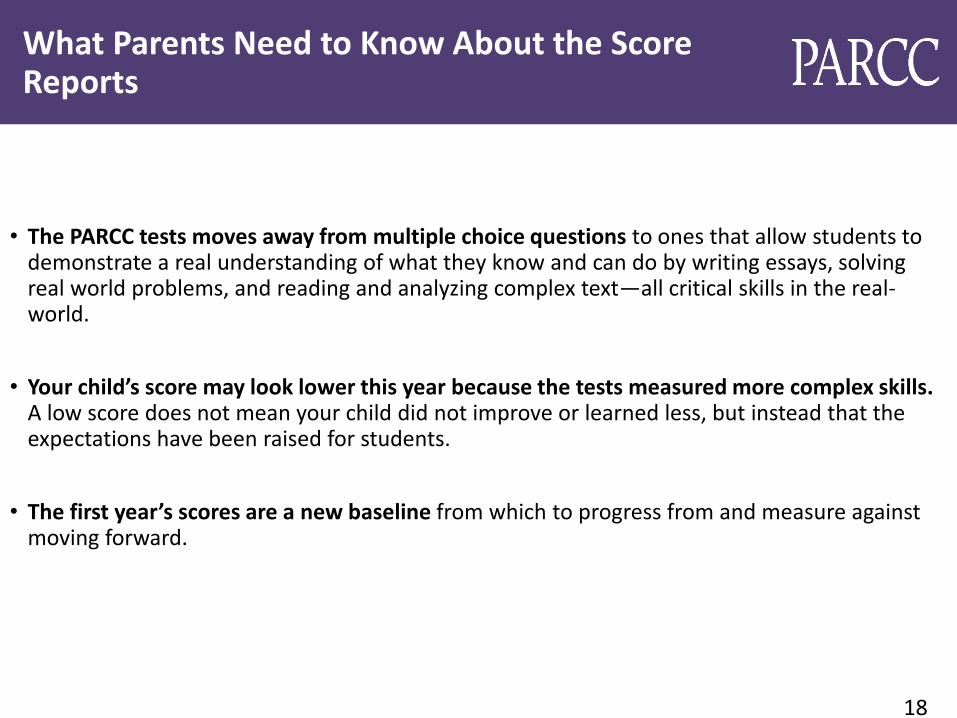
What Parents Need to Know About the Score Reports
• The PARCC tests moves away from multiple choice questions to ones that allow students to demonstrate a real understanding of what they know and can do by writing essays, solving real world problems, and reading and analyzing complex text—all critical skills in the real-world.
• Your child’s score may look lower this year because the tests measured more complex skills.A low score does not mean your child did not improve or learned less, but instead that the expectations have been raised for students.
• The first year’s scores are a new baseline from which to progress from and measure against moving forward.
18

19
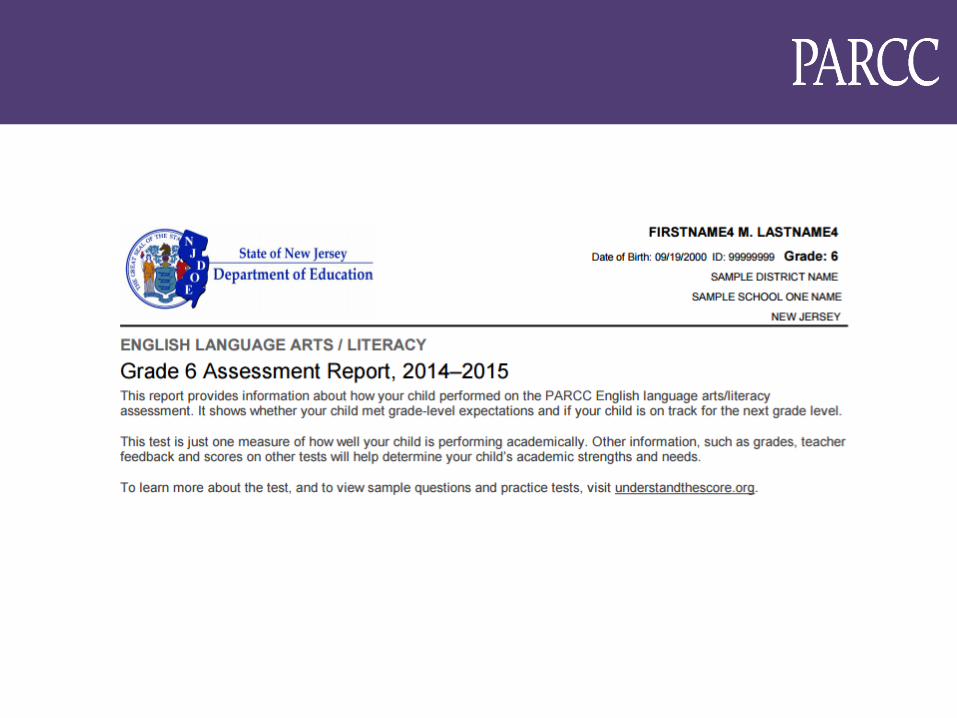
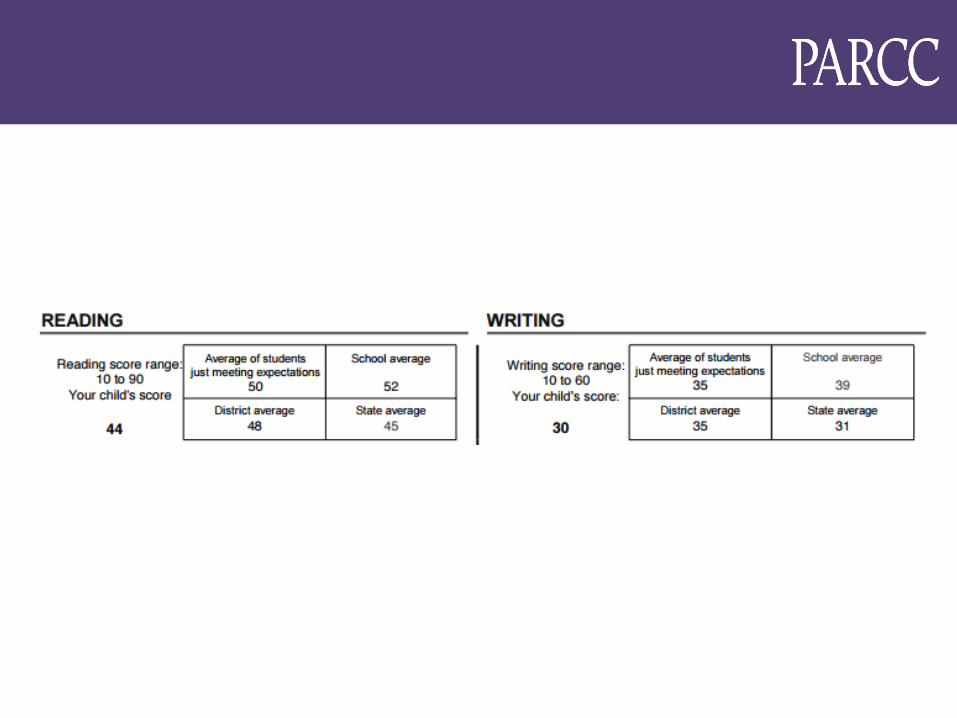
Score Reports
Five Performance Levels
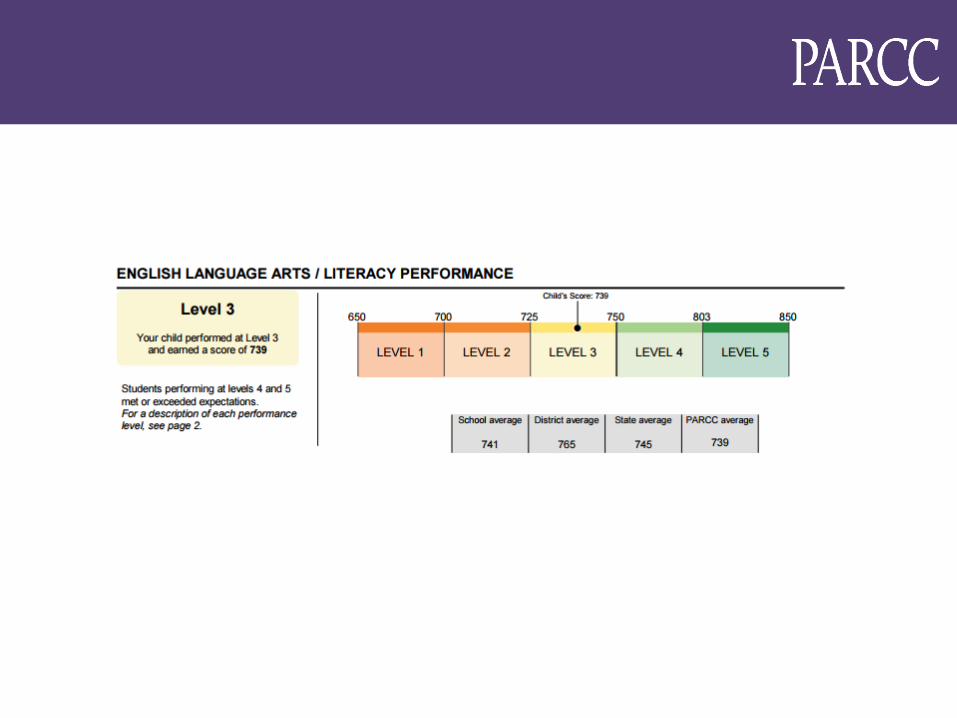
Five Performance Levels
Five Performance Levels
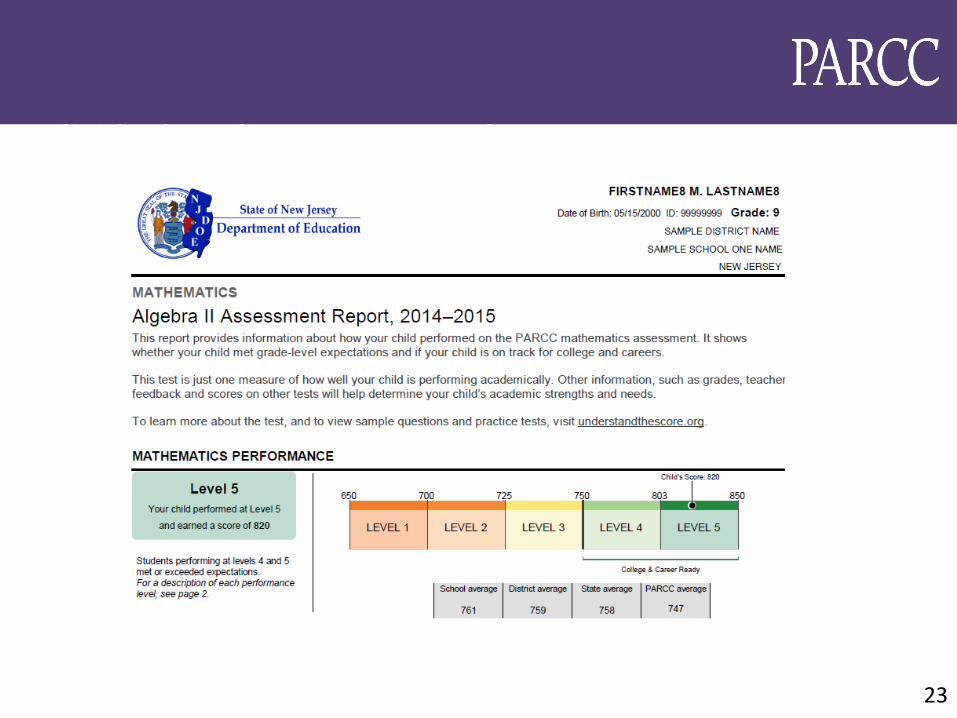
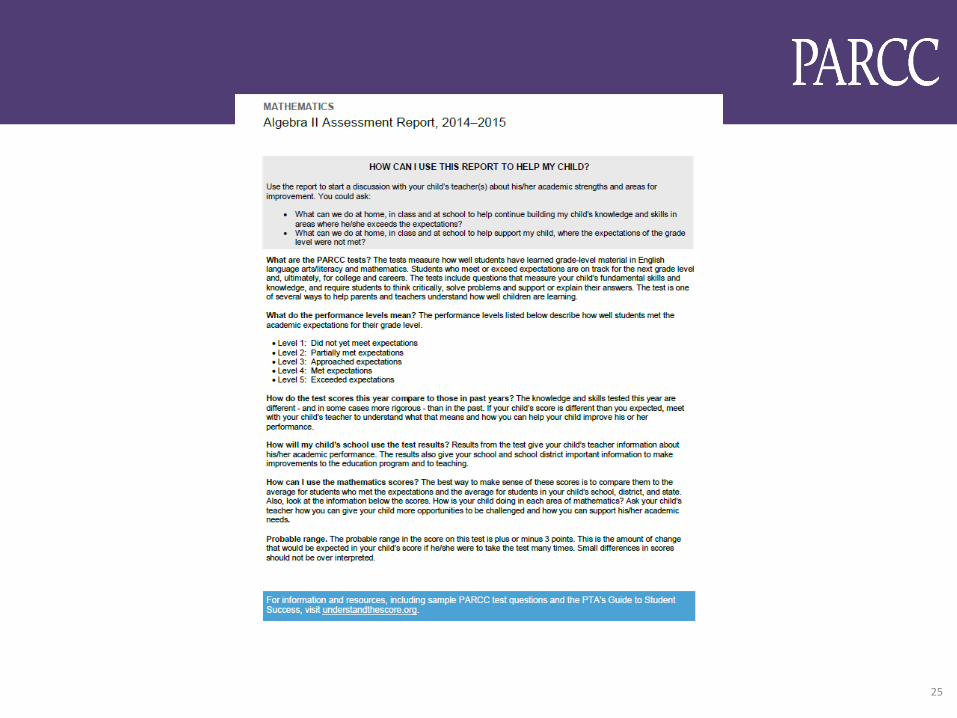
Individual Student Report: Math
23
Individual Student Report: Math

Individual Student Report: Math
24
25
Score Reports

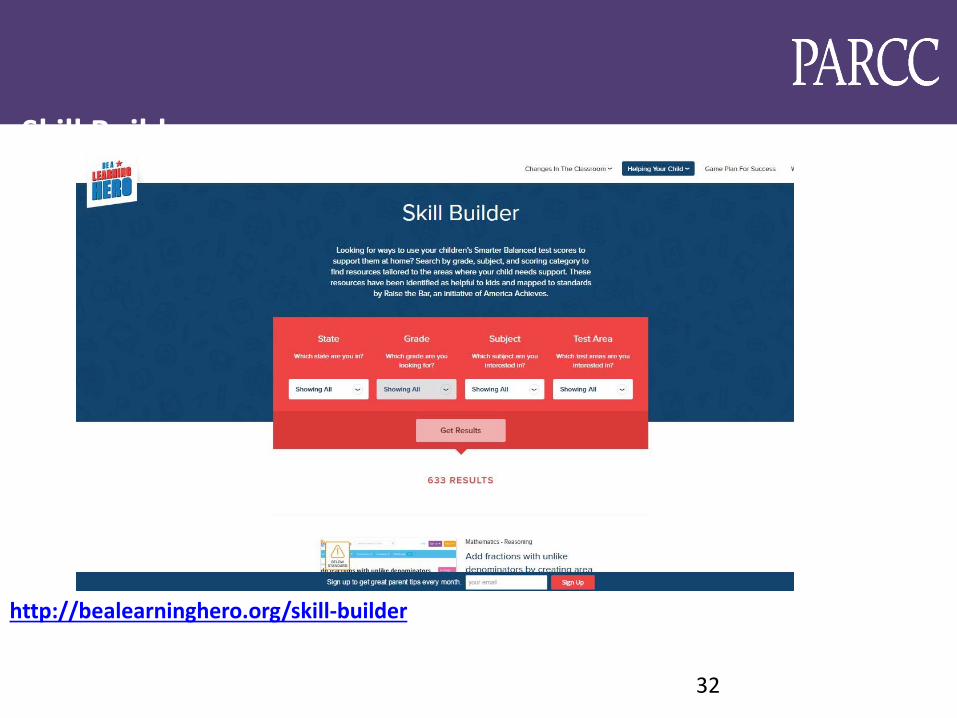
RESOURCES FOR PARENTS
http://understandthescore.org/
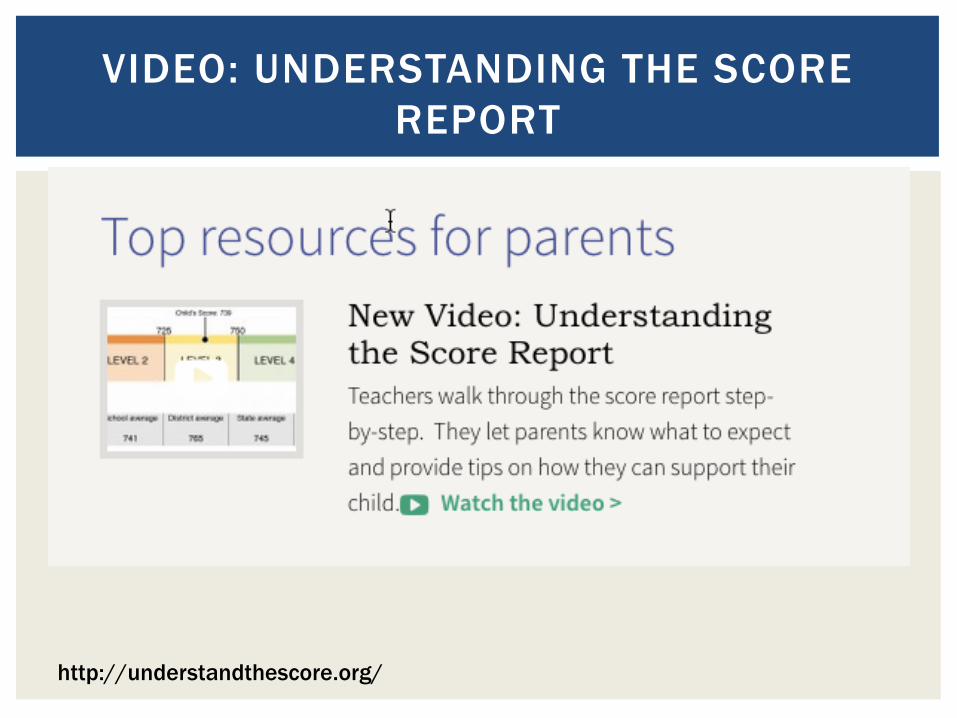
VIDEO: UNDERSTANDING THE SCORE
REPORT
http://understandthescore.org/
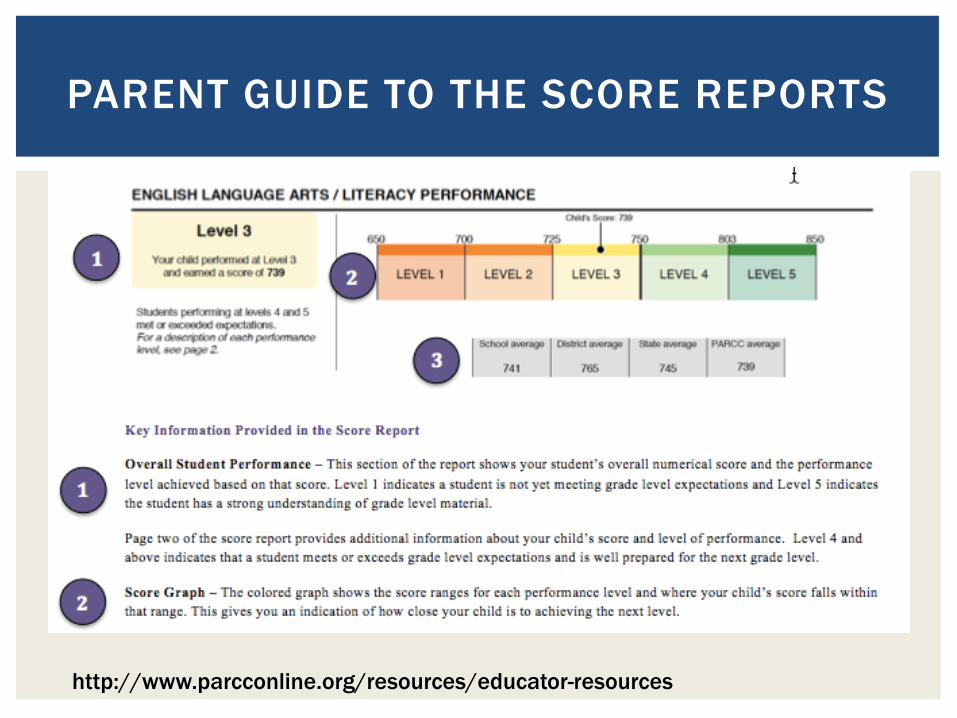
PARENT GUIDE TO THE SCORE REPORTS
http://www.parcconline.org/resources/educator-resources
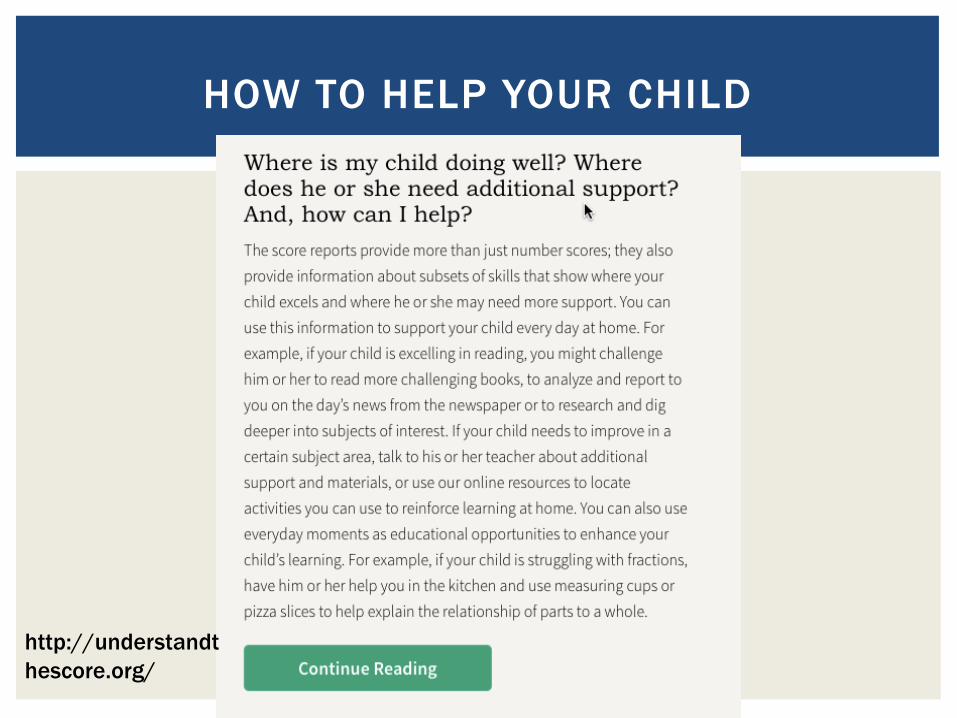
HOW TO HELP YOUR CHILD
http://understandt
hescore.org/
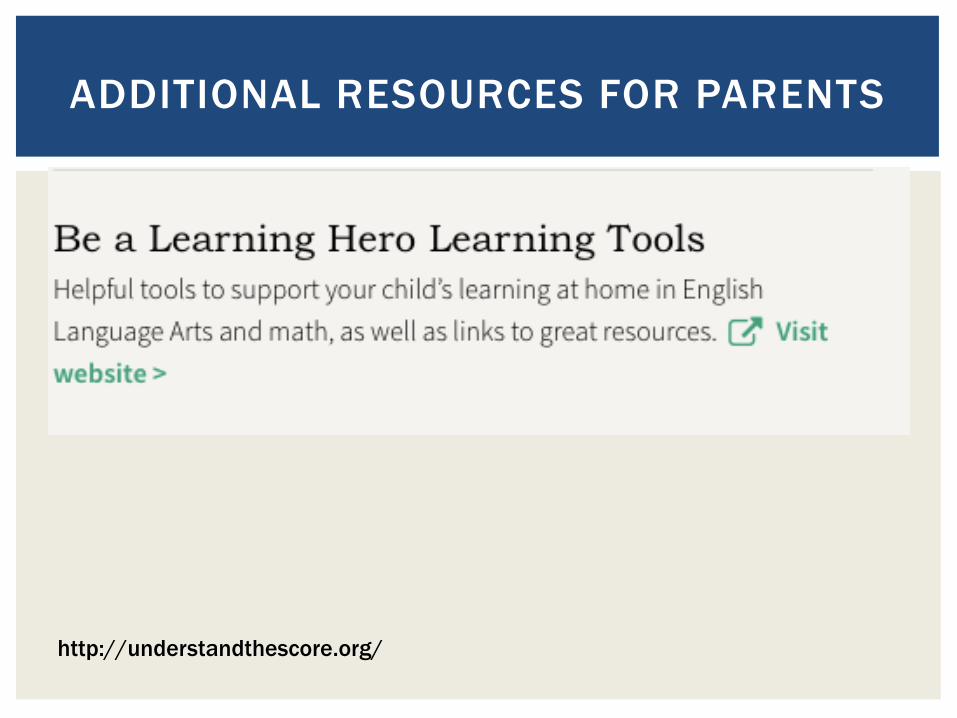
ADDITIONAL RESOURCES FOR PARENTS
http://understandthescore.org/

http://www.greatschools.org/gk/test-guide
GreatKids State Test Guide For Parents
31
Questions?
Questions?