Embed Size (px)
Citation preview

PARENT FUNCTIONS
Module 2 Lesson 4

What is a parent function?
We use the term ‘parent function’ to describe a family of graphs. The parent function gives a graph all of the unique properties and then we use transformations to move the
graph around the plane.
You have already seen this with lines. The parent function for a lines
is y = x. To move the line around the Cartesian plane, we change the
coefficient of x (the slope) and add or subtract a constant (the y
intercept), to create the family of lines, or y = mx + b.
To graph these functions, we will use a table of values to create points on the graph.
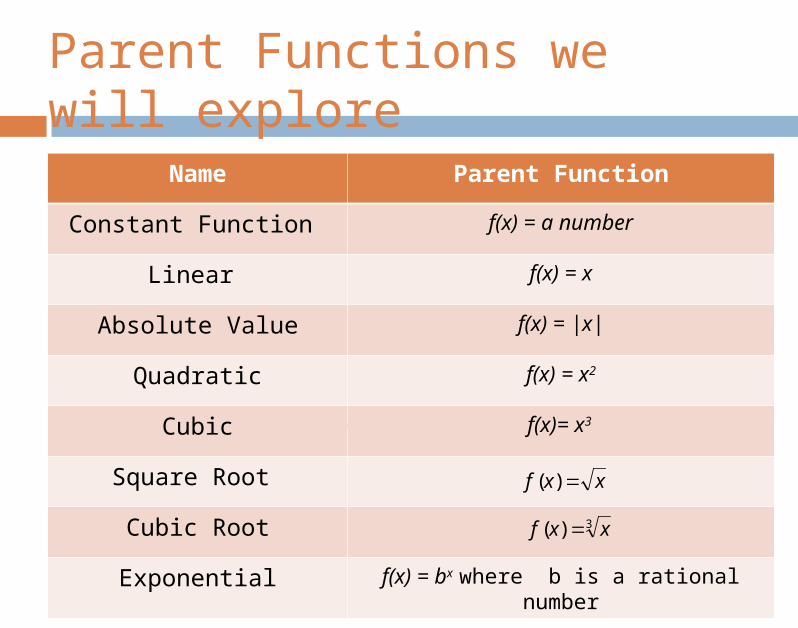
Parent Functions we will explore
xy
Name Parent Function
Constant Function f(x) = a numberLinear f(x) = x
Absolute Value f(x) = |x|Quadratic f(x) = x2
Cubic f(x)= x3 Square Root
Cubic Root
Exponential f(x) = bx where b is a rational number
3)( xxf
xxf )(

Symmetry
Many parent functions have a form of symmetry.
There are two types of symmetry: Symmetry over the y-axis Symmetry over the origin.
If a function is symmetric over the y-axis, then it is an
even function.
If a function is symmetric over the origin, then it is an odd
function.

Examples
Even Functions Odd Functions

Parent Functions Menu (must be done from
Slide Show View)
Constant Function Cubic RootLinear (Identity) ExponentialAbsolute Value
Square RootQuadratic Cubic
1) Click on this Button to View All of the Parent Functions.or
2) Click on a Specific Function Below for the Properties.
3) Use the button to return to this menu.
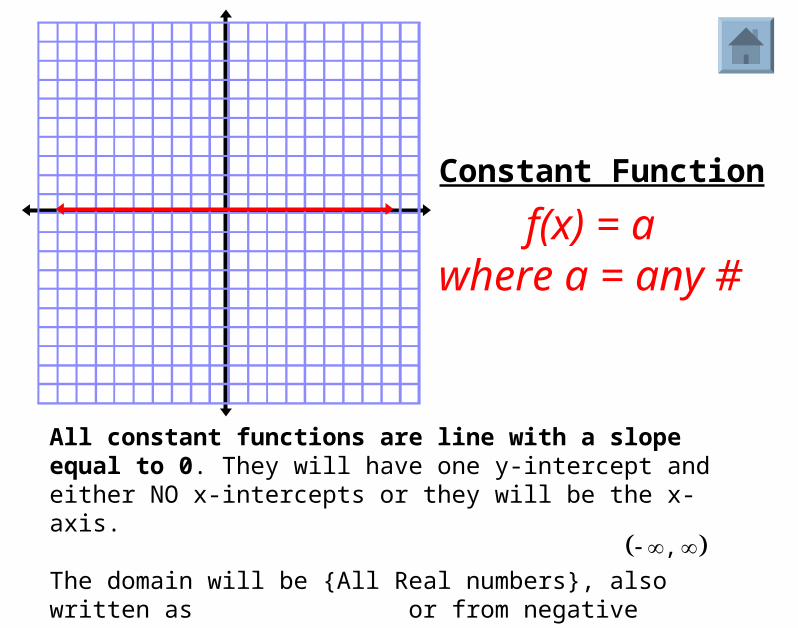
Constant Function
f(x) = awhere a = any #
All constant functions are line with a slope equal to 0. They will have one y-intercept and either NO x-intercepts or they will be the x-axis.
The domain will be {All Real numbers}, also written as or from negative infinity to positive infinity. The range will be {a}.
,
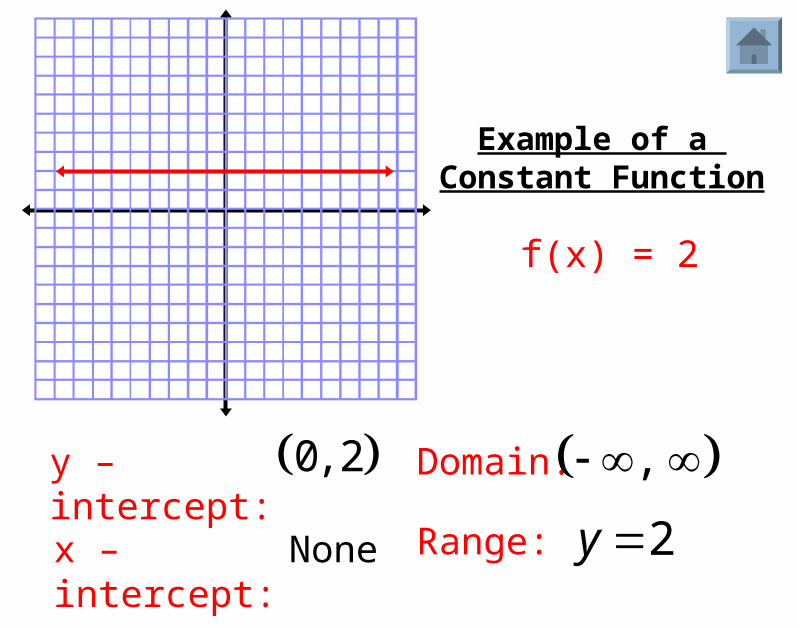
Example of a Constant Function
Domain: ,
Range: 2y
f(x) = 2
x – intercept:
y – intercept: 0, 2
None
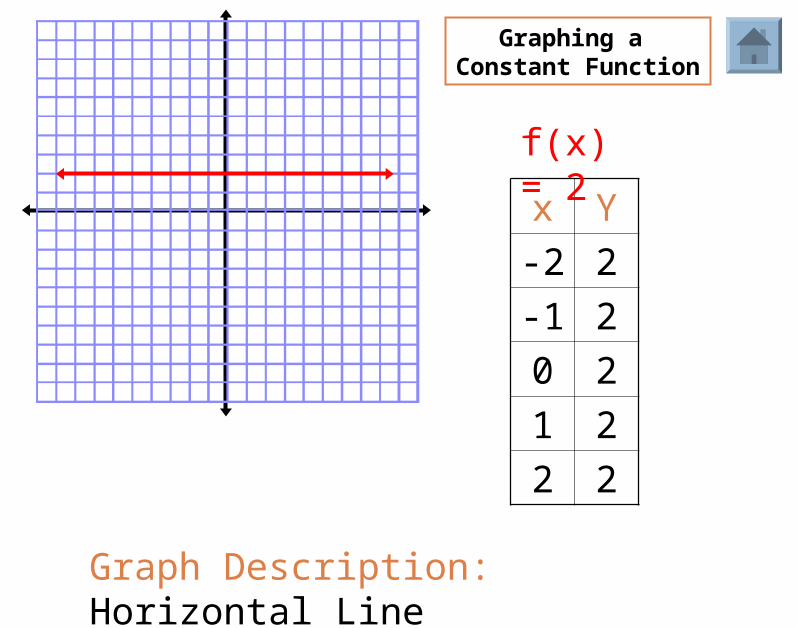
Graphing a Constant Function
Graph Description: Horizontal Line
x Y
-2 2
-1 2
0 2
1 2
2 2
f(x) = 2

Linear Function
f(x) = x
All linear functions are lines. They will have one y-intercept and one x-intercept.
The domain and range will be {All Real numbers}, or . ,

Example of a Linear Function
,
f(x) = x + 1
Domain: ,
Range: x – intercept:
y – intercept:
(-1, 0)
(0, 1)
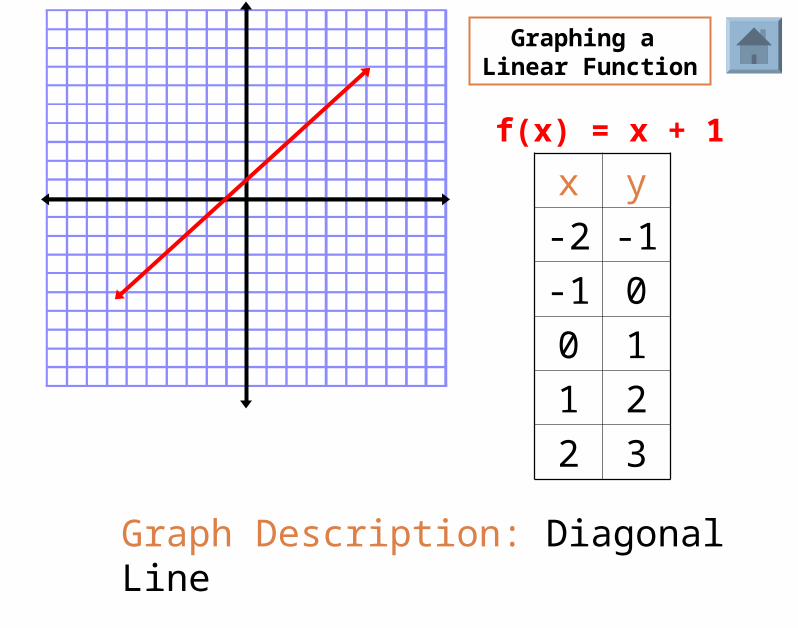
x y
-2 -1
-1 0
0 1
1 2
2 3
Graph Description: Diagonal Line
f(x) = x + 1
Graphing a Linear Function
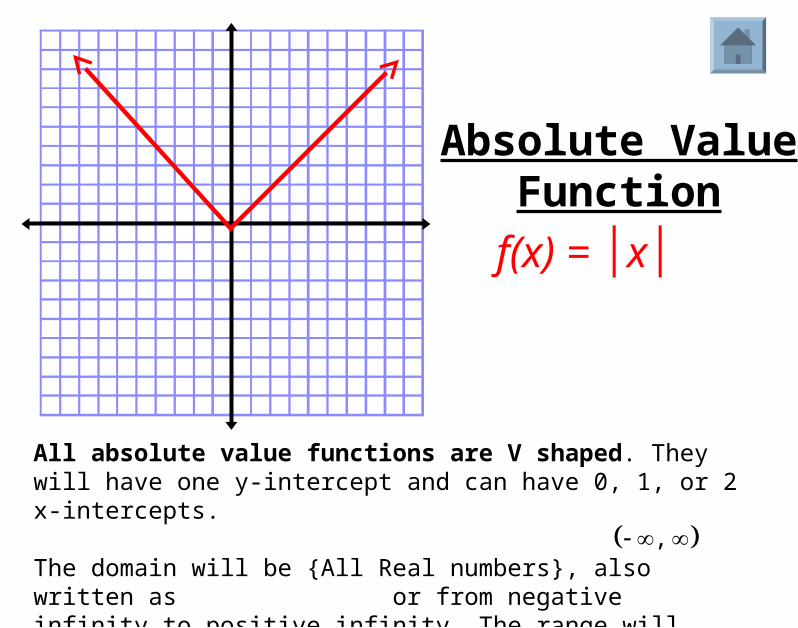
Absolute Value Function
f(x) = │x│
All absolute value functions are V shaped. They will have one y-intercept and can have 0, 1, or 2 x-intercepts.
The domain will be {All Real numbers}, also written as or from negative infinity to positive infinity. The range will begin at the vertex and then go to positive infinity or negative infinity.
,

Example of anAbsolute Value
Function
f(x) = │x +1│-1
Domain: ,
Range: x – intercepts: (0, 0) & (-2, 0)
y – intercept: 0, 0
),1[

x y
-2 -2
-1 -1
0 0
1 1
2 2
Graph Description: “V” - shaped
f(x) = │x+1 │-1
Graphing an Absolute Value
Function

f(x) = x 2
Quadratic Function
All quadratic functions are U shaped. They will have one y-intercept and can have 0, 1, or 2 x-intercepts.
The domain will be {All Real numbers}, also written as or from negative infinity to positive infinity. The range will begin at the vertex and then go to positive infinity or negative infinity.
,

f(x) = x 2 -1
Example of a Quadratic Function
Domain: ,
Range: ),1[ x – intercepts: (-1,0) & (1, 0)
y – intercept: (0, -1)
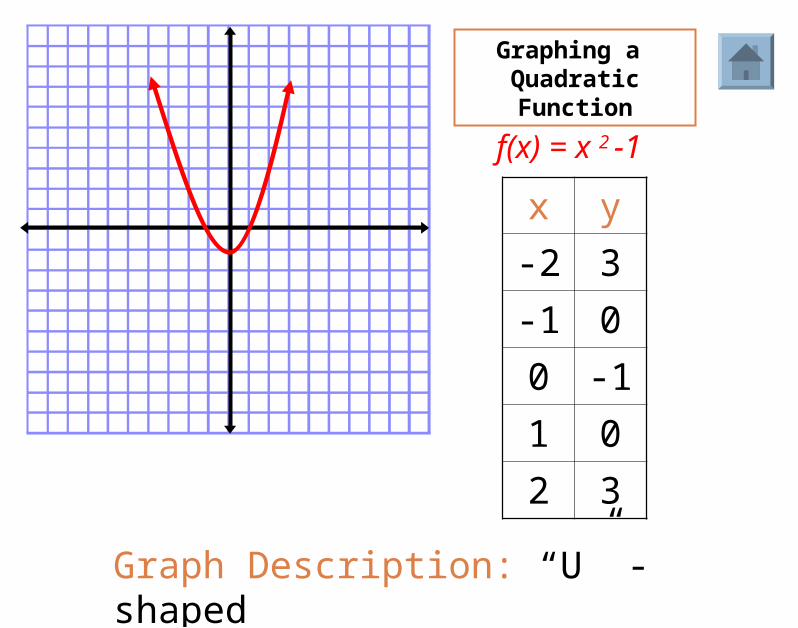
f(x) = x 2 -1
x y
-2 3
-1 0
0 -1
1 0
2 3
Graph Description: “U” - shaped
Graphing a Quadratic Function

Cubic Function
f(x) = x 3
All cubic functions are S shaped. They will have one y-intercept and can have 0, 1, 2, or 3 x-intercepts.
The domain and range will be {All Real numbers}, or . ,
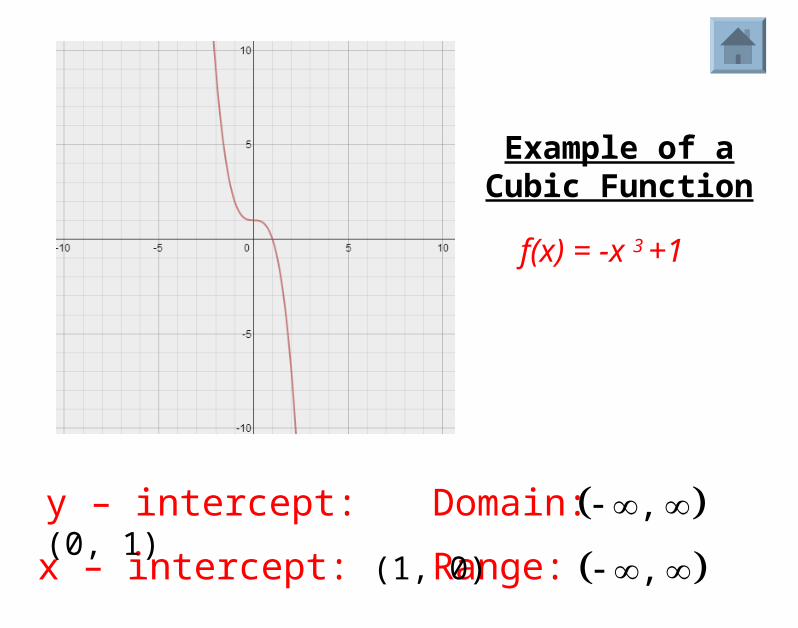
Example of aCubic Function
f(x) = -x 3 +1
Domain: ,
Range: x – intercept: (1, 0)
y – intercept: (0, 1)
,
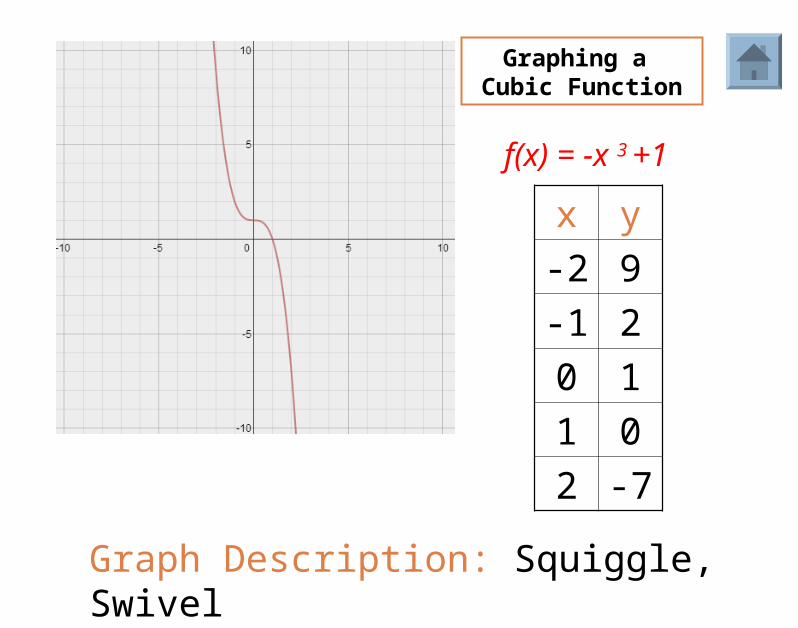
x y
-2 9
-1 2
0 1
1 0
2 -7
Graph Description: Squiggle, Swivel
f(x) = -x 3 +1
Graphing a Cubic Function
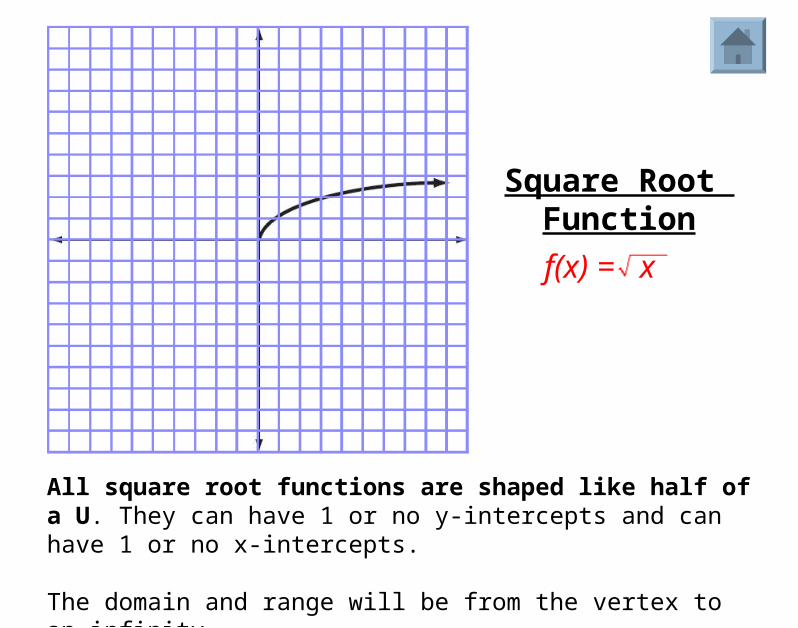
f(x) = x
Square Root Function
All square root functions are shaped like half of a U. They can have 1 or no y-intercepts and can have 1 or no x-intercepts.
The domain and range will be from the vertex to an infinity. .
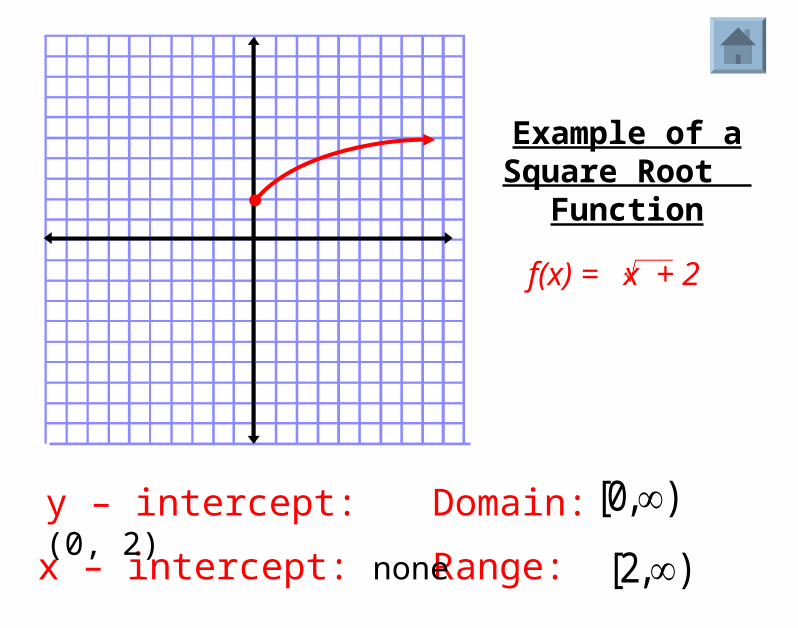
f(x) = x + 2
Example of aSquare Root
Function
Domain:
Range: x – intercept: none
y – intercept: (0, 2) ),0[
),2[

x y
0 2
1 3
4 4
9 5
16 6
Graph Description: Horizontal ½ of a Parabola
f(x) = x + 2
Graphing a Square Root
Function

Cubic Root Function
3)( xxf
All cubic functions are S shaped. They will have 1, 2, or 3 y-intercepts and can have 1 x-intercept.
The domain and range will be {All Real numbers}, or . ,
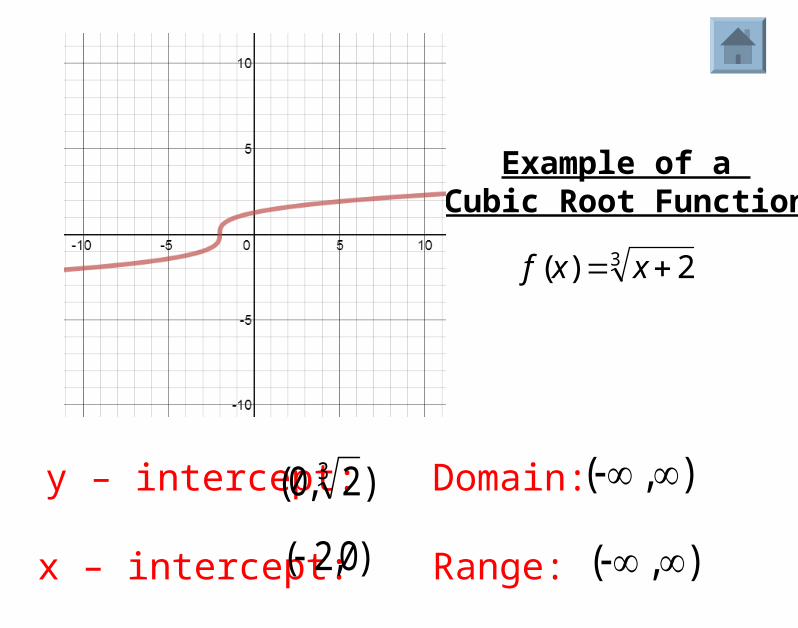
Example of a Cubic Root Function
3 2)( xxf
Domain:
Range: x – intercept:
y – intercept: ),(
),(
)2,0( 3
)0,2(

x y
-2 0
0 1.26
1 1
6 2
Graph Description: S shaped
3 2)( xxf
Graphing a Cubic Root
Function
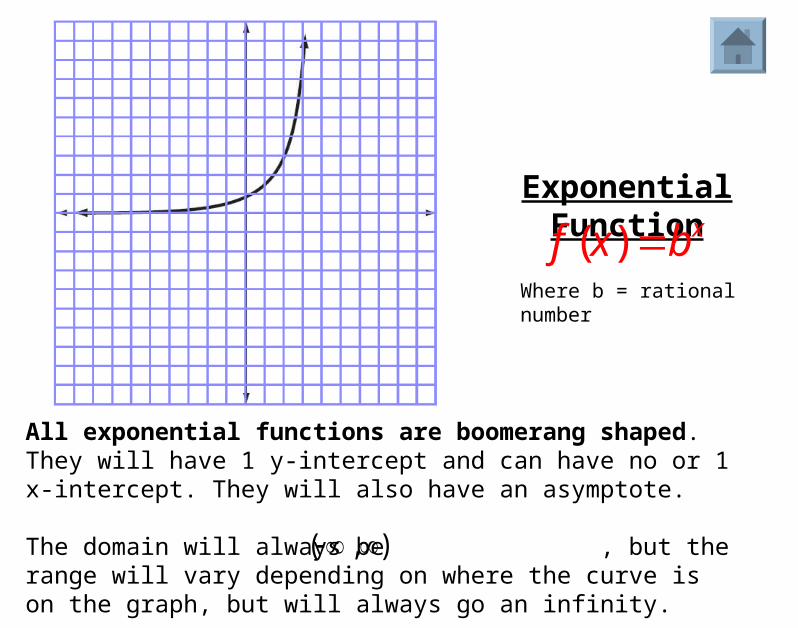
Exponential Function
( ) xf x bWhere b = rational number
All exponential functions are boomerang shaped. They will have 1 y-intercept and can have no or 1 x-intercept. They will also have an asymptote.
The domain will always be , but the range will vary depending on where the curve is on the graph, but will always go an infinity.
),(
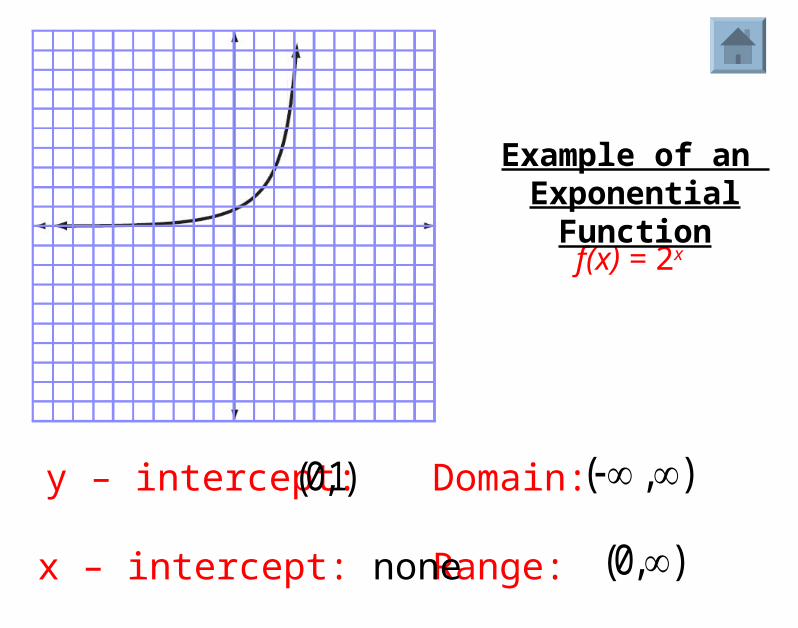
f(x) = 2x
Example of an Exponential Function
Domain:
Range: x – intercept: none
y – intercept: ),(
),0(
)1,0(

f(x) = 2x
x y
-2 0.25
-1 0.5
0 1
1 2
2 4
Graph Description: Backwards “L” Curves
Graphing an Exponential
Function